 Rui Yu
95% of researchers rate our articles as excellent or good
Learn more about the work of our research integrity team to safeguard the quality of each article we publish.
Find out more
ORIGINAL RESEARCH article
Front. Environ. Sci. , 04 January 2023
Sec. Environmental Informatics and Remote Sensing
Volume 10 - 2022 | https://doi.org/10.3389/fenvs.2022.1111223
This article is part of the Research Topic Air Quality: Observation, Remote Sensing, and Model Development View all 5 articles
Fine particulate matter (PM2.5) pollution is a key issue affecting the health of urban residents. To explore the impact of urban building form on PM2.5 pollution, this study focused on Wuhan, a Chinese megacity. Based on the urban building data, various building form indices were first calculated in grids to quantitatively present the spatial distribution of urban buildings. The city-scale PM2.5 distribution was obtained with satellite remote sensing and ground air pollution monitoring data. The impact of urban building forms on PM2.5 pollution distribution was then analyzed. The results show that the changes in PM2.5 concentration in Wuhan in the north–south direction have a relatively obvious correlation with the windward area ratio of buildings. The dense north–south buildings can slow the spread of near-surface particulate pollution. This finding demonstrates that the building blocking effect of PM2.5 diffusion in Wuhan is significant. The results of this study can provide a reference for urban planning, architectural design, and air pollution control strategies.
As urbanization accelerates, environmental pollution is becoming increasingly severe. The density of urban populations has increased, and various fuel emissions have increased sharply, resulting in the further deterioration of urban air quality. PM2.5 pollution reduces atmospheric visibility and has an impact on regional climate, and has a negative impact on public physical and mental health (Feng et al., 2016; Lu et al., 2019; Yin, 2022). In 2020, 135 of the 337 cities in China had air quality that exceeded the air quality standard limits, accounting for 40.1% of the total. The number of days with PM2.5 as the predominant pollutant accounted for 50.1% of the total number of days above the standard (Zhang et al., 2020; Fang et al., 2021). North and central China have the greatest PM2.5 concentrations in the world, with concentrations approaching 80 μg/m3 (van Donkelaar et al., 2010). PM2.5 pollution has become a major environmental problem affecting economic development and livelihoods.
In cities, the building form, including the building density, building height, and other factors, affect air flow, thereby affecting pollution diffusion (Mansfield et al., 2015; Liu et al., 2018; Zhou et al., 2018; Meichang and Bingbing, 2020). Therefore, improving the urban building form during construction is critical to promoting the diffusion of urban air pollutants. However, because urban construction is an irreversible process, urban planning and architectural design must be more forward-looking. It is not only necessary to meet human requirements for architectural functions and forms, but it is also necessary to consider the impact of architectural forms on urban air quality during urban planning and design (Diener and Mudu, 2021).
Currently, research on the impact of urban building forms on particulate air pollution distribution is mostly conducted on three scales: city scale, block scale, and building scale. Tang et al. found that PM2.5 particle pollution concentrations were strongly positively connected with building area and significantly adversely correlated with green space or forest area at the city scale (Liu and Yu, 2016; Meo et al., 2021). Using meteorological measuring methods, some scholars have concluded that there is a considerable association between urban construction density and plot ratio with windward area. Because city planners can minimize the windward area density by controlling the plot ratio and building density, urban pollution waste gas is expelled with the wind (Bustamante et al., 2011; Mei et al., 2018). Researchers have concluded that various planning and design strategies, such as the creation of ventilation ducts, can improve urban air quality in high-density core metropolitan areas (Fensterstock et al., 1971; Affum et al., 2003; Diener and Mudu, 2021). Specifically, it is to reasonable to construct urban air ducts by control building density, spacing, height, and size to improve air quality (Ravindra et al., 2019; Bai et al., 2022). However, at the block scale, the green coverage rate, road area rate, and relative elevation of measurement points were the main factors affecting the changes of PM10 and PM2.5 concentrations. At the block scale, research on the impact of urban street valley shape on air quality is relatively considerable. According to several researchers, the effect of pollution diffusion in urban street valleys is highly dependent on the shape of buildings in street valleys, i.e., the geometric structure of streets (Kam et al., 2013; Shi et al., 2016). The pollutant diffusion capacity in street valleys can be adjusted based on the sky visibility coefficient, the height-width ratio, and the length-to-height ratio of the street valley. The construction of buildings with consistent heights along a street should be avoided in urban planning. Wang et al. imported data in Fluent software for fluid mechanics condition setting and iterative operation by using the CDF numerical simulation approach. They concluded that the pollution near the ground in the street valley was quite serious due to the closed spaces on the ground floor below 10 m in the central urban area, and the longer the continuous interface of the buildings facing the street, the more serious the pollution (Li et al., 2021; Ren et al., 2021). Breaking up the continuous interfaces of street valleys in urban commercial centers can improve the diffusion of particulate pollution by adjusting the height of buildings on both sides of the street, the differences in building shape and density, and the combination of podium floor and high-rise buildings (Shi et al., 2016). Under the same meteorological conditions, some researchers conducted measurements at a height of 1.5 m above the ground on the block scale. The researchers discovered that, under identical green rate conditions, the building’s height and layout had a significant impact on the PM2.5 concentration. When compared to the contiguous pattern of large-scale structures, the scattered layout of small-scale buildings frequently includes more gaps, which enables pollution particles to diffuse (Yuan et al., 2014).
Currently, the impact of urban building form on the distribution of particulate air pollution has been studied at various scales both in China and abroad, providing a solid foundation for urban planning and design strategies for PM2.5 air pollution. Data from ground-based atmospheric monitoring stations were used in all of the studies above to obtain the characteristics and sources of regional and urban atmospheric PM2.5 pollution. However, ground-based monitoring stations have a high construction cost, a small number, an uneven distribution, and limited coverage. In addition, it is difficult to quantify the complex and dynamic architectural shapes at the fine scale. All of these factors restrict the study of the correlation between the shape of urban buildings and the distribution of PM2.5 concentrations. As a result, it has been difficult to clarify the impact of urban building forms on PM2.5 pollution, which complicates urban air pollution prevention and control.
To conduct comprehensive research on the impact of urban building forms on PM2.5 concentrations, PM2.5 distribution data that seamlessly cover the entire city must be obtained. As satellite remote sensing technology advances, related methodologies are increasingly being applied in urban environment research (Crosbie et al., 2014; Braggio et al., 2020). Therefore, based on the urban building outline data, this study calculated a grid (5 km2) of various building form indices to quantitatively express urban building forms. The PM2.5 monitoring data used in this study seamlessly covers urban areas and is generated by combining satellite remote sensing and ground air pollution monitoring data, as well as integrating other meteorological parameters. This research analyzes the impact of urban building form on PM2.5 distribution, with the goal of providing guidance for urban planning, architectural design, and air pollution control.
This study focused on Wuhan, a metropolis in central China with a major PM2.5 pollution problem and typical metropolitan characteristics. Wuhan is an important industrial base and transportation center in central China, located in the east of Jianghan Plain, at the confluence of the Yangtze River and the Han River. Wuhan has a north subtropical monsoon climate with frequent rain throughout the year and four distinct seasons. PM2.5 was determined to be the predominant pollutant for 86 days of the year in the Wuhan urban area in 2020, accounting for 32.3% of days in the year (http://hbj.wuhan.gov.cn/fbjd_19/xxgkml/zwgk/hjjc/hjzkgb/). Wuhan was ranked 87th out of 168 cities in the country in terms of monthly average PM2.5 concentrations in November 2021. Wuhan’s built-up area was 812.39 km2 as of 2019, ranking 10th in China (https://www.mohurd.gov.cn/gongkai/fdzdgknr/sjfb/tjxx/index.html).
The building data in this article are in vector format, and include information on the shape, height, and position of surface buildings in the Wuhan urban region. Figure 1 depicts the regional building distribution. The data were obtained from the network data sharing platform (https://udparty.com), and were collected in the fourth quarter of 2018. To facilitate the calculation of architectural form factors, the experimental scope was limited to the area with relatively concentrated buildings, mainly within the second ring road of Wuhan. For the convenience of subsequent calculations with PM2.5 data in raster format, the building data was converted to raster with the “Conversion Tools” from ArcGIS.
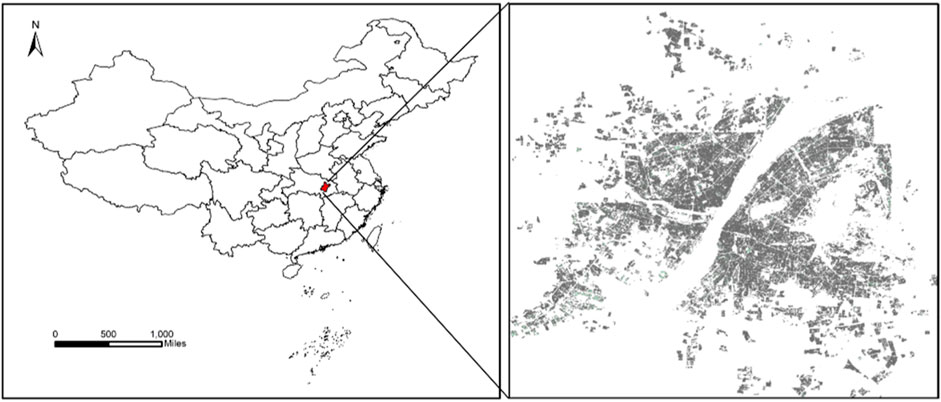
FIGURE 1. Building distribution of Wuhan.
The PM2.5 monitoring data used in this study were obtained from the national urban air quality real-time release platform of the China Environmental Monitoring Station (https://air.cnemc.cn:18007/). There are 10 state-controlled air quality automatic monitoring stations in Wuhan, and the monitoring frequency is once per hour. To correspond to the building outline data, this paper selected the air quality monitoring data for the whole year of 2018.
Himawari-8 is a Japanese weather satellite operated by the Japan Meteorological Agency. The primary instrument Advanced Himawari Imager (AHI) has 16 multispectral channels and an observation frequency of 10 min (Yumimoto et al., 2019). The satellite is designed for disaster prevention monitoring, monitoring features such as storm clouds, typhoon trends, and continuously erupting volcanoes. In this study, the 5 km, Level 1B, full-disk calibrated reflectance products were obtained from the Japan Aerospace Exploration Agency website. Band 1, band 6, and four observation angles were selected as part of the input data. The cloud-contaminated region of the Top of Atmosphere (TOA) reflectance data were removed with the reference of level 2 cloud products.
In this study, the Goddard Earth Observing System Data Assimilation System GEOS-5 Forward Processing (GEOS 5-FP) meteorological data were introduced. The PM2.5 concentration related factors such as the planetary boundary layer height (PBLH), surface pressure (PS), and relative humidity (RH), the temperature at 2 m (TEMP) and the wind speed components at 10 m (WS) were selected. All the meteorological data were resampled to 5 km resolution to match the resolution of satellite data with the bilinear interpolation method.
This paper intends to conduct from three aspects: the extraction of building forms in Wuhan, the inversion of PM2.5 concentration in Wuhan, and the correlation analysis between them above. The overall technical flowchart is shown in Figure 2.
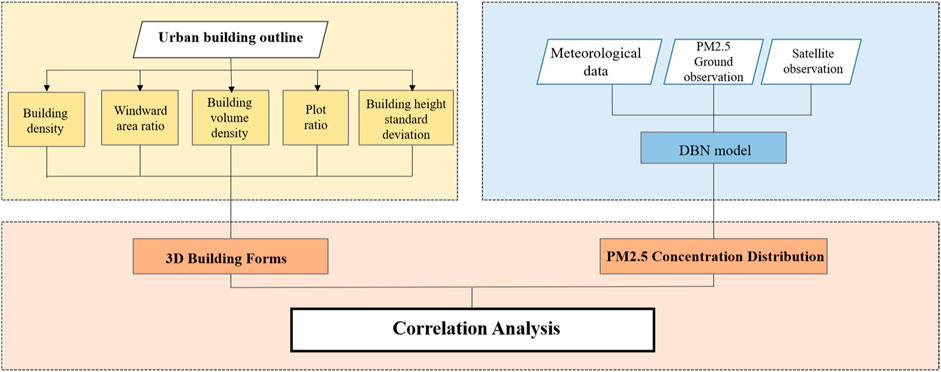
FIGURE 2. Technical flowchart.
Windward area ratio: The windward area ratio is the ratio of the front windward area of the building to the plot acreage. The windward area represents the total area of the windward surface blocked by the front of the building in the direction of incoming wind. The calculation method is as follows:
In the formula,
Building volume density: The building volume density is the numerical value of the total building volume divided by the volume value, which multiplies the height of the tallest building in the plot by the plot area. This value reflects the spatial density of the buildings in the plot. The calculation method is as follows:
In the formula, VB stands for building volume density, Si stands for the bottom acreage of the ith building, Hi stands for the ith building’s height, S0 stands for the area of the plot, and Hmax stands for the height of the tallest building.
Building density: The building density is the ratio of the total area of the building base in the plot to the total occupied area. The calculation method is as follows:
In the formula, DB stands for the building density in the plot, SA stands for the total area of the building base in the plot, and S0 stands for the area of total occupied plot.
Plot ratio: The plot ratio is the ratio of the gross floor area of the building on land to the net land area. The calculation method is as follows:
In the formula, Ra represents the plot ratio, SF represents the gross floor area of the building on land, and SL represents the net land area.
Building height standard deviation: The building height standard deviation is the standard deviation of all building height values in the plot and reflects the level of dispersion of the data. It also reflects the degree of difference and the staggering of building heights in the vertical direction of the plot. The calculation method is as follows:
In the formula, S represents the building height standard deviation, N represents the number of buildings in the plot,
In recent years, deep learning based methods have been widely used to estimate PM2.5 concentrations with ground and satellite observations (Meng et al., 2021; Sun et al., 2021; Xu et al., 2021). In this study, the Deep Belief Net (DBN) model was employed to model the complex factors and relationships between the urban PM2.5 concentration, satellite observations and meteorological data. The DBN model is a kind of Deep Neural Network, and it is composed of multiple restricted Boltzmann machine (RBM) layers and a back-propagation (BP) layer. An RBM is a generative stochastic artificial neural network that can learn a probability distribution over the input data. It is composed of two layers connected by weights. The first is a visible layer and the second is a hidden layer. The hidden layer of the previous RBM is the visible layer of the next RBM. In the experiment, two RBM layers and one BP layer were selected to estimate the ground PM2.5 concentration. The PM2.5 estimation model can be presented by
where
The PM2.5 concentration annual average value of Wuhan central city in 2018 was obtained through performing inversion according to the above method. The estimated values were also validated by the measurements of ground stations. The RMSE is 6.524 μg/m3, which indicate that the employed estimation method is acceptable. As shown in Figure 3, the distribution of the PM2.5 concentration in Wuhan showed an overall trend of high in the north and low in the south. Qingshan District and Dongxihu District had obvious high-value PM2.5 distribution. Even the number of buildings is not much, these two areas are mainly industrial agglomeration areas, which are more likely to produce particulate pollution due to various factors such as industrial production, transportation, and ground dust. These findings show that the overall PM2.5 pollution in Wuhan is significantly affected by industrial-related emissions. However, there are obvious low-value distribution areas along the Yangtze River and the areas near East Lake and South Lake. These areas are less affected by emissions from human activities, and it is easier for air pollutants to diffuse due to the open terrain and the lack of buildings.
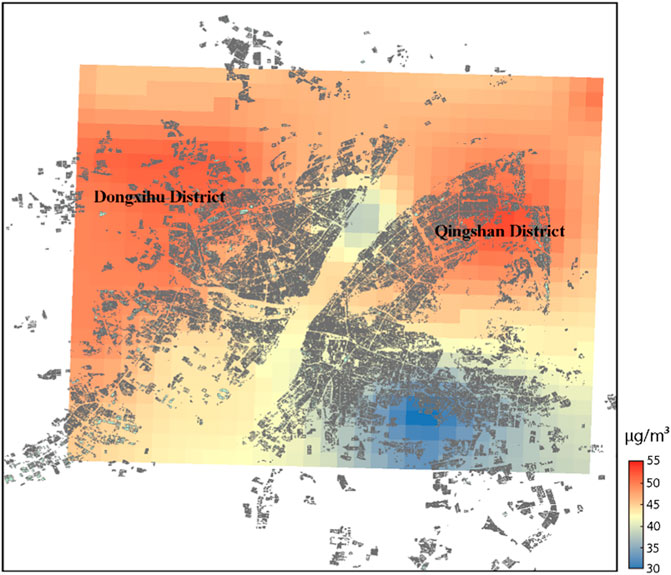
FIGURE 3. Fine particulate matter (PM2.5) concentration distribution of 2018 in downtown Wuhan.
The calculation results of each building form index are shown in Figure 4. Figure 4A shows the distribution of building volume density in Wuhan, revealing that the overall volume density distribution in Wuhan is relatively evenly, and only some areas in Hanyang District have higher volume density values. Because the buildings in these areas are densely distributed and their heights are relatively similar, the distribution characteristics of such buildings are less correlated with the diffusion of air pollutants, so they have no reference value. Figure 4B shows the distribution of building density. The closer to the city center, the higher the building density. On the contrary, the closer to the city edge, the lower the building density value. This distribution is consistent with common knowledge. The areas with lower building density in the south of Wuhan are far from emission sources, and their relatively open surfaces are more conducive to the diffusion of atmospheric pollutants, resulting in relatively lower PM2.5 concentrations. However, the same factors were considered in the siting of high-emission industrial areas. This also makes the air particulate pollution in the north easier to diffuse. The densely built area in the middle of the city has become a buffer zone to a certain extent, absorbing and blocking the spread of near-surface particles. Figure 4C shows the plot ratio distribution. The spatial distribution pattern is basically consistent with the building density, and these two architectural form indices also indicated a similar situation. Figure 4D shows the distribution of the standard deviation of building heights. The standard deviation of building heights showed that most areas with large building standard deviations had lower PM2.5 concentrations. This is because areas with large building standard deviations are usually located on the banks of rivers and lakes, which not only have lower building density, but are also more conducive to the diffusion of air pollutants. Figures 4E, F shows the windward area ratios in the north–south and east–west directions, respectively. Among them, the high windward area ratio values mostly appeared in areas with more significant PM2.5 concentration changes. It can be speculated that when the windward area of a building is relatively large, the diffusion of PM2.5 is affected to a certain extent.
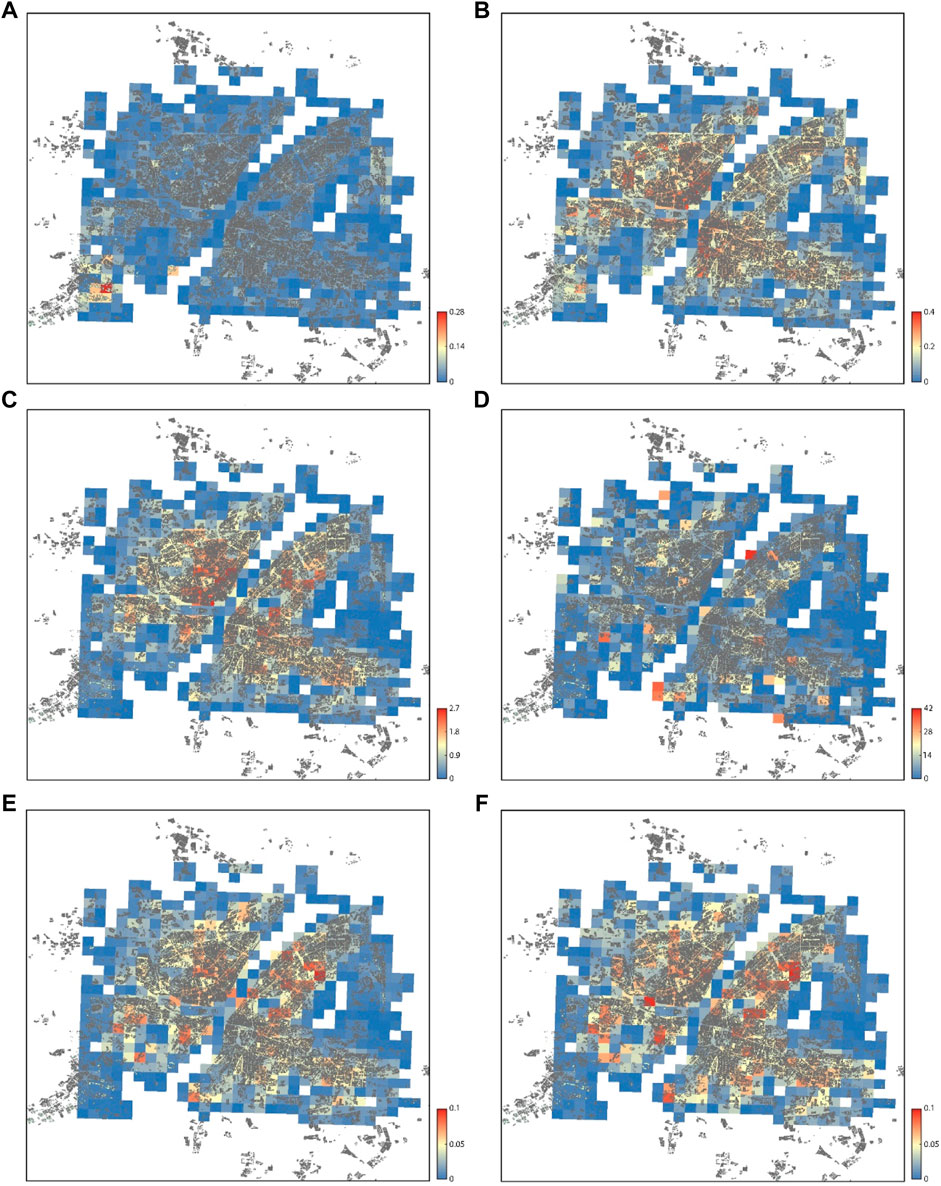
FIGURE 4. Building form indices of Wuhan: (A) building volume density, (B) building density, (C) plot ratio, (D) standard deviation of building heights, (E) windward area ratios in the north–south and (F) east–west directions.
The influence of building form on the diffusion of air pollution in Wuhan was further analyzed. Figure 5 shows the correlation between the building form indices and PM2.5 concentration. Considering the windward area ratio is in different directions, the change of PM2.5 concentration in corresponding directions is used instead of PM2.5 concentration. The change of PM2.5 concentration is calculated by PM2.5 concentration value of each grid minus the corresponding value in corresponding direction, and then take the absolute value. In Figures 5A–D, the correlation coefficients are 0.056, 0.018, −0.061 and −0.158 respectively, and the p values are all larger than 0.05. It can be found that the four building form indices are not significantly correlated with PM2.5 concentration. As can be seen from Figure 5E, the correlation between the change of PM2.5 concentration in the east–west direction and the windward area ratio of buildings in Wuhan was not significant. The overall distribution was relatively uniform, and the correlation coefficient was 0.276, and p-value less than 0.001. As shown in Figure 5F, the change of PM2.5 concentration in Wuhan in the north–south direction had an obvious correlation with the windward area ratio of the building, and the correlation coefficient reached 0.483 and the p-value less than 0.001. This phenomenon reveals that the diffusion of PM2.5 concentrations in Wuhan is more significantly affected by the blocking effect of buildings. High-density north–south buildings can slow the spread of near-surface particulate pollution. These conclusions provide a reference for subsequent architectural planning.
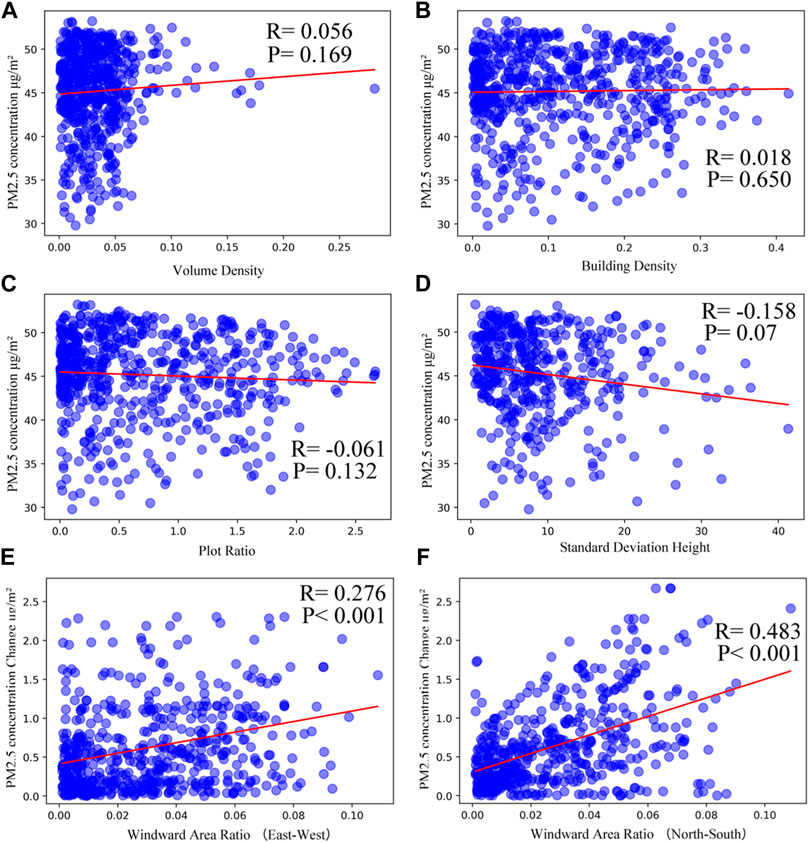
FIGURE 5. (A) building volume density, (B) building density, (C) plot ratio, (D) standard deviation of building heights, (E) windward area ratios in the east–west and (F)north–south directions.
To further explore the blocking effect of buildings in different seasons, the correlation coefficients between fine particulate matter concentration change and windward area ratio are calculated. As shown in Figures 6A–D, the correlation coefficients between fine particulate matter concentration and east-west windward area ratio are 0.164, 0.118, 0.188 and 0.184 respectively. It means that the blocking effect of buildings in east-west direction is not significant. However, the blocking effect is still slightly better in autumn than other seasons. Meanwhile, as shown in Figures 6E–H, the correlation coefficients are 0.494, 0.452, 0.497 and 0.437 respectively, and the p values are all less than 0.001. It is indicated that the building form is in favor of the diffusion of air pollutants in spring and autumn. It can also be found that the fine particulate matter concentration change is less related with windward area ratio in winter. It may because that the main wind direction in winter of Wuhan is north wind, while the steel factories and chemical factories are mostly located in northern Wuhan. The combined effect of weather and location makes the impact of building forms less significant.
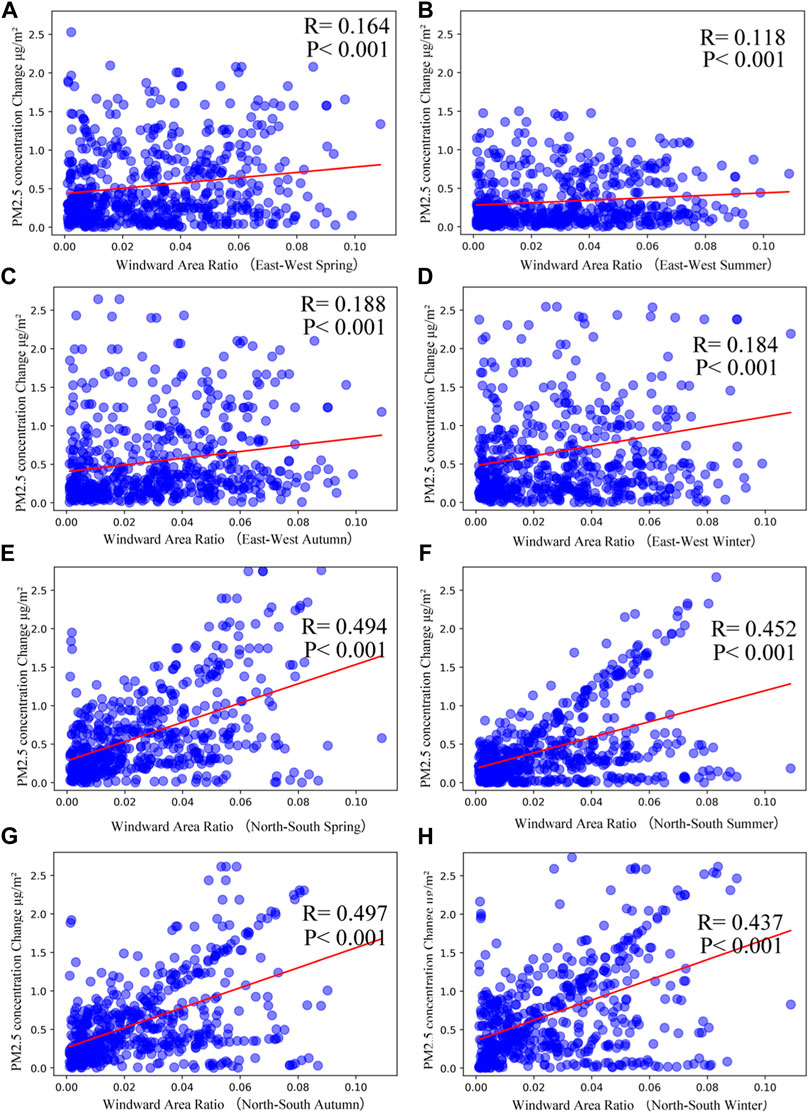
FIGURE 6. (A-D) for east–west direction and (E-H) for north–south direction.
To explore the influence of urban building form on PM2.5 concentrations, this work calculated and analyzed the PM2.5 concentration distribution and the building form indices in Wuhan in 2018 based on satellite remote sensing data and building outline data. The results indicate that this method can reflect the characteristics of PM2.5 concentration distribution and building forms in Wuhan macroscopically. The pollution patterns and diffusion characteristics of atmospheric particulate matter in cities can be analyzed based on the above methods and data. As far as Wuhan is concerned, owing to the influence of industrial emission factors, the areas with high PM2.5 concentrations are mainly concentrated in industrial areas with low building density and floor area ratio. However, the near-surface atmospheric particulate pollutants will further diffuse from suburbs to urban areas. During this process, the terrain and the shape of the buildings have a significant impact. Open terrain will accelerate the diffusion and spread of pollutants, while denser buildings will slow the spread of particulate pollution. Therefore, in the process of architectural design and urban planning, the direction and height of buildings can be designed while considering the diffusion characteristics of atmospheric particulates according to local conditions to minimize the impact of air pollution on urban residents to the greatest extent possible.
Publicly available datasets were analyzed in this study. This data can be found here: https://udparty.com.
Formal Analysis, Methodology, Writing, Software, Investigation and Resources.
This research was funded by Scientific Research Guidance Project of Hubei Provincial Department of Education, grant number B2021414.
The authors declare that the research was conducted in the absence of any commercial or financial relationships that could be construed as a potential conflict of interest.
All claims expressed in this article are solely those of the authors and do not necessarily represent those of their affiliated organizations, or those of the publisher, the editors and the reviewers. Any product that may be evaluated in this article, or claim that may be made by its manufacturer, is not guaranteed or endorsed by the publisher.
Affum, J. K., Brown, A. L., and Chan, Y. C. (2003). Integrating air pollution modelling with scenario testing in road transport planning: The TRAEMS approach. Science of the Total Environment. 312, 1–14. doi:10.1016/s0048-9697(03)00192-x
Bai, Y., Zhao, T., Hu, W., Zhou, Y., Xiong, J., Wang, Y., et al. (2022). Meteorological mechanism of regional PM2.5 transport building a receptor region for heavy air pollution over Central China. Science of the Total Environment. 808, 151951. doi:10.1016/j.scitotenv.2021.151951
Braggio, J. T., Hall, E. S., Weber, S. A., and Huff, A. K. (2020). Contribution of satellite-derived aerosol optical depth PM2.5 bayesian concentration surfaces to respiratory-cardiovascular chronic disease hospitalizations in baltimore, Maryland. Atmos. (Basel) 11, 209. doi:10.3390/atmos11020209
Bustamante, E. N., Monge-Najera, J., and Gonzalez Lutz, M. I. (2011). Air pollution in a tropical city: The relationship between wind direction and lichen bio-indicators in san jose, Costa Rica. Revista de Biología Tropical. 59, 899–905. doi:10.15517/rbt.v0i0.3148
Crosbie, E., Sorooshian, A., Monfared, N. A., Shingler, T., and Esmaili, O. (2014). A multi-year aerosol characterization for the greater tehran area using satellite, surface, and modeling data. Atmos. (Basel) 5, 178–197. doi:10.3390/atmos5020178
Diener, A., and Mudu, P. (2021). How can vegetation protect us from air pollution? A critical review on green spaces' mitigation abilities for air-borne particles from a public health perspective - with implications for urban planning. Science of the Total Environment. 796, 148605. doi:10.1016/j.scitotenv.2021.148605
Fang, C., Wang, L., Li, Z., and Wang, J. (2021). Spatial characteristics and regional transmission analysis of PM2.5 pollution in northeast China, 2016-2020. International Journal of Environmental Research and Public Health. 18, 12483. doi:10.3390/ijerph182312483
Feng, S., Gao, D., Liao, F., Zhou, F., and Wang, X. (2016). The health effects of ambient PM2.5 and potential mechanisms. Ecotoxicology and Environmental Safety. 128, 67–74. doi:10.1016/j.ecoenv.2016.01.030
Fensterstock, J. C., Kurtzweg, J. A., and Ozolins, G. (1971). Reduction of air pollution potential through environmental planning. Journal of the Air Pollution Control Association. 21, 395–399. doi:10.1080/00022470.1971.10469547
Kam, W., Delfino, R. J., Schauer, J. J., and Sioutas, C. (2013). A comparative assessment of PM2.5 exposures in light-rail, subway, freeway, and surface street environments in Los Angeles and estimated lung cancer risk. Environmental Science: Processes & Impacts, 15, 234–243. doi:10.1039/c2em30495c
Li, S., Pan, X., and Li, Q. (2021). Analysis of influencing factors of PM2.5 concentration and design of a pollutant diffusion model based on an artificial neural network in the environment of the internet of vehicles. Computational Intelligence and Neuroscience. 2021, 1–15. doi:10.1155/2021/3092197
Liu, W. P., and Yu, Z. R. (2016). Simulation on PM2.5 detention service of green space in Haidian District, Beijing, China. Ying Yong Sheng Tai Xue Bao. 27, 2580–2586. doi:10.13287/j.1001-9332.201608.001
Liu, Y., Wu, J., Yu, D., and Ma, Q. (2018). The relationship between urban form and air pollution depends on seasonality and city size. Environmental Science and Pollution Research. 25, 15554–15567. doi:10.1007/s11356-018-1743-6
Lu, X., Lin, C., Li, W., Chen, Y., Huang, Y., Fung, J. C. H., et al. (2019). Analysis of the adverse health effects of PM2.5 from 2001 to 2017 in China and the role of urbanization in aggravating the health burden. Science of the Total Environment. 652, 683–695. doi:10.1016/j.scitotenv.2018.10.140
Mansfield, T. J., Rodriguez, D. A., Huegy, J., and Gibson, J. M. (2015). The effects of urban form on ambient air pollution and public health risk: A case study in raleigh, North Carolina. Risk Anal. 35, 901–918. doi:10.1111/risa.12317
Mei, D., Wen, M., Xu, X., Zhu, Y., and Xing, F. (2018). The influence of wind speed on airflow and fine particle transport within different building layouts of an industrial city. Journal of the Air & Waste Management Association. 68, 1038–1050. doi:10.1080/10962247.2018.1465487
Meichang, W., and Bingbing, Z. (2020). Examining the impact of polycentric urban form on air pollution: Evidence from China. Environmental Science and Pollution Research. 27, 43359–43371. doi:10.1007/s11356-020-10216-1
Meng, X., Liu, C., Zhang, L., Wang, W., Stowell, J., Kan, H., et al. (2021). Estimating PM2. 5 concentrations in Northeastern China with full spatiotemporal coverage, 2005–2016. Remote Sensing of Environment. 253, 112203. doi:10.1016/j.rse.2020.112203
Meo, S. A., Almutairi, F. J., Abukhalaf, A. A., and Usmani, A. M. (2021). Effect of green space environment on air pollutants PM2.5, PM10, CO, O3, and incidence and mortality of SARS-CoV-2 in highly green and less-green countries. International Journal of Environmental Research and Public Health. 18, 13151. doi:10.3390/ijerph182413151
Ravindra, K., Rattan, P., Mor, S., and Aggarwal, A. N. (2019). Generalized additive models: Building evidence of air pollution, climate change and human health. Environment International. 132, 104987. doi:10.1016/j.envint.2019.104987
Ren, Y., Zhang, H., Zhang, X., Li, Q., Cai, X., Song, Y., et al. (2021). Temporal and spatial characteristics of turbulent transfer and diffusion coefficient of PM2.5. Science of the Total Environment. 782, 146804. doi:10.1016/j.scitotenv.2021.146804
Shi, Y., Lau, K. K., and Ng, E. (2016). Developing street-level PM2.5 and PM10 land use regression models in high-density Hong Kong with urban morphological factors. Environmental Science & Technology. 50, 8178–8187. doi:10.1021/acs.est.6b01807
Sun, K., Tang, L., Qian, J., Wang, G., and Lou, C. (2021). A deep learning-based PM2. 5 concentration estimator. Displays. 69, 102072. doi:10.1016/j.displa.2021.102072
Van Donkelaar, A., Martin, R. V., Brauer, M., Kahn, R., Levy, R., Verduzco, C., et al. (2010). Global estimates of ambient fine particulate matter concentrations from satellite-based aerosol optical depth: Development and application. Environmental Health Perspectives. 118, 847–855. doi:10.1289/ehp.0901623
Xu, X., Zhang, C., and Liang, Y. (2021). Review of satellite-driven statistical models PM2.5 concentration estimation with comprehensive information. Atmospheric Environment. 256, 118302. doi:10.1016/j.atmosenv.2021.118302
Yin, S. (2022). Decadal changes in PM2.5-related health impacts in China from 1990 to 2019 and implications for current and future emission controls. Science of the Total Environment. 834, 155334. doi:10.1016/j.scitotenv.2022.155334
Yuan, C., Ng, E., and Norford, L. K. (2014). Improving air quality in high-density cities by understanding the relationship between air pollutant dispersion and urban morphologies. Building and Environment. 71, 245–258. doi:10.1016/j.buildenv.2013.10.008
Yumimoto, K., Kajino, M., Tanaka, T. Y., and Uno, I. (2019). Dust vortex in the taklimakan desert by himawari-8 high frequency and resolution observation. Scientific Reports. 9, 1209. doi:10.1038/s41598-018-37861-4
Zhang, X., Fung, J. C. H., Zhang, Y., Lau, A. K. H., Leung, K. K. M., and Huang, W. W. (2020). Assessing PM2.5 emissions in 2020: The impacts of integrated emission control policies in China. Environmental Pollution. 263, 114575. doi:10.1016/j.envpol.2020.114575
Keywords: urban building form, PM2.5, remote sensing, air pollution, deep learning
Citation: Yu R (2023) Correlation analysis of urban building form and PM2.5 pollution based on satellite and ground observations. Front. Environ. Sci. 10:1111223. doi: 10.3389/fenvs.2022.1111223
Received: 29 November 2022; Accepted: 19 December 2022;
Published: 04 January 2023.
Edited by:
Tongwen Li, Sun Yat-Sen University, ChinaCopyright © 2023 Yu. This is an open-access article distributed under the terms of the Creative Commons Attribution License (CC BY). The use, distribution or reproduction in other forums is permitted, provided the original author(s) and the copyright owner(s) are credited and that the original publication in this journal is cited, in accordance with accepted academic practice. No use, distribution or reproduction is permitted which does not comply with these terms.
*Correspondence: Rui Yu, eXVydWk4OUB3aWMuZWR1LmNu
Disclaimer: All claims expressed in this article are solely those of the authors and do not necessarily represent those of their affiliated organizations, or those of the publisher, the editors and the reviewers. Any product that may be evaluated in this article or claim that may be made by its manufacturer is not guaranteed or endorsed by the publisher.
Research integrity at Frontiers
Learn more about the work of our research integrity team to safeguard the quality of each article we publish.