 Zhijie Chen
 Hong Chen2,3*
94% of researchers rate our articles as excellent or good
Learn more about the work of our research integrity team to safeguard the quality of each article we publish.
Find out more
ORIGINAL RESEARCH article
Front. Environ. Sci., 10 January 2023
Sec. Environmental Informatics and Remote Sensing
Volume 10 - 2022 | https://doi.org/10.3389/fenvs.2022.1106379
This article is part of the Research TopicHydrology, Water Resources, and Ecosystem Sustainable DevelopmentView all 10 articles
As a primary concern in the ecosystem, understanding the impact of spatial heterogeneity of ecological networks on the development of environmental sustainability has overarching significance. The Tibetan Plateau’s edge is a vital contribution to the study of the plateau’s ecological network. However, there are few studies and explorations on the county-level ecological network in the arid region. This study aimed to evaluate ecological network spatial patterns in Tianzhu County and establish an ecological security evaluation index system. We used the minimum cumulative resistance (MCR) model and built an ecological resistance surface model from the exploratory spatial data analysis (ESDA) method. Then, by identifying ecological corridors and ecological nodes from the gravity model, we analyzed the ecological security pattern and proposed specific plans for optimizing the situation. The results showed that 1) county ecological security overall has been lower, and its values showed spatial heterogeneity in each direction, and 2) the Z-Score of the ecological security evaluation index was 70.1893, which shows ecological vulnerability in the arid region has significant spatial autocorrelation. The study identified 156 ecological corridors and 112 ecological nodes, which formed an ecological spatial pattern of “one belt and three zones.” Our analytical framework offers a valuable tool for constructing ecological security patterns in Tianzhu County and selecting “sources” at the regional scale, which can be applied to landscapes and geographical contexts for sustainable development in arid regions.
The ecosystem is an essential basis for human survival and development, which is also a support system of human life. It is the primary part of the regional ecological pattern, which connects isolated landscape patches by ecological corridors (Jiao et al., 2021; Peng et al., 2022). This system combines with point, line, and surface to improve the self-discipline of the landscape and maintain regional ecological surrounding stability (Fan and Myint, 2014; Liang et al., 2022). However, the ecological network is a special and complex network of landscape ecology, which is a complex network that is composed of three pattern elements—ecological sources, ecological corridors, and ecological nodes (Luo et al., 2022). Therefore, the structure, function, and interrelationship of the ecological network have been important research points in network and science and landscape ecology research (Jiang et al., 2022; Shen et al., 2022). The integrity of the ecological network structure and its advantages and disadvantages will determine whether the ecological network’s function can work properly.
According to integrated landscape ecology and land planning theory, in recent years, scholars built ecological networks, including Nature 2000 Network, Emerald Network, Dutch National Ecological Network, and European Ecological Network (Möckel, 2017). Aiming at different objects, the research of ecological network construction mainly focuses on the forest ecological network, wetland ecological network, urban green space ecological network, and desert ecological network protection (Raji et al., 2022). Ecological network construction had been formed on the basis of a research paradigm, including ecological source identification and ecological corridor identification. It mainly identifies ecological sources by assessing the suitability of ecological habitats and the importance of ecological connectivity (Wan et al., 2019; Streib et al., 2020). Among them, the importance of environmental assessment is the most used method. The method of identifying ecological corridors by constructing resistance surfaces is usually based on the value distribution of land cover. The lowest cost path analysis is usually used to extract ecological corridors. However, this study considers the obstacles of landscape heterogeneity to ecological flow, although they ignore the mutual attraction of ecological resources and do not consider the interaction of ecological resources (Fan et al., 2017; Cunha and Magalhães, 2019). The application of the gravity model in space interaction provides a way to study the interaction between ecological sources. The gravity model was first used to study the inter-city spatial structure and later widely used in regional economic research, urban group interaction, and inter-city trade research. At present, gravity models have been widely used in the study of regional economic connections or spatial interactions. Based on the interaction force theory, using the improved MCR model and gravity model, the ecological network of the study area is extracted by comparing the minimum cumulative ecological resistance and the maximum ecological gravity between different ecological sources (Hu et al., 2019; Dai et al., 2021). In China, the types of Tianzhu landforms are more special, including alpine mountains on the Qinghai–Tibet Plateau, an oasis in arid areas, and monsoon valleys. Complex climatic types and terrain and geomorphology together affect the formation of ecological networks with great ecological value and vulnerability (Huang et al., 2022; Wang et al., 2022). To this purpose, ecological networks are even more needed to connect broken habitats through ecological corridors and ecological nodes to form a complete landscape network to ensure regional ecological security (Yang et al., 2022a; Dai et al., 2022). This abstracts the actual regional ecological network into an ecological topology network.
The stability and balance of the ecosystem will determine human life directly. However, the utilization and development scale of land has increased dramatically over the past century. Especially in northwestern China, this tendency, therefore, caused serious damage to the structure and function of the ecosystem and produced a series of problems, such as a sharp decline in biodiversity, degeneration of grassland, and soil erosion and desertification (Zhou et al., 2020; Geng et al., 2022). This phenomenon is more obvious in Tibet and China. In addition, the major climate type of Tianzhu is alpine on the Tibetan Plateau and the climate of the local area is arid desert and monsoon type (Gu et al., 2018; Zhang et al., 2020). So, the diversity and complexity of climate are especially prominent here, which have a significant impact on the ecosystem. The security of the ecosystem and sustainable development in this region have been the focus of research in our study for a long time (Wang and Pan, 2019; Wen and Hou, 2021). We used the gravity model and minimum cumulative resistance model to extract the ecological network. Through the ecosystem, importance assessment identifies ecological sources. The improved ecological resistance model will be used to calculate the minimum cumulative ecological resistance between ecological sources, and the improved ecological gravity model will be used to calculate the ecological gravity between ecological sources. According to the interaction force theory, the ecological corridor is determined by comparing the combined forces between different ecological sources. Finally, it provides new methods and new research perspectives for regional ecological planning and also provides reference and guidance for the formulation of environmental protection and sustainable development policies in the alpine mountainous regions of the arid region.
Tianzhu is situated in the arid region of Northwest China. It is situated at the intersection of the Qinghai–Tibet plateau, the loess plateau, the Inner Mongolia plateau, and the northeast edge of the Qinghai–Tibet plateau (Figure 1A). Its altitude is between 2,040 m and 4,874 m, with an average altitude of 3,075.86 m. The landform is a priority in the mountainous area, mountain range crisscross, ravine crisscross, and more mountains. Situated in the middle of the county, whistling lies between east and west. It is the throat of the ancient Silk Road and the gateway of the Hexi Corridor (Figure 1B). Furthermore, it is the watershed between the inland river and the outflow river. Rivers are widely disseminated, rich in water resources, and divided into two major water systems: the Shiyang river system and the Yellow River system (Figure 1C). The annual runoff of surface water is 1.024 billion m3, and the recharge of groundwater is 420 million m3. With whistling as the boundary, the south of Wushaoling has a continental plateau monsoon climate, while the north has a temperate continental semi-arid climate, with an average yearly temperature of −8°C to 4°C. The vertical distribution of the climatic zone is very obvious, and the weather in small regions is complex and changeable, with droughts, hail, floods, frost, snow, and other natural disasters. Tianzhu has jurisdiction over 17 townships.
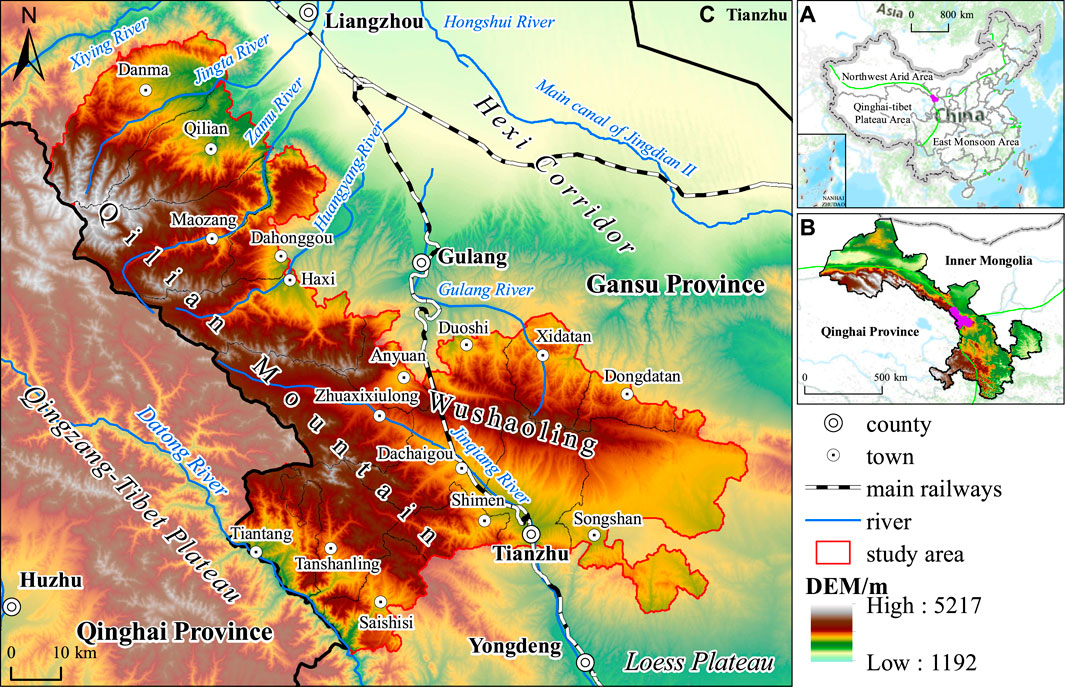
FIGURE 1. Location of the study area.
In this study, land use data were obtained from the GlobeLand30 (GLC30) dataset (https://www.globallandcover.com/) for the year 2020. The study area covers seven types of land use: cropland, forest, grassland, shrubland, wetland, water, impervious surface (IS), and bare land. The average overall accuracy of the data is 84.61%, and the average Kappa coefficient is .80 (Bouslihim et al., 2022). The DEM datasets with 30 m spatial resolution were obtained from the Shuttle Radar Topography Mission (SRTM). The slope was derived from the SRTM DEM dataset. The basic geographic data, NDVI, and soil erosion datasets were obtained from the Resource and Environment Science Data Centre of the Chinese Academy of Sciences (https://www.resdc.cn). ArcMap10.4 was mainly used for data processing and calculation. Distance analysis, reclassification, and raster calculation of raw data are shown in Table 1. Ecological security assessment uses zonal tools for statistical analysis. In the analysis of spatial heterogeneity, a 1 km × 1 km grid was created based on the fishnet tool, and hot spot analysis (Geti’s-Ord Gi *) was used in spatial statistics tools to evaluate the cold and hot spot patterns of ecological resistance values, and then cluster and outlier analysis (Anselin Local Moran’s I) was used to compute local spatial autocorrelation features. The ecological network construction process uses the cost distance tool in the spatial analyst tools to obtain the ecological security spatial distribution map and uses the cost path to extract the “ridgeline” on the surface of the ecological security pattern. These processes will be specifically introduced in the research methodology.
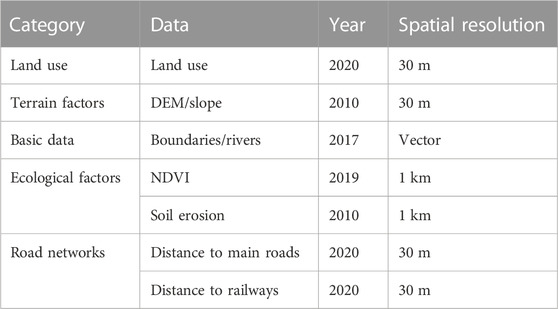
TABLE 1. List of the in this study.
Ecological source patches mainly select objects with good habitat quality and high value of ecological services as targets, such as ecological wetland parks, forest reserves, nature reserves, scenic spots, and other green patches (Zhang et al., 2022). Elevation and slope affect the spatial distribution and utilization of land resources (Wang et al., 2019; Tang et al., 2022). Land use type will affect the material energy and information exchange within and between ecological source nodes. Vegetation coverage can improve local microclimate and play a positive role in the effective recovery and protection of biodiversity. Rivers can purify harmful substances and improve the ecological function of the environment. The closer the river is, the better the expansion of the ecological source. On the contrary, the influence of traffic roads and other indicators on the surrounding land use, the change of production land use structure, and landscape patterns are mainly considered. Generally speaking, if the distance from the road is closed, the gravitation of urban construction expansion will be greater, which is more unfavorable to the spatial expansion of ecological sources. The level of ecological security is divided into one to four levels from high to low (Table 2), and the corresponding weight is assigned to each ecological evaluation resistance factor.
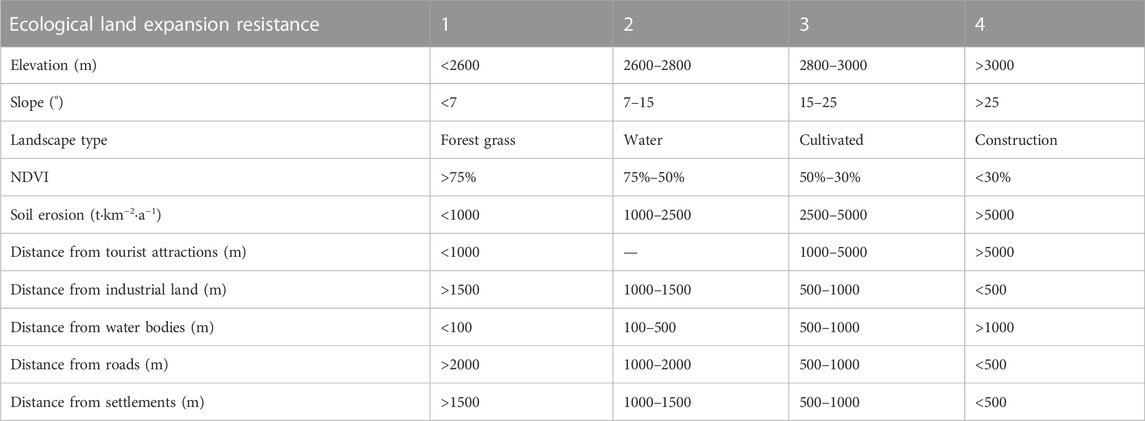
TABLE 2. Value system for ecological resistance factors.
The least cumulative resistance model can calculate the resistance of spatial dimensions in heterogeneous space to obstacles to biological migration and species diffusion. The channel with the least cumulative resistance is the channel with the lowest cost of consumption and the highest possibility of expansion (Wang et al., 2021). The formula is given as follows:
where VMCR is the value of the minimum cumulative resistance surface; f is a function of the positive correlation that reflects the relation of the least resistance for any point in space to the distance from any point to any source and the characteristics of the landscape base surface; min denotes the minimum value of cumulative resistance produced in different processes of landscape unit i transforming into a different source unit j; Dij is the spatial distance between landscape unit i and source unit j; and Ri denotes the resistance coefficient that exists in transition from landscape unit i to source unit j.
The ecological source patches in the model in this study mainly choose objects with good habitat quality and high ecological service value as targets, such as ecological wetland parks, forest reserves, nature reserves, scenic spots, and other green space patches. The determination of the drag factor is a key step in the establishment of the drag surface model. Based on the combination of natural factors and socioeconomic factors and following the principles of accessibility and easy quantification, the study selected 13 indicators of natural factors and socioeconomic factors as resistance evaluation factors in the resistance surface model to form the ecological security evaluation index system (Figure 2). The resistance factor is divided into four levels, and the resistance coefficient is expressed as 1, 2, 3, and 4 (Table 2). The larger the value is, the greater the resistance is and the higher the cost is. ArcGIS 10.4 was used to establish the ecological security resistance surface model, and the cost-distance module was used to calculate the cumulative cost resistance surface of ecological sources. Based on MCR, the cost-path tool is used to identify the minimum cumulative cost path between ecological sources as the basis for potential ecological corridors.
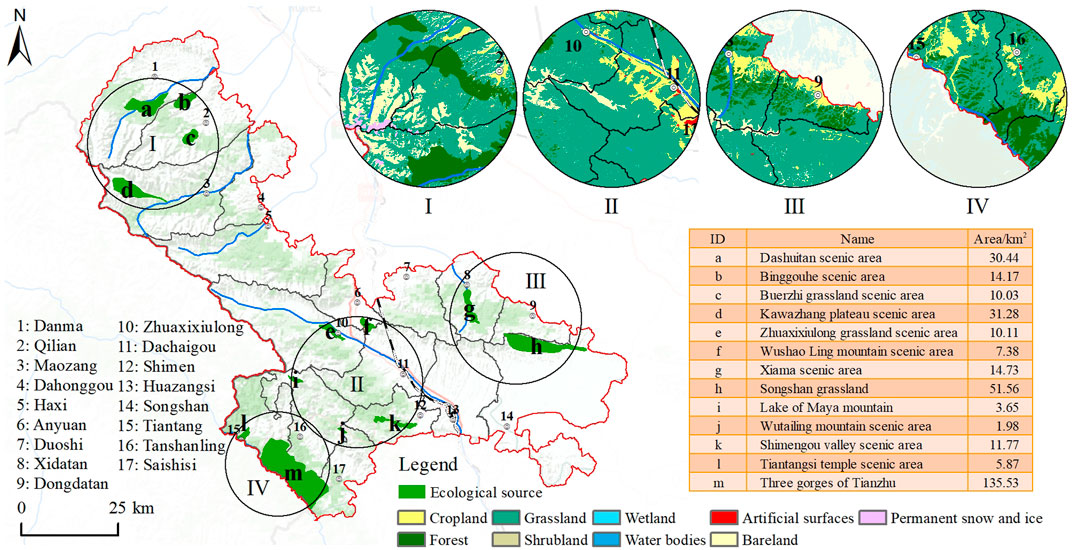
FIGURE 2. Location of the ecological source patches.
The intensity of interactions between the source and the target can be used to characterize the effectiveness of the potential ecological corridor and the importance of connection plaques When the cost distance between plaques is larger, the interaction is smaller, and the importance ecological corridors connecting become strong (Su et al., 2019). Based on the gravity model to quantify the ecological source of the MCR model to extract the potential between the importance of ecological corridors and calculate the interaction between the ecological source matrix, quantitative evaluation is used to select the intensity of the interaction between source plaques, judging from the strength size of the corridor in the area of relative important degree, to identify potentially important ecological corridor, and form an ecological security network. The effectiveness of potential ecological corridors and the importance of connecting ecological patches are mainly expressed by the strength of the interaction between the source and the target. The calculation formula of the gravity model is given as follows:
where Gab is the interaction force between patches a and b of ecological origin. Na and Nb are the weights of patches a and b, respectively. Dab is the standardized value of the potential ecological corridor resistance between patches a and b of the ecological origin. p is the resistance value of patches. S is the area of patches. Lab is the cumulative resistance value of the ecological corridor between patches a and b. Lmax is the maximum value of the ecological corridor resistance value in the study area. The landscape resistance of potential ecological corridors will affect species migration. A small resistance is conducive to the migration and dispersal of species, and vice versa, it hinders the connection between species.
Exploratory spatial data analysis explores the distribution characteristics of spatial objects based on the correlation and degree analysis of sample values in the space. Global spatial autocorrelation reflects the overall trend of spatial correlation of observed variables in the whole research area (Rong et al., 2022). At a given significance level, if Moran’s I is significantly positive, it means that the area with high (or low) ecological security resistance has a significant spatial agglomeration. The closer the value is to 1, the smaller the overall spatial difference is. On the contrary, when Moran’s I is significantly negative, it indicates that there is a significant spatial difference in the level of economic development between the region and the surrounding areas. The closer the value is to -1, the larger the overall spatial difference is. When Moran’s I is 0, the space is irrelevant (Liu et al., 2022). The formulas are as follows:
where i ≠j; N is the number of research objects; X is the observed value;
where Z(I) is the mathematical expectation, with a value of -1/(n-1). Var(I) is the variance of I. If the Z value of the positive statistic of Moran’s I is larger than the function of normal distribution, the critical value of 1.96 is at the level of .05. This shows that there is a significant positive correlation in spatial distribution. Although global spatial autocorrelation analysis can reveal the dependence of things as a whole, it ignores the possibility of local instability. We need to introduce the local spatial autocorrelation (LISA) method to reveal the autocorrelation of local regional units in adjacent space. We used Local Moran’s I index to measure the heterogeneity of spatial elements between regional units i and j, and the calculation formula is given as follows:
where Z is the standardized result of observed values on space elements i and j; wij is the space weight matrix. Getis-Ord Gi* can further measure the characteristics of the local spatial autocorrelation. It is used to identify high-value clusters and low-value clusters in different spatial regions, that is, the spatial distribution of hot spots and cold spots. The calculation formula is given as follows:
To facilitate comparison and analysis, Gi*d) is standardized in this study.
where E(Gi*) and Var(Gi*) are, respectively, the mathematical expectation and coefficient of variation of Gi* and Wij(d) is the spatial weight. If Z(Gi*) is positive and significant, it indicates that the value around position i is relatively high (above the mean), which belongs to a high-value spatial cluster (hot spot). On the contrary, if it is negative and significant, it means that the value around position i is lower than the mean and it belongs to the low-value spatial clustering (cold spot area). In this study, a grid is created using ArcGIS 10.4, and zonal statistics are performed on the ecological resistance surface with a grid width of 1000 m × 1000 m. Then, the generated point data were extracted to associate with the grid. The ecologically safe global Moran’s I index calculation is performed in GeoDa 1.14 software. Hot spot analysis was used in ArcGIS 10.4 to analyze the hot and cold features of the ecological security pattern and its significance (Nie et al., 2021). Eventually, cluster and outlier analysis was used to obtain the spatial clustering results of the ecological security pattern.
According to the current situation of the county’s tourism resources and the background of the ecological and tourism industries as poverty alleviation projects, large landscape patches with good habitat conditions and natural reserves are selected as ecological source nodes, and 13 large habitat patches are selected as regional organisms. The total area of diverse source patches was 328.49 km2. These patches are the main activity range and important habitat of biological species in the study area and provide important guarantees for the survival and reproduction of species. They have extremely important ecosystem functions and ecological values. According to the combination of natural factors and socioeconomic factors, and following the principles of accessibility and quantification, 10 indicators of natural factors and socioeconomic factors were selected as the resistance evaluation factors in the resistance surface model. The ecological resistance surface was established. According to the ecological resistance value factors in Table 3, we used the grid data processing method to establish the comprehensive resistance surface of ecological factors and obtained the spatial distribution map of the ecological security evaluation level (Lin et al., 2022; Wei et al., 2022). The spatial distribution of the ecological resistance comprehensive resistance surface shows that the minimum ecological resistance is 1.0150, the maximum ecological resistance is 3.6150, and the average ecological resistance is 2.5489. To make the classification of the ecological security pattern at the township level more reasonable, first, we use the average value of ecological resistance as a limit and binarize the ecological security resistance surface. Then, we used the zonal tool of ArcGIS 10.4 to make statistics on the grid surface of ecological security resistance (Figure 3A). In this process, we classified the ecological security resistance values of 17 towns based on the ratio of the ecological resistance values “grid area below average” and “grid area above average.” Finally, we used the Natural Breaks (Jenks) method to compare the values for classification. The ratio of the ecological security classification is .4834–2.5616. Among them, the lowest security level is .4834–.5647, the lower security level is .5648–.7716, the medium-security level is .7717–1.0076, the higher-security level is 1.0077–1.3577, and the highest security level is 1.3578–2.5616.
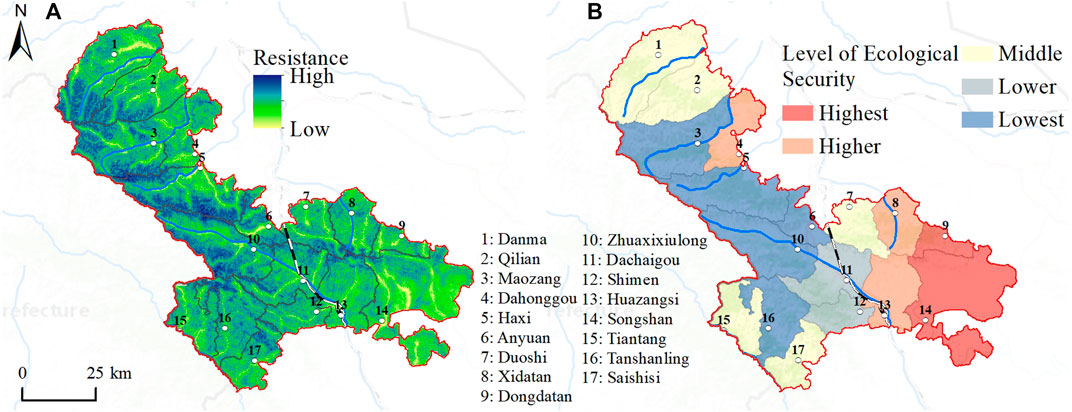
FIGURE 3. (A) Grid map of ecological resistance and (B) classification of ecological security.
In the spatial characteristics of ecological security, Figure 3B shows that the ecological security pattern of the county is characterized by high east and low west. The highest security level area mainly includes Songshan and Dongdatan, and their area accounts for 14.76% of the total area. The higher-security level areas are Huazangsi, Xidatan, and Dahonggou, and their area accounts for 14.20% of the total area. The medium-security level area is distributed in Qilian, Danma, Tiantang, Duoshi, and Saishisi, and their area accounts for 28.37% of the total area. The lower-security level area is mainly distributed in Shimen and Dachaigou, and their area accounts for 9.01% of the total area. The lowest security level areas are mainly distributed in Haxi, Maozang, Anyuan, Tanshanling, and Zhuaxixiulong, and their area accounts for 33.66% of the total area. The ecological security evaluation results show that the ratio of the area of the highest security level and the higher-security level to the total area is 28.96%. The area of the lower-security level and the lowest security level accounted for 42.67%. It shows that the ecological security level of Tianzhu is generally low. At the same time, areas above the medium-security level are mainly closely related to the distribution of river systems. The terrain in these areas is relatively flat. The lower-security level areas are mainly mountainous areas with high altitudes and large slopes. These areas are vulnerable to ecological conditions due to natural conditions and human activities.
Analysis of the spatial distribution and agglomeration spatial heterogeneity of the ecological security level in Tianzhu was carried out. The results show that the global Moran’s I index for ecological security is .4469. This indicates that there is a spatial autocorrelation in the ecological security resistance value. Moran’s I generally uses the Z method for significance testing. The significance of Moran’s I index and Z-Score test is that when Moran’s I > 0, Z-Score > 1.96 (p-value < .05), Moran‘s I value can indicate the significance of its spatial positive correlation. The Z-Score of the ecological security evaluation index is equal to 70.1893 (p-value = .0000), which is much greater than 1.96, indicating that the spatial distribution of ecological security levels of a county shows a strong positive spatial correlation. Figure 4A shows that hot spots and cold spots have significant spatial differences. The cold spot is mainly distributed in the east. The hot spot is mainly distributed in the west. Hot spots and cold spots have a larger proportion of 99% and 95% confidence intervals. In addition, not significant grid cells are regions where the ecological security resistance index is not highly spatial. The value of the local autocorrelation Moran’s I index divides The geographic space is divided into four parts based on the value of the local autocorrelation Moran’s I index: “high–high (HH), low–low (LL), high–low (HL), and low–high (LH)." Among them, the high–high cluster indicates that the central area with a high ecological security resistance index has a high ecological security resistance index in the surrounding area, and it is reflected in the spatial correlation as a diffusion effect (Peng et al., 2018). The low–low cluster indicates that the ecological security resistance indexes of the central area and adjacent areas are low, and they belong to a low level of ecological security.
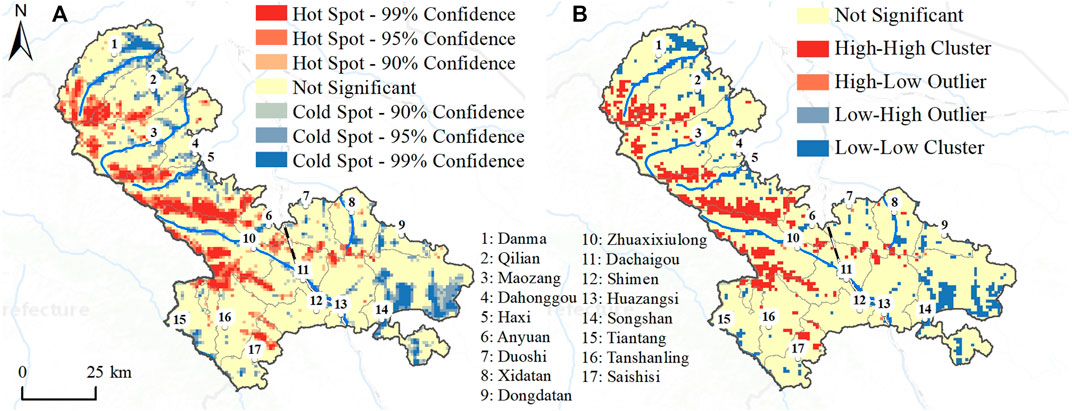
FIGURE 4. (A) Hot spot and (B) LISA detection of the ecological security evaluation index.
At the same time, there is a significant positive spatial correlation between the high–high and low–low ecological security resistance indexes in the geographic space. High–low indicates that the high-adjacent value of the ecological security resistance index in the central area is low, and it exhibits a polarization effect in spatial correlation. Low–high indicates that the resistance index of ecological security in the central area is low and that of the adjacent is high. It belongs to the transition zone in spatial correlation. According to Figure 4B, the ecological security resistance index of the county is mainly based on two types of high–high and low–low agglomerations, which have obvious spatial distribution characteristics of flakes, while the high–low and low–high types in space. The effect of aggregation is not obvious. For the high–high distribution area, its ecosystem is relatively fragile, and geological hazards and soil erosion are highly sensitive (Kang et al., 2021; Liu et al., 2022). Biodiversity protection should be strengthened, and biological measures and engineering should be combined to control soil erosion, moderately develop ecological tourism, and develop tourism agriculture. For the low–low area, under the guidance of land space planning and ecological planning, stricter use controls should be implemented to ensure the rational use of land, coordinate the orderly expansion of urban land use, and strengthen the protection of cultivated land and ecological conservation.
Construction of the Tianzhu ecological security network based on the MCR model. The results show that the lowest resistance value of the ecological cumulative consumption resistance surface is 0, and the highest value is 108,564.9. High resistance values are mainly distributed in the southeast and northwest regions. The southeast region is mainly densely distributed in towns and villages. The northwest direction is concentrated on the snow-covered mountains above 4,000 m. The area of the low resistance value is widely distributed. It is mainly in the periphery of the northwest alpine region of the county, and it is an area with high habitat quality. Then, we calculated the minimum cumulative consumption path between each ecological source patch and other ecological source patches. The potential ecological corridors are established, and the cumulative resistance value of each potential ecological corridor is calculated (Figure 5A). The results showed that a total of 156 potential ecological corridors were generated in the study area. We calculated and identified 33 important corridors through the gravity model. Among them, there are 12 secondary potential corridors with an importance value between 50 and 100. There are 21 first-level potential corridors with importance values greater than 100. There are 123 general corridors with importance values less than 50. It can be known from the table of ecological gravitation between ecological source nodes that the importance values of the interaction intensity between the ecological patches selected in the study area are significantly different. The minimum value is 7.8182, which indicates that the interaction between ecological source patches 3 and 13 is the weakest, and the landscape resistance between ecological source patches is very large. The maximum value is 1090.7625, which indicates that the interaction between ecological source patches 3 and 7 is the strongest. The ecological resistance between the ecological corridors is relatively small, and the quality of habitat conditions is high. As ecological corridors play an important role in the richness, migration, and diffusion of biological species, it is necessary to strictly control and protect important ecological corridors during the construction of an ecological security network (Padró et al., 2020; Liu et al., 2021). At the same time, the ecological pattern of general corridors should also be improved and optimized in planning such as green space system planning to improve the habitat suitability of this type of ecological corridor.
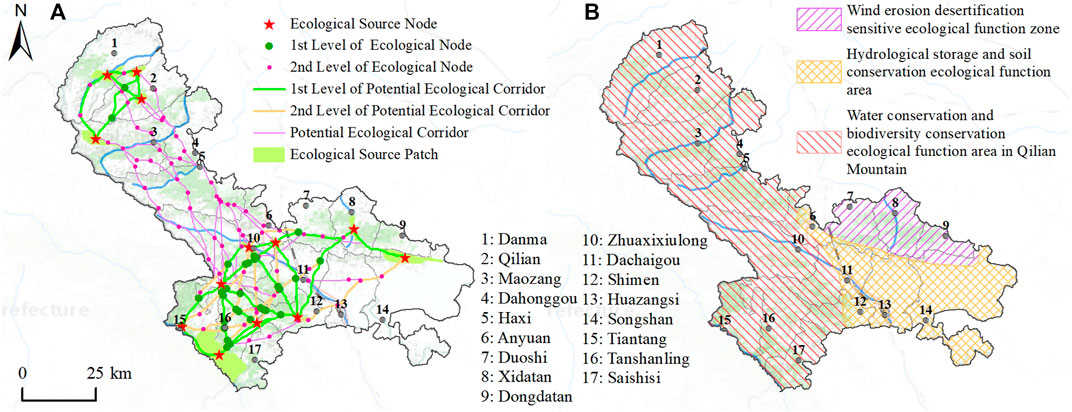
FIGURE 5. (A) Spatial distribution of eco-nodes and potential ecocorridors, (B) Optimization scheme of ecological security.
Ecological nodes are generally located at the weakest point of the ecological function in ecological corridors. They are mainly composed of the intersections of the smallest path and the largest path or the intersection of the smallest path. It is beneficial to reduce the cost of ecological corridors and improve the ecological service function of the regional ecological network (Huang et al., 2021; Nie et al., 2021). Therefore, according to the ecological source areas, corridors, and ecological nodes, ecological planning and layout are carried out to build a “point–line–surface” ecological service function network system that blends. It is of great significance to strengthen functional health and service sustainability. In the end, we extracted 156 potential ecological corridors in the county, with a total length of about 1248.00 km2, of which the length of the first and second corridors accounted for 53.50% of the total length. In addition, based on the generated potential ecological corridors and the minimum cumulative resistance surface, the spatial analysis function of ArcGIS was used to extract 112 ecological nodes between the potential ecological corridors in the study area. We refer to the actual spatial distribution of ecological source patches, important potential ecological corridors, and ecological nodes in the county and “Tianzhu Urban and Rural Overall Planning (2018–2035)" issued by the local government. In the end, we proposed the ecological network framework layout model of the “One Belt and Three Zones” (Figure 5B). Among them, the “Belt” is mainly the Jinqiang river urban agglomeration and development zone. The “Three zones” refer to the ecological function areas sensitive to wind erosion and sand, the ecological function areas for hydrological storage and soil conservation, and the ecological function areas for water conservation and biodiversity maintenance in the Qilian Mountains. Among them, the hydrological storage and soil conservation ecological function areas are based on the Jinqiang river, connecting Huazangsi, Shimen, Dachaigou, Anyuan, and Zhuaxixiulong. The ecological function areas of water conservation and biodiversity maintenance of the Qilian Mountains include Tanshanling, Saishisi, Tiantang, Haxi, Danma, Qilian, Maozang, and Dahonggou. Wind erosion and desertification-sensitive ecological functional areas cover Songshan, Duoshi, Xidatan, and Dongdatan.
We aimed at the layout pattern of the ecological network framework and protected the integrity of important ecological source patches such as various types of scenic areas and nature reserves in the region through land space planning and related ecological function zone planning. We increased the patch area through green space planning, improved the habitat quality of ecological source patches in the ecological network framework, enhanced the habitat suitability of biological species to patches, and strengthened the protection and construction of ecological source sites in the ecological network framework. We combined existing tourism routes and green space networks to rationally plan corridors such as roads, river systems, and shelterbelts in the area and further improve the ecological network structure (Su et al., 2016; Yang et al., 2022b). Since outward traffic roads mainly radiate outward from the center of Huazangsi Town, we should strengthen the protection of ecologically sensitive points where ecological corridors and roads intersect and strengthen the coupling analysis of regional ecological sensitivity and socioeconomic and industrial layout (Galli et al., 2020). We must closely integrate ecological security construction with the development of regional environmental governance projects, ecological industries, and tourism poverty alleviation projects, which will help us carry out the overall layout and planning of the ecological compensation mechanism. The research methods and results also have certain theoretical and practical significance for future research on ecological security construction in the alpine region of the Qinghai–Tibet Plateau.
Meanwhile, China’s natural zone transition zone is an important regional ecological system. At different spatial scales and geographic locations, there are obvious transitional characteristics of the terrain, climate, hydrology, soil, vegetation, and other factors (He et al., 2019). Wind erosion and desertification-sensitive ecological function areas are generated based on the environmental characteristics of the arid regions in the northwest. The Qilian Mountains’ water conservation and biodiversity conservation ecological function zones are determined based on the climatic characteristics and topographic features of the Qinghai–Tibet Alpine Region (Zhou et al., 2021). The hydrological storage and soil conservation ecological function zones are formed by the unique environmental characteristics of the eastern monsoon region in the northwest, where the Loess Plateau, Inner Mongolia Plateau, and Qinghai–Tibet Plateau meet. The Yellow River and its tributaries form a spatial distribution pattern. As well as the layout of regional transportation arteries. These three typical characteristics have important impacts on regional ecosystem security.
The ecological security pattern method based on the MCR model is widely used in the research of urban planning, land use, and ecological evaluation. It has certain advantages in the expression of ecological processes and spatial visualization of influencing factors. This study mainly uses raster data based on the minimum cumulative resistance model method to evaluate ecological security, extract ecological corridors, and construct an ecological network framework for Tianzhu (Guo et al., 2020). Overall, the research results are more in line with the actual situation of the county. In the currently implemented “Tianzhu Urban and Rural Overall Planning (2018–2035)" and " The 14th Five-Year Plan for Economic and Social Development and Long-Range Objectives through the Year 2035 of Tianzhu County”, the importance of ecological network construction in ecological security construction was emphasized. This study uses the quantitative method based on the MCR model. The layers of potential ecological corridors extracted at different levels are richer, and the spatial positioning of the corridors is clearer. The study of ecological security patterns is a long-term and complex process, and the research focus of this study does not consider the supporting effect of the study area on the Hexi Corridor and the Qilian Mountain area. Therefore, the research on the influence of the ecological security pattern of the small-scale study area on the larger spatial scale still needs to be further strengthened. In addition, the ecological corridor in this study is a linear element, which lacks the exploration of the width of the ecological corridor and radiation channel. Corridors with different widths can directly affect the function of the regional ecosystem, and the utilization and demand width of corridors are different for various biological species. How to determine the optimal width of the ecological corridor in the study area? Making it produce the maximum ecological benefits is a key direction for subsequent research.
This study takes Tianzhu as the research area, establishes the ecological resistance surface according to the ecological resistance factor index, analyzes the spatial distribution characteristics of ecological security level, selects large scenic areas and nature reserves as ecological source nodes, and constructs ecological source nodes of ecological accumulation and resistance surface. Finally, the MCR model and gravity model are used to extract potential ecological corridors and identify important potential ecological corridors. The main conclusions are as follows. 1) The level of ecological security is relatively low. Ecological security presents the spatial characteristics of low north and high south. It has higher ecological security and high-level areas occupying 32.79% of the total county area, while lower and low-level areas account for 51.89%. The ESDA analysis of the spatial distribution of ecological security shows that the global Moran’s I index is .4469, and the results of the hot spot analysis show that the ecological security level of the county is mainly high–high (HH) and low–low (LL). It has obvious flake-shaped agglomeration and distribution characteristics. 2) Based on the ecological network pattern characteristics of Tianzhu, we proposed a layout model of the “One Belt, Three Zones” ecological network framework for the construction and protection of ecological economic development and tourism economic development. This model can serve as an important supplement to the spatial layout of the ecological industry and provide a decision-making basis for ecological security planning.
The original contributions presented in the study are included in the article/Supplementary Material; further inquiries can be directed to the corresponding author.
ZC and HC contributed to the conception of this study. ZC and MY carried out the design and production of some diagrams. ZC and WZ contributed significantly to the analysis and manuscript preparation. ZC and YJ performed the data analyses and wrote the manuscript. WZ and XW helped perform the analysis with constructive discussions. All authors contributed to the article and approved the submitted version.
This research was supported by the Young Scholars Science Foundation Project of Gansu Province (No.21JR7RA343), the Foundation of Key Projects of Natural Science of Gansu Province (Grant Nos. 21JR7RA278 and 21JR7RA28121), the Young Scholars Science Foundation of Lanzhou Jiaotong University (Grant number 2021019), and the Foundation of Key Talent Projects of Gansu Province (No. 2021RCXM073).
This is a short text to acknowledge the contributions of specific colleagues, institutions, or agencies 455 that aided the efforts of the authors
The authors declare that the research was conducted in the absence of any commercial or financial relationships that could be construed as a potential conflict of interest.
All claims expressed in this article are solely those of the authors and do not necessarily represent those of their affiliated organizations, or those of the publisher, the editors, and the reviewers. Any product that may be evaluated in this article, or claim that may be made by its manufacturer, is not guaranteed or endorsed by the publisher.
Bouslihim, Y., Kharrou, M. H., Miftah, A., Attou, T., Bouchaou, L., and Chehbouni, A. (2022). Comparing pan-sharpened landsat-9 and sentinel-2 for land-use classification using machine learning classifiers. J. Geovisualization Spatial Analysis 6 (2), 35–17. doi:10.1007/S41651-022-00130-0
Cunha, N. S., and Magalhães, M. R. (2019). Methodology for mapping the national ecological network to mainland Portugal: A planning tool towards a green infrastructure. Ecol. Indic. 104, 802–818. doi:10.1016/j.ecolind.2019.04.050
Dai, L., Liu, Y., and Luo, X. (2021). Integrating the MCR and DOI models to construct an ecological security network for the urban agglomeration around Poyang Lake, China. Sci. Total Environ. 754, 141868. doi:10.1016/j.scitotenv.2020.141868
Dai, Y., Diao, Y., Dai, C., Li, Y., Sun, G., Zahoor, B., et al. (2022). Spatial-temporal dynamics and evolution of ecological security in a rapid urbanization city, Southwest China. Front. Ecol. Evol. 10, 866. doi:10.3389/fevo.2022.914567
Fan, C., and Myint, S. (2014). A comparison of spatial autocorrelation indices and landscape metrics in measuring urban landscape fragmentation. Landsc. Urban Plan. 121, 117–128. doi:10.1016/j.landurbplan.2013.10.002
Fan, Y., Qiao, Q., and Fang, L. (2017). Network analysis of industrial metabolism in industrial park – a case study of Huai'an economic and technological development area. J. Clean. Prod. 142, 1552–1561. doi:10.1016/j.jclepro.2016.11.149
Galli, A., Iha, K., Moreno Pires, S., Mancini, M. S., Alves, A., Zokai, G., et al. (2020). Assessing the Ecological Footprint and biocapacity of Portuguese cities: Critical results for environmental awareness and local management. Cities 96, 102442. doi:10.1016/j.cities.2019.102442
Geng, W., Li, Y., Zhang, P., Yang, D., Jing, W., and Rong, T. (2022). Analyzing spatio-temporal changes and trade-offs/synergies among ecosystem services in the Yellow River Basin, China. Ecol. Indic. 138, 108825. doi:10.1016/j.ecolind.2022.108825
Gu, Q., Wei, J., Luo, S., Ma, M., and Tang, X. (2018). Potential and environmental control of carbon sequestration in major ecosystems across arid and semi-arid regions in China. Sci. Total Environ. 645, 796–805. doi:10.1016/j.scitotenv.2018.07.139
Guo, J., Wei, Z., Ren, J., Luo, Z., and Zhou, H. (2020). Early-warning measures for ecological security in the Qinghai alpine agricultural area. Int. J. Environ. Res. Public Health 17 (24), 9292–9329. doi:10.3390/ijerph17249292
He, Y., Jiang, X., Wang, N., Zhang, S., Ning, T., Zhao, Y., et al. (2019). Changes in mountainous runoff in three inland river basins in the arid Hexi Corridor, China, and its influencing factors. Sustain. Cities Soc. 50, 101703. doi:10.1016/j.scs.2019.101703
Hu, M., Li, Z., Yuan, M., Fan, C., and Xia, B. (2019). Spatial differentiation of ecological security and differentiated management of ecological conservation in the Pearl River Delta, China. Ecol. Indic. 104, 439–448. doi:10.1016/j.ecolind.2019.04.081
Huang, K., Peng, L., Wang, X., and Chen, T. (2022). Integrating landscape connectivity and natural-anthropogenic interaction to understand karst vegetation restoration: A case study of guizhou Province, China. Front. Ecol. Evol. 10, 844437. doi:10.3389/fevo.2022.844437
Huang, X., Wang, H., Shan, L., and Xiao, F. (2021). Constructing and optimizing urban ecological network in the context of rapid urbanization for improving landscape connectivity. Ecol. Indic. 132, 108319. doi:10.1016/j.ecolind.2021.108319
Jiang, H., Peng, J., Zhao, Y., Xu, D., and Dong, J. (2022). Zoning for ecosystem restoration based on ecological network in mountainous region. Ecol. Indic. 142, 109138. doi:10.1016/j.ecolind.2022.109138
Jiao, M., Wang, Y., Hu, M., and Xia, B. (2021). Spatial deconstruction and differentiation analysis of early warning for ecological security in the Pearl River Delta, China. Sustain. Cities Soc. 64, 102557. doi:10.1016/j.scs.2020.102557
Kang, J., Zhang, X., Zhu, X., and Zhang, B. (2021). Ecological security pattern: A new idea for balancing regional development and ecological protection. A case study of the jiaodong peninsula, China. Glob. Ecol. Conservation 26, e01472. doi:10.1016/j.gecco.2021.e01472
Liang, C., Zeng, J., Zhang, R. C., and Wang, Q. W. (2022). Connecting urban area with rural hinterland: A stepwise ecological security network construction approach in the urban–rural fringe. Ecol. Indic. 138, 108794. doi:10.1016/j.ecolind.2022.108794
Lin, L., Hao, Z., Post, C. J., and Mikhailova, E. A. (2022). Monitoring ecological changes on a rapidly urbanizing island using a Remote sensing-based ecological index produced time series. Remote Sens. 14 (22), 5773. doi:10.3390/rs14225773
Liu, C., Wang, C., Li, Y., and Wang, Y. (2022a). Spatiotemporal differentiation and geographic detection mechanism of ecological security in Chongqing, China. Glob. Ecol. Conservation 35, e02072. doi:10.1016/j.gecco.2022.e02072
Liu, J., Cao, X., Zhao, L., Dong, G., and Jia, K. (2022b). Spatiotemporal differentiation of land ecological security and its influencing factors: A case study in jinan, shandong Province, China. Front. Environ. Sci. 10, 8. doi:10.3389/fenvs.2022.824254
Liu, Y., Zhao, C., Liu, X., Chang, Y., Wang, H., Yang, J., et al. (2021). The multi-dimensional perspective of ecological security evaluation and drive mechanism for Baishuijiang National Nature Reserve, China. Ecol. Indic. 132, 108295. doi:10.1016/j.ecolind.2021.108295
Luo, Y., Zhu, Z., Wu, J., Zhang, Y., Li, X., Zhao, W., et al. (2022). Exploring habitat patch clusters based on network community detection to identify restored priority areas of ecological networks in urban areas. Urban For. Urban Green. 78, 127771. doi:10.1016/j.ufug.2022.127771
Möckel, S. (2017). The European ecological network “Natura 2000” and the appropriate assessment for projects and plans under Article 6(3) of the Habitats Directive. Nat. Conserv. 23, 1–29. doi:10.3897/natureconservation.23.13599
Nie, W., Shi, Y., Siaw, M. J., Yang, F., Wu, R., Wu, X., et al. (2021). Constructing and optimizing ecological network at county and town Scale: The case of Anji County, China. Ecol. Indic. 132, 108294. doi:10.1016/j.ecolind.2021.108294
Padró, R., La Rota-Aguilera, M. J., Giocoli, A., Cirera, J., Coll, F., Pons, M., et al. (2020). Assessing the sustainability of contrasting land use scenarios through the Socioecological Integrated Analysis (SIA) of the metropolitan green infrastructure in Barcelona. Landsc. Urban Plan. 203, 103905. doi:10.1016/j.landurbplan.2020.103905
Peng, J., Pan, Y., Liu, Y., Zhao, H., and Wang, Y. (2018). Linking ecological degradation risk to identify ecological security patterns in a rapidly urbanizing landscape. Habitat Int. 71, 110–124. doi:10.1016/j.habitatint.2017.11.010
Peng, W., Zhang, Z., He, G., Liu, X., Wang, W., Cai, Y., et al. (2022). Integrating potential land use conflict into ecological security pattern in response to land use/cover changes at a county scale in yangtze river delta, China. Front. Earth Sci. 10, 535. doi:10.3389/feart.2022.875433
Raji, S. A., Odunuga, S., and Fasona, M. (2022). Spatially explicit scenario analysis of habitat quality in a tropical semi-arid zone: Case study of the sokoto–rima basin. J. Geovisualization Spatial Analysis 6 (1), 11. doi:10.1007/s41651-022-00106-0
Rong, T., Zhang, P., Zhu, H., Jiang, L., Li, Y., and Liu, Z. (2022). Spatial correlation evolution and prediction scenario of land use carbon emissions in China. Ecol. Inf. 71, 101802. doi:10.1016/j.ecoinf.2022.101802
Shen, Z., Wu, W., Chen, S., Tian, S., Wang, J., and Li, L. (2022). A static and dynamic coupling approach for maintaining ecological networks connectivity in rapid urbanization contexts. J. Clean. Prod. 369, 133375. doi:10.1016/j.jclepro.2022.133375
Streib, L., Kattwinkel, M., Heer, H., Ruzika, S., and Schäfer, R. B. (2020). How does habitat connectivity influence the colonization success of a hemimetabolous aquatic insect? - a modeling approach. Ecol. Model. 416, 108909. doi:10.1016/j.ecolmodel.2019.108909
Su, K., Yu, Q., Yue, D., Zhang, Q., Yang, L., Liu, Z., et al. (2019). Simulation of a forest-grass ecological network in a typical desert oasis based on multiple scenes. Ecol. Model. 413, 108834. doi:10.1016/j.ecolmodel.2019.108834
Su, Y., Chen, X., Liao, J., Zhang, H., Wang, C., Ye, Y., et al. (2016). Modeling the optimal ecological security pattern for guiding the urban constructed land expansions. Urban For. Urban Green. 19, 35–46. doi:10.1016/j.ufug.2016.06.013
Tang, Y., Tang, J., Yu, X., Qiu, L., Wang, J., Hou, X., et al. (2022). Land ecological protection polices improve ecosystem services: A case study of lishui, China. Front. Environ. Sci. 10, 1661. doi:10.3389/fenvs.2022.973524
Wan, H. Y., Cushman, S. A., and Ganey, J. L. (2019). Improving habitat and connectivity model predictions with multi-scale resource selection functions from two geographic areas. Landsc. Ecol. 34 (3), 503–519. doi:10.1007/S10980-019-00788-W
Wang, S., Zhang, X., Wu, T., and Yang, Y. (2019). The evolution of landscape ecological security in Beijing under the influence of different policies in recent decades. Sci. Total Environ. 646, 49–57. doi:10.1016/j.scitotenv.2018.07.146
Wang, T., Li, H., and Huang, Y. (2021). The complex ecological network’s resilience of the Wuhan metropolitan area. Ecol. Indic. 130, 108101. doi:10.1016/j.ecolind.2021.108101
Wang, Y., Liao, J., He, Y., and Chen, P. (2022). Evolution and ecological implications of land development and conservation patterns on the Qinghai-Tibet Plateau. Land 11 (10), 1797. doi:10.3390/land11101797
Wang, Y., and Pan, J. (2019). Building ecological security patterns based on ecosystem services value reconstruction in an arid inland basin: A case study in ganzhou district, NW China. J. Clean. Prod. 241, 118337. doi:10.1016/j.jclepro.2019.118337
Wei, L., Zhou, L., Sun, D., Yuan, B., and Hu, F. (2022). Evaluating the impact of urban expansion on the habitat quality and constructing ecological security patterns: A case study of jiziwan in the Yellow River basin, China. Ecol. Indic. 145, 109544. doi:10.1016/j.ecolind.2022.109544
Wen, J., and Hou, K. (2021). Research on the progress of regional ecological security evaluation and optimization of its common limitations. Ecol. Indic. 127, 107797. doi:10.1016/j.ecolind.2021.107797
Yang, D., Lou, Y., Zhang, P., and Jiang, L. (2022a). Spillover effects of built-up land expansion under ecological security constraint at multiple spatial scales. Front. Ecol. Evol. 10, 460. doi:10.3389/fevo.2022.907691
Yang, D., Zhang, P., Jiang, L., Zhang, Y., Liu, Z., and Rong, T. (2022b). Spatial change and scale dependence of built-up land expansion and landscape pattern evolution—case study of affected area of the lower Yellow River. Ecol. Indic. 141, 109123. doi:10.1016/j.ecolind.2022.109123
Zhang, J., Zhu, H., Zhang, P., Song, Y., Zhang, Y., Li, Y., et al. (2022). Construction of gi network based on mspa and plus model in the main urban area of zhengzhou: A case study. Front. Environ. Sci. 10, 402. doi:10.3389/fenvs.2022.878656
Zhang, P., Yang, D., Qin, M., and Jing, W. (2020). Spatial heterogeneity analysis and driving forces exploring of built-up land development intensity in Chinese prefecture-level cities and implications for future Urban Land intensive use. Land Use Policy 99, 104958. doi:10.1016/j.landusepol.2020.104958
Zhou, L., Dang, X., Mu, H., Wang, B., and Wang, S. (2021). Cities are going uphill: Slope gradient analysis of urban expansion and its driving factors in China. Sci. Total Environ. 775, 145836. doi:10.1016/j.scitotenv.2021.145836
Keywords: land use, ecological security, spatial pattern, MCR, arid region
Citation: Chen Z, Chen H, Yang M, Wang X, Jiang Y and Zhang W (2023) Heterogeneity and optimization of ecological security pattern on a mountain town: A case of Tianzhu County in the Hexi Corridor, China. Front. Environ. Sci. 10:1106379. doi: 10.3389/fenvs.2022.1106379
Received: 23 November 2022; Accepted: 19 December 2022;
Published: 10 January 2023.
Edited by:
Pengyan Zhang, Henan University, ChinaCopyright © 2023 Chen, Chen, Yang, Wang, Jiang and Zhang. This is an open-access article distributed under the terms of the Creative Commons Attribution License (CC BY). The use, distribution or reproduction in other forums is permitted, provided the original author(s) and the copyright owner(s) are credited and that the original publication in this journal is cited, in accordance with accepted academic practice. No use, distribution or reproduction is permitted which does not comply with these terms.
*Correspondence: Hong Chen, Y2hlbnBsYW5AMTI2LmNvbQ==
Disclaimer: All claims expressed in this article are solely those of the authors and do not necessarily represent those of their affiliated organizations, or those of the publisher, the editors and the reviewers. Any product that may be evaluated in this article or claim that may be made by its manufacturer is not guaranteed or endorsed by the publisher.
Research integrity at Frontiers
Learn more about the work of our research integrity team to safeguard the quality of each article we publish.