 Maomao Zhang
 Ziyi Zhang2*
 Bing Ren
 Xuehan Lin
- 1College of Public Administration, Huazhong University of Science and Technology, Wuhan, China
- 2School of Public Administration, Zhongnan University of Economics and Law, Wuhan, China
- 3College of Tourism, Taishan University, Taian, China
- 4College of Economics and Management, Baoshan University, Baoshan, China
- 5School of Public Administration, Central China Normal University, Wuhan, China
The rapid and disorderly expansion of urban construction land has exacerbated the contradiction between land use and low-carbon development. In this paper, we use the spatial autocorrelation model and coupling model to analyze the spatial characteristics of the coupled coordination degree of land transfer and carbon emissions in 291 cities in China. The multi-scale geographically weighted regression (MGWR) model is used to explore the spatial heterogeneity of the influence of socioeconomic factors on their coupled coordination degree. The results show that: from 2005 to 2015, the scale of land transfer and carbon emissions has been increasing quantitatively and spatially showing a shift from the southeast coast to the central and western regions. In 2005, 2010, and 2015, the global Moran’s I of the coupled coordination degree are 0.3045, 0.3725, and 0.3388, respectively, indicating that the coupled coordination degree between land transfer and carbon emissions has a significant positive spatial autocorrelation. The MGWR model indicates that the influence of socioeconomic factors on the coupling coordination degree has significant spatial heterogeneity at different time nodes. In 2005 and 2015, the coefficients of the NGR on the coupling coordination of land transfer and carbon emissions have obvious stratification characteristics, with the coefficients decreasing from northeast to southwest. In 2010, the high coefficient (0.924∼0.989) of GPC is mainly distributed in the central region. The coefficient of the PD ranges from 0.464 to 0.918, but the difference of influence degree between the southeast coast and the northwest is obvious. This study may provide new clues for sustainable urban development and carbon reduction.
1 Introduction
To mitigate global warming and ensure the sustainable development of human civilization, it has become a global consensus to make reasonable emission reduction of carbon dioxide and other greenhouse gases (Arneth et al., 2017; Bhan et al., 2021; Tan et al., 2021b; Zhang et al., 2022a). The solution to the carbon emission problem inevitably requires the intervention of governmental entities, and the effect of the governmental intervention will directly affect the achievement of the carbon emission control target or not (Akbari et al., 2016; Chen M et al., 2016; Demuzere et al., 2014). To mitigate this global warming situation, cumulative carbon emissions must be controlled through the cooperation of all countries to achieve the goal of limiting the warming rate to 1.5°C (Broto, 2017; Cox et al., 2018; Zhang et al., 2022b). In this context, the Chinese government has set the goal of reaching peak CO2 emissions by 2030 and achieving carbon neutrality by 2060 (Luyssaert et al., 2014; He, 2018). It is committed to ensuring sustainable national development while promoting global climate cooperation and governance (Bokaie et al., 2016; He, 2019; Ren et al., 2022). Under the realistic scenario of severe carbon emission situation and local responsibility for emission reduction targets, local governments, as land suppliers and responsible parties for carbon emission reduction, have paid attention to intervene in carbon emissions through multi-dimensional land policies (Ou et al., 2013; Lai et al., 2016; Arneth et al., 2017; Zhang et al., 2022e). It is estimated that optimizing the land use structure can make a significant contribution of 27.6% to the carbon emission reduction of 40%–45% per unit of GDP by 2020 (Kalnay and Cai, 2003; Kotharkar and Bagade, 2018; Chen et al., 2022). As a basic production factor and spatial carrier, land has become an important way to achieve carbon emission reduction. The land transfer of local governments directly affect the scale or structure of regional industrial development, which in turn is reflected in the total amount or intensity of regional industrial carbon emissions (Derkzen et al., 2017; Luo et al., 2021; Liu et al., 2022; Zhu et al., 2022).
Studies show that urban areas consume more than 60%–80% of the world’s energy and emit more than 70% of the world’s greenhouse gases, so the urban problem is accompanied by the carbon emission problem (Broto, 2017; Cai et al., 2021; Gong et al., 2022). Optimizing the urban land use structure can effectively control and reduce carbon emissions, and it is an important tool worthy of consideration by land managers and policymakers (Coseo and Larsen, 2014; Zhang et al., 2022c; Fu et al., 2022). How to control the effective construction of land in friendly coordination with environmental protection is an important issue currently faced. Unlike other countries, China’s urbanization process is mostly dominated by land transfer, where the government grants land use rights to facilitate the rapid development of urbanization (Liu et al., 2018; Zhang et al., 2022d). Therefore, a reasonable control of land transfer can effectively control carbon emissions and effectively mitigate the climate and global atmospheric environment. As the world’s second largest economy and the number one emitter of greenhouse gases, the Chinese government is under tremendous pressure to reduce carbon emissions (Deng et al., 2017; Huo et al., 2020; Gong et al., 2022). With the shift of China’s economy from the stage of high growth to the stage of high quality development, the effect of carbon emissions from land use has become the focus of academic circles (Zhang et al., 2018; Wang et al., 2020).
Scholars have conducted preliminary explorations on the carbon emission effects brought about by the marketization of land transfer (Zhang and Xu, 2017; Cao et al., 2022). These studies are mainly based on multidimensional theoretical perspectives such as overall land use planning, land supply, land transfer intervention, land use structure and intensity, and land intensification or expansion (Houghton et al., 2012; Chen et al., 2014; Chen et al., 2019; Fei et al., 2021; Gong et al., 2022). The impact of land use on carbon emissions has been explored in two major directions: land use change and land management change (Zhang and Xu, 2017; Long and Qu, 2018; Yu et al., 2019). Some studies argue that local governments attract investment through lenient land transfer policies, attracting polluting enterprises and duplication of production capacity (Lai et al., 2016; Houghton and Nassikas, 2017), and generating large amounts of energy consumption and pollution emissions (Zhang et al., 2020; Nathaniel and Adeleye, 2021; Yang et al., 2022). This model of “land for development” promotes economic benefits but also leads to the loss of environmental benefits, especially carbon emissions (Huang and Li, 2022; Wang M. et al., 2022a). Some studies showed a significant inverse mitigation effect of land marketization on carbon emissions based on panel data econometric models (Liu et al., 2014; Jin et al., 2019; Lu et al., 2020; Zhang and Zhang, 2022). The level of land marketization shows a more significant negative relationship with land use carbon emissions. Many scholars believed that the impact of land grant marketization on industrial structure to the threshold effect and crowding out effect, and further investigate the impact on green total factor productivity and carbon emissions by using this as a mediator (Deng et al., 2017; Cheng et al., 2018; Ge et al., 2019; Zhou et al., 2020). Studies showed that increasing the marketization of land transfer and promoting the upgrading of industrial structure will effectively serve the goal of “carbon peaking” and “carbon neutrality” (Li et al., 2019; Huo et al., 2021; Ma et al., 2021).
On the whole, these researches can be basically divided into two categories, one is mainly based on the urban ontology problem to propose the impact of urban land use on carbon emission and some land use optimization measures (Li et al., 2012; Chen Y. et al., 2016; Ahmad et al., 2021; Zhang et al., 2022e). The other category mainly reflects the analysis and explanation of carbon emission and land and land-related elements, and finally proposes a solution for the deterioration of carbon emission problem (Lai et al., 2016; Arneth et al., 2017; Tan et al., 2021b; Zhang et al., 2022f). The above studies provide insights into the multi-layered influence effects and transmission mechanisms between land transfer and carbon emissions (Lu et al., 2020; Kan, 2021; Yang et al., 2021). However, the theoretical assumption of a simple correlation between the two actually conceals the deeper inhibitory paths, and it is difficult to implement specific measures to control the carbon emission effect of land transfer market, which makes the study lack a certain theoretical depth and practical significance (Zhang M. et al., 2019; Wang et al., 2020; Zhang et al., 2022c). In addition, most of the studies simply discuss the relationship between the two systems, but do not explore the coupling coordination degree of the two systems, and ignore the influencing factors that affect the coupling coordination degree, which makes it difficult to promote the coordinated development of urban economy and environmental protection (He et al., 2017; Ariken et al., 2021).
In view of this, this paper explores the coupled coordination relationship between land transfer and carbon emissions through a coupled coordination model based on land transfer data, carbon emissions and related socio-economic data of 291 prefecture-level cities in China from 2005 to 2015. The multi-scale geographically weighted regression (MGWR) model is also used to explore the influence of socio-economic factors on the coupling coordination degree. The possible innovations of this paper are as follows: first, using ArcGIS v10.2 to analyze the spatio-temporal characteristics of land transfer and carbon emissions in 291 cities in China from 2005 to 2015. Second, the coupling coordination degree between the two systems of land transfer and carbon emission is calculated using the coupling coordination degree model. Thirdly, the spatio-temporal evolution pattern of the coupling coordination is analyzed by spatial autocorrelation model. Finally, this work takes into account the vast area of China and the large differences in regional economic development, and uses geographically weighted regression (GWR) and MGWR models to compare and analyze the influence of socioeconomic factors on the spatial heterogeneity of the coupling coordination degree. This article discusses the spatial and temporal coupling of land transfer and carbon emissions, as well as their spatial heterogeneity and influencing factors, which can provide a theoretical basis for realizing the coupled synergy of economic and environmental benefits of land resources, and complement and improve the realization path of carbon emission reduction.
2 Data sources
The study area consists of 291 urban administrative areas in Mainland China. However, due to the lack of relevant data acquisition, the research unit does not include China’s Tibet Autonomous Region, Hong Kong Special Administrative Region, Macao Special Administrative Region, and Taiwan Province. The regional carbon emission data of each city in China comes from the China Carbon Accounting Database (CEADs, China Emission Accounts and Datasets, http://www.ceads.net/data/). The land transfer data comes from China Land Market Network (https://www.landchina.com/). With reference to existing studies and the availability of information (Ge et al., 2019; Zhang et al., 2022c), the article selects five indicators of GDP per capita, natural population growth rate, population density, share of secondary industry in GDP, and public green space area to explore the spatial heterogeneity and influence mechanism of the coupled coordination degree of land grant and carbon emission based on multi-scale geographically weighted regression model. The statistics of the indicators are shown in Table 1. These data are obtained from the “China Statistical Yearbook (2006–2016)” and the corresponding city’s historical statistical yearbook.
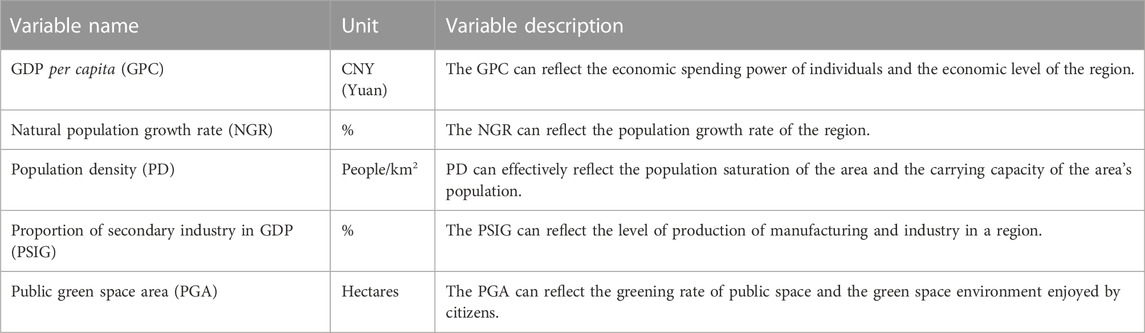
TABLE 1. Variable names and detailed descriptions.
3 Research methods
3.1 Spatial coupling coordination model
The coupling of urban land transfer and carbon emission is a dynamic development process of urban social and economic development demand redistribution in both quantity and space, which reflects the characteristics of different stages of socio-economic transformation (Wu et al., 2018; Dong et al., 2019). There is a coupled interaction between land use structural change and carbon emission that promotes and coerces each other. In this paper, we study the coupling degree of land system and carbon emission system, and use the land transfer area and carbon emission to represent the level of urban land system and carbon emission system respectively. Coupling degree refers to the phenomenon that two or more systems are influenced by each other by various interactions between themselves and the outside world (Fan et al., 2019). The formula of coupling degree can be expressed as follows.
Where
Although the coupling degree can reflect the degree of interaction between urban land transfer and carbon emissions, it cannot characterize whether the two are mutually reinforcing at a high level or constraining at a low level (Li et al., 2012). Therefore, this paper introduces the coupled coordination model to discuss the coupled coordination relationship between land transfer and carbon emission. The degree of coupling coordination is the degree of harmony between land transfer and carbon emission in the development process, and the larger the value of coupling coordination, the stronger the coupling coordination (Ge et al., 2019; Xiao et al., 2022). The formulas are as follows.
Where
3.2 Spatial autocorrelation
The spatial correlation of carbon emissions is measured by Moran’s I index, which is divided into a global Moran’s I index and a local Moran’s I index (Kumar et al., 2013; Zhang et al., 2022a). The global Moran’s I index can be used to study the spatial correlation of carbon emissions in the whole region, and the local Moran’s I index can be used to study the spatial correlation of the coupling coordination between land transfer and carbon emissions between each city and its neighboring areas. The formula for the global Moran’s I index is as follows (Zhang X. et al., 2019).
Where i is the global Moran’s I index,
The formula for the local Moran’s I index is as follows.
Where
3.3 Geographically weighted regression model
GWR model is a method by Fotheringham et al. that adds the geographic location of the data to the regression parameters based on the traditional least squares (OLS) model, while considering the spatial weights of neighboring points, allowing geostatistical methods for local parameter estimation (Wang and Zhang, 2018; Liu et al., 2019). To set the explanatory variables and allow the parameters to vary spatially, GWR assumes a non-smooth relationship between the response variables (Wang Q. et al., 2022). In this paper, GWR is used to describe the spatial heterogeneity of factors influencing the coupled coordination of land transfer and carbon emissions with the following equation. Therefore, the model estimates the local parameters for each location separately with the following equations.
Where
The estimation of the regression coefficients obtained using the partially weighted least squares correction model (6) is shown in Eq. 7.
Where
3.4 Multi-scale geographically weighted regression
The MGWR model is developed on the basis of the GWR model (Kumar et al., 2012). It remodels the traditional geographic weighted regression model GWR into a general additive model (GAM) and extended this framework to MGWR to obtain the standard error of local parameter estimates (Guo et al., 2021; Rong et al., 2022). The MGWR model can derive bandwidth and smoothing coefficients for each covariate separately, fit between traditional global models and adjust multiple assumptions inspection. The formula is as follows.
Where
4 Results and analysis
4.1 Spatial and temporal characteristics of carbon emissions
We used ArcGIS v10.2 natural breakpoint classification tool to classify the scale of carbon emissions into five classes (Figure 1). Figure 1 shows the carbon emissions are mainly concentrated in the eastern coastal areas such as Shanghai, Jiangsu Province, and Zhejiang Province. With the passage of time, the center of gravity of carbon emissions began to spread from the southeast coastal areas to the central and western regions, which coincided with the transfer trajectory of land transfers, which explained to a certain extent the strong correlation between carbon emissions and land transfers. In 2005 (Figure 1A), although the center of carbon emissions was in the Northeast, Shanghai, the eastern coastal city with the highest carbon emissions (170.761 mt), and the lowest carbon emissions city, Sanya, Hainan Province (1.723 mt). This may be due to the highly developed socio-economic level of Shanghai, the level of urbanization is also at the forefront of the country, the population density is relatively high, and the flow of vehicles and people are large, so carbon emissions rank first in the country. Sanya City in Hainan Province is a tourist city with relatively low carbon emissions. Figure 3B shows that the largest city in terms of carbon emissions in 2010 is still Shanghai, with an increase of 25.99% compared to 2005. Sanya, Hainan Province, has the lowest carbon emissions, with an increase of 37.78% compared to 2005. Figure 1C shows the city with the most carbon emissions in China in 2015 was still Shanghai (189.981 mt), but it was 17.65% less than in 2010 (230.712 mt). The city of second largest carbon emission is Chongqing (140.741 mt). The carbon emissions are the least in Bazhong City (4.3047 mt), but compared to the carbon emissions in Sanya in 2010, it has increased by 35.66%.
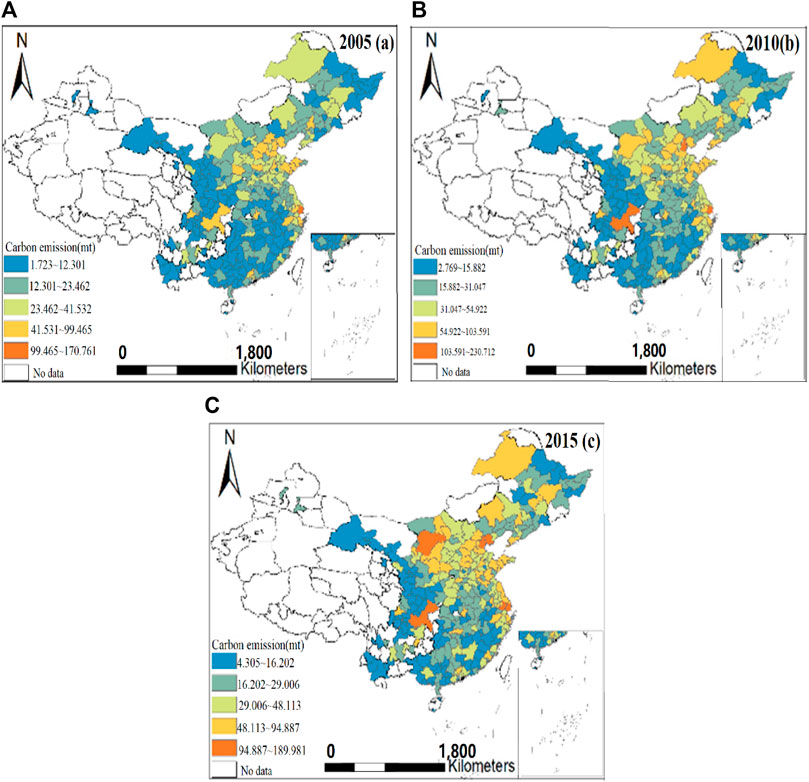
FIGURE 1. Carbon emissions; (A) for 2005, (B) for 2010, (C) for 2015.
4.2 Spatial and temporal characteristics of land transfer
Using the natural breakpoint method in ArcGIS v10.2, the scale of land transfer was divided into five classes (Figure 2). Figure 2A shows that most of the land transfer area was the southeastern coastal cities, and the Yangtze River Delta urban agglomeration performed most prominently in 2005. For example, the area of land transfer in Hangzhou, Zhejiang Province reached 8,596.413 ha, and the area of land transfer in Shanghai was 6,783.594 ha. Compared with 2005, the area of land transfer in major cities across the country increased significantly in 2010 (Figure 2B). However, the cities with larger transfer areas are still concentrated in the Yangtze River Point City Group. The city with the largest land transfer area is Lishui City with 8,912.532 ha, followed by Chengdu City in Sichuan Province, with a transfer area of 8,347.634 ha, and Chaozhou City, Guangdong Province with the least land transfer area (40.481 ha). Figure 2C reveals that the focus of land transfer has shifted from the southeast coast to the central and western regions, and the increase in the area of land transfer in the central and western regions has increased significantly in 2015. This is probably because the eastern coastal cities are economically developed and have a greater need for land transfers as urbanization continues to accelerate. However, with the implementation of the country’s “Rise of Central China” and “Western Development” strategy, the social and economic development of the central and western regions has accelerated significantly in 2010. The acceleration of the process of industrialization and urbanization in central and western cities has put forward higher requirements for land transfer, and the area of land transfer has increased rapidly.
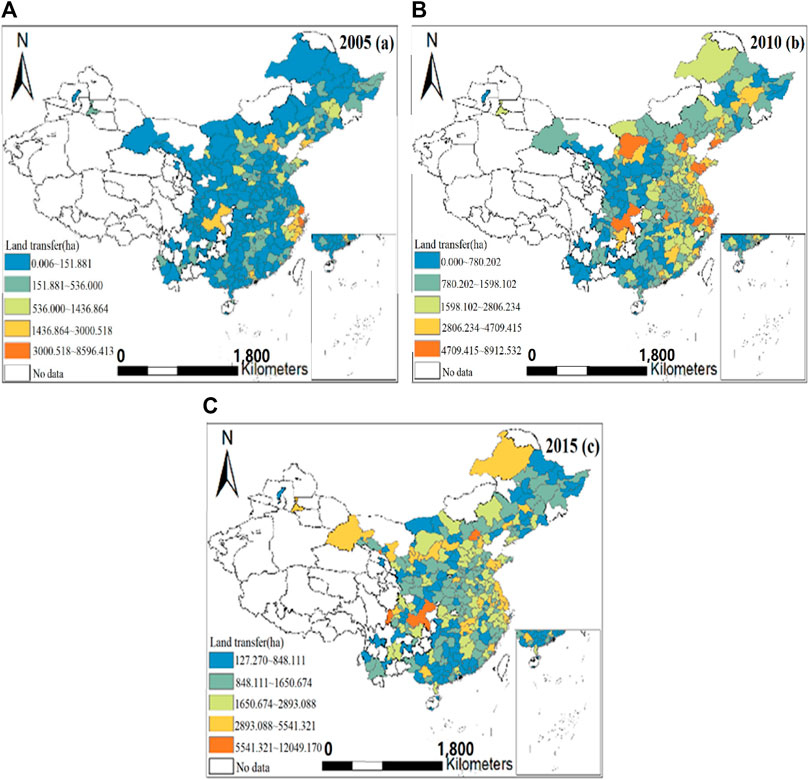
FIGURE 2. Land transfer area; (A) for 2005, (B) for 2010, (C) for 2015.
4.3 Analysis of coupling coordination
To further analyze the degree of coupling and coordination between land transfer area and carbon emissions, we divide the degree of coupling and coordination into four types: low coordination stage, medium coordination stage, high coordination stage and higher coordination stage (Figure 3). Figure 3 shows that the spatial distribution of the coupling coordination degree of land transfer area and carbon emissions is consistent with the spatial distribution of land transfer area and carbon emissions. The high-value areas of carbon emissions have a high degree of coupling and coordination, which may be due to the more developed socio-economics in these areas, the accelerating urbanization process, and the increasing energy consumption, leading to increased carbon emissions and intensified urban land expansion. In 2010 (Figure 4A), except for Shanghai which was in the high coordination stage, all others were in the middle and low coordination stage. In 2010 (Figure 4B), there were three cities in the middle coordination stage, and in 2015 (Figure 4C) there were 17 cities were in the middle coordination stage. The high degree of coupling and coordination in Shanghai may be due to the optimization and upgrading of its industrial structure, which has gradually shifted its industry from “two-three-one” to “three-two-one.” The modern service industry gradually replaced the traditional service industry, and the high-end manufacturing industry replaced the traditional manufacturing industry. Therefore, the efficiency of land use increased, the carbon emission intensity decreased, and the coordinated development of urban land and carbon emissions.
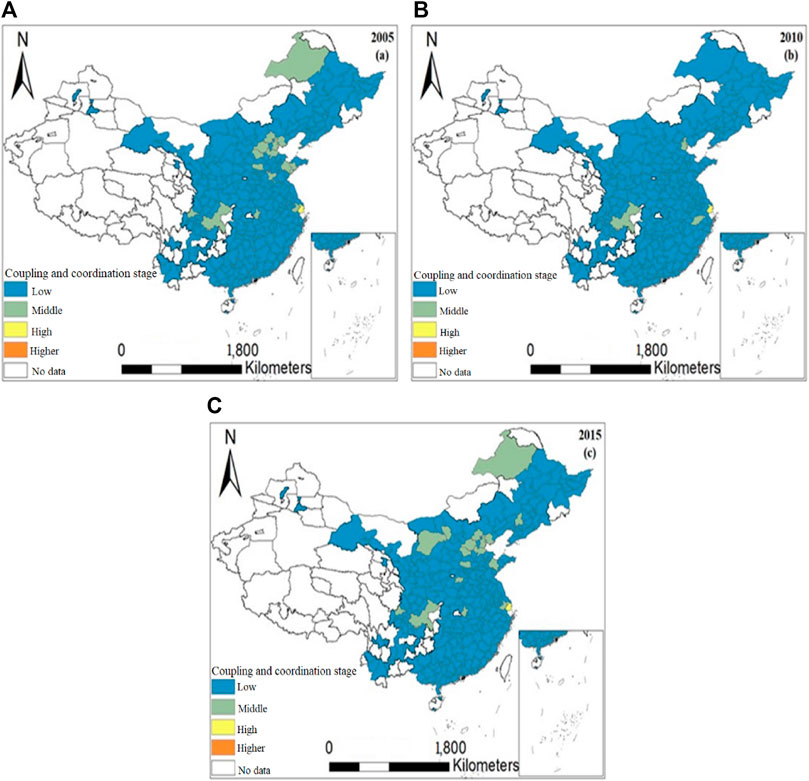
FIGURE 3. Spatial distribution of the coupling coordination degree; (A) for 2005, (B) for 2010, (C) for 2015.
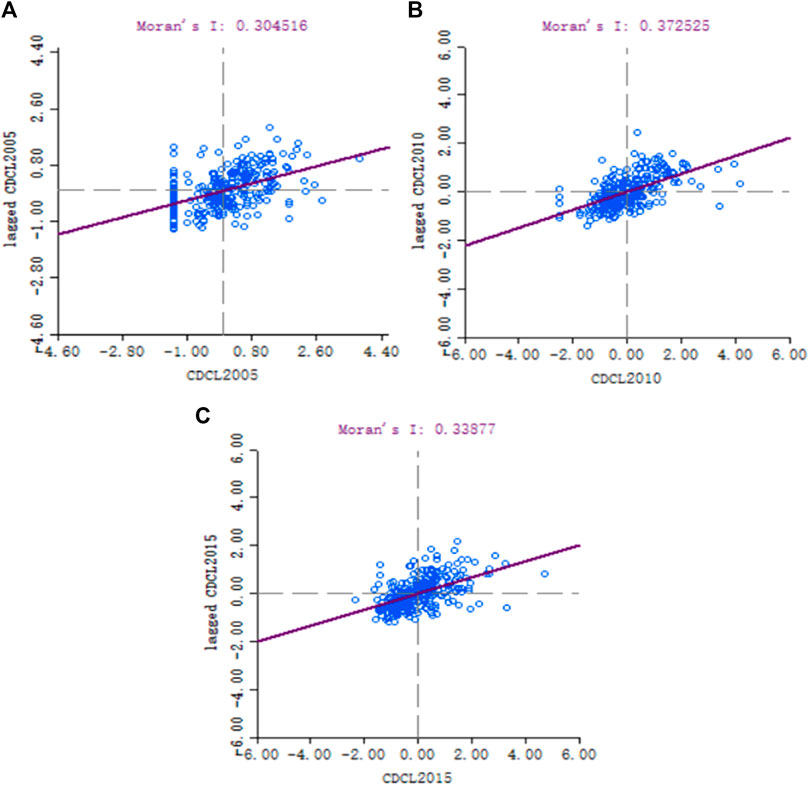
FIGURE 4. Moran scatter plot of the coupling coordination; (A) for 2005, (B) for 2010, (C) for 2015.
4.4 Spatial autocorrelation analysis
The spatial correlation of the coupled coordination degree of land transfer and carbon emissions was tested by calculating the global Moran’s I. The global Moran’s I of the coupling coordination degree of land transfer and carbon emissions in Chinese cities in 2005, 2010, and 2015 were calculated to be positive, and all passed the 95% significance level test. Table 2 and Figure 4 reveal a significant positive spatial autocorrelation (clustering of high values or clustering of low values) for the coupling coordination degree of land transfer and carbon emissions at the national level, indicating a significant clustering phenomenon in the distribution of the coupling coordination degree of land transfer and carbon emissions. In addition, the global Moran’s I of the coupled coordination degree were 0.3045, 0.3725, and 0.3388 in 2005, 2010, and 2015, respectively, showing an obvious inverted “U” shape trend. This reflects that the spatial clustering effect of land transfer and carbon emission coupling coordination is fluctuating increasing from 2005 to 2015. This work further indicates that the spatial distribution of the coupled land grant and carbon emission coordination degree has obvious characteristics of “high-high clustering” or “low-low clustering.”
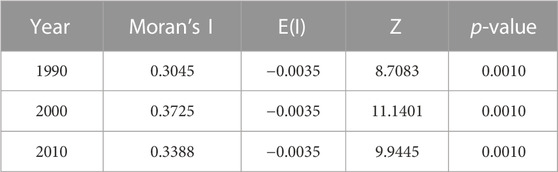
TABLE 2. Global spatial autocorrelation tests.
4.5 Detection of factors influencing coupling coordination
4.5.1 Comparative analysis of models
Table 3 shows that the goodness of fit R2 of the MGWR is higher than that of the GWR, and the value of the AICc is lower than the GWR. From this, it can be judged that the result of the MGWR is better than that of classical GWR. In terms of the number of effective parameters (NEP), the MGWR is smaller and the residual sum of squares (RSS) is also smaller, indicating that it uses fewer parameters to obtain a regression result closer to the true value. On the other hand, from the overall regression coefficients, the coefficients of the MGWR are significant on the whole, while the coefficients of the GWR except the constant term are not significant on the whole. This also shows that the GWR may have ignored the diversification of the scales of various variables, resulting in a lot of noise and bias in the regression coefficients, which in turn led to the instability of the regression coefficients. Therefore, at least based on the analysis results of this case, it is found that the MGWR model is better than the GWR model.
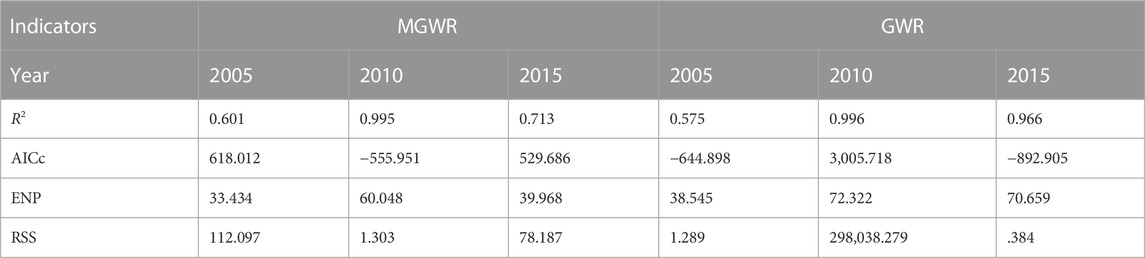
TABLE 3. Statistics of GWR and MGWR model indicators.
4.5.2 Scale variability analysis of the model
Table 4 reveals that the MGWR model can directly reflect the differentiating scales of different variables, while the classic GWR model can only reflect the average of the scales of each variable. Specifically, all variables in the GWR model in 2005, 2010 and 2015 correspond to the same. The scale of action of MGWR’s variables is different. In 2005 and 2015, the bandwidths of GPC, PSIG and NGP were 280, 280, 242 and 271, 271, 215, respectively. In 2010, the bandwidth of PD was 259. We believe that these three variables have a significant impact on the coupling degree of carbon emissions and land sales. The impact on the global scale of the second level, that is, there is basically no impact of spatial heterogeneity, and these variables have basically the same impact on the degree of coupling in the corresponding year. In 2005, the PGA loan was 120, which can be considered to have a community-scale impact and there is a large spatial heterogeneity. The bandwidth of the PD in 2005 was 64, the bandwidth of CGP, NGP, PSIG, and PGA in 2010 and the bandwidth of PD and PGA in 2015 were not more than 50. Their scale of action is small, close to the street scale. This shows that the variation of variables with time has a large difference in space, and has a large spatial heterogeneity effect on the degree of coupling.
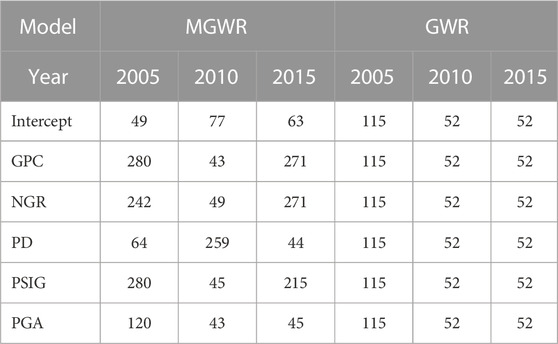
TABLE 4. GWR and MGWR model bandwidth.
4.5.3 The spatial pattern of the coefficients of the MGWR model
The statistical description of the coefficients of each variable estimated by the MGWR model is shown in Table 5 and Figure 5. Figures 5A,I revealed the influence coefficients of the NGR on the coupling coordination degree of land transfer and carbon emissions have obvious hierarchical characteristics, and the coefficients decrease from northeast to southwest. In 2005, the NGR had a negative impact on the degree of coupling and coordination, indicating that the higher the natural population growth rate, the smaller the impact on the degree of coupling and coordination. The influence coefficient of NGR in the north of China is between 0.019 and 0.027, while the coefficient in the south is between 0.062 and 0.079. In 2010 (Figure 5E), NGR had a strong spatial heterogeneity impact on the coupling and coordination of land transfer and carbon emissions. The high value areas of the coefficient (0.013∼0.054) are mainly distributed in the northeast and some western cities. However, the NGR influence coefficients of the Pearl River Delta urban agglomeration and the Yangtze River Delta urban agglomeration were relatively small, ranging from −0.068 to −0.042. It may be because the region’s economy is developing well and the population is relatively concentrated, but basically all belong to the migrant population, and the natural growth rate of the local population is relatively low.
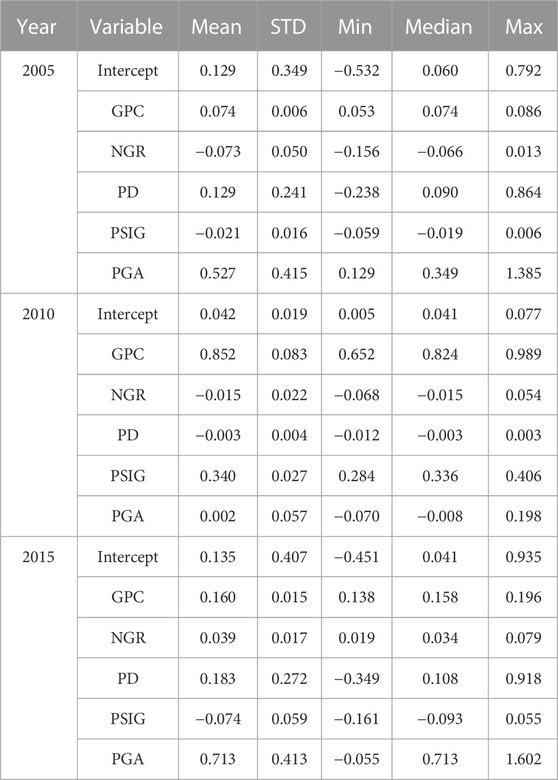
TABLE 5. Coefficient statistics of the MGWR model.
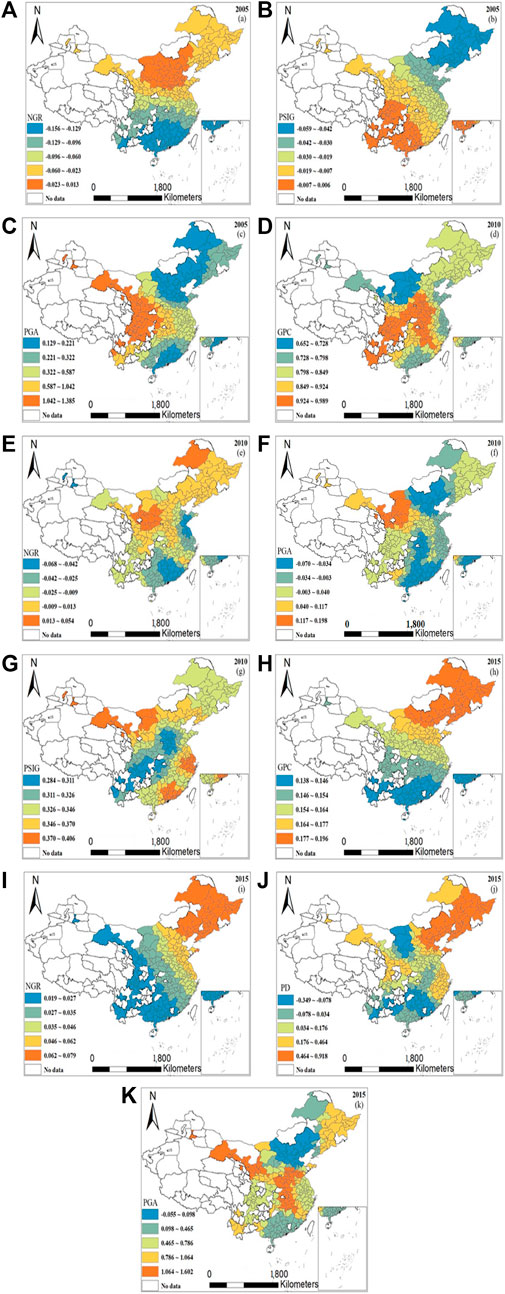
FIGURE 5. Spatial distribution of variable coefficients of the MGWR. (A) for NGR (2005), (B) for PSIG (2005), (C) for PGA (2005), (D) for GPC (2010), (E) for NGR (2010), (F) for PGA (2010), (G) for PSIG (2010), (H) for GPC (2015), (I) for NGR (2015), (J) for PD (2015), (K) for PGA (2015).
Figures 5C,F,K show that the impact coefficient of PGA on the coordination of land transfer and carbon emission coupling increases over time, the high coefficient area gradually evolves from zonal to clustered, and the low coefficient area gradually decreases. In 2005 (Figure 5C), cities in areas with high coefficients (1.042∼1.385) of the PGA were basically distributed in the northwest and central regions. This may be due to the low level of urbanization in the region, the relatively small area of public green space in the total urban area, and the high degree of fragmentation, so it has a greater impact on the coordination of land transfer and carbon emissions. From 2010 (Figure 5K) and 2015 (Figure 5F), we found that the PGA of most of the central regions and some southeast coastal city clusters has generally low impact coefficients on the coupling coordination degree, such as Hunan Province, Hubei Province, Henan Province, and the Yangtze River Delta and the Pearl River Delta.
Figure 5D shows that the GPC has strong spatial heterogeneity impact on the coupling and coordination of land transfer and carbon emissions in 2010. In general, the high coefficient (0.924∼0.989) of the GPC was mainly in the central region and gradually decreases to the surrounding cities. The main reason is that the central region is dominated by real estate development and industrial processing and manufacturing. There is a large demand for land transfer area, and the development of traditional manufacturing will obviously increase carbon emissions. This will directly or indirectly affect the degree of coupling and coordination between carbon emissions and land sales. In 2015 (Figure 5H), the impact coefficient of the GPC on the coupling coordination degree showed an obvious hierarchical distribution feature, with the coefficient gradually decreasing from northeast to southwest. The coefficient of the GPC in the northeastern region ranges from 0.177 to 0.196, and the coefficient in the southwest region ranges from 0.138 to 0.146. Most cities in northern of China are dominated by traditional resource mining industries such as steel and coal, while the south is dominated by industrial manufacturing. To this extent, it determines the difference between regional land transfer and carbon emission needs, so it has obvious regional characteristics of the coordination degree of land transfer and carbon emission coupling.
Figure 5J shows that the PD has strong spatial heterogeneity impact on the coupling and coordination of land transfer and carbon emissions. Compared with the northeast region, the population density is relatively small and sparse, on the contrary, it has a greater impact on the coordination degree of land transfer and carbon emission coupling, and the coefficient ranges from 0.464 to 0.918. The impact of population density on the degree of coupling and coordination is relatively small in northeast China, with a coefficient between 0.176 and 0.464. The relatively underdeveloped areas in the northwest and southwest have low population density, which has a negative impact on the coupling and coordination of land transfer and carbon emissions, with a coefficient between −0.349 and −0.078.
Figures 5B,G show that the impact of the PSIG on the coupling and coordination of land transfer and carbon emissions has a certain timeliness and spatial location. Figure 5B shows that the coefficient of the PSIG has obvious zonal distribution characteristics, showing a negative influence relationship in 2005, and the degree of influence increases from the southwest to the northeast of China. Figure 5G shows that the influence of the PSIG on the coupling coordination of land grant and carbon emission shows a shifting characteristic, and the high coefficient gradually shifts to the southeast coastal cities, and a positive influence relationship appears in 2010. Most of these cities with low coefficients are located in the west of China, with coefficients ranging from 0.284 to 0.311.
5 Conclusion and discussion
This paper analyzes the spatio-temporal characteristics of land transfer and carbon emissions and their coupling coordination characteristics in 291 cities in China from 2005 to 2015. The GWR and MGWR models are used to explore the spatial autocorrelation and clustering characteristics of the coupling coordination of land transfer and carbon emissions. The main conclusions are as follows.
(1) From 2005 to 2015, the scale of land transfer continued to rise in China, and the focus of land transfer gradually shifted from the southeast coast to the central and western regions. In 2015, the land transfer area increased significantly in the central and western regions. Cities with high carbon emissions are mainly concentrated in eastern coastal areas such as Shanghai, Jiangsu Province and Zhejiang Province. In 2005, 2010 and 2015, the cities with the highest carbon emissions were mainly concentrated in the eastern coast, of which Shanghai had the largest carbon emissions of 170.761 mt, 230.712 mt, and 189.981 mt, respectively.
(2) The global Moran’s I for the coupled coordination degree of land transfer and carbon emissions in 2005, 2010, and 2015 are 0.3045, 0.3725, and 0.3388, respectively. All these values passed the 95% significance level test, which shows that their coupling coordination has significant positive spatial autocorrelation, and there is a significant clustering phenomenon.
(3) The goodness of fit R2 of MGWR is higher than GWR, and the AICc value is lower than GWR, which indicates that the result of MGWR is better than that of classical GWR. In terms of the NEP, MGWR is smaller and the RSS is smaller, which indicates that it uses fewer parameters to obtain regression results closer to the true value. The MGWR model is more robust than the traditional GWR model, and is able to adaptively find a reasonable bandwidth in this work, which can more objectively reflect the influence of socio-economic factors on the coordination of land transfer and carbon emission.
(4) The MGWR model shows that the influence of socioeconomic factors on the degree of the coupling coordination has obvious spatial heterogeneity. In 2005 and 2015, the influence coefficient of the NGR on the coupling coordination degree has obvious stratification characteristics in space, and the coefficient decreases from the northeast to the southwest. In 2010, the high coefficient of the NGR (0.013∼0.054) is mainly distributed in the northeast and western of China. The high coefficient of the PGA gradually evolves from a band to a cluster, while the range of low coefficient gradually decreases. In 2005, the cities with high coefficient (1.042∼1.385) of the PGA were distributed in the northwest and central regions. The coefficients of PGA were generally low in 2010 and 2015, mainly concentrated in Hunan, Hubei and Henan provinces, the Yangtze River Delta and the Pearl River Delta. In 2010, the high coefficient (0.924∼0.989) of the GPC was mainly distributed in the central region of China, with a decreasing trend in all directions. The coefficients of the PD range from 0.176 to 0.464 in southeastern coastal cities. In 2010, the high coefficient of the PSIG gradually shifted to the southeast coastal cities, with coefficients ranging from 0.284 to 0.311.
This study analyzed the spatio-temporal heterogeneity and impact mechanism of the coupling degree of carbon emissions and land transfer by comparing the traditional GWR and MGWR models. The results of this work can provide new ideas for sustainable urban development and carbon reduction. However, there are also shortcomings in this research, for example, the selection of explanatory variables may miss some other variables, which may affect the accuracy of the results. In addition, the analysis of this paper is conducted from municipal cities, which is a relatively large scale. In the future research, it can be discussed and analyzed in a smaller scope (for example, county level, township level), which may be more conducive for the government to formulate specific measures to manage the sustainable development of cities and reduce carbon emissions.
Data availability statement
The original contributions presented in the study are included in the article/supplementary material, further inquiries can be directed to the corresponding authors.
Author contributions
MZ: Methodology, Conceptualization, Writing—original draft, Writing—review and editing. BR: Conceptualization, Writing—review and editing. BT: Conceptualization, Writing—review and editing. ZZ and XL: Supervision, Writing—review and editing. LZ: Writing—review and editing.
Funding
This research was financially supported by the National Natural Science Foundation of China (Grant No. 42271284, No. 41801205) and Humanities and Social Sciences Research Project of Ministry of Education of China (Grant No. 22YJA790088).
Conflict of interest
The authors declare that the research was conducted in the absence of any commercial or financial relationships that could be construed as a potential conflict of interest.
Publisher’s note
All claims expressed in this article are solely those of the authors and do not necessarily represent those of their affiliated organizations, or those of the publisher, the editors and the reviewers. Any product that may be evaluated in this article, or claim that may be made by its manufacturer, is not guaranteed or endorsed by the publisher.
References
Ahmad, M., Jiang, P., Murshed, M., Shehzad, K., Akram, R., Cui, L., et al. (2021). Modelling the dynamic linkages between eco-innovation, urbanization, economic growth and ecological footprints for G7 countries: Does financial globalization matter? Sustain. Cities Soc. 70, 102881. doi:10.1016/j.scs.2021.102881
Akbari, H., Cartalis, C., Kolokotsa, D., Muscio, A., Pisello, A. L., Rossi, F., et al. (2016). Local climate change and urban heat island mitigation techniques – the state of the art. J. Civ. Eng. Manag. 22, 1–16. doi:10.3846/13923730.2015.1111934
Ariken, M., Zhang, F., Chan, N. W., and Kung, H. (2021). Coupling coordination analysis and spatio-temporal heterogeneity between urbanization and eco-environment along the Silk Road Economic Belt in China. Ecol. Indic. 121, 107014. doi:10.1016/j.ecolind.2020.107014
Arneth, A., Sitch, S., Pongratz, J., Stocker, B. D., Ciais, P., Poulter, B., et al. (2017). Historical carbon dioxide emissions caused by land-use changes are possibly larger than assumed. Nat. Geosci. 10, 79–84. doi:10.1038/NGEO2882
Bhan, M., Gingrich, S., Roux, N., Noe, J. L., Kastner, T., Matej, S., et al. (2021). Quantifying and attributing land use-induced carbon emissions to biomass consumption: A critical assessment of existing approaches. J. Environ. Manag. 286, 112228. doi:10.1016/j.jenvman.2021.112228
Bokaie, M., Zarkesh, M. K., Arasteh, P. D., and Hosseini, A. (2016). Assessment of urban heat island based on the relationship between land surface temperature and land use/land cover in Tehran. Sustain. Cities Soc. 23, 94–104. doi:10.1016/j.scs.2016.03.009
Broto, V. C. (2017). Urban governance and the politics of climate change. World Dev. 93, 1–15. doi:10.1016/j.worlddev.2016.12.031
Cai, M., Shi, Y., Ren, C., Yoshida, T., Yamagata, Y., Ding, C., et al. (2021). The need for urban form data in spatial modeling of urban carbon emissions in China: A critical review. J. Clean. Prod. 319, 128792. doi:10.1016/j.jclepro.2021.128792
Cao, W., Zhou, W., Wu, T., Wang, X., and Xu, J. (2022). Spatial-temporal characteristics of cultivated land use eco-efficiency under carbon constraints and its relationship with landscape pattern dynamics. Ecol. Indic. 141, 109140. doi:10.1016/j.ecolind.2022.109140
Chen, M., Gong, Y., Lu, D., and Ye, C. (2019). Build a people-oriented urbanization: China’s new-type urbanization dream and Anhui model. Land Use Policy. 80, 1–9. doi:10.1016/j.landusepol.2018.09.031
Chen, M., Liu, W., and Lu, D. (2016). Challenges and the way forward in China’s new-type urbanization. Land Use Policy. 55, 334–339. doi:10.1016/j.landusepol.2015.07.025
Chen, R., Ye, C., Cai, Y., Xing, X., and Chen, Q. (2014). The impact of rural out-migration on land use transition in China: Past, present and trend. Land Use Policy. 40, 101–110. doi:10.1016/j.landusepol.2013.10.003
Chen, Y., Chen, Z., Xu, G., and Tian, Z. (2016). Built-up land efficiency in urban China: Insights from the general land use plan (2006-2020). Habitat Int. 51, 31–38. doi:10.1016/j.habitatint.2015.10.014
Chen, Y., Yang, J., Yang, R., Xiao, X., and Xia, J. (2022). Contribution of urban functional zones to the spatial distribution of urban thermal environment. Build. Environ. 216, 109000. doi:10.1016/j.buildenv.2022.109000
Cheng, Z., Li, L., and Liu, J. (2018). Industrial structure, technical progress and carbon intensity in China’s provinces. Renew. Sustain. Energy Rev. 81, 2935–2946. doi:10.1016/j.rser.2017.06.103
Coseo, P., and Larsen, L. (2014). How factors of land use/land cover, building configuration, and adjacent heat sources and sinks explain Urban Heat Islands in Chicago. Landsc. Urban Plan. 125, 117–129. doi:10.1016/j.landurbplan.2014.02.019
Cox, D. T. C., Shanahan, D. F., Hudson, H. L., Fuller, R. A., and Gaston, K. J. (2018). The impact of urbanisation on nature dose and the implications for human health. Landsc. Urban Plan. 179, 72–80. doi:10.1016/j.landurbplan.2018.07.013
Demuzere, M., Orru, K., Heidrich, O., Olazabal, E., Geneletti, D., Orru, H., et al. (2014). Mitigating and adapting to climate change: Multi-functional and multi-scale assessment of green urban infrastructure. J. Environ. Manag. 146, 107–115. doi:10.1016/j.jenvman.2014.07.025
Deng, L., Liu, S., Kim, D. G., Peng, C., Sweeney, S., and Shangguan, Z. (2017). Past and future carbon sequestration benefits of China’s grain for green program. Glob. Environ. Change 47, 13–20. doi:10.1016/j.gloenvcha.2017.09.006
Derkzen, M. L., van Teeffelen, A. J. A., and Verburg, P. H. (2017). Green infrastructure for urban climate adaptation: How do residents’ views on climate impacts and green infrastructure shape adaptation preferences? Landsc. Urban Plan. 157, 106–130. doi:10.1016/j.landurbplan.2016.05.027
Dong, S., Zheng, J., Yu, L., Li, Z., Li, F., Liang, J., et al. (2019). Quantitative analysis of the coupling coordination degree between urbanization and eco-environment in Mongolia. Chin. Geogr. Sci. 29, 861–871. doi:10.1007/s11769-019-1074-7
Fan, Y., Fang, C., and Zhang, Q. (2019). Coupling coordinated development between social economy and ecological environment in Chinese provincial capital cities-assessment and policy implications. J. Clean. Prod. 229, 289–298. doi:10.1016/j.jclepro.2019.05.027
Fei, R., Lin, Z., and Chunga, J. (2021). How land transfer affects agricultural land use efficiency: Evidence from China’s agricultural sector. Land Use Policy. 103, 105300. doi:10.1016/j.landusepol.2021.105300
Fu, F., Deng, S., Wu, D., Liu, W., and Bai, Z. (2022). Research on the spatiotemporal evolution of land use landscape pattern in a county area based on CA-Markov model. Sustain. Cities Soc. 80, 103760. doi:10.1016/j.scs.2022.103760
Ge, D., Wang, Z., Tu, S., Long, H., Yang, H., Sun, D., et al. (2019). Coupling analysis of greenhouse-led farmland transition and rural transformation development in China’s traditional farming area: A case of Qingzhou city. Land Use Policy. 86, 113–125. doi:10.1016/j.landusepol.2019.05.002
Gong, W., Duan, X., Mao, M., Hu, J., Sun, Y., Wu, G., et al. (2022). Assessing the impact of land use and changes in land cover related to carbon storage by linking trajectory analysis and InVEST models in the Nandu River Basin on Hainan Island in China. Front. Environ. Sci. 10. doi:10.3389/fenvs.2022.1038752
Guo, B., Wang, X., Pei, L., Su, Y., Zhang, D., and Wang, Y. (2021). Identifying the spatiotemporal dynamic of PM2.5 concentrations at multiple scales using geographically and temporally weighted regression model across China during 2015-2018. Sci. Total Environ. 751, 141765. doi:10.1016/j.scitotenv.2020.141765
He, B.-J. (2018). Potentials of meteorological characteristics and synoptic conditions to mitigate urban heat island effects. Urban Clim. 24, 26–33. doi:10.1016/j.uclim.2018.01.004
He, B.-J. (2019). Towards the next generation of green building for urban heat island mitigation: Zero UHI impact building. Sustain. Cities Soc. 50, 101647. doi:10.1016/j.scs.2019.101647
He, J., Wang, S., Liu, Y., Ma, H., and Liu, Q. (2017). Examining the relationship between urbanization and the eco-environment using a coupling analysis: Case study of Shanghai, China. Ecol. Indic. 77, 185–193. doi:10.1016/j.ecolind.2017.01.017
Houghton, R. A., House, J. I., Pongratz, J., van der Werf, G. R., DeFries, R. S., Hansen, M. C., et al. (2012). Carbon emissions from land use and land-cover change. Biogeosciences. 9, 5125–5142. doi:10.5194/bg-9-5125-2012
Houghton, R. A., and Nassikas, A. A. (2017). Global and regional fluxes of carbon from land use and land cover change 1850-2015. Glob. Biogeochem. Cycles 31, 456–472. doi:10.1002/2016GB005546
Huang, W., and Li, J. (2022). The coupling relationship between urbanization and carbon emissions from land use in Ningxia. Front. Environ. Sci. 10. doi:10.3389/fenvs.2022.927798
Huo, T., Cao, R., Du, H., Zhang, J., Cai, W., and Liu, B. (2021). Nonlinear influence of urbanization on China’s urban residential building carbon emissions: New evidence from panel threshold model. Sci. Total Environ. 772, 145058. doi:10.1016/j.scitotenv.2021.145058
Huo, T., Li, X., Cai, W., Zuo, J., Jia, F., and Wei, H. (2020). Exploring the impact of urbanization on urban building carbon emissions in China: Evidence from a provincial panel data model. Sustain. Cities Soc. 56, 102068. doi:10.1016/j.scs.2020.102068
Jin, G., Chen, K., Wang, P., Guo, B., Dong, Y., and Yang, J. (2019). Trade-offs in land-use competition and sustainable land development in the North China Plain. Technol. Forecast. Soc. Change 141, 36–46. doi:10.1016/j.techfore.2019.01.004
Kalnay, E., and Cai, M. (2003). Impact of urbanization and land-use change on climate. Nature 423, 528–531. doi:10.1038/nature01675
Kan, K. (2021). Creating land markets for rural revitalization: Land transfer, property rights and gentrification in China. J. Rural Stud. 81, 68–77. doi:10.1016/j.jrurstud.2020.08.006
Kotharkar, R., and Bagade, A. (2018). Evaluating urban heat island in the critical local climate zones of an Indian city. Landsc. Urban Plan. 169, 92–104. doi:10.1016/j.landurbplan.2017.08.009
Kumar, S., Lal, R., and Liu, D. (2012). A geographically weighted regression kriging approach for mapping soil organic carbon stock. Geoderma. 189, 627–634. doi:10.1016/j.geoderma.2012.05.022
Kumar, S., Lal, R., Liu, D., and Rafiq, R. (2013). Estimating the spatial distribution of organic carbon density for the soils of Ohio, USA. J. Geogr. Sci. 23, 280–296. doi:10.1007/s11442-013-1010-1
Lai, L., Huang, X., Yang, H., Chuai, X., Zhang, M., Zhong, T., et al. (2016). Carbon emissions from land-use change and management in China between 1990 and 2010. Sci. Adv. 2, e1601063. doi:10.1126/sciadv.1601063
Li, J., Huang, X., Sun, S., and Xiaowei, C. (2019). Spatio-temporal coupling analysis of urban land and carbon dioxide emissions from energy consumption in the Yangtze River Delta region. Geogr. Res. 38, 2188–2201. doi:10.11821/dlyj020180774
Li, Y., Li, Y., Zhou, Y., Shi, Y., and Zhu, X. (2012). Investigation of a coupling model of coordination between urbanization and the environment. J. Environ. Manag. 98, 127–133. doi:10.1016/j.jenvman.2011.12.025
Liu, C., Wu, X., and Wang, L. (2019). Analysis on land ecological security change and affect factors using RS and GWR in the Danjiangkou Reservoir area, China. Appl. Geogr. 105, 1–14. doi:10.1016/j.apgeog.2019.02.009
Liu, H., Lei, H., and Zhou, Y. (2022). How does green trade affect the environment? Evidence from China. J. Econ. Anal. 1, 1–19. doi:10.12410/jea.2811-0943.2022.01.001
Liu, N., Liu, C., Xia, Y., and Da, B. (2018). Examining the coordination between urbanization and eco-environment using coupling and spatial analyses: A case study in China. Ecol. Indic. 93, 1163–1175. doi:10.1016/j.ecolind.2018.06.013
Liu, Y., Fang, F., and Li, Y. (2014). Key issues of land use in China and implications for policy making. Land Use Policy. 40, 6–12. doi:10.1016/j.landusepol.2013.03.013
Long, H., and Qu, Y. (2018). Land use transitions and land management: A mutual feedback perspective. Land Use Policy. 74, 111–120. doi:10.1016/j.landusepol.2017.03.021
Lu, X., Jiang, X., and Gong, M. (2020). How land transfer marketization influence on green total factor productivity from the approach of industrial structure? Evidence from China. Land Use Policy. 95, 104610. doi:10.1016/j.landusepol.2020.104610
Luo, Y., Sun, W., Yang, K., and Zhao, L. (2021). China urbanization process induced vegetation degradation and improvement in recent 20 years. Cities 114, 103207. doi:10.1016/j.cities.2021.103207
Luyssaert, S., Jammet, M., Stoy, P. C., Estel, S., Pongratz, J., Ceschia, E., et al. (2014). Land management and land-cover change have impacts of similar magnitude on surface temperature. Nat. Clim. Change 4, 389–393. doi:10.1038/NCLIMATE2196
Ma, A., He, Y., and Tang, P. (2021). Understanding the impact of land resource misallocation on carbon emissions in China. Land 10, 1188. doi:10.3390/land10111188
Nathaniel, S. P., and Adeleye, N. (2021). Environmental preservation amidst carbon emissions, energy consumption, and urbanization in selected African countries: Implication for sustainability. J. Clean. Prod. 285, 125409. doi:10.1016/j.jclepro.2020.125409
Ou, J., Liu, X., Li, X., and Chen, Y. (2013). Quantifying the relationship between urban forms and carbon emissions using panel data analysis. Landsc. Ecol. 28, 1889–1907. doi:10.1007/s10980-013-9943-4
Ren, S., Liu, Z., Zhanbayev, R., and Du, M. (2022). Does the internet development put pressure on energy-saving potential for environmental sustainability? Evidence from China. J. Econ. Anal. 1, 50–65. doi:10.12410/jea.2811-0943.2022.01.004
Rong, Y., Li, K., Guo, J., Zheng, L., Luo, Y., Yan, Y., et al. (2022). Multi-scale spatio-temporal analysis of soil conservation service based on MGWR model: A case of Beijing-Tianjin-Hebei, China. Ecol. Indic. 139, 108946. doi:10.1016/j.ecolind.2022.108946
Song, X.-D., Brus, D. J., Liu, F., Li, D.-C., Zhao, Y.-G., Yang, J.-L., et al. (2016). Mapping soil organic carbon content by geographically weighted regression: A case study in the Heihe River Basin, China. Geoderma. 261, 11–22. doi:10.1016/j.geoderma.2015.06.024
Tan, S., Zhang, M., Wang, A., and Ni, Q. (2021a). Spatio-temporal evolution and driving factors of rural settlements in low hilly region—A case study of 17 cities in Hubei province, China. Int. J. Environ. Res. Public. Health 18, 2387. doi:10.3390/ijerph18052387
Tan, S., Zhang, M., Wang, A., Zhang, X., and Chen, T. (2021b). How do varying socio-economic driving forces affect China’s carbon emissions? New evidence from a multiscale geographically weighted regression model. Environ. Sci. Pollut. Res. 28, 41242–41254. doi:10.1007/s11356-021-13444-1
Wang, H., He, C., Li, W., Nie, X., Zhong, H., and Wen, L. (2020). Will transferable development rights (TDR) increase regional economic imbalance? A quota transaction case of cultivated land conversion and reclamation in Guangxi, China. Habitat Int. 104, 102254. doi:10.1016/j.habitatint.2020.102254
Wang, M., Wang, Y., Wu, Y., Yue, X., Wang, M., and Hu, P. (2022). Identifying the spatial heterogeneity in the effects of the construction land scale on carbon emissions: Case study of the Yangtze River Economic Belt, China. Environ. Res. 212, 113397. doi:10.1016/j.envres.2022.113397
Wang, Q., Jiang, D., Gao, Y., Zhang, Z., and Chang, Q. (2022). Examining the driving factors of SOM using a multi-scale GWR model augmented by geo-detector and GWPCA analysis. Agronomy 12, 1697. doi:10.3390/agronomy12071697
Wang, X., and Zhang, F. (2018). Multi-scale analysis of the relationship between landscape patterns and a water quality index (WQI) based on a stepwise linear regression (SLR) and geographically weighted regression (GWR) in the Ebinur Lake oasis. Environ. Sci. Pollut. Res. 25, 7033–7048. doi:10.1007/s11356-017-1041-8
Wu, Y., Chau, K. W., Lu, W., Shen, L., Shuai, C., and Chen, J. (2018). Decoupling relationship between economic output and carbon emission in the Chinese construction industry. Environ. Impact Assess. Rev. 71, 60–69. doi:10.1016/j.eiar.2018.04.001
Xiao, Y., Zhong, J.-L., Zhang, Q.-F., Xiang, X., and Huang, H. (2022). Exploring the coupling coordination and key factors between urbanization and land use efficiency in ecologically sensitive areas: A case study of the Loess Plateau, China. Sustain. Cities Soc. 86, 104148. doi:10.1016/j.scs.2022.104148
Yang, H., Huang, K., Deng, X., and Xu, D. (2021). Livelihood capital and land transfer of different types of farmers: Evidence from panel data in sichuan province, China. Land. 10, 532. doi:10.3390/land10050532
Yang, K., Wu, C., and Luo, Y. (2022). The impact of COVID-19 on urban PM2.5—Taking Hubei province as an example. Environ. Pollut. 294, 118633. doi:10.1016/j.envpol.2021.118633
Yu, J., Zhou, K., and Yang, S. (2019). Land use efficiency and influencing factors of urban agglomerations in China. Land Use Policy. 88, 104143. doi:10.1016/j.landusepol.2019.104143
Zhang, C., and Zhang, M. (2022). Wavelet-based neural network with genetic algorithm optimization for generation prediction of PV plants. Energy Rep. 8, 10976–10990. doi:10.1016/j.egyr.2022.08.176
Zhang, M., Chen, W., Cai, K., Gao, X., Zhang, X., Liu, J., et al. (2019). Analysis of the spatial distribution characteristics of urban resilience and its influencing factors: A case study of 56 cities in China. Int. J. Environ. Res. Public Health 16, 4442. doi:10.3390/ijerph16224442
Zhang, M., Tan, S., Pan, Z., Hao, D., Zhang, X., and Chen, Z. (2022a). The spatial spillover effect and nonlinear relationship analysis between land resource misallocation and environmental pollution: Evidence from China. J. Environ. Manag. 321, 115873. doi:10.1016/j.jenvman.2022.115873
Zhang, M., Tan, S., and Zhang, X. (2022b). How do varying socio-economic factors affect the scale of land transfer? Evidence from 287 cities in China. Environ. Sci. Pollut. Res. 29, 40865–40877. doi:10.1007/s11356-021-18126-6
Zhang, M., Tan, S., Zhang, Y., He, J., and Ni, Q. (2022c). Does land transfer promote the development of new-type urbanization? New evidence from urban agglomerations in the middle reaches of the Yangtze River. Ecol. Indic. 136, 108705. doi:10.1016/j.ecolind.2022.108705
Zhang, M., Kafy, A.-A., Ren, B., Zhang, Y., Tan, S., and Li, J. (2022d). Application of the optimal parameter geographic detector model in the identification of influencing factors of ecological quality in Guangzhou, China. Land 11, 11081303. doi:10.3390/land11081303
Zhang, M., Kafy, A.-A., Xiao, P., Han, S., Zou, S., Saha, M., et al. (2022e). Impact of urban expansion on land surface temperature and carbon emissions using machine learning algorithms in Wuhan, China. Urban Clim. 47, 101347. doi:10.1016/j.uclim.2022.101347
Zhang, M., Zhang, C., Kafy, A.-A., and Tan, S. (2022f). Simulating the relationship between land use/cover change and urban thermal environment using machine learning algorithms in Wuhan city, China. Land 11, 11010014. doi:10.3390/land11010014
Zhang, W., and Xu, H. (2017). Effects of land urbanization and land finance on carbon emissions: A panel data analysis for Chinese provinces. Land Use Policy. 63, 493–500. doi:10.1016/j.landusepol.2017.02.006
Zhang, X., He, J., Deng, Z., Ma, J., Chen, G., Zhang, M., et al. (2018). Comparative changes of influence factors of rural residential area based on spatial econometric regression model: A case study of Lishan township, Hubei province, China. Sustainability 10, 3403. doi:10.3390/su10103403
Zhang, X., Zhang, M., He, J., Wang, Q., and Li, D. (2019). The spatial-temporal characteristics of cultivated land and its influential factors in the low hilly region: A case study of Lishan Town, Hubei Province, China. Sustain. 11, 1–18. doi:10.3390/su11143810
Zhang, Y., Wang, W., Liang, L., Wang, D., Cui, X., and Wei, W. (2020). Spatial-temporal pattern evolution and driving factors of China’s energy efficiency under low-carbon economy. Sci. Total Environ. 739, 140197. doi:10.1016/j.scitotenv.2020.140197
Zhou, Y., Li, X., and Liu, Y. (2020). Land use change and driving factors in rural China during the period 1995-2015. Land Use Policy. 99, 105048. doi:10.1016/j.landusepol.2020.105048
Keywords: land transfer, carbon emissions, coupled coordination, spatial autocorrelation, MGWR model, China
Citation: Zhang M, Zhang Z, Tong B, Ren B, Zhang L and Lin X (2023) Analysis of the coupling characteristics of land transfer and carbon emissions and its influencing factors: A case study of China. Front. Environ. Sci. 10:1105552. doi: 10.3389/fenvs.2022.1105552
Received: 22 November 2022; Accepted: 06 December 2022;
Published: 04 January 2023.
Edited by:
Siyu Ren, Nankai University, ChinaReviewed by:
Jin-shui Liang, Dalian Ocean University, ChinaYanqi Zhao, Henan Polytechnic University, China
Copyright © 2023 Zhang, Zhang, Tong, Ren, Zhang and Lin. This is an open-access article distributed under the terms of the Creative Commons Attribution License (CC BY). The use, distribution or reproduction in other forums is permitted, provided the original author(s) and the copyright owner(s) are credited and that the original publication in this journal is cited, in accordance with accepted academic practice. No use, distribution or reproduction is permitted which does not comply with these terms.
*Correspondence: Ziyi Zhang, eml5aV96aGFuZ0Bwa3UuZWR1LmNu; Xuehan Lin, bGlueHVlaGFuQG1haWxzLmNjbnUuZWR1LmNu
†These authors have contributed equally to this work.