 Lei Li
 Qian-Jin Zhou1,2,3
 Pak-Wai Chan
 Hong-Long Yang
94% of researchers rate our articles as excellent or good
Learn more about the work of our research integrity team to safeguard the quality of each article we publish.
Find out more
ORIGINAL RESEARCH article
Front. Environ. Sci., 05 January 2023
Sec. Interdisciplinary Climate Studies
Volume 10 - 2022 | https://doi.org/10.3389/fenvs.2022.1104553
This article is part of the Research TopicClimate-Environment Interactions under Global WarmingView all 25 articles
Most studies of the effects of urbanisation on local climate have been based on ground observation data. In contrast, we used observation data from a boundary layer radar wind profiler, radio-acoustic sounding system, and automatic meteorological station located at Shenzhen Bao’an International Airport to analyse changes in wind and virtual temperature in the upper level atmosphere, with a top height of 1,200 m, over the Pearl River Estuary between 2011 and 2020. Our results show that during the decade evaluated, the wind speed and virtual temperature of the upper level atmosphere over the Pearl River Estuary changed very significantly and faster than the changes observed at ground level. During the study period, the linear warming rate of the virtual temperature of the upper level atmosphere reached 0.24°C/a, whereas that on the land surface was 0.17°C/a. The mean decreases in the upper level atmosphere and land surface wind speeds were −0.12 and −0.05 m/s·a, respectively. Additionally, the rate of change in the upper level climate was faster in winter than in summer for both wind speed and virtual temperature. These changes in the climate of the upper level atmosphere over the Pearl River Estuary may be related to the rapid increase in the number of high-rise buildings in the region during that decade, which generally negatively affected the atmospheric environment.
The Pearl River Delta (PRD) was among the fastest developing and urbanising regions in China over the past 4 decades (Hui et al., 2020). This rapid urbanisation has notably altered the physical attributes of the region’s land surface and, together with anthropogenic heat and pollution emissions, has led to profound changes in the regional climate and atmospheric environment of the PRD. The three key features of climate change in the PRD are the increase of surface air temperature (Chan et al., 2012), the rapidly decrease of surface wind speed (Peng et al., 2018), and the initially decreasing and subsequently increasing relative humidity (Li et al., 2021a; Zhang et al., 2022). Compared with other climate elements, the researches on temperature and wind speed in the field of urbanization effect on climate have received more attention, for the changes of thermophysical properties and the increase of roughness of the Earth surface caused by urbanization have the most direct impacts on temperature and wind speed. In the PRD region, the average warming rate has been about 0.19°C/decade since 1971 (Li et al., 2021). However, in the region with the most rapid urbanization process in the PRD, the warming rate has reached as high as 0.36°C/decade, and the contribution of the urbanization effect to the warming rate can amazingly reach 81.4%–85.1% (Li et al., 2015). The statistics also show that the annual mean wind speed showed an oscillatory downward trend since 1970s, the decade-average wind speed of the GBA during the period of 2011–2020 is 2.25 m/s, which is 0.22 m/s lower than the value during the period of 1971–1980.
In addition to the regional climate, the atmospheric environment of the PRD has also undergone significant changes over the past 4 decades. Because of the region’s dense network of factories and transportation routes, large volumes of pollutants are emitted into the atmosphere, leading to poor air quality. Particularly, fine particulate matter (PM2.5) pollution was a severe problem in the PRD in the mid-2000s, seriously affecting visibility in the region (Yang et al., 2020; Song et al., 2021). The emerging city of Shenzhen recorded 187 days of “haze” in 2004. After regional air pollution control measures were implemented and several rounds of industrial upgrades were performed, the PM2.5 in the PRD has decreased rapidly since the mid-2000s, although ozone (O3) pollution has increased (Zhang et al., 2018; Li et al., 2020; Li et al., 2022).
The regional climate and the atmospheric environment are scientific issues closely related to each other. For example, as the urban surface roughness increases, the near-surface wind speed decreases (Lin et al., 2014), thus the advective transport of pollutants is reduced and the accumulation of these pollutants becomes to be easier than before. Circulation caused by strong thermal processes in urban areas interacts with the background wind field, increasing the structural complexity of the near-surface flow field at different spatial scales. These factors create challenges in assessing and predicting pollutant meteorological conditions in urban areas (Wang et al., 2019). In recent years, O3 concentration in the PRD region has gradually increased, which is related to higher temperatures (Wang et al., 2021). As such, the impact of urbanisation on the regional climate is gradually expanding to the atmospheric environment.
In the vertical direction, changes in the structure of the atmospheric boundary layer caused by urbanization also have a significant impact on the atmospheric environment in the PRD region. Fan et al. (2007, 2011) pointed out that the structure of the atmospheric boundary layer of PRD is jointly affected by the warm and wet airflow from the south, the dry and cold north airflow across the Nanling Mountains, the urban cluster in the region and the peripheral circulation of tropical cyclones, which is an important reason for the deterioration of atmospheric environment quality in PRD region. Fan et al. (2018) found that there are strip or cellular vortex structures inside the cities, and the strip structures could cause the convergence and accumulation of pollutants around the strip, resulting in a local high pollution zone. Some case studies have confirmed that the interaction between urban heat island and sea land breeze will lead to small-scale convergence and local high pollution (Wei et al., 2019).
Although progress has been made in studies of the effects of urbanisation on climate and boundary layer structure in the PRD and in the ability to use this information to adopt measures for adjusting to urban climates, further improvements are needed in this field. Particularly, almost all previous studies of the effects of urbanisation on climate in the region are based on surface meteorological observations; thus, the validity of the conclusions is limited to the atmospheric subdivision closest to Earth’s land surface. On the other hand, the researches on the vertical structure of the boundary layer in this region are generally focused on individual cases, and lacks the understanding of the climate characteristics of the boundary layer based on long-term observational data. While to analyse the effects of long-term changes in climatic conditions on the atmospheric environment, meteorological conditions must be considered vertically across the whole atmospheric boundary layer, as the transport, diffusion, and chemical reactions of pollutants are not limited to the land surface (Shi et al., 2019; 2020). As a result, research should be extended to at least the top of the daytime boundary layer at a typical height of at least 1,000 m above the land surface in PRD region. However, obtaining vertical data is difficult, and meteorological administration departments did not require these data to be collected among operational observations for a long time. Thus, climate change across the vertical boundary layer has not been widely examined.
Shenzhen is one of the main cities in the PRD region. In less than 40 years, Shenzhen has developed from a small city to a megacity with a population of over 10 million (Zhang et al., 2018). Shenzhen also has the densest meteorological observation network in the PRD region. Additionally, at Shenzhen’s Bao’an International Airport, a boundary layer radar wind profiler has been installed and has been operational since around 2011, gathering observation data for more than a decade. Using these data, we analysed changes in the climate of the upper level atmosphere with a maximum top height of 1,500 m, in the Pearl River Estuary (PRE) region over a 10-year period, which is undoubtedly a progress when compared with the past studies on climate effect of urbanisation only based on the ground level observation.
The data obtained by the Vaisala LAP®-3000 wind profiler at Shenzhen Bao’an International Airport (location is shown in Figure 1) were used in this study. The lowest height at which the wind speed and direction are detected is 110 m, and the vertical resolution below 1,500 m is approximately 60 m. The radio-acoustic sounding system (RASS) attached to the radar has a virtual temperature measurement function, with a minimum detection height of 180 m and vertical resolution of approximately 60 m. We also used the wind speed, air temperature, relative humidity, and air pressure data obtained by an automatic meteorological station located at the airport. To maintain consistency with the RASS observations, the air temperature, relative humidity, and air pressure data were used to calculate the near-surface virtual temperatures. Through this conversion, the thermal environment at the ground level and that at upper level are comparable. Additionally, to cover observation blind spots below 110 and 180 m, linear interpolation was conducted using observation data from the automatic station and data obtained at the lowest height from the wind profiler, which provided information between the land surface and lowest detection height. The data used in this study were collected from 1 January 2011 to 30 December 2020, with a data collection frequency of 1 h.
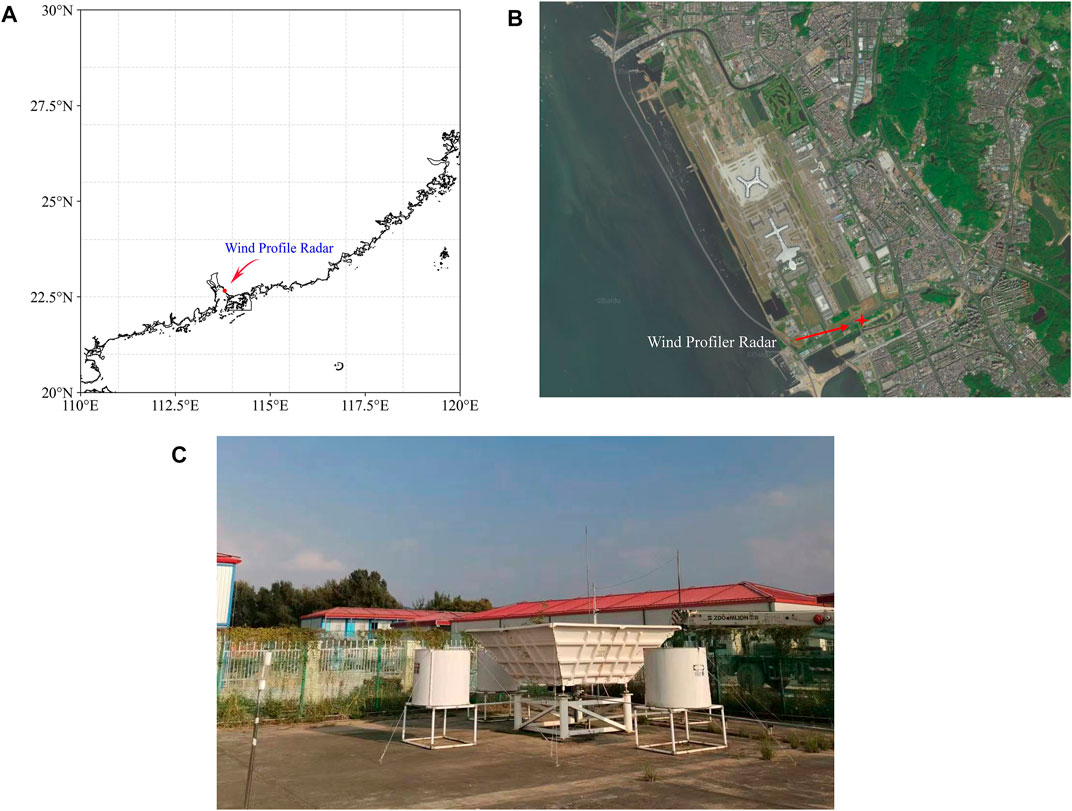
FIGURE 1. Location (A,B) and view (C) of radar wind profiler.
To ensure the accuracy of the observation data, the sensitivity, dynamic range, and speed of the wind profiler were calibrated monthly. Further quality controls were conducted prior to statistical analysis. Based on historical climate records where the observation equipment is located, wind speeds exceeding 70 m/s were considered as questionable and excluded from further analysis. Virtual temperature observations below −30°C and above 60°C were also treated as erroneous data. When more than 50% of the data for a particular time were erroneous or missing, the data of that time were not included in the analysis. When less than 50% of the data that should have been available for a period were erroneous or missing, linear interpolation or extrapolation was conducted.
In statistical analysis, we focused on the annual and monthly mean virtual temperatures and wind speeds at various heights and evaluated their inter-annual changes. Previous studies confirmed that low-level jets (LLJ) in this region significantly influence O3 pollution; thus, we also analysed changes in LLJ (Yang et al., 2022).
Urbanisation has the most notable climatic effect on virtual temperature. According to Li et al. (2021a), the warming rate between 1971 and 2020 in the Guangdong-Hong Kong-Macao Greater Bay Area, where the PRE is located, was approximately 0.2°C/decade. In cities with particularly rapid urbanisation, such as Shenzhen, the rate of warming was even higher, as a remarkable 80% of warming is caused by urbanisation. Using the data from the wind profiler to analyse changes in the upper level virtual temperature at the 10-year scale can improve the understanding of how urbanisation influences thermal environment in the vertical direction. Notably, because the elements observed by the RASS module of the wind profiler are virtual temperatures, our analysis was performed based on virtual temperatures. We added a correction term for specific humidity, causing virtual temperature to be slightly higher than the original air temperature.
Changes in the mean annual virtual temperature in the upper level based on the wind profiler observation data are shown in Figure 2. The mean annual virtual temperature increased throughout the upper level below 1,200 m. Notably, the part of the upper level atmosphere where the mean annual virtual temperature was above 26°C constantly increased. In 2011, no part of the upper level atmosphere had a mean annual virtual temperature of 26°C, whereas by 2020, the part of the upper level atmosphere with a mean annual virtual temperature of 26°C extended from the ground level to above 400 m. Previous studies of warming in the PRD region were almost exclusively ground-based (Chan et al., 2012); however, our wind profiler data suggest that warming in this region can be detected throughout the upper level atmosphere. In another study, Li et al. (2015) analysed warming of the surface air temperature in Shenzhen based on data from the Shenzhen Caiwuwei Meteorological Station from 1968 to 2013 and showed that previously rapid temperature increases slowed during the mid-2000s as the structure of the urban built-up area became more settled. In contrast, our results indicate that local warming has very significantly increased on the 10-year scale (between 2011 and 2020).
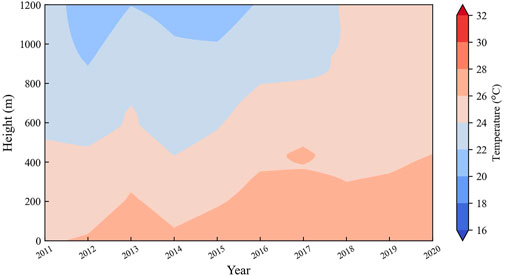
FIGURE 2. Changes in mean annual virtual temperature in the upper level atmosphere below 1,200 m over the Pearl River Estuary (PRE) in 2011–2020.
Changes in the mean monthly virtual temperatures in the upper level during the 10-year study period are shown below (Figure 3). A special coloured isoline design was used in the figure to intuitively illustrate the intervals and changes between cold and warm virtual temperatures. Shades of blue indicate virtual temperatures below 18°C, whereas shades of red represent virtual temperatures above 20°C. Before 2017, cool isolines are shown throughout the upper level atmosphere at certain times of the year, typically from November to February. However, after 2017, this was no longer the case, and the heights reached by the cooler colours decreased, reflecting continuous and considerable increases in the virtual temperature of the upper level atmosphere in winter. Warming also occurred in summer, which is reflected by continuous upward expansion of dark red isolines. Thus, warming of the upper level atmosphere is evident in almost all months of the year, though to a lesser degree in summer.
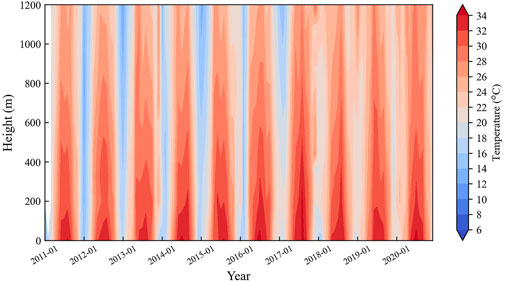
FIGURE 3. Changes in mean monthly virtual temperature in the upper level atmosphere below 1,200 m over the Pearl River Estuary in 2011–2020.
Changes in the mean virtual temperature at the ground level and in the upper level above the land surface between 2011 and 2020 are shown in Figure 4. The mean value for the whole upper level atmosphere was determined as the mean value between 200 and 800 m, where the original observed data is the most complete in the whole upper level atmosphere, and the surface level value is the observation data obtained by the automatic meteorological station at the airport. The annual mean warming rate of the upper level atmosphere (0.24 °C/a) was higher than that of the land surface (0.17°C/a). Figure 4 also shows changes in the mean virtual temperature in different seasons, with January and December of a given year representing winter and June and July representing summer. Comparative analysis indicated that the warming rate of the mean virtual temperature of the upper level atmosphere (0.10°C/a) was similar to that of the land surface virtual temperature (0.09°C/a) in summer. Unexpectedly, in winter, the mean virtual temperature of the upper level atmosphere increased rapidly at a rate of 0.70°C/a, which was much higher than that at ground level (0.47°C/a). Rapid warming of the upper level atmosphere in winter demonstrates that temperature inversions are more common in winter than in other seasons in the PRE region.
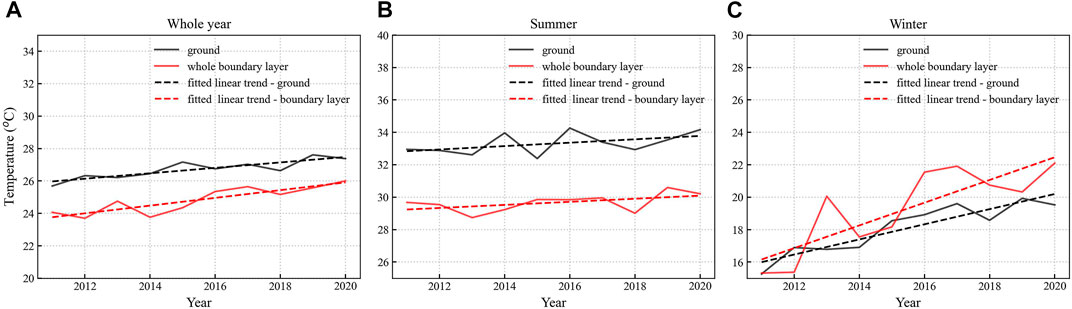
FIGURE 4. Comparison of changes in mean values of land surface virtual temperature and mean virtual temperature in the upper level atmosphere. (A) Whole year; (B) Summer; (C) winter.
Furthermore, it should be noted that both on the ground and in the upper level atmosphere, the increase rate of virtual temperature calculated in the current study is much higher than that of the pure air temperature provided in previous studies (Chan et al., 2012; Li et al., 2021a). This may be related to the increasing relative humidity in the region over the past decade (Zhang et al., 2022). Since the virtual temperature is equal to the sum of the air temperature and a correction term related to the relative humidity, the rapidly increasing relative humidity undoubtedly has a significantly positive contribution in the increase of the virtual temperature. However, due to the lack of long-term relative humidity observation data in the vertical direction, it is impossible to quantify the contribution of the increase of relative humidity to the increase of virtual temperature, which needs further research in the future.
Changes in the mean annual wind speed recorded by the radar wind profiler between 2011 and 2020 are shown in Figure 5. Although the mean annual wind speed varied in three-to-four-year cycles, there was an overall decrease in wind speed across the upper level atmosphere. The weak wind layer (WWL), which has a mean annual wind speed below 2.0 m/s, increased during the study period. Before 2016, the wind speed of the whole upper level atmosphere almost always exceeded 2.0 m/s, with the ground-based automatic meteorological station only occasionally recording a mean annual wind speed below 2.0 m/s. After 2016, however, the WWL began to appear at ground level and gradually increased in size, reaching a height of approximately 200 m by 2018.
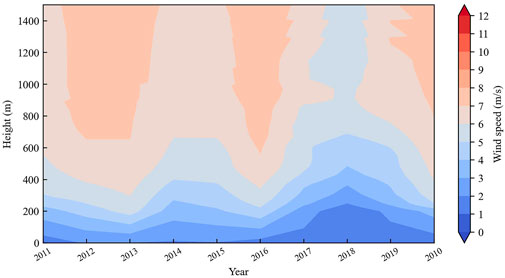
FIGURE 5. Changes in mean annual wind speed in the upper level atmosphere below 1,500 m over the Pearl River Estuary in 2011–2020.
Changes in the mean monthly wind speed in the upper level are shown in Figure 6. The inter-month fluctuations were caused by specific weather processes in each month. When typhoons, strong cold air, strong monsoons, and other climatic events that cause strong winds occurred, the mean monthly wind speed notably increased. Moreover, the PRE region’s subtropical monsoon climate led to higher mean wind speeds in summer than in winter, as shown in Figure 6.Regardless of the inter-month fluctuations, the WWL increased overall. Before 2016, the WWL typically only appeared for a few months of each year, whereas after 2016, the WWL appeared more frequently and its height fluctuated upwards. In the winter of 2018–2019, the WWL reached a height of approximately 400 m.
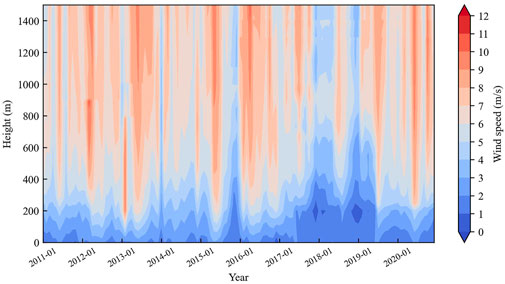
FIGURE 6. Changes in mean monthly wind speed in the upper level atmosphere below 1,500 m over the Pearl River Estuary in 2011–2020.
Changes in the mean annual wind speed at the ground level and throughout the upper level (mean wind speed of the upper level is the mean value between 50 and 1,000 m) between 2011 and 2020 as well as their fitted linear trends are shown in Figure 7. The wind speed at both the land surface and in the upper level fluctuated downwards. The interannual fluctuations in the land surface wind speed were minor, with a decrease of −0.05 m/s a. In contrast, interannual fluctuations in the wind speed in the upper level were more severe, and the downward trend was more notable, reaching −0.12 m/s a; Figure 7 also shows the mean wind speeds in winter (January and December of each year) and summer (June and July), during which the decrease in wind speed was more significant in winter than in summer. The decreases in the surface and upper level wind speeds in winter were −0.07 and −0.19 m/s·a, respectively. In summer, the decrease in wind speeds were −0.04 m/s a at both the surface and upper level atmosphere.
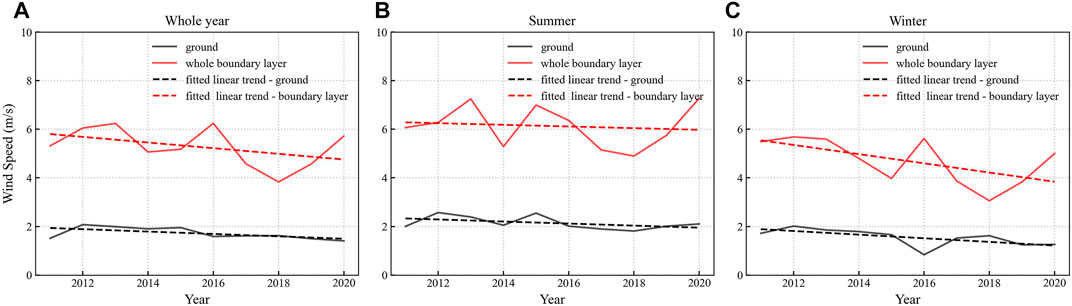
FIGURE 7. Comparison of changes in ground-level wind speed and mean wind speed in the upper level atmosphere. (A) Whole year; (B) Summer; (C) winter.
The decrease in wind speed in the upper level and rising WWL reveal the influence of urbanisation on the wind speed. Between 2011 and 2020, because of the increase in high-rise buildings in the PRE, surface roughness continuously increased, leading to the loss of kinetic energy of wind in the upper level and a continuous decrease in the wind speed. Crucially, this effect was not limited to the near surface but rather occurred throughout the upper level atmosphere. Unexpectedly, the impact on the overall wind speed in the upper level atmosphere was greater than that on the land surface.
Recent studies showed that LLJ influence the atmospheric environment in the PRD (Yang et al., 2022). Particularly at night, turbulent vertical mixing associated with LLJ can alter the structure of the residual layer, leading to abnormally high O3 concentrations at night at ground level. Thus, we also analysed changes in LLJ.
Based on a previous study by Whiteman et al. (1997), we calculated the frequencies of three different intensities of LLJ based on the criteria shown in Table 1, the results of which are shown in Figure 8. Between 2011 and 2020, LLJ of various intensities decreased overall in the PRE. Comparison of winter and summer months showed that the decrease in LLJ was more notable in winter than in summer. This result is consistent with the trends observed for urbanisation-induced warming, which were also more notable in winter. LLJ typically require stable temperature stratification. During the decade of the study period, the rapid rise in winter virtual temperatures throughout the upper level atmosphere over the PRE destabilized the temperature stratification in winter, preventing the occurrence of LLJ.
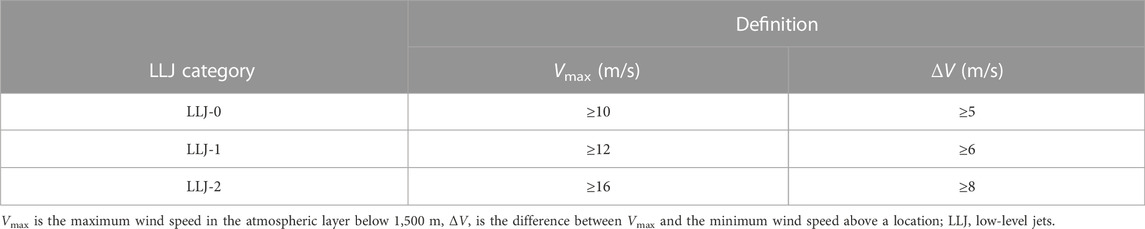
TABLE 1. Criteria for evaluating low-level jets.
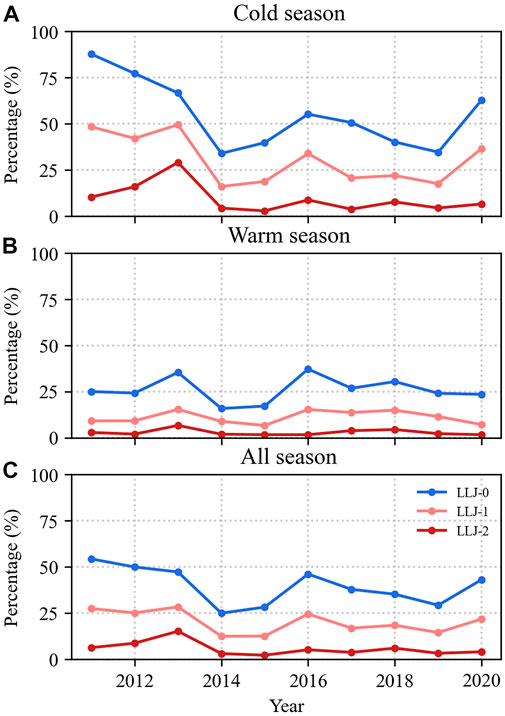
FIGURE 8. Changes in the frequency of low-level jets. (A) Cold season; (B) Warm season; (C) All seasons.
Based on the above analysis, several urbanisation-related factors influenced the climate in the upper level atmosphere over the PRE: 1) virtual temperature increases, particularly in winter; 2) greater warming in the upper level than that at the ground level; 3) a significant decrease in wind speed and an increase in the height of the WWL; and 4) a decrease in the LLJ frequency, particularly in winter.
Following 30 years of extremely rapid urbanisation, the overall structure of the built-up area of the PRE became relatively settled in the period 2010–2020. Li et al. (2022) demonstrated that the built-up area in Shenzhen has expanded very little since 2010. Nevertheless, the climate of the region’s upper level atmosphere has changed significantly since 2010, which is somewhat unexpected. Studies of the region’s urban development can explain this discrepancy to some extent. Data from statistical yearbooks reveals that the urban population of Shenzhen, where the radar wind profiler is located, continued to increase rapidly after 2010 by 7.2618 million residents, or approximately 70%, between 2010 and 2020. Furthermore, the Shenzhen Basic Ecological Control Line was introduced in around 2006 to prevent the built-up urban area from encroaching on ecological spaces. As a result of this regulation, expansion of Shenzhen’s built-up area was negligible between 2010 and 2020. To accommodate the growing population and required development space, the city grew vertically. According to local news media, Shenzhen had 158 skyscrapers above 200 m as of October 2021, which is more than in any other city worldwide. In 2018, local media reported that Shenzhen had just 96 skyscrapers of this size. Although these data were from non-governmental sources, they confirm the rapid growth in the number of high-rise buildings in Shenzhen. The construction of large numbers of high-rise buildings significantly increased the roughness of the region and anthropogenic heat emitted into the upper level atmosphere, resulting in a rapid increase in the air temperature of the upper level over the 10-year study period and rapid decrease in the mean wind speed.
When trying to explain the causes of climate change in the vertical direction by using the increase of skyscrapers, another problem arises, namely, why the impact of the increase of the number of skyscrapers is more obvious in the higher elevation? While this can be explained by the footprint theory of flux observation (Zhang et al., 2015). According to the footprint theory on atmospheric observation, the higher the observation height, the larger the range represented by the observational data. In the current study, the data observed by ground level automatic weather station (AWS) only represent local information, while the data detected at high altitude usually have a larger range of representativeness. In this study, the AWS is located in an airport. In order to ensure the safety of aircrafts taking off and landing, there are strict restrictions on the height of buildings around the airport. Therefore, the data observed by the AWS mainly reflects the local climate characteristics of low-density built-up areas similar to the suburbs. While at high altitudes, the observational data are representative in a much larger range due to the advection transportation and turbulent mixing of energy and mass. Under such conditions, the impact of high-rise buildings in urban built-up areas far away from the airport may gradually emerge. This is possibly the reason why the impact of the increase of the number of skyscrapers is more obvious in the higher elevation.
These changes in the climate of the upper level atmosphere will clearly impact regional pollution and meteorological conditions. Based on previous studies, we can infer the following. 1) Warmer environment will lead to the production of O3, and gradually rising virtual temperatures in the region will create more favourable conditions for O3 production. Particularly, the increase in the virtual temperature throughout the upper level atmosphere increases the vertical area suitable for O3 production. 2) The dominant wind direction in winter in the PRE is northerly, which causes inflow of inland pollutants or precursors to the PRE, and the rapid increase in winter virtual temperatures may adversely affect O3 pollution in the PRE. 3) In winter, the virtual temperature increases more in the upper level atmosphere than at the ground level, thereby enhancing the temperature inversion and hindering the diffusion of pollutants. 4) The rapid decrease in the upper level wind speed and continuous rise in the WWL hinders the dilution and diffusion of pollutants, leading to deterioration of the atmospheric environment. The overall mean wind speed in winter is lower than that in summer in the PRE, and the greater decrease in wind speed in winter is unfavorable to the atmospheric environment. 5) A reduction in the LLJ frequency may reduce the probability of O3 pollution at night.
We used observation data from a boundary layer radar wind profiler, RASS, and automatic meteorological station at Shenzhen Bao’an International Airport to analyse changes in the wind speed and virtual temperature in the upper level over the PRE between 2011 and 2020. The climate of the upper level atmosphere over the PRE is undergoing large and rapid changes.
At the decadal scale, the virtual temperature and wind speed in the upper level atmosphere over the PRE changed significantly and to a greater extent than those at ground level. Between 2011 and 2020, the linear warming rate of the mean virtual temperature in the upper level atmosphere was 0.24°C/a, whereas the land surface warming rate was 0.17°C/a. Furthermore, the mean wind speed decreased by −0.12 and −0.05 m/s a throughout the upper level atmosphere and at ground level, respectively. Comparison of different seasons showed that both wind speed and virtual temperature in the upper level atmosphere changed more quickly in winter than in summer.
Climate change in the upper level atmosphere over the PRE may affect the region’s atmospheric environment. A rapid increase in the virtual temperature in the upper level atmosphere creates an environment conducive to O3 production, whereas a decrease in the wind speed reduces the dilution and diffusion of pollutants, which negatively affects the atmospheric environment. Particularly, in winter, the rapid increase in virtual temperature causes more pronounced temperature inversions, which together with a notable decrease in the wind speed worsen the atmosphere’s diffusion capability. The probability of LLJ in the upper level atmosphere is also reduced by warming and increased ground roughness, leading to decreased O3 pollution at night.
These findings improve the understanding of the effects of rapid urbanisation on the climate in the upper level above ground and can guide urban planning, management, and development models.
The original contributions presented in the study are included in the article/supplementary materials, further inquiries can be directed to the corresponding author.
LL: writing—original draft, methodology; Q-JZ: software, investigation; P-WC: writing—review and editing; H-LY: funding acquisition, methodology.
This study is supported by National Natural Science Foundation of P.R. China (Grant Nos. U21A6001 and 42075059), the National key R&D project (2018YFE0206200), the Guangdong Major Project of Basic and Applied Basic Research (Grant No., 2020B0301030004), Science and Technology Projects of Guangdong Province (Grant No. 2019B121201002), and the Innovation Platform for Academicians of Hainan Province (YSPTZX202143).
The authors declare that the research was conducted in the absence of any commercial or financial relationships that could be construed as a potential conflict of interest.
All claims expressed in this article are solely those of the authors and do not necessarily represent those of their affiliated organizations, or those of the publisher, the editors and the reviewers. Any product that may be evaluated in this article, or claim that may be made by its manufacturer, is not guaranteed or endorsed by the publisher.
Chan, H-S., Kok, M-H., and Lee, T-C. (2012). Temperature trends in Hong Kong from a seasonal perspective. Clim. Res. 55, 53–63. doi:10.3354/cr01133
Fan, S. J., Fan, Q., Yu, W., Luo, X. Y., Wang, B. M., and Song, L. L. (2011). Atmospheric boundary layer characteristics over the Pearl River Delta, China, during the summer of 2006: Measurement and model results. Atmos. Chem. Phys. 11 (13), 6297–6310. doi:10.5194/acp-11-6297-2011
Fan, S. J., Wang, A., Fan, Q., and Liu, J. (2007). Atmospheric boundary layer concept model of the pearl river delta and its application. J. Trop. Meteorol. 13 (1), 8–13.
Fan, Y., Li, Y., and Yin, S. (2018). Non-uniform ground-level wind patterns in a heat dome over a uniformly heated non-circular city. Int. J. Heat. Mass Transf. 124, 233–246. doi:10.1016/j.ijheatmasstransfer.2018.03.069
Hui, E. C. M., Li, X., Chen, T., and Lang, W. (2020). Deciphering the spatial structure of China's megacity region: A new bay area—the Guangdong-Hong Kong-Macao greater bay area in the making. Cities 105, 102168. doi:10.1016/j.cities.2018.10.011
Li, L., Chan, P. W., Deng, T., Yang, H-L., Luo, H. Y., Xia, D., et al. (2021a). Review of advances in urban climate study in the Guangdong-Hong Kong-Macau greater bay area, China. Atmos. Res. 261, 105759. doi:10.1016/j.atmosres.2021.105759
Li, L., Chan, P. W., Wang, D-C., and Tan, M. (2015). Rapid urbanization effect on local climate: Intercomparison of climate trends in shenzhen and Hong Kong, 1968-2013. Clim. Res. 63, 145–155. doi:10.3354/cr01293
Li, L., Lu, C., Chan, P-W., Lan, Z., Zhang, W., and Yang, H. (2022). Impact of the COVID-19 on the vertical distributions of major pollutants from a tower in the Pearl River Delta. Atmos. Environ. 276, 119068. doi:10.1016/j.atmosenv.2022.119068
Li, L., Lu, C., Chan, P-W., Zhang, X., Yang, H. L., and Lan, Z. J. (2020). Tower observed vertical distribution of PM2.5, O3 and NOx in the Pearl River Delta. Atmos. Environ. 220, 117083. doi:10.1016/j.atmosenv.2019.117083
Li, Z-A., Chan, P., Biling, L., and Lijie, Z. (2021b). Why the number of haze days in Shenzhen, China has reduced since 2005: From a perspective of industrial structure. MAUSAM 69 (1), 45–54. doi:10.54302/mausam.v69i1.230
Lin, M., Hang, J., Li, Y., Luo, Z., and Sandberg, M. (2014). Quantitative ventilation assessments of idealized urban canopy layers with various urban layouts and the same building packing density. Build. Environ. 79, 152–167. doi:10.1016/j.buildenv.2014.05.008
Peng, L., Liu, J-P., Wang, Y., Chan, P. W., Lee, T. c., Peng, F., et al. (2018). Wind weakening in a dense high-rise city due to over nearly five decades of urbanization. Build. Environ. 138, 207–220. doi:10.1016/j.buildenv.2018.04.037
Shi, Y., Hu, F., Fan, G., and Zhang, Z. (2019). Multiple technical observations of the atmospheric boundary layer structure of a red-alert haze episode in Beijing. Atmos. Meas. Tech. 12 (9), 4887–4901. doi:10.5194/amt-12-4887-2019
Shi, Y., and Hu, F. (2020). Ramp-like PM accumulation process and Z-less similarity in the stable boundary layer. Geophys. Res. Lett. 47 (3), e2019GL086530. doi:10.1029/2019GL086530
Song, L., Deng, T., Li, Z., Chen, W., Guo-wen, H., and Fei, L. (2021). Retrieval of boundary layer height and its influence on PM2.5 concentration based on lidar observation over guangzhou. J. Trop. Meteorol. 27 (3), 303–318. doi:10.46267/j.1006-8775.2021.027
Wang, H., Wu, K., Liu, Y., Sheng, B., and Lu, X. (2021). Role of heat wave-induced biogenic VOC enhancements in persistent ozone episodes formation in Pearl River Delta. J. Geophys. Res. Atmos. 126 (12), e2020JD034317. doi:10.1029/2020JD034317
Wang, Q., Wang, Y., Fan, Y., Hang, J., and Li, Y. (2019). Urban heat island circulations of an idealized circular city as affected by background wind speed. Build. Environ. 148, 433–447. doi:10.1016/j.buildenv.2018.11.024
Wei, X., Liu, Y., Liu, Y., and Li, L. (2019). Numerical study of a local PM2.5 pollution event under the typhoon Neoguri (1408) background over a coastal metropolitan city, Shenzhen, China. Phys. Chem. Earth. A/B/C/110, 99–108. doi:10.1016/j.pce.2019.01.001
Whiteman, C. D., Bian, X., and Zhong, S. (1997). Low-level jet climatology from enhanced rawinsonde observations at a site in the southern great plains. J. Appl. Meteorol. 36 (10), 1363–1376. doi:10.1175/1520-0450(1997)036<1363:lljcfe>2.0.co;2
Yang, H., Lu, C., Hu, Y., Chan, P. W., Li, L., and Zhang, L. (2022). Effects of horizontal transport and vertical mixing on nocturnal ozone pollution in the Pearl River Delta. Atmosphere 13, 1318. doi:10.3390/atmos13081318
Yang, H., Zhang, Y., Li, L., Pak-wai, C., Chao, L., and Li, Z. (2020). Characteristics of aerosol pollution under different visibility conditions in winter in a coastal mega-city in China. J. Trop. Meteorol. 26 (2), 231–238. doi:10.46267/j.1006-8775.2020.021
Zhang, H., and Wen, X. (2015). Flux footprint climatology estimated by three analytical models over a subtropical coniferous plantation in Southeast China. J. Meteorol. Res. 29, 654–666. doi:10.1007/s13351-014-4090-7
Zhang, L., Deng, Y., Li, L., Chan, P-W., Luo, H., and Yin, Q. (2022). Why has the trend in humidity variation in Shenzhen changed from decrease to increase while urbanisation has continued? Urban Clim. 44, 101209. doi:10.1016/j.uclim.2022.101209
Keywords: atmospheric boundary layer, local climate, urban climate, pearl river delta, radar wind profiler
Citation: Li L, Zhou Q-J, Chan P-W and Yang H-L (2023) Variation of virtual temperature and wind in the atmospheric boundary layer over the pearl river estuary during 2011–2020. Front. Environ. Sci. 10:1104553. doi: 10.3389/fenvs.2022.1104553
Received: 21 November 2022; Accepted: 21 December 2022;
Published: 05 January 2023.
Edited by:
Hainan Gong, Institute of Atmospheric Physics (CAS), ChinaReviewed by:
Ning Zhang, Nanjing University, ChinaCopyright © 2023 Li, Zhou, Chan and Yang. This is an open-access article distributed under the terms of the Creative Commons Attribution License (CC BY). The use, distribution or reproduction in other forums is permitted, provided the original author(s) and the copyright owner(s) are credited and that the original publication in this journal is cited, in accordance with accepted academic practice. No use, distribution or reproduction is permitted which does not comply with these terms.
*Correspondence: Hong-Long Yang, eWFuZ2hsMDFAMTYzLmNvbQ==
Disclaimer: All claims expressed in this article are solely those of the authors and do not necessarily represent those of their affiliated organizations, or those of the publisher, the editors and the reviewers. Any product that may be evaluated in this article or claim that may be made by its manufacturer is not guaranteed or endorsed by the publisher.
Research integrity at Frontiers
Learn more about the work of our research integrity team to safeguard the quality of each article we publish.