 Qing Zhu
 Yang Yu1
 Tiantao Cheng
- 1Department of Atmospheric and Oceanic Sciences and Institute of Atmospheric Sciences, Fudan University, Shanghai, China
- 2State Environmental Protection Key Laboratory of Formation and Prevention of Urban Air Pollution Complex, Shanghai Academy of Environmental Sciences, Shanghai, China
- 3Environmental Research Center, Duke Kunshan University, Kunshan, China
- 4Xi’an Meteorological Bureau, Xi’an, China
- 5IRDR ICoE on Risk Interconnectivity and Governance on Weather/Climate Extremes Impact and Public Health, Fudan University, Shanghai, China
- 6Shanghai Qi Zhi Institute, Shanghai, China
- 7Innovation Center of Ocean and Atmosphere System, Zhuhai Fudan Innovation Research Institute, Zhuhai, China
- 8Institute of Eco-Chongming (SIEC), Shanghai, China
Since the implementation of pollution prevention and control action in China in 2013, particulate pollution has been greatly reduced, while ozone pollution has become gradually severe, especially in the economically developed eastern region. Recently, a new situation of air pollution has emerged, namely, enhanced atmospheric oxidation, ascending regional ozone pollution, and increasing particle and ozone synergic pollution (i.e., double-high pollution). Based on the long-term observation data from 2015 to 2021, we examined the spatio-temporal characteristics of urban PM2.5 and O3 pollution in the Yangtze River Delta and quantified the effects of meteorological and non-meteorological factors on pollution in four city clusters using stepwise multiple linear regression models. Temporally, PM2.5 decreased gradually year by year while, O3 increased in city clusters. Spatially, PM2.5 declined from northwest to southeast, while O3 decreased from northeast to southwest. Except for southern Zhejiang, other city clusters suffer from complex air pollution at different levels. In general, pollution intensity and frequency vary with city location and time. Single PM2.5 pollution mostly occurred in northern Anhui. Single O3 pollution occurred in central and southern Jiangsu and northern Zhejiang. Synergic pollutions of PM2.5 and O3 mainly occurred in central Jiangsu. The contributions (90%) of non-meteorological factors (e.g., anthropogenic emission) to PM2.5 decrease and O3 increase are far larger than that of meteorological factors (5%). Relative humidity, sea level pressure, and planetary boundary layer height are the most important meteorological factors to drive PM2.5 changes during pollution. Downward solar radiation, total cloud cover, and precipitation are the most important meteorological factors that affect O3 changes during pollution. The results provide insights into particulate and ozone pollution in the Yangtze River Delta and can help policymakers to formulate accurate air pollution prevention and control strategies at urban and city cluster scales in the future.
1 Introduction
The rapid economic growth in past decades has resulted in considerable industrialization, fast urbanization, and vast fossil fuel combustion in China, which emits large amounts of pollutants and then seriously harms air quality and the environment (Chan and Yao 2008; Chen et al., 2013; Sheehan et al., 2014; Qu et al., 2017; Li et al., 2018). The Chinese government has implemented several strict plans of clean air action and a series of control policies since 2012, such as the Action Plan for Prevention and Control of Air Pollution and the Winning Battle for Blue Sky (Chinese State Council 2013b; Chinese State Council, 2018), to reduce major pollutant concentrations, prevent air pollution, and improve air quality. Up to now, air quality has been drastically improved in economically developed areas in the eastern part of the country (Zheng et al., 2017; Zheng et al., 2018; Xue et al., 2019). However, the concentrations of particulate matter in some cities still fail to meet China’s National Ambient Air Quality Standards (NAAQS) (MEE 2012) and are far from meeting the air quality guidelines recommended by the World Health Organization (WHO 2006). Meanwhile, ozone (O3) shows an obvious upward trend and becomes the primary pollutant in most cities, including populous megacities (Li et al., 2017; Wang et al., 2019; Xu et al., 2019; Zeng et al., 2019). Numerous studies have proven that high levels of PM2.5 (particulate matter with aerodynamic diameters <2.5 μm) and O3 are harmful to long-term exposed people, animals, and plants due to raising the risk of mortality (PopeIII et al., 2006; Lepeule et al., 2012; Canella et al., 2016; Cohen et al., 2017; Poursafa et al., 2022). Additionally, environmental pollution is found to be a potential culprit for the high and progressively younger incidence of some human diseases (Xu et al., 2022). Recently, the synergic pollution of high concentrations of PM2.5 and O3 has been frequently observed in China during agricultural biomass burning periods (Ding et al., 2013) and between late spring and early autumn (Tie et al., 2019), accompanying higher atmospheric oxidation and more secondary components (Zhang H. L. et al., 2015; Song et al., 2017). However, this new situation of air pollution is puzzling because the understanding of full chemical reactions is limited.
After years of pollution control efforts, the emission of primary particulate matter has dramatically reduced in China, and secondary generation dominates particulate matter origination in many areas (Wang et al., 2016). Although secondary PM2.5 and O3 share common precursors, they have different formation mechanisms. O3 is known to be a typical secondary component mainly formed by photochemical reactions of NOx and volatile organic compounds (VOCs) in the presence of ultraviolet light (Pusede et al., 2015; Wang et al., 2017). In fact, there exists a complex non-linear relationship between aerosol and O3, that is, PM2.5 with sophisticated physicochemical properties affects the formation and loss of O3 (Stadtler et al., 2018; Li et al., 2019), and in turn, O3 can impact atmospheric oxidation capacity and thus secondary aerosol formation (Pathak et al., 2009; Wang et al., 2016). Furthermore, air pollution is closely linked with climate change, and they interact through complex approaches in the atmosphere. For example, the changes in emissions and meteorological conditions have been confirmed to influence ambient pollutants together (He et al., 2003; Wang L. et al., 2015; Khuzestani et al., 2017). Using a multi-resolution emission inventory for China, Zheng et al. (2018)estimated nationwide changes of PM2.5, SO2, NOx, and NMVOCs by −33%, −59%, −21%, and 2% between 2013 and 2017. Meteorological conditions can affect urban pollution (Tie et al., 2009), and their role varies with the terrain (Zhao et al., 2020). In the future, global climate change will exacerbate air pollution and cause unignorable climate-driven air pollution mortality (Hong et al., 2019).
O3 as a major pollutant, has a significant impact on the air quality of the Yangtze River Delta (YRD), accounting for 55.4% of total days exceeding pollution standards in 2021 (accounting for 37.2% in 2015) (MEE 2015; MEE 2021). Daytime mean concentration of O3 and its proportion acting as the major pollutant have increased significantly year by year due to rapid urban expansion in the YRD (Gu et al., 2011; Liao et al., 2015; Han et al., 2017). Previous studies focused on either particulate matter or O3 pollution events at national or regional scales (Jiang et al., 2012; Tie et al., 2013; Gao et al., 2016; Ming et al., 2017; Shu et al., 2017; Dai et al., 2021), but paid less attention to their double-high pollution (DHP) episodes. Dai et al. (2021) investigated the DHP events in 25 cities of the YRD from 2013 to 2019 and found that they are mainly affected by high humidity, high surface temperature, and low wind speed. Qin et al. (2021) revealed the spatial distribution, trends, and meteorological characteristics of DHP periods in the YRD between 2015 and 2019. In this region, the pollutants show obvious spatial discrepancy due to different land use types, urban morphology, geographical location in city agglomerations (Zhang Q. et al., 2019; Mao et al., 2022), and strong seasonal variation and temporal correlation between cities within 250 km (Hu et al., 2014; Shen et al., 2017).
This paper used observation of the major pollutants in the YRD from 2015 through 2021 to explore the spatio-temporal pattern of PM2.5 and O3 pollution. The goal is to characterize the pollution periods and their geographical differences from a regional city-cluster perspective and unravel the nature of PM2.5 and O3 synergic pollutions and related drivers, including meteorological and other factors. The results will provide insights into the current situation and upcoming challenges of air pollution and help policymakers to adopt further strategies for precise pollution control and prevention.
2 Materials and methods
2.1 Overview of city clusters
The YRD is one of the most economically developed and populous regions in China, with the largest urban agglomeration, including 41 cities, such as Shanghai (SH), Nanjing (NJ), Hangzhou (HZ), Suzhou (SZ), and Hefei (HF), etc. (Figure 1). The YRD has a complex land cover with plains mainly spreading in the north and east, and low and middle mountains in the southwest and south. We analyzed the correlation between PM2.5 and O3 in these 41 cities and then classified them as four city clusters, that is, Huaibei (HBC), Wanjiang (WJC), Jiangsu-northern Zhejiang-Shanghai (JZS), and southern Zhejiang (ZSC), based on high correlation coefficients (R ≥ 0.8) and similarities in land cover (Figure 1). The spatial differences of PM2.5 and O3 concentrations are general small inside each city cluster but large between different city clusters. In addition, the city that holds the highest correlation coefficients with other cities in pollutant concentrations was selected as the proxy of one city cluster for the following analysis (Supplementary Figure S1). Four typical cities, Huaibei (HB), Hefei (HF), Wuxi (WX), and Jinhua (JH), were selected as indicators for the above-mentioned city clusters (Table 1).
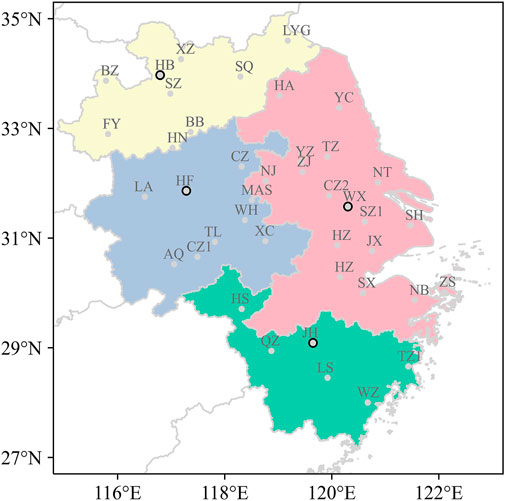
FIGURE 1. Spatial distribution of 41 cities in the Yangtze River Delta (YRD), including HBC (yellow), WJC (blue), JZS (pink), and ZSC (green). The dots with black circles denote four representative cities (Table 1).
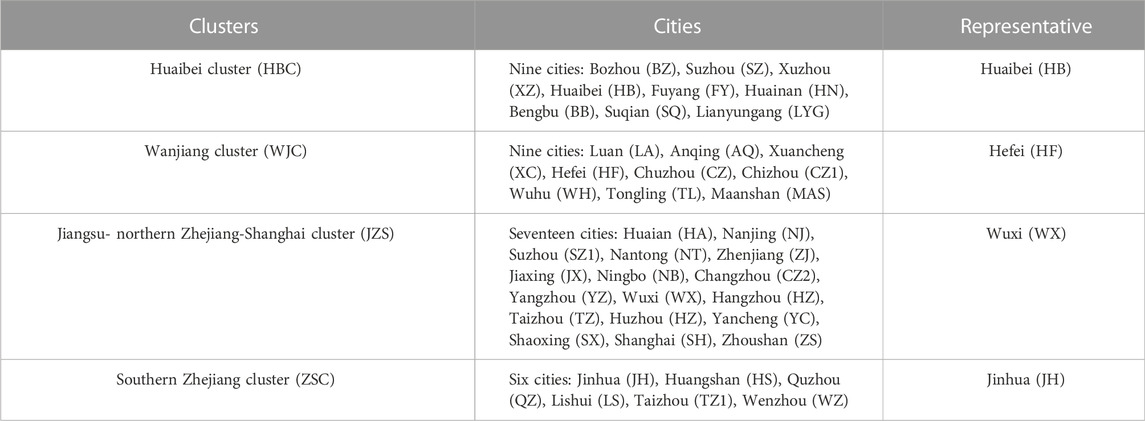
TABLE 1. Classification of urban agglomerations.
2.2 Data of air quality and meteorology
Hourly concentrations of O3, PM2.5, CO, SO2, and NO2 were taken from the archived data (https://quotsoft.net/air) of the Ministry of Ecology and Environment of China (Wang 2022). As part of the Clean Air Action Plan launched in 2013, the observation network on pollutants covers 496 sites in 74 major cities across the country (Chinese State Council 2013a) and has been extended to more than 2000 sites by 2021. The NAAQS guidelines are strictly abided by instrument operation and management, data assurance, and quality control, and SO2, NO2, and CO are monitored at the same sites as PM2.5 (MEE 2012; Zhang and Cao 2015). Data used here span from January 2015 to December 2021, and their statistical validity is assessed by the Ambient Air Quality Standard (GB 3095-2012) and the trial Technical Specification for Ambient Air Quality Evaluation (HJ 663-2013) (Yang et al., 2020). The daily averages of PM2.5, CO, SO2, and NO2 were computed by their hourly averages at every site that contains more than 20 h of valid records in 1 day. The 8-h average of O3 concentrations was calculated by its hourly values that possess at least six serial valid records within every 8 h. The maximum daily 8-h average (MDA8) O3 concentration was determined by 8-h averages in 1 day that has more than 14 valid records from 8:00 to 24:00 local time (LT).
The meteorological data used in this study came from the fifth-generation European Center for Medium-Range Weather Forecasts atmospheric reanalysis (ERA5), with a horizontal resolution of 0.25° × 0.25°. The meteorological data in ERA5 are more accurate than other reanalysis data, notably for meteorological elements at the surface and in the low troposphere, and thus are currently employed in various scientific studies (Meng et al., 2018; Song et al., 2020). In order to minimize the error caused by interpolation, the neighboring method was used to match the in-situ observation data of air quality with the nearest grid data of ERA5 (Liu et al., 2015; Zhu and Yuan 2019). In light of the method of previous studies (Leung et al., 2018; Li et al., 2019; Chen et al., 2020), we used 26 meteorological parameters (Supplementary Table S1) as original candidate predictors for multiple linear regression (MLR) fitting, averaged over 24 h or daytimes (08:00–17:00 LT).
2.3 Estimation of secondary aerosols
The rapid increase of secondary particulate matter can lead to heavy pollution events with high PM2.5 loadings (Dao et al., 2021). In addition, atmospheric precursors experience complex non-linear chemical reactions in secondary generation under favorable meteorological conditions. Analytical methods of real-time PM2.5 monitoring cannot determine all secondary components. Chang and Lee (2007) used pollutant observations and employed CO as a tracer for primary emissions to estimate secondary PM2.5 concentrations at different photochemical activities. The estimation of summertime secondary aerosols has been carried out in many cities in China (Cui et al., 2013; Jia et al., 2017; Li H. L. et al., 2020; Gu et al., 2022; Yao et al., 2022; Yu et al., 2022), and research has proven that the method of CO tracer is able to screen primary PM2.5 and estimate urban-scale secondary PM2.5 concentration. The formation of secondary particulate matter links closely with photochemical activity. In particular, O3 has commonly acted as an index of photochemical reactions to quantify the role of secondary particulate matter in air quality changes (Turpin and Huntzicker 1995; Na et al., 2004; Chang and Lee 2007; Wang Z. S. et al., 2015). Taking CO as a primary tracer and assuming that the structure of the emission source remains essentially stable, the larger the PM2.5/CO, the larger the proportion of secondary-PM2.5 (Chang and Lee 2007; Zhang Q. Y. et al., 2015). We divided the photochemical activity into four groups based on the daily hourly maximum of O3 concentration (O3,max): low for below 100 µg m−3, moderate for 100–160 µg m−3, high for 160–200 µg m−3, and very-high for above 200 µg m−3. The primary aerosols were estimated using hourly CO concentrations under different photochemical activity levels. Meanwhile, the secondary aerosols were calculated by deducting primary PM2.5 from observed PM2.5 (Cui et al., 2013; Li K. et al., 2020; Yu et al., 2022).
where, i (i = 1,2,3) denotes moderate, high, and very-high photochemical activity levels, respectively. (PM2.5)s represents secondary PM2.5 concentration. (PM2.5)t, and COt represent total concentrations of PM2.5 and CO in the atmosphere. (PM2.5/CO)low refers to the 25th percentile of hourly ratios for PM2.5/CO at a low photochemical activity.
2.4 Stepwise multiple linear regression model
To quantify the influence of meteorology on air quality, we developed a stepwise MLR model to establish the relationship between pollutant concentrations and meteorological variables. The MLR model has been successfully applied in evaluating meteorological effects on PM2.5 and O3 changes (Tu et al., 2007; Tai et al., 2010; Xu et al., 2011; Yang et al., 2016; Wang et al., 2017; Zhao and Wang 2017; Yang et al., 2019; Zhai et al., 2019).
where Ci,p,c(t) is the observed daily pollutant i concentration (PM2.5 or MDA8 O3) at period p and city c, Metk(t) is one of the N meteorological predictors, b0 is the intercept term, bk is the regression coefficient of the k-th meteorological predictor, and ε is the residual term.
This study used the method of Chen et al. (2020) to obtain the best meteorological predictor. We minimized the effect of correlations between predictor variables using variance inflation factor (VIF) (Altland 1999; Che et al., 2019; Li H. L. et al., 2020) and based on the Akaike Information Criterion (AIC), adding or deleting statistical predictor variables to obtain the best fitting model when AIC reaches a minimum (Kutner et al., 2004). Supplementary Tables S2, S3 present optimal meteorological variables, calculated intercepts (b0), regression coefficients (bk), and adjusted coefficients of determination (R2) for each city and period. The calculated adjusted R2, which reflects the fraction of variability described by MLR, is 0.2–0.6 for PM2.5 and 0.5–0.8 for MDA8 O3, indicating the MLR model works reasonably well.
2.5 Estimation of meteorological and non-meteorological contributions
The meteorological-driven changes (or trends) of pollutant concentrations (ΔP) were calculated directly from the predicted concentration (P(t)) after the MLR model was established:
where ΔMetk denotes the change (or trend) of the k-th meteorological variable. Non-meteorological driven changes (or trends) are mainly attributed to changes in anthropogenic emissions (Akaike 1969; Seo et al., 2018) and can be obtained from the difference between observed (ΔC) and meteorological-driven (ΔP) values. The relative contribution of each meteorological variable to total meteorological-driven changes (or trends) was quantified by the ratio of (bk × ΔMetk) to ΔP. The meteorological variable with the largest contribution was considered the meteorological variable with the largest impact on PM2.5 and O3 changes or trends.
3 Results and discussion
3.1 Characteristics of PM2.5 and O3 pollutions
3.1.1 Trends of PM2.5 and O3 concentrations
In almost all cities of the YRD, PM2.5 shows a downward trend from 2015 through 2021 (Supplementary Figure S2), and the proportion of cities with PM2.5 exceeding the standard (ES) of air quality (annual mean PM2.5 larger than 35 μg m−3) descends from 95.1% to 51.2%. The annual mean of PM2.5 concentration was highest (66 μg m−3) in Hefei in 2015 and in Fuyang (49 μg m−3) in 2021. Meanwhile, MDA8 O3 shows an upward trend in 2015–2019 and then a downward trend in 2020–2021, and the proportion of cities with MDA8 O3 ES of air quality (MDA8 O3 90Per larger than 160 μg m−3) in total cities ascents from 41.5% to 80.5% and then descends to 68.3%. The 90Per of MDA8 O3 was the highest (196 μg m−3) in Yangzhou in 2015 and in Changzhou (195 μg m−3) in 2021. On the other hand, in terms of spatial distribution pattern, PM2.5 generally reduced from northwest to southeast, while O3 reduced from northeast to southwest.
Figure 2 depicts the inter-annual variations of PM2.5 and O3 concentrations in the YRD. PM2.5 decreased by 24.1%, 34.1%, 40.1%, and 39.1% between 2015 and 2021 in HBC, WJC, JZS, and ZSC city clusters, respectively, especially in the JZS, with the most notable reduction. Obviously, PM2.5 in the HBC city cluster is much higher than others (Figure 2A), and most cities in this cluster suffer from severe particle pollution because of large coal consumption as they are located in coal-producing areas. In contrast, PM2.5 in the ZSC city cluster is far lower than that in other city clusters due to natural vegetation coverage (Figure 2A). In particular, Lishui, Wenzhou, and Taizhou have already met the NAAQS. PM2.5 of the HBC city cluster increased slightly before 2017 (Figure 2A). In fact, most cities in Anhui province showed an increase of PM2.5 at the same time, especially in Fuyang, Huaibei, and Suzhou. It is worth noting that Xuzhou, situated at the junction of Jiangsu, Shandong, Henan, and Anhui provinces, is vulnerable to non-local pollutants transported from remote sources and thus has a relatively higher PM2.5 level than surrounding cities. On the other hand, Xuzhou is the only southern city that is allowed to provide centralized heating in winter, which is bound to coal-fired emission pollution (Wang et al., 2020).
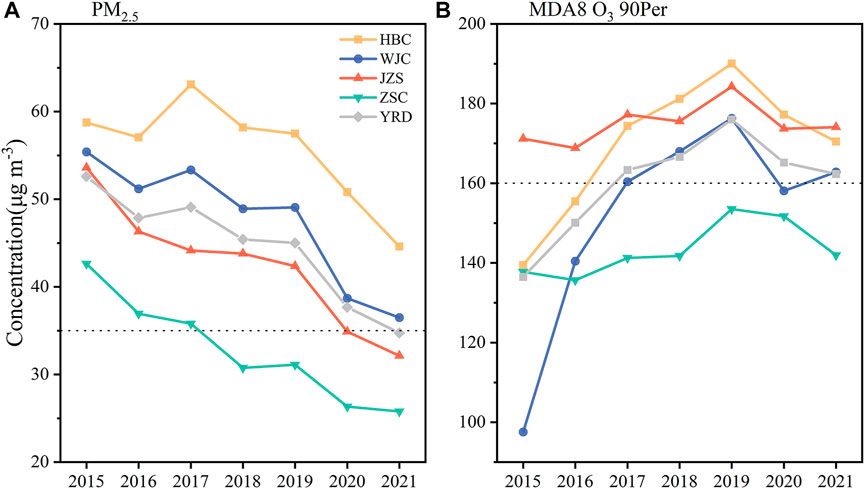
FIGURE 2. Inter-annual variations of (A) mean PM2.5 and (B) MDA8 O3 90Per in four city clusters and the YRD during 2015–2021. Black dotted lines denote the Class II of air quality standards (GB3095-2012).
MDA8 O3 shows a tipping point in 2019, with a rising trend before 2019 and a falling trend afterward (Figure 2B). The increasing rates were 22.2%, 66.9%, 1.7%, and 3% in the HBC, WJC, JZS, and ZSC city clusters, respectively, from 2015 through 2021. The MDA8 O3 in the JZS city cluster exceeded the NAAQS and kept fluctuating at a high level (Figure 2B), indicating that the urban group has been suffering from serious O3 pollution for a long time. By contrast, the rising trend of MDA8 O3 in the ZSC city cluster was insignificant, and all cities met the NAAQS (Figure 2B). The most notable increase of MDA8 O3 occurred in the WJC city cluster, especially in 2016, with an increase of 43 μg m−3 (Figure 2B), which is mainly attributed to anthropogenic emissions. On the whole, the ZSC city cluster has the best air quality in the YRD, whereas others have varying severity of combined PM2.5 and O3 pollution.
Figure 3 presents inter-monthly variations of mean PM2.5 and MDA8 O3 concentrations. PM2.5 and MDA8 O3 show contrary long-term trends on a monthly-scale. Previous studies have found that high particulate matter loadings usually match low O3 concentrations in the cold season (Sun L. et al., 2019), and low particulate matter loadings match high O3 concentrations in the warm season (Li et al., 2016). PM2.5 generally exhibits high levels in winter and low levels in summer due to fossil fuel combustions in the cold season and turbulent vertical mixing (Ding et al., 2013; Yue et al., 2015; Zhang et al., 2018), usually reaching peaks in December or January and troughs in July, with a single-peak-valley pattern. The increased emissions during the winter heating period in North China can exacerbate particulate matter pollution in the Yangtze River Delta through the long-range transport of pollutants (Zhang H. L. et al., 2015; Zhao et al., 2015). The monthly PM2.5 of the ZSC city cluster fluctuates slightly around 40 μg m−3, far less in magnitude compared with other city clusters (Figure 3A). Meanwhile, PM2.5 in these city clusters had almost no difference in the first 2 years (2015-2016), but an obvious difference in the following 5 years (2017-2021), especially in the months before and after the peak. Except for July and August, the median PM2.5 of all city clusters is higher than 35 μg m−3, indicating that most cities in the YRD suffer from PM2.5 pollution to some extent.
FIGURE 3. Inter-monthly variations of monthly mean (A) PM2.5 and (B) MDA8 O3 in four city clusters during 2015–2021. Black dotted lines denote the linear trendlines of the whole YRD.
MDA8 O3 continues to rise with double-peak-valley fluctuations, with the peaks in May or June and September, and the troughs in July and December (Figure 3B). The closer to the peak month, the greater the difference in concentrations among four city clusters. High temperature, low relative humidity and intense solar radiation enhance O3 formation in summer, whereas the meteorological conditions unfavorable to photochemistry and increasing NO titration suppress O3 yield (Yang et al., 2021).
Figure 4 shows the ratios of major pollutants from 2015 through 2021 relative to 2015 as the reference in Huaibei, Hefei, Wuxi, and Jinhua cities. PM2.5 exhibited a consistent decline in Hefei, Wuxi, and Jinhua. However, it rose dramatically before 2017 and then turned to a continuous decline in Huaibei (Figure 4A). In all four cities, MDA8 O3 showed an increase before 2019 and subsequently decreased, a time point of COVID-19 occurrence (the beginning of December 2019). Hefei has the greatest increase from 2015 through 2019, with an increment of almost 80% (Figure 4B), far higher than the growth of the other three cities. NO2 showed long-term changes similar to O3. On the whole, SO2 reduced year by year at an average range of 53.9%–73.7%, and CO gradually decreased by 22.6%–41.2%. The reasonable explanation is the emission reduction of primary pollutants and related precursors by the implementation of the air cleaning plan since 2013, including efficient control methods such as tightening industrial emissions, modernizing industrial boilers, retiring outdated industrial capacity, and encouraging clean fuels in the residential sector (Lang et al., 2017; Shao et al., 2018; Zhai et al., 2019; Zhang T. et al., 2019). Since the outbreak of COVID-19, human activities were reduced due to disease control regulations that lasted throughout 2020 and 2021 (Wang and Zhang 2020).
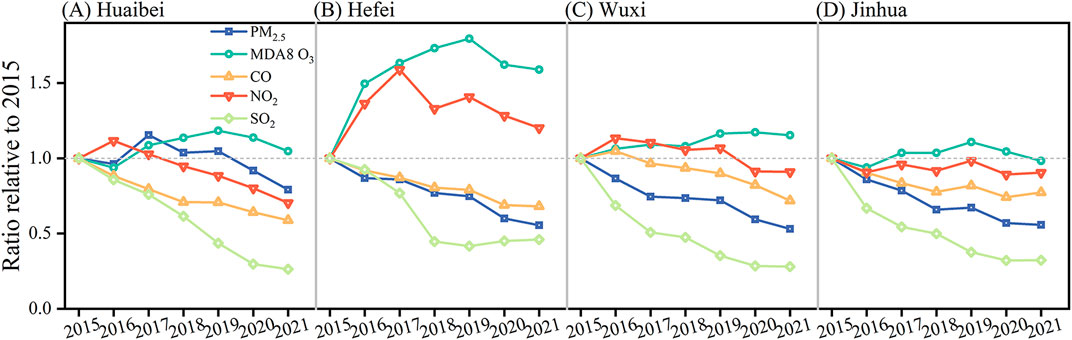
FIGURE 4. Inter-annual variations of pollutants annual mean concentration ratios of 2015–2021 relative to the reference (2015) for (A) Huaibei, (B) Hefei, (C) Wuxi, and (D) Jinhua cities.
3.1.2 Intensity of PM2.5 and O3 pollutions
According to the Class II of NAAQS, we defined the single particulate matter pollution (uni-PM2.5) as the day with only daily PM2.5 exceeding 75 μg m−3, the single O3 pollution (uni-O3) as the day with only MDA8 O3 exceeding 160 μg m−3, and the synergic pollution of particulate matter and O3 (bi-PM2.5-O3) as both PM2.5 and MDA8 O3 above the aforementioned standards in a day (i.e., DHP pollution). Figures 5A–C shows the cumulative days of uni-PM2.5, uni-O3 and bi-PM2.5-O3 in the YRD from 2015 through 2021. Overall, from a spatial perspective, the total number of uni-PM2.5 days decreased gradually from northwest to southeast in the YRD region, with the maximum number of days found in the north, including northern Anhui and northern Jiangsu provinces (Figure 5A). The uni-O3 increased form northeast to southwest, with the maximum number of days in the central YRD, including southern Jiangsu, Shanghai, and northern Zhejiang (Figure 5B). The bi-PM2.5-O3 days mainly occurred in northern Anhui and Jiangsu provinces, especially on the line from Bozhou to Shanghai (Figure 5C). From seasonal perspective, the uni-PM2.5 days mostly occurred in winter (November-February). However, the uni-O3 days mainly appear in warm seasons (April -September), with two peaks in May, June and September (Supplementary Figure S3). The bi-PM2.5-O3 days mainly occur from late spring to early summer and late autumn, similar to O3 pollution, with more distinct and obvious two peaks in April and October (Supplementary Figures S3, S4). Serious bi-PM2.5-O3 pollution always occurred in the cities in central and southern Jiangsu province in April, whereas in the cities in northern Anhui province, bi-PM2.5-O3 pollution occurred in October (Supplementary Figure S4). The uni-PM2.5 days significantly decreased year by year in every city, especially in the HBC and WJC city clusters (Supplementary Figure S5A). Except for the ZSC city cluster, the uni-O3 days increased in the other three city clusters, peaked in 2019, and then decreased until 2021 (Supplementary Figure S5B). Among them, the WJC city cluster has the most rapid growth, indicating an increasing severity of O3 pollution in recent years. The bi-PM2.5-O3 days have prominent inter-annual changes and appear notably in 2015 and 2018 (Supplementary Figure S5C).
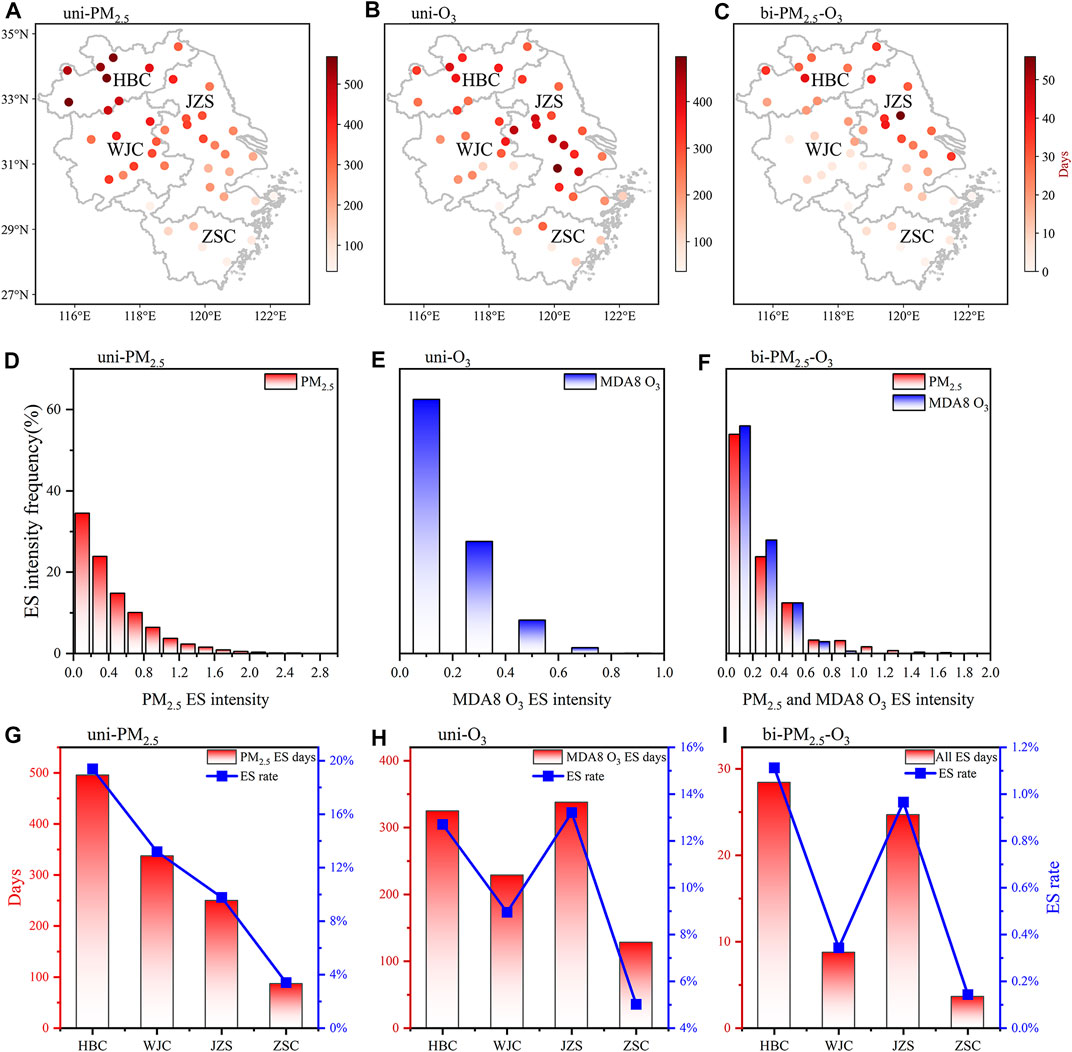
FIGURE 5. Cumulative days of air quality exceeding standard (ES) for cities (A–C), frequency statistics of ES intensity for the YRD (D–F), and total ES days and ES rates for four city clusters (G–I) during 2015–2021. (A,D,G) are ES of only PM2.5, (B,E,H) are ES of only MDA8 O3, and (C,F,I) are ES of both PM2.5 and MDA8 O3. The ES intensity was determined by the ratio of difference (between a pollutant concentration and corresponding standard) to the standard.
Figures 5D–F show the frequency statistics of pollution intensity of uni-PM2.5, uni-O3, and bi-PM2.5-O3 in YRD from 2015 through 2021. PM2.5 concentrations were higher during uni-PM2.5 than bi-PM2.5-O3. However, opposite to particulate matter, MDA8 O3 concentrations were lower during uni-O3 than bi-PM2.5-O3, which is similar to the results of Qin et al. (2021) and Awang et al. (2018). Figures 5G–I present the cumulative polluted days and the percentages of total ES days in city clusters from 2015 through 2021. The HBC city cluster has the most serious uni-PM2.5, with a total of 496 polluted days (19.4%). The JZS and HBC city clusters exhibit the most severe uni-O3, with percentage of 13.2% (338 days) and 13.7% (325 days). Meanwhile, the HBC and JZC city clusters have the worst bi-PM2.5-O3 pollution, with a total of 28 days (1.1%) and 25 days (1%). Qin et al. (2021) reported that the highest frequency of bi-PM2.5-O3 pollution appeared in Shanghai and the lowest in Anhui in the YRD. This inconsistency with our results may be related to the discrepancy in the pollution region divisions concerned.
3.2 Potential influence between PM2.5 and O3
Atmospheric oxidation refers to the ability of the atmosphere to remove pollutants through oxidation reactions, and strong atmospheric oxidation can promote the formation of secondary pollutants and particle aging (Levy 1971). In this study, we introduced OX (OX = O3 + NO2) to describe the atmospheric oxidative capacity (Cheung and Wang 2001; Clapp and Jenkin 2001; Herndon et al., 2008; Zhang et al., 2012), and to analyze the relationship between O3 and atmospheric oxidation. PM2.5 concentrations were almost the same in four typical cities in April and October, but O3, O3/Ox ratio, and the Pearson correlation coefficients between O3 and Ox were generally higher in April than those in October (Figure 6; Table 2), indicating that O3 had a more obvious contribution to atmospheric oxidation in April and varied significantly between cities. The O3/Ox ratios greater than 0.5 indicated that atmospheric oxidation was mainly dominated by O3.
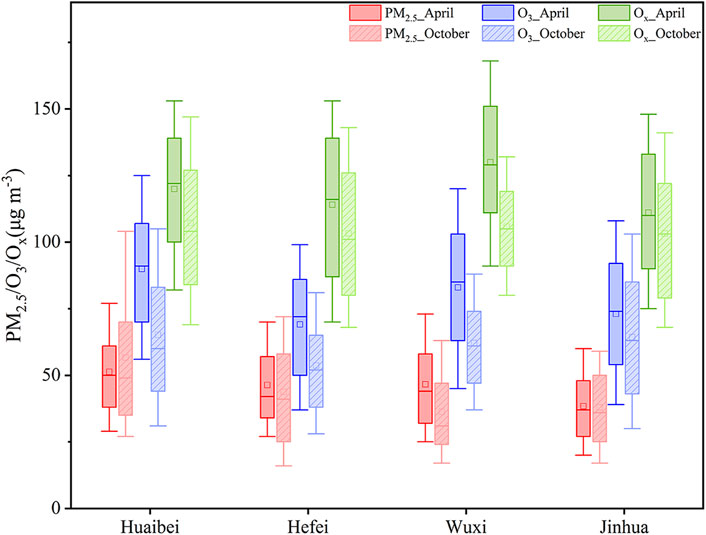
FIGURE 6. PM2.5, O3, and OX (=O3+NO2) concentrations of Huaibei, Hefei, Wuxi, and Jinhua cities in April and October from 2015 through 2021. The upper and lower boundaries of the box represent the 75th and 25th percentiles, respectively. The short line within the box represents the median. The whiskers represent the 10th and 90th percentiles. The square represents the average.
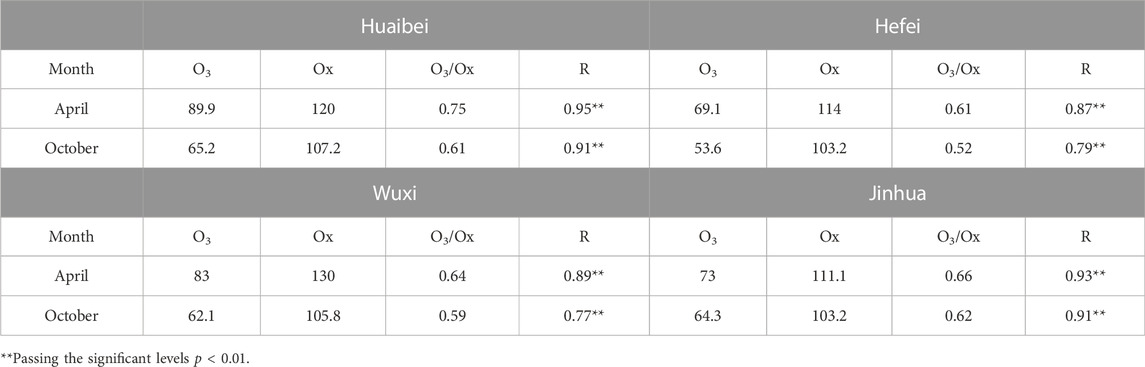
TABLE 2. O3, OX (OX = O3 + NO2) averages and ratios of O3/OX as well as correlations (R) between OX and O3 in April and October over 2015–2021 in Huaibei, Hefei, Wuxi, and Jinhua.
Figure 7 shows the proportions of estimated secondary components in PM2.5 for four typical cities in April and October under different photochemical activity levels. The insignificant changes in primary PM2.5 indicated that the structure of primary emission sources in these cities remained stable. The proportions of secondary particulate matter in October were generally greater than that in April in Hefei, Wuxi, and Jinhua cities, but it was the opposite in Huaibei city, with high photochemical activities. Hefei city had the smallest proportion of secondary particulate matter. The higher the photochemical activity levels, the larger the proportion of secondary components in PM2.5. The results indicate that the generation and accumulation of secondary particulate matter have increasing significance on PM2.5 concentrations and demonstrate that secondary PM2.5 links closely with O3 in a synergistic manner.
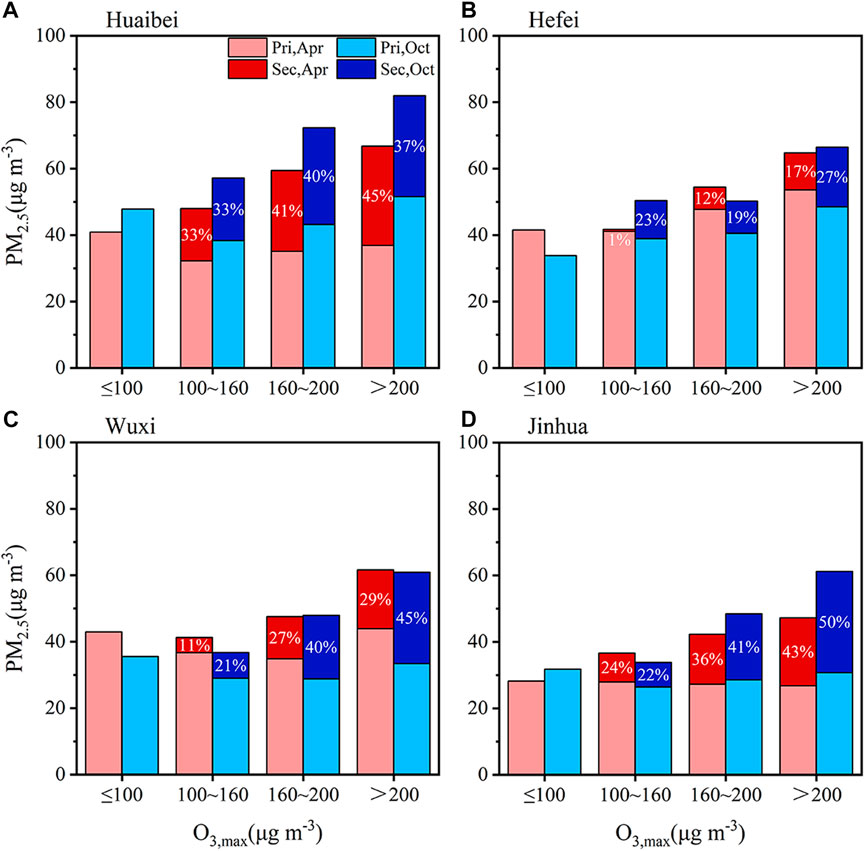
FIGURE 7. Proportions of secondary components in ambient PM2.5 (primary plus secondary) under different photochemical activities in (A) Huaibei, (B) Hefei, (C) Wuxi, and (D) Jinhua cities in April and October from 2015 through 2021.
Based on the observation data of cities in the YRD, PM2.5 was divided into low (≤35 µg m−3), medium (35–75 µg m−3), and high (>75 µg m−3) levels. Figure 8 shows the diurnal variations of the O3 change rate calculated using hourly O3 concentrations at the above three PM2.5 levels. The daily trends of O3 change rates were almost the same in the four cities at different PM2.5 levels, that is, zero from 22:00 to 7:00 LT, positive from 7:00 to 16:00 LT, and negative from 16:00 to 22:00 LT. The daily variations of O3 concentrations exhibited a single-peak-valley pattern, with the peak occurring at 11:00–12:00 LT and the trough at 17:00–18:00 LT. This was probably due to changes in solar radiation, traffic emissions, the amount of NOx and VOCs precursors, NO titration effect on O3 consumption, photochemical reactions, etc. Several studies (Deng et al., 2011; Cai et al., 2013; Zhao et al., 2018) have shown that high concentrations of PM2.5 absorb and weaken total solar radiation, reducing the rate of photochemical reactions and thus inhibiting O3 production. While Figure 8 depicts that with the increase of PM2.5 loadings, the peak range of O3 variability gradually broadens, implying that the increase of PM2.5 concentration in these cities can promote O3 production to some extent in April and October. Additionally, Chi (2018) and Zhu (2018) discovered that an increase in aerosol raises the concentration of O3 in conditions of clear skies and light pollution. This demonstrates once more that there is no straightforward linear link between aerosols and O3 concentration.
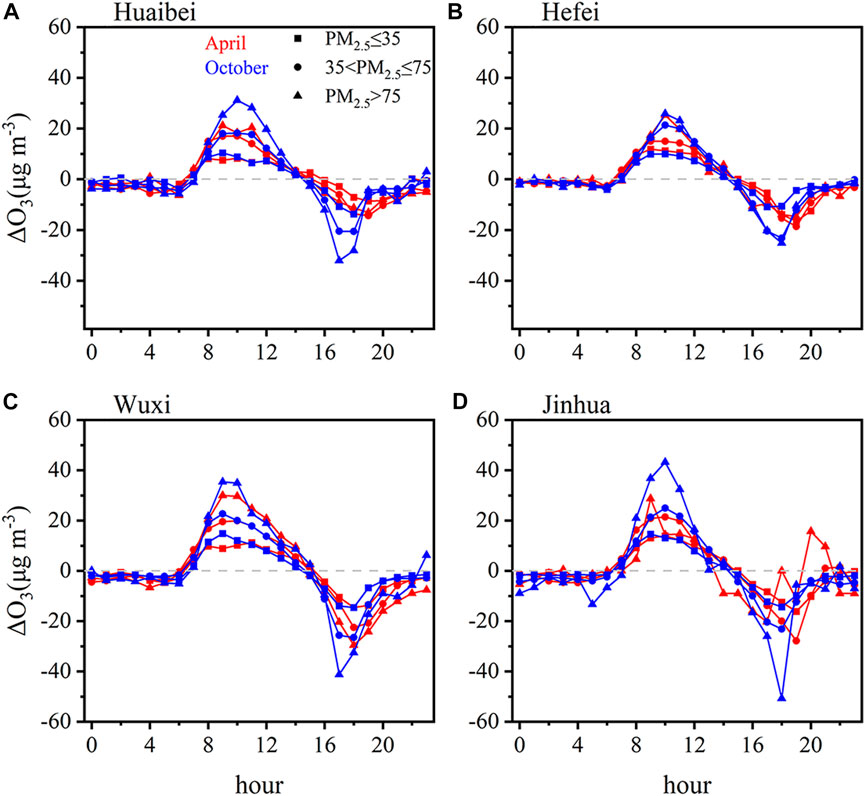
FIGURE 8. Diurnal variations of O3 increment (next minus previous) at three PM2.5 levels in (A) Huaibei, (B) Hefei, (C) Wuxi, and (D) Jinhua cities in April and October from 2015 through 2021. Positive and negative indicate the production and loss of ozone.
3.3 Driver contributions to PM2.5 and O3 pollutions
3.3.1 Meteorological and non-meteorological contributions
Figure 9A shows the changes in annual mean PM2.5 concentrations from 2015 through 2021 in four typical cities. A significant decline of annual mean PM2.5 was observed in Huaibei, Hefei, Wuxi, and Jinhua cities, with a reduction of 12.21 μg m−3, 29.09 μg m−3, 28.48 μg m−3, and 23.61 μg m−3 between 2015 and 2021, respectively. Among them, the contributions of non-meteorological changes to PM2.5 decrease were estimated to be 12.01 μg m−3, 28.85 μg m−3, 27.82 μg m−3, and 23.15 μg m−3, respectively, accounting for more than 90% of the total decrease. Zhang X. et al., 2019 reported that the improvement of air quality on PM2.5 is primarily due to anthropogenic emission reductions of SO2, NOx, BC, OC, and primary particles. Therefore, implementing pollution control measures is crucial to lowering PM2.5 loadings and reducing pollution (Zhang Q. et al., 2019; Chen et al., 2020; Li K. et al., 2020). The PM2.5 of Huaibei decreased the most because of a significant increase in 2017 due to massive anthropogenic emissions (Supplementary Figure S6A). Compared with 2015, the PM2.5 of Huaibei, Hefei, Wuxi, and Jinhua cities decreased by 0.2 μg m−3, 0.24 μg m−3, 0.66 μg m−3, and 0.46 μg m−3 due to changes in meteorological conditions, accounting for less than 5% of the total reduction (Figure 9A). Weather and climatic changes are conducive to PM2.5 reduction, but do not lead to a substantial improvement in air quality (Zhang T. et al., 2019). However, in specific years, for example, Huaibei in 2016, Wuxi in 2018, and Hefei in 2019, the impact of meteorological conditions on PM2.5 outweighed that of anthropogenic emissions (Supplementary Figure S6A). Therefore, the inter-annual variability in meteorology must be considered in designing future control strategies to improve air quality (Ding et al., 2019).
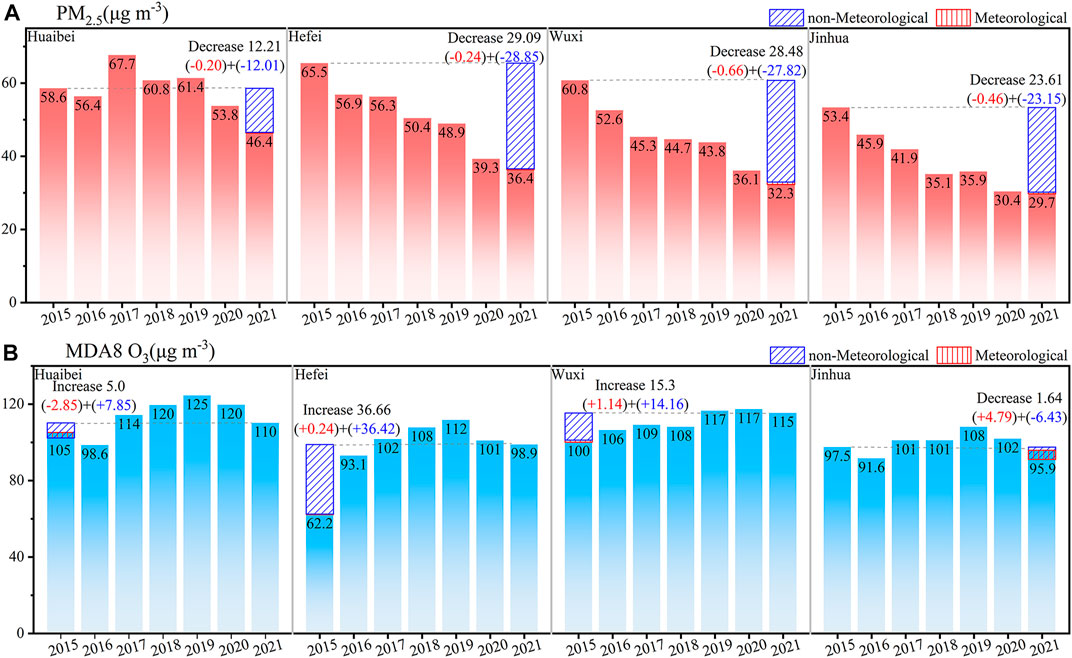
FIGURE 9. Contributions of meteorological-driven and non-meteorological factors to (A) PM2.5 and (B) MDA8 O3 changes between 2015 and 2021 in Huaibei, Hefei, Wuxi, and Jinhua. Observed annual PM2.5 and MDA8 O3 from 2015 through 2021 are shown in solid bars and black numbers. The black values represent the increase or decrease in observed PM2.5 and MDA8 O3 between 2015 and 2021. The red bars and values represent meteorological-driven changes in PM2.5 or MDA8 O3 between 2015 and 2021, while those in blue represent non-meteorology changes.
Figure 9B shows the annual mean MDA8 O3 from 2015 through 2021 for four typical cities. The average MDA8 O3 increased significantly by 5 μg m−3, 36.66 μg m−3, and 15.3 μg m−3 in Huaibei, Hefei, and Wuxi cities, respectively, but it decreased by 1.64 μg m−3 in Jinhua. The non-meteorological change contributed to the increase of MDA8 O3 by 7.85 μg m−3, 36.42 μg m−3, and 14.16 μg m−3 in Huaibei, Hefei, and Wuxi cities, accounting for 73%, 99%, and 93% of total changes, respectively. MDA8 O3 in Jinhua decreases by 6.43 μg m−3 due to non-meteorological changes (Figure 9B). O3 pollution was possibly dominated by the NOx-limited mechanism due to good vegetation coverage in local and surrounding regions. Previous studies have suggested that one reason for the O3 increase is that low PM2.5 loadings reduce sunlight scattering and absorption in the atmosphere, increasing ultraviolet radiation arriving at the ground and leading to high O3 concentrations (Dickerson et al., 1997; Li et al., 2011; Tao et al., 2014). In addition, slowing aerosol sinks of hydrogen peroxide radicals can promote O3 formation (Li et al., 2019). Furthermore, increasing VOCs emissions and reducing NOx titration over urban areas can result in high O3 concentrations (Fu et al., 2019; Sun W. W. et al., 2019). As shown in Figure 9B, the meteorological-driven changes in MDA8 O3 are estimated to be −2.85 µg m−3, 0.24 µg m−3, 1.14 μg m−3 and 4.79 μg m−3 in Huaibei, Hefei, Wuxi and Jinhua cities, respectively. Meteorological conditions have a greater effect on O3 than on PM2.5, varying with city and time (Supplementary Figure S6).
3.3.2 Meteorological-driven trends of PM2.5 and O3
PM2.5 has a positive correlation with O3 at high temperatures and a negative correlation at low temperatures (Zhang et al., 2018; Chen et al., 2019; Yang et al., 2021). In general, the synergic pollution of particulate matter and O3 occurs in April and October (Supplementary Figures S3, S4). Figure 10A shows the annual and monthly trends of PM2.5 concentrations from 2015 through 2021. The mean PM2.5 trend observed in Huaibei, Hefei, Wuxi, and Jinhua cities were −1.7 μg m−3yr−1, −4.6 μg m−3yr−1, −4.2 μg m−3yr−1, and −3.8 μg m−3yr−1, with meteorological factor contributions of 0.05 μg m−3yr−1, 0.05 μg m−3yr−1, 0.11 μg m−3yr−1, and −0.01 μg m−3yr−1, respectively. The changes in meteorological conditions caused an increase or decrease of particulate matter, and their relative contributions for April and October are estimated to be 21% and −21% in Huaibei, 11% and −12% in Hefei, 20% and 3% in Wuxi, and −5% and 21% in Jinhua. We further identified the most important meteorological factors that affect the long-term PM2.5 trend. For example, in Huaibei, the 2-m relative humidity (RH2, −1.35% yr−1) was responsible for 49% of total meteorological contributions in April, and the planetary boundary layer height (PBLH, −6.8 m yr−1) was responsible for 34% in October. As for Hefei, the primary meteorological factor to drive the long-term PM2.5 trend was the daytime PBLH (−12.29 m yr−1), which accounted for 45% of meteorological contributions in October, while sea level pressure (SLP, 0.77 hPa yr−1) was the primary factor in April. As for Wuxi, the most important meteorological factor was SLP (0.68 hPa yr−1) accounting for 61% of meteorological contributions in April, while daytime total cloud cover (TCC, −0.03% yr−1) accounted for 31% of meteorological contributions in October. For Jinhua, the precipitation changes (−0.03 mm yr−1) could explain 43% of the meteorological-driven PM2.5 trend in April, and the daytime PBLH (15.07 m yr−1) could explain 56% of the change in October.
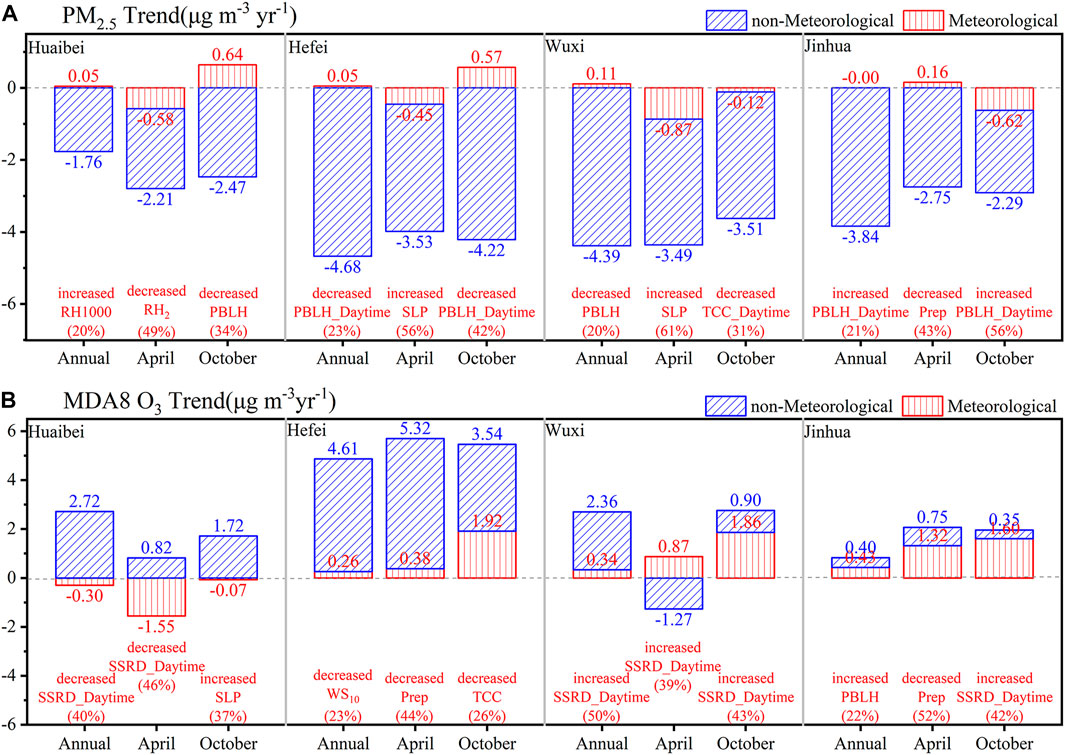
FIGURE 10. Contributions of meteorological-driven and non-meteorological factors to trends of annual, April, and October (A) PM2.5 and (B) MDA8 O3 in Huaibei, Hefei, Wuxi, and Jinhua cities from 2015 through 2021. The contribution of the most influential meteorological factors (percentage) to the total meteorological-driven trend is marked in red.
Supplementary Figures S7A,B present PM2.5 changes relative to the previous year (increment) for April and October. SLP and RH play prominent roles in the PM2.5 increment in April when meteorological impacts outweigh non-meteorological effects, whereas PBLH is prominent in October. According to Chen et al. (2020), the most significant changes in favorable climatic circumstances for improving PM2.5 air quality are lowering RH2 and deepening PBLH. The deep boundary layer can enhance the diffusion of pollutants through turbulent transport and vertical mixing, which reduces PM2.5 pollution (Liu et al., 2018; Su et al., 2018; Miao et al., 2019). Particularly in periods of heavy winter pollution, the formation of secondary particles is inhibited by a reduction in water vapor, which ultimately results in a reduction in PM2.5 (Song et al., 2018). On the other hand, high RH promotes aerosol hygroscopic growth and hastens gaseous pollutant transformation into secondary aerosol components (Cheng et al., 2015; Qiao et al., 2016).
Figure 10B displays the growth rates of yearly and monthly MDA8 O3 from 2015 through 2021. The mean growth trends of MDA8 O3 were +2.42 μg m−3yr−1, +4.87 μg m−3yr−1, +2.7 μg m−3yr−1, and +0.83 μg m−3yr−1 in Huaibei, Hefei, Wuxi, and Jinhua cities, respectively, in which the contributions from meteorology were −0.3 μg m−3yr−1 (−12%), +0.26 μg m−3yr−1 (5%), +0.34 μg m−3yr−1 (12%), and +0.43 μg m−3yr−1 (52%). The non-meteorological contributions are positive for all cities. The fact that the non-meteorological contribution in Hefei was significantly more than the meteorological contribution suggested that anthropogenic activity was directly responsible for worsening O3 pollution. The meteorology contributions to MDA8 O3 growth trends in April and October are estimated to be 65% and −4% for Huaibei, 7% and 35% for Hefei, 41% and 68% for Wuxi, and 64% and 82% for Jinhua. Further investigation was conducted to identify the most important meteorological factors to O3 changes. The daytime surface solar radiation (SSRD) played the most important role in meteorologically induced MDA8 O3 changes (−0.2 W m−2 yr−1), accounting for 46% of the change in April in Huaibei, while the SLP (0.41 hPa yr−1) accounted for 37% in October. The primary meteorological factor was total precipitation (−0.02 mm yr−1), accounting for 44% of meteorological contributions for Hefei in April, and TCC (−0.01% yr−1) 26% of meteorological contributions in October. As for Wuxi, the daytime SSRD (0.21 W m−2 yr−1) could explain 39% and 43% of the total meteorological contributions for April and October, respectively. As for Jinhua, the most significant meteorological factor was precipitation (−0.03 mm yr−1), attributing to 52% in April, and daytime SSRD (0.13 W m−2 yr−1) for 42% in October.
Supplementary Figures S7C, D show the meteorological driven MDA8 O3 changes relative to the previous year for April and October. Solar radiation and cloud cover are the major meteorological factors that impact O3 concentrations in April and October. Previous studies have shown a direct positive correlation between temperature and O3, that is, higher temperature accelerates biological emissions of precursors and chemical reaction rate and, in turn, promotes O3 production (Aw and Kleeman 2003; Gupta and Mohan 2015). Similarly, intense solar radiation accelerates chemical reactions and raises O3 levels (Chang et al., 2019). In addition to the reduced downward ultraviolet radiation on the ground, through aqueous phase chemistry and photochemistry, clouds can diminish O3 by improving oxidant elimination and lowering tropospheric oxidation capacity (Lelieveld and Crutzen 1990). Low RH2 increases O3 because certain complicated chemical reactions are inhibited at high humidity levels. Furthermore, low RH2 is always accompanied by less cloudiness to speed up the photochemical synthesis of O3 (Camalier et al., 2007). O3 can also be significantly impacted by 500 hPa winds, for example, in the case of Huaibei in October 2020 and 2021, because wind fields have the potential to significantly affect O3 and its precursors through transportation (Lu et al., 2019; Liu and Wang 2020).
4 Conclusion
This study investigated the spatio-temporal characteristics of urban PM2.5 and O3 pollution in the Yangtze River Delta, and developed stepwise multiple linear regression models to quantify meteorological and non-meteorological contributions to pollution. In light of spatial heterogeneity, the four city clusters are classified and employed to compare uni-PM2.5, uni-O3, and bi-PM2.5-O3 at a regional scale. From 2015 to 2021, PM2.5 declines, but MDA8 O3 rises gradually at different rates in the four city clusters. The uni-PM2.5 mainly occurs in winter and decreases from northwest to southeast. The uni-O3 mainly occurs in warm times from April to October and decreases from northeast to southwest. The bi-PM2.5-O3 usually appears in April and October and covers central and southern Jiangsu province. The contribution of non-meteorological factors to pollution changes is far greater than meteorological factors.
We also found that PM2.5 links closely with O3 in a synergistic manner in YRD. That is, the higher the photochemical activity levels, the larger the proportion of secondary components in PM2.5. And the increase of PM2.5 concentration in these cities can promote O3 production to some extent in April and October. Meteorological conditions have a greater effect on O3 than on PM2.5, varying with city and time. Among them, the contributions of non-meteorological changes to PM2.5 decrease were more than 90% of the total decrease in four cities. However, the impact of meteorological conditions on PM2.5 outweighed that of anthropogenic emissions in specific years. Therefore, the inter-annual variability in meteorology must be considered in designing future control strategies to improve air quality. SLP and RH play prominent roles in the PM2.5 increment in April when meteorological impacts outweigh non-meteorological effects, whereas PBLH is prominent in October. Solar radiation and cloud cover are the major meteorological factors that impact O3 concentrations in April and October. Key meteorological factors vary by location and time, and should be taken into account in future more refined pollution control.
It is evident from the findings above that the effects of on- and non-meteorological factors on particle and O3 pollution vary from time to place. Determining the roles of natural and anthropogenic factors will help us to formulate future prevention and control policies to air pollution better aiming at one city or one region. It should be noted that the real contributions of natural and anthropogenic changes cannot be ideally differentiated due to the complexity of atmospheric processes. Therefore, it is necessary to accurately evaluate the contribution of meteorology and corresponding atmospheric processes to air pollution in the future.
Data availability statement
The original contributions presented in the study are included in the article/Supplementary Material, further inquiries can be directed to the corresponding authors.
Author contributions
QZ and YY conceived of the presented idea. QZ developed the theory and performed the computations. HG and YW verified the analytical methods. HW and WW encouraged QZ to investigate and supervised the findings of this work. BX and TC confirmed the conceptualization and proof-reading. All authors discussed the results and contributed to the final manuscript.
Funding
This research was supported by the National Natural Science Foundation of China (42175179, 42175135, and 41775129) and the Science and Technology Commission of Shanghai Municipality the Natural Science Foundation of Shanghai (22ZR1404000, 20DZ1204002).
Acknowledgments
We thank reviewers for their helpful suggestions.
Conflict of interest
The authors declare that the research was conducted in the absence of any commercial or financial relationships that could be construed as a potential conflict of interest.
Publisher’s note
All claims expressed in this article are solely those of the authors and do not necessarily represent those of their affiliated organizations, or those of the publisher, the editors and the reviewers. Any product that may be evaluated in this article, or claim that may be made by its manufacturer, is not guaranteed or endorsed by the publisher.
Supplementary material
The Supplementary Material for this article can be found online at: https://www.frontiersin.org/articles/10.3389/fenvs.2022.1104013/full#supplementary-material
References
Akaike, H. (1969). Fitting autoregressive models for prediction. Ann. Inst. Stat. Math. 21 (2), 243–247. doi:10.1007/bf02532251
Altland, H. W. (1999). Regression analysis: Statistical modeling of a response variable. Technometrics 41 (4), 367–368. doi:10.1080/00401706.1999.10485936
Aw, J., and Kleeman, M. J. (2003). Evaluating the first-order effect of intraannual temperature variability on urban air pollution. J. Geophys. Res. 108, 4365. doi:10.1029/2002jd002688
Awang, N. R., Ramli, N. A., Shith, S., Zainordin, N. S., and Manogaran, H. (2018). Transformational characteristics of ground-level ozone during high particulate events in urban area of Malaysia. Air Qual. Atmos. Health 11 (6), 715–727. doi:10.1007/s11869-018-0578-0
Cai, Y., Wang, T., Xie, M., and Han, Y. (2013). Impacts of atmospheric particles on surface ozone in nanjing. Clim. Environ. Res. 18 (2), 251–260. doi:10.3878/j.issn.1006-9585.2012.11111
Camalier, L., Cox, W., and Dolwick, P. (2007). The effects of meteorology on ozone in urban areas and their use in assessing ozone trends. Atmos. Environ. X. 41 (33), 7127–7137. doi:10.1016/j.atmosenv.2007.04.061
Canella, R., Borriello, R., Cavicchio, C., Cervellati, F., Martini, M., Muresan, X., et al. (2016). Tropospheric ozone effects on chlorine current in lung epithelial cells: An electrophysiological approach. Free Radic. Biol. Med. 96, S58–S59. doi:10.1016/j.freeradbiomed.2016.04.126
Chan, C. K., and Yao, X. (2008). Air pollution in mega cities in China. Atmos. Environ. X. 42, 1–42. doi:10.1016/j.atmosenv.2007.09.003
Chang, L., Xu, J., Tie, X., and Gao, W. (2019). The impact of climate change on the western pacific subtropical high and the related ozone pollution in Shanghai, China. Sci. Rep. 9, 16998. doi:10.1038/s41598-019-53103-7
Chang, S. C., and Lee, C. T. (2007). Secondary aerosol formation through photochemical reactions estimated by using air quality monitoring datain taipei city from 1994 to 2003. Atmos. Environ. X. 41, 4002–4017. doi:10.1016/j.atmosenv.2007.01.040
Che, H. Z., Gui, K., Xia, X. G., Wang, Y. Q., Holben, B. N., Goloub, P., et al. (2019). Large contribution of meteorological factors to inter-decadal changes in regional aerosol optical depth. Atmos. Chem. Phys. 19 (16), 10497–10523. doi:10.5194/acp-19-10497-2019
Chen, H., Zhuang, B. L., Liu, J., Wang, T. J., Li, S., Xie, M., et al. (2019). Characteristics of ozone and particles in the near-surface atmosphere in the urban area of the Yangtze River Delta, China. Atmos. Chem. Phys. 19 (7), 4153–4175. doi:10.5194/acp-19-4153-2019
Chen, L., Zhu, J., Liao, H., Yang, Y., and Yue, X. (2020). Meteorological influences on PM2.5 and O3 trends and associated Health burden since China's clean air actions. Sci. Total Environ. 744, 140837. doi:10.1016/j.scitotenv.2020.140837
Chen, Z., Wang, J. N., Ma, G. X., and Zhang, Y. S. (2013). China tackles the Health effects of air pollution. Lancet 382 (9909), 1959–1960. doi:10.1016/S0140-6736(13)62064-4
Cheng, Y., He, K. B., Du, Z. Y., Zheng, M., Duan, F. K., and Ma, Y. L. (2015). Humidity plays an important role in the PM2.5 pollution in beijing. Environ. Pollut. 197, 68–75. doi:10.1016/j.envpol.2014.11.028
Cheung, V. T. F., and Wang, T. (2001). Observational study of ozone pollution at a rural site in the Yangtze Delta of China. Atmos. Environ. X. 35, 4947–4958. doi:10.1016/s1352-2310(01)00351-x
Chi, Q. Y. (2018). The study on spatial-temporal variations and formation mechanisms of ozone and secondary inorganic aerosols in North China plain. China: University of Science and Technology of China.
Chinese State Council, (2013a). Action plan on air pollution prevention and control. Available at http://www.gov.cn/zwgk/2013-09/12/content_2486773.htm (Accessed November 18, 2022).
Chinese State Council, (2013b). Release of PM2.5 monitoring information in China. Available at http://www.gov.cn/jrzg/2013-01/01/content_2303447.htm (Accessed November 18, 2022).
Chinese State Council, (2018). Three-year action plan on defending the blue Sky. Available at http://www.gov.cn/zhengce/content/2018-07/03/content_5303158.htm (Accessed November 18, 2022).
Clapp, L. J., and Jenkin, M. E. (2001). Analysis of the relationship between ambient levels of O3, NO2 and NO as a function of NO Chi in the UK. Atmos. Environ. X. 35 (36), 6391–6405. doi:10.1016/S1352-2310(01)00378-8
Cohen, A. J., Brauer, M., Burnett, R., Anderson, H. R., Frostad, J., Estep, K., et al. (2017). Estimates and 25-year trends of the global burden of disease attributable to ambient air pollution: An analysis of data from the global burden of diseases study 2015. Lancet 389, 1907–1918. doi:10.1016/S0140-6736(17)30505-6
Cui, H. X., Wu, Y. M., Duan, Y. S., Fu, Q. Y., Zhang, Y. H., Wang, D. F., et al. (2013). Secondary aerosol formation through photochemical reactions estimated by using air quality monitoring data in the downtown of pudong, Shanghai. Chin. J. Envir. Sci. 34, 2003–2009. doi:10.13227/j.hjkx.2013.05.041
Dai, H., Zhu, J., Liao, H., Li, J., Liang, M., Yang, Y., et al. (2021). Co-occurrence of ozone and PM2.5 pollution in the Yangtze River Delta over 2013–2019: Spatiotemporal distribution and meteorological conditions. Atmos. Res. 249, 105363. doi:10.1016/j.atmosres.2020.105363
Dao, X., Ji, D. S., Zhang, X., Tang, G. G., Liu, Y., Wang, L. L., et al. (2021). Characteristics of chemical composition of PM2.5 in beijing-tianjin-hebei and its surrounding areas during the heating period. Res. Environ. Sci. 34 (1), 1–10. doi:10.13198/j.issn.1001-6929.2020.12.04
Deng, X. J., Zhou, X. J., Wu, D., Tie, X. X., Tan, H. B., Li, F., et al. (2011). Effect of atmospheric aerosol on surface ozone variation over the pearl River Delta region. Sci. China Earth Sci. 54 (5), 744–752. doi:10.1007/s11430-011-4172-7
Dickerson, R. R., Kondragunta, S., Stenchikov, G., Civerolo, K. L., Doddridge, B. G., and Holben, B. N. (1997). The impact of aerosols on solar ultraviolet radiation and photochemical smog. Science 278, 827–830. doi:10.1126/science.278.5339.827
Ding, A. J., Fu, C. B., Yang, X. Q., Sun, J. N., Zheng, L. F., Xie, Y. N., et al. (2013). Ozone and fine particle in the western Yangtze River Delta: An overview of 1-yr data at the SORPES station. Atmos. Chem. Phys. 13 (11), 5813–5830. doi:10.5194/acp-13-5813-2013
Ding, D., Xing, J., Wang, S., Liu, K., and Hao, J. (2019). Estimated contributions of emissions controls, meteorological factors, population growth, and changes in baseline mortality to reductions in ambient PM2.5 and pm2.5-related mortality in China, 2013-2017. Environ. Health Perspect. 127 (6), 067009. doi:10.1289/EHP4157
Fu, Y., Liao, H., and Yang, Y. (2019). Interannual and decadal changes in tropospheric ozone in China and the associated chemistry-climate interactions: A review. Adv. Atmos. Sci. 36 (9), 975–993. doi:10.1007/s00376-019-8216-9
Gao, J., Zhu, B., Xiao, H., Kang, H., Hou, X., and Shao, P. (2016). A case study of surface ozone source apportionment during a high concentration episode, under frequent shifting wind conditions over the Yangtze River Delta, China. Sci. Total Environ. 544, 853–863. doi:10.1016/j.scitotenv.2015.12.039
Gu, C., Zhang, X., and Wang, X. (2011). Climate change urbanization and the Yangtze River Delta. Resour. Envir. Yangtze Basin 20 (1), 1–8.
Gu, J., Chen, Z., Zhang, N., Peng, S., Cui, W., Huo, G., et al. (2022). Characterization of atmospheric fine particles and secondary aerosol estimated under the different photochemical activities in summertime tianjin, China. Int. J. Environ. Res. Public Health 19 (13), 7956. doi:10.3390/ijerph19137956
Gupta, M., and Mohan, M. (2015). Validation of WRF/chem model and sensitivity of chemical mechanisms to ozone simulation over megacity Delhi. Atmos. Environ. X. 122, 220–229. doi:10.1016/j.atmosenv.2015.09.039
Han, J., Meng, X., Zhou, X., Yi, B., Liu, M., and Xiang, W. N. (2017). A long-term analysis of urbanization process, landscape change, and carbon sources and sinks: A case study in China's Yangtze River Delta region. J. Clean. Prod. 141, 1040–1050. doi:10.1016/j.jclepro.2016.09.177
He, Z., Kim, Y. J., Ogunjobi, K. O., and Hong, C. S. (2003). Characteristics of PM2.5 species and long-range transport of air masses at taean background station, South Korea. Atmos. Environ. X. 37 (2), 219–230. doi:10.1016/S1352-2310(02)00834-8
Herndon, S. C., Onasch, T. B., Wood, E. C., Kroll, J. H., Canagaratna, M. R., Jayne, J. T., et al. (2008). Correlation of secondary organic aerosol with odd oxygen in Mexico city. Geophys. Res. Lett. 35, L15804. doi:10.1029/2008GL034058
Hong, C. P., Zhang, Q., Zhang, Y., Davis, S. J., Tong, D., Zheng, Y. X., et al. (2019). Impacts of climate change on future air quality and human Health in China. Proc. Natl. Acad. Sci. U. S. A. 116 (35), 17193–17200. doi:10.1073/pnas.1812881116
Hu, J., Wang, Y., Ying, Q., and Zhang, H. (2014). Spatial and temporal variability of PM2.5 and PM10 over the north China plain and the Yangtze River Delta, China. Atmos. Environ. X. 95, 598–609. doi:10.1016/j.atmosenv.2014.07.019
Jia, M. W., Zhao, T. L., Cheng, X. H., Gong, S. L., Zhang, X. Z., Tang, L. L., et al. (2017). Inverse relations of PM2.5 and O3 in air compound pollution between cold and hot seasons over an urban area of east China. Atmosphere 8 (3), 59. doi:10.3390/atmos8030059
Jiang, F., Zhou, P., Liu, Q., Wang, T., Zhuang, B., and Wang, X. (2012). Modeling tropospheric ozone formation over east China in springtime. J. Atmos. Chem. 69 (4), 303–319. doi:10.1007/s10874-012-9244-3
Khuzestani, R. B., Schauer, J. J., Wei, Y., Cai, L., Zhang, T., Zhang, Y., et al. (2017). Quantification of the sources of long-range transport of PM2.5 pollution in the ordos region, inner Mongolia, China. Environ. Pollut. 229, 1019–1031. doi:10.1016/j.envpol.2017.07.093
Kutner, M. H., Nachtsheim, C., and Neter, J. (2004). Applied linear regression models. Beijing: Higher education press.
Lang, J. L., Zhang, Y. Y., Zhou, Y., Cheng, S. Y., Chen, D. S., Guo, X. R., et al. (2017). Trends of PM2.5 and chemical composition in beijing, 2000-2015. Aerosol Air Qual. Res. 17, 412–425. doi:10.4209/aaqr.2016.07.0307
Lelieveld, J., and Crutzen, P. J. (1990). Influences of cloud photochemical processes on tropospheric ozone. Nature 343 (4255), 227–233. doi:10.1038/343227a0
Lepeule, J., Laden, F., Dockery, D., and Schwartz, J. (2012). Chronic exposure to fine particles and mortality: An extended follow-up of the harvard six cities study from 1974 to 2009. Environ. Health Perspect. 120, 965–970. doi:10.1289/ehp.1104660
Leung, D. M., Tai, A. P. K., Mickley, L. J., Moch, J. M., Donkelaar, A. V., Shen, L., et al. (2018). Synoptic meteorological modes of variability for fine particulate matter (PM2.5) air quality in major metropolitan regions of China. Atmos. Chem. Phys. 18 (9), 6733–6748. doi:10.5194/acp-18-6733-2018
Levy, H. (1971). Normal atmosphere-large radical and formaldehyde concentrations predicted. Science 173, 141–143. doi:10.1126/science.173.3992.141
Li, H. L., Wang, Y. J., Huang, L., Liu, Z. Y., Wang, W., Feng, J. L., et al. (2020). Analysis of synergistic growth effects between ozone and secondary aerosol in typical cities in China. Acta Sci. Circumst. 40, 4368–4379. doi:10.13671/j.hjkxxb.2020.0217
Li, J., Wang, Z., Wang, X., Yamaji, K., Takigawa, M., Kanaya, Y., et al. (2011). Impacts of aerosols on summertime tropospheric photolysis frequencies and photochemistry over central eastern China. Atmos. Environ. X. 45 (10), 1817–1829. doi:10.1016/j.atmosenv.2011.01.016
Li, K., Jacob, D. J., Liao, H., Shen, L., Zhang, Q., and Bates, K. H. (2019). Anthropogenic drivers of 2013-2017 trends in summer surface ozone in China. Proc. Natl. Acad. Sci. U. S. A. 116, 422–427. doi:10.1073/pnas.1812168116
Li, K., Jacob, D. J., Lu, L., Shen, X., Smedt, I. D., and Liao, H. (2020). Increases in surface ozone pollution in China from 2013 to 2019: Anthropogenic and meteorological influences. Atmos. Chem. Phys. 20, 11423–11433. doi:10.5194/acp-20-11423-2020
Li, L., An, J. Y., Shi, Y. Y., Zhou, M., Yan, R. S., Huang, C., et al. (2016). Source apportionment of surface ozone in the Yangtze River Delta, China in the summer of 2013. Atmos. Environ. X. 144, 194–207. doi:10.1016/j.atmosenv.2016.08.076
Li, M. W., Zhang, D., Li, C. T., Mulvaney, K. M., Selin, N. E., and Karplus, V. J. (2018). Air quality Co-benefits of carbon pricing in China. Nat. Clim. Chang. 8, 398–403. doi:10.1038/s41558-018-0139-4
Li, R., Cui, L. L., Li, J. L., Zhao, A., Fu, H. B., Wu, Y., et al. (2017). Spatial and temporal variation of particulate matter and gaseous pollutants in China during 2014–2016. Atmos. Environ. X. 161, 235–246. doi:10.1016/j.atmosenv.2017.05.008
Liao, J. B., Wang, T. J., Jiang, Q. Z., Zhuang, B. L., Xie, M., Yin, C. Q., et al. (2015). WRF/Chem modeling of the impacts of urban expansion on regional climate and air pollutants in Yangtze River Delta, China. Atmos. Environ. X. 106, 204–214. doi:10.1016/j.atmosenv.2015.01.059
Liu, C., Yu, Y., Xie, J., and Zhou, X. (2015). Applicability of soil temperature and moisture in several datasets over qinghai-xizang plateau. Plateau Meteorol. 34 (3), 653–665. doi:10.7522/j.issn.1000-0534.2015.00034
Liu, Q., Jia, X. C., Quan, J. N., Li, J. Y., Li, X., Wu, Y. X., et al. (2018). New positive feedback mechanism between boundary layer meteorology and secondary aerosol formation during severe haze events. Sci. Rep. 8, 6095. doi:10.1038/s41598-018-24366-3
Liu, Y., and Wang, T. (2020). Worsening urban ozone pollution in China from 2013 to 2017-Part 1: The complex and varying roles of meteorology. Atmos. Chem. Phys. 20, 6305–6321. doi:10.5194/acp-20-6305-2020
Lu, X., Zhang, L., Chen, Y. F., Zhou, M., Li, K., Liu, Y. M., et al. (2019). Exploring 2016-2017 surface ozone pollution over China: Source contributions and meteorological influences. Atmos. Chem. Phys. 19, 8339–8361. doi:10.5194/acp-19-8339-2019
Mao, X., Wang, L., Pan, X., Zhang, M., Wu, X., and Zhang, W. (2022). A study on the dynamic spatial spillover effect of urban form on PM2.5 concentration at county scale in China. Atmos. Res. 269, 106046. doi:10.1016/j.atmosres.2022.106046
MEE (2012). Ministry of Ecology and environment, ambient air quality standards GB 3095 – 2012. Available at http://english.mee.gov.cn/Resources/standards/Air_Environment/quality_standard1/201605/t20160511_337502.shtml (Accessed November 18, 2022).
MEE (2015). Ministry of Ecology and environment, bulletin on the state of China's ecological environment. Available at https://www.mee.gov.cn/hjzl/sthjzk/ (Accessed November 18, 2022).
MEE (2021). Ministry of Ecology and environment, bulletin on the state of China's ecological environment. Available at https://www.mee.gov.cn/hjzl/sthjzk/ (Accessed November 18, 2022).
Meng, X., Guo, J. J., and Han, Y. Q. (2018). Preliminarily assessment of ERA5 reanalysis data. J. Mar. Meteor. 38 (1), 91–99. doi:10.19513/j.cnki.issn2096-3599.2018.01.011
Miao, Y., Li, J., Miao, S. G., Che, H. Z., Wang, Y. Q., Zhang, X. Y., et al. (2019). Interaction between planetary boundary layer and PM2.5 pollution in megacities in China: A review. Curr. Pollut. Rep. 5, 261–271. doi:10.1007/s40726-019-00124-5
Ming, L. L., Jin, L., Li, J., Fu, P. Q., Yang, W. Y., Liu, D., et al. (2017). PM2.5 in the Yangtze River Delta, China: Chemical compositions, seasonal variations, and regional pollution events. Environ. Pollut. 223, 200–212. doi:10.1016/j.envpol.2017.01.013
Na, K. S., Sawant, A. A., Song, C., and Cocker, D. R. (2004). Primary and secondary carbonaceous species in the atmosphere of western riverside county, California. Atmos. Environ. X. 38, 1345–1355. doi:10.1016/j.atmosenv.2003.11.023
Pathak, R. K., Wu, W. S., and Wang, T. (2009). Summertime PM2.5 ionic species in four major cities of China: Nitrate formation in an ammonia-deficient atmosphere. Atmos. Chem. Phys. 9, 1711–1722. doi:10.5194/acp-9-1711-2009
PopeIII, C. A., Muhlestein, J. B., May, H. T., Renlund, D. G., Anderson, J. L., and Horne, B. D. (2006). Ischemic heart disease events triggered by short-term exposure to fine particulate air pollution. Circulation 114, 2443–2448. doi:10.1161/circulationaha.106.636977
Poursafa, P., Kamali, Z., Fraszczyk, E., Boezen, H. M. A. V., and Snieder, H. (2022). DNA methylation: A potential mediator between air pollution and metabolic syndrome. Clin. Epigenetics 14, 82. doi:10.1186/s13148-022-01301-y
Pusede, S. E., Steiner, A. L., and Cohen, R. C. (2015). Temperature and recent trends in the chemistry of continental surface ozone. Chem. Rev. 115, 3898–3918. doi:10.1021/cr5006815
Qiao, T., Zhao, M., Xiu, G., and Yu, J. (2016). Simultaneous monitoring and compositions analysis of PM1 and PM2.5 in Shanghai: Implications for characterization of haze pollution and source apportionment. Sci. Total Environ. 557, 386–394. doi:10.1016/j.scitotenv.2016.03.095
Qin, Y., Li, J. Y., Gong, K. J., Wu, Z. J., Chen, M. D., Qin, M. M., et al. (2021). Double high pollution events in the Yangtze River Delta from 2015 to 2019: Characteristics, trends, and meteorological situations. Sci. Total Environ. 792, 148349. doi:10.1016/j.scitotenv.2021.148349
Qu, W. H., Xu, L., Qu, G. H., Yan, Z. J., and Wang, J. X. (2017). The impact of energy consumption on environment and public Health in China. Nat. Hazards (Dordr). 87, 675–697. doi:10.1007/s11069-017-2787-5
Seo, J., Park, D. S. R., Kim, J. Y., Youn, D., Lim, Y. B., and Kim, Y. (2018). Effects of meteorology and emissions on urban air quality: A quantitative statistical approach to long-term records (1999-2016) in seoul, South Korea. Atmos. Chem. Phys. 18, 16121–16137. doi:10.5194/acp-18-16121-2018
Shao, P. Y., Tian, H. Z., Sun, Y. J., Liu, H. J., Wu, B. B., Liu, S. H., et al. (2018). Characterizing remarkable changes of severe haze events and chemical compositions in multi-size airborne particles (PM1, PM2.5 and PM10) from january 2013 to 2016-2017 winter in beijing, China. Atmos. Environ. X. 189, 133–144. doi:10.1016/j.atmosenv.2018.06.038
Sheehan, P., Cheng, E., English, A., and Sun, F. (2014). China's response to the air pollution shock. Nat. Clim. Chang. 4, 306–309. doi:10.1038/nclimate2197
Shen, L., Mickley, L. J., and Murray, L. T. (2017). Influence of 2000-2050 climate change on particulate matter in the United States: Results from a new statistical model. Atmos. Chem. Phys. 17, 4355–4367. doi:10.5194/acp-17-4355-2017
Shu, L., Xie, M., Gao, D., Wang, T. J., Fang, D. X., Liu, Q., et al. (2017). Regional severe particle pollution and its association with synoptic weather patterns in the Yangtze River Delta region, China. Atmos. Chem. Phys. 17, 12871–12891. doi:10.5194/acp-17-12871-2017
Song, C. B., Wu, L., Xie, Y. C., He, J. J., Chen, C., Wang, T., et al. (2017). Air pollution in China: Status and spatiotemporal variations. Environ. Pollut. 227, 334–347. doi:10.1016/j.envpol.2017.04.075
Song, H., Sun, X., and Li, Y. (2020). Evaluation of ERA5 reanalysis soil moisture over inner Mongolia. Sci. Technol. Eng. 20 (06), 2161–2168.
Song, S., Gao, M., Xu, W. Q., Shao, J. Y., Shi, G. L., Wang, S. X., et al. (2018). Fine-particle pH for beijing winter haze as inferred from different thermodynamic equilibrium models. Atmos. Chem. Phys. 18, 7423–7438. doi:10.5194/acp-18-7423-2018
Stadtler, S., Simpson, D., Schroeder, S., Taraborrelli, D., Bott, A., and Schultz, M. (2018). Ozone impacts of gas-aerosol uptake in global chemistry transport models. Atmos. Chem. Phys. 18, 3147–3171. doi:10.5194/acp-18-3147-2018
Su, T., Li, Z., and Kahn, R. (2018). Relationships between the planetary boundary layer height and surface pollutants derived from lidar observations over China: Regional pattern and influencing factors. Atmos. Chem. Phys. 18 (21), 15921–15935. doi:10.5194/acp-18-15921-2018
Sun, L., Xue, L. K., Wang, Y. H., Li, L., Lin, J., Ni, R., et al. (2019). Impacts of meteorology and emissions on summertime surface ozone increases over central eastern China between 2003 and 2015. Atmos. Chem. Phys. 19 (3), 1455–1469. doi:10.5194/acp-19-1455-2019
Sun, W. W., Wang, D. F., Yao, L., Fu, H., Fu, Q., Wang, H., et al. (2019). Chemistry-triggered events of PM2.5 explosive growth during late autumn and winter in Shanghai, China. Environ. Pollut. 254, 112864. doi:10.1016/j.envpol.2019.07.032
Tai, A. P. K., Mickley, L. J., and Jacob, D. J. (2010). Correlations between fine particulate matter (PM2.5) and meteorological variables in the United States: Implications for the sensitivity of PM2.5 to climate change. Atmos. Environ. X. 44 (32), 3976–3984. doi:10.1016/j.atmosenv.2010.06.060
Tao, J., Zhang, L. M., Ho, K. F., Zhang, R. J., Lin, Z. J., Zhang, Z. S., et al. (2014). Impact of PM2.5 chemical compositions on aerosol light scattering in guangzhou-the largest megacity in south China. Atmos. Res. 135, 48–58. doi:10.1016/j.atmosres.2013.08.015
Tie, X., Geng, F., Guenther, A., Cao, j., Greenberg, J., Zhang, R., et al. (2013). Megacity impacts on regional ozone formation: Observations and WRF-chem modeling for the MIRAGE-shanghai field campaign. Atmos. Chem. Phys. 13, 5655–5669. doi:10.5194/acp-13-5655-2013
Tie, X., Geng, F., Peng, L., Gao, W., Zhao, C., and Zhao, C. (2009). Measurement and modeling of O3 variability in Shanghai, China: Application of the WRF-chem model. Atmos. Environ. X. 43 (28), 4289–4302. doi:10.1016/j.atmosenv.2009.06.008
Tie, X., Long, X., Li, G., Zhao, S., Cao, J., and Xu, J. (2019). Ozone enhancement due to the photodissociation of nitrous acid in eastern China. Atmos. Chem. Phys. 19, 11267–11278. doi:10.5194/acp-19-11267-2019
Tu, J., Xia, Z. G., Wang, H., and Li, W. (2007). Temporal variations in surface ozone and its precursors and meteorological effects at an urban site in China. Atmos. Res. 85, 310–337. doi:10.1016/j.atmosres.2007.02.003
Turpin, B. J., and Huntzicker, J. J. (1995). Identification of secondary organic aerosol episodes and quantitation of primary and secondary organic aerosol concentrations during SCAQS. Atmos. Environ. X. 29, 3527–3544. doi:10.1016/1352-2310(94)00276-Q
Wang, D. F., Zhou, B., Fu, Q. Y., Zhao, Q. B., Zhang, Q., Chen, J. M., et al. (2016). Intense secondary aerosol formation due to strong atmospheric photochemical reactions in summer: Observations at a rural site in eastern Yangtze River Delta of China. Sci. Total Environ. 571, 1454–1466. doi:10.1016/j.scitotenv.2016.06.212
Wang, L., Liu, Z., Sun, Y., Ji, D., Wang, Y., and Wang, Y. (2015). Long-range transport and regional sources of PM2.5 in beijing based on long-term observations from 2005 to 2010. Atmos. Res. 157, 37–48. doi:10.1016/j.atmosres.2014.12.003
Wang, T., Xue, L., Brimblecombe, P., Lam, Y. F., Li, L., and Zhang, L. (2017). Ozone pollution in China: A review of concentrations, meteorological influences, chemical precursors, and effects. Sci. Total Environ. 575, 1582–1596. doi:10.1016/j.scitotenv.2016.10.081
Wang, X. L. (2022). Historical air quality data in China. Available at https://quotsoft.net/air (Accessed November 18, 2022).
Wang, X., and Zhang, R. (2020). How did air pollution change during the COVID-19 outbreak in China? Bull. Am. Meteorol. Soc. 101 (10), E1645–E1652. doi:10.1175/BAMS-D-20-0102.1
Wang, Y. J., Liu, Z. Y., Huang, L., Lu, G. B., Gong, Y. G., Yaluk, E., et al. (2020). Development and evaluation of a scheme system of joint prevention and control of PM2.5 pollution in the Yangtze River Delta region, China. J. Clean. Prod. 275, 122756. doi:10.1016/j.jclepro.2020.122756
Wang, Z., Lv, J., Tan, Y., Guo, M., Gu, Y., Xu, S., et al. (2019). Temporospatial variations and spearman correlation analysis of ozone concentrations to nitrogen dioxide, sulfur dioxide, particulate matters and carbon monoxide in ambient air, China. Atmos. Pollut. Res. 10 (4), 1203–1210. doi:10.1016/j.apr.2019.02.003
Wang, Z. S., Li, Y. T., Chen, T., Zhang, D. W., Sun, F., Wei, Q., et al. (2015). Ground-level ozone in urban beijing over a 1-year period: Temporal variations and relationship to atmospheric oxidation. Atmos. Res. 164, 110–117. doi:10.1016/j.atmosres.2015.05.005
WHO (2006). Air quality guidelines for particulate matter, ozone, nitrogen dioxide and sulfur dioxide. Available at https://apps.who.int/iris/handle/10665/69477 (Accessed November 18, 2022).
Xu, H., Jia, Y., Sun, Z., Su, J., Liu, Q. S., Zhou, Q., et al. (2022). Environmental pollution, a hidden culprit for Health issues. Eco-Environment Health 1 (1), 31–45. doi:10.1016/j.eehl.2022.04.003
Xu, J., Tie, X., Gao, W., Lin, Y., Fu, Q., and Fu, Q. (2019). Measurement and model analyses of the ozone variation during 2006 to 2015 and its response to emission change in megacity Shanghai, China. Atmos. Chem. Phys. 19, 9017–9035. doi:10.5194/acp-19-9017-2019
Xu, W. Y., Zhao, C. S., Ran, L., Deng, Z. Z., Liu, P. F., Ma, N., et al. (2011). Characteristics of pollutants and their correlation to meteorological conditions at a suburban site in the north China plain. Atmos. Chem. Phys. 11, 4353–4369. doi:10.5194/acp-11-4353-2011
Xue, T., Liu, J., Zhang, Q., Geng, G. N., Zheng, Y. X., Tong, D., et al. (2019). Rapid improvement of PM2.5 pollution and associated Health benefits in China during 2013–2017. Sci. China Earth Sci. 62, 1847–1856. doi:10.1007/s11430-018-9348-2
Yang, G., Liu, Y., and Li, X. (2020). Spatiotemporal distribution of ground-level ozone in China at a city level. Sci. Rep. 10 (1), 7229. doi:10.1038/s41598-020-64111-3
Yang, K. J., Kong, L. D., Tong, S. Y., Shen, J. D., Chen, L., Jin, S. Y., et al. (2021). Double high-level ozone and PM2.5 Co-pollution episodes in Shanghai, China: Pollution characteristics and significant role of daytime HONO. Atmosphere 12, 557. doi:10.3390/atmos12050557
Yang, L. F., Luo, H. H., Yuan, Z. B., Zheng, J. Y., Huang, Z. J., Li, C., et al. (2019). Quantitative impacts of meteorology and precursor emission changes on the long-term trend of ambient ozone over the pearl River Delta, China, and implications for ozone control strategy. Atmos. Chem. Phys. 19, 12901–12916. doi:10.5194/acp-19-12901-2019
Yang, Y., Liao, H., and Lou, S. (2016). Increase in winter haze over eastern China in recent decades: Roles of variations in meteorological parameters and anthropogenic emissions. J. Geophys. Res. Atmos. 121 (21), 13050–13065. doi:10.1002/2016JD025136
Yao, Q., Yang, X., Tang, Y. X., Fan, W. Y., Cai, Z. Y., and Han, S. Q. (2022). Spatio-temporal distribution characteristics of secondary aerosol in beijing-tianjin-hebei urban agglomeration in winter. Environ. Sci. 1-14. doi:10.13227/j.hjkx.202205221
Yu, X., Zhang, Y., Liu, N., and Yang, S. (2022). Characteristics of secondary PM2.5 under different photochemical reactivity backgrounds in the pearl River Delta region. Front. Environ. Sci. 10. doi:10.3389/fenvs.2022.837158
Yue, D., Zhong, L. J., Zhang, T., Shen, J., Zhou, Y., Zeng, L. M., et al. (2015). Pollution properties of water-soluble secondary inorganic ions in atmospheric PM2.5 in the pearl River Delta region. Aerosol Air Qual. Res. 15, 1737–1747. doi:10.4209/aaqr.2014.12.0333
Zeng, Y., Cao, Y., Qiao, X., Seyler, B. C., Tang, Y., and Tang, Y. (2019). Air pollution reduction in China: Recent success but great challenge for the future. Sci. Total Environ. 663, 329–337. doi:10.1016/j.scitotenv.2019.01.262
Zhai, S., Jacob, D. J., Wang, X., Shen, L., Li, K., Zhang, Y. Z., et al. (2019). Fine particulate matter (PM2.5) trends in China, 2013–2018: Separating contributions from anthropogenic emissions and meteorology. Atmos. Chem. Phys. 19, 11031–11041. doi:10.5194/acp-19-11031-2019
Zhang, G., Xu, H. H., Qi, B., Du, R. G., Gui, K., Wang, H. L., et al. (2018). Characterization of atmospheric trace gases and particulate matter in Hangzhou, China. Atmos. Chem. Phys. 18, 1705–1728. doi:10.5194/acp-18-1705-2018
Zhang, H. L., Wang, Y. G., Hu, J. L., Ying, Q., and Hu, X. M. (2015). Relationships between meteorological parameters and criteria air pollutants in three megacities in China. Environ. Res. 140, 242–254. doi:10.1016/j.envres.2015.04.004
Zhang, Q. Y., Yan, R. C., Fan, J. W., Yu, S. C., Yang, W. D., Li, P. F., et al. (2015). A heavy haze episode in Shanghai in december of 2013: Characteristics, origins and implications. Aerosol Air Qual. Res. 15, 1881–1893. doi:10.4209/aaqr.2015.03.0179
Zhang, Q., Zheng, Y. X., Tong, D., Shao, M., Wang, S. X., Zhang, Y. H., et al. (2019). Drivers of improved PM2.5 air quality in China from 2013 to 2017. Proc. Natl. Acad. Sci. U. S. A. 116 (49), 24463–24469. doi:10.1073/pnas.1907956116
Zhang, T., Zang, L., Wan, Y., Wang, W., and Zhang, Y. (2019). Ground-level PM2.5 estimation over urban agglomerations in China with high spatiotemporal resolution based on himawari-8. Sci. Total Environ. 676, 535–544. doi:10.1016/j.scitotenv.2019.04.299
Zhang, W., Capps, S. L., Hu, Y., Nenes, A., Napelenok, S. L., and Russell, A. G. (2012). Development of the high-order decoupled direct method in three dimensions for particulate matter: Enabling advanced sensitivity analysis in air quality models. Geosci. Model. Dev. 5, 355–368. doi:10.5194/gmd-5-355-2012
Zhang, X., Xu, X., Ding, Y., Liu, Y., Zhang, H., Wang, Y., et al. (2019). The impact of meteorological changes from 2013 to 2017 on PM2.5 mass reduction in Key regions in China. Sci. China Earth Sci. 62, 1885–1902. doi:10.1007/s11430-019-9343-3
Zhang, Y. L., and Cao, F. (2015). Fine particulate matter (PM2.5) in China at a city level. Sci. Rep. 5, 14884. doi:10.1038/srep14884
Zhao, M., Huang, Z., Qiao, T., Zhang, Y., Xiu, G., and Yu, J. (2015). Chemical characterization, the transport pathways and potential sources of PM2.5 in Shanghai: Seasonal variations. Atmos. Res. 158, 66–78. doi:10.1016/j.atmosres.2015.02.003
Zhao, S., Yin, D., Yu, Y., Kang, S., Qin, D., Dong, L., et al. (2020). PM2.5 and O3 pollution during 2015-2019 over 367 Chinese cities: Spatiotemporal variations, meteorological and topographical impacts. Environ. Pollut. 264, 114694. doi:10.1016/j.envpol.2020.114694
Zhao, H., Zheng, Y. F., and Li, C. (2018). Spatiotemporal distribution of PM2.5 and O3 and their interaction during the summer and winter seasons in beijing, China. Sustainability 10 (12), 4519. doi:10.3390/su10124519
Zhao, Z., and Wang, Y. (2017). Influence of the west pacific subtropical high on surface ozone daily variability in summertime over eastern China. Atmos. Environ. X. 170, 197–204. doi:10.1016/j.atmosenv.2017.09.024
Zheng, B., Tong, D., Li, M., Liu, F., Hong, C. P., Geng, G. N., et al. (2018). Trends in China's anthropogenic emissions since 2010 as the consequence of clean air actions. Atmos. Chem. Phys. 18 (19), 14095–14111. doi:10.5194/acp-18-14095-2018
Zheng, Y., Xue, T., Zhang, Q., Geng, G., Tong, D., Li, X., et al. (2017). Air quality improvements and Health benefits from China’s clean air action since 2013. Environ. Res. Lett. 12 (11), 114020. doi:10.1088/1748-9326/aa8a32
Zhu, J., and Yuan, H. (2019). Applicability of ERA reanalysis land surface temperature data in Zhejiang province. Meteorol. Sci. Technol. 47 (02), 289–298. doi:10.19517/j.1671-6345.20180171
Keywords: PM2.5, ozone, pollution, meteorology, Yangtze River Delta
Citation: Zhu Q, Yu Y, Gong H, Wang Y, Wang H, Wang W, Xu B and Cheng T (2023) Spatio-temporal characteristics of PM2.5 and O3 synergic pollutions and influence factors in the Yangtze River Delta. Front. Environ. Sci. 10:1104013. doi: 10.3389/fenvs.2022.1104013
Received: 21 November 2022; Accepted: 30 November 2022;
Published: 20 January 2023.
Edited by:
Ying Li, Institute of Atmospheric Physics (CAS), ChinaReviewed by:
Xingna Yu, Nanjing University of Information Science and Technology, ChinaYunfei Wu, Institute of Atmospheric Physics (CAS), China
Copyright © 2023 Zhu, Yu, Gong, Wang, Wang, Wang, Xu and Cheng. This is an open-access article distributed under the terms of the Creative Commons Attribution License (CC BY). The use, distribution or reproduction in other forums is permitted, provided the original author(s) and the copyright owner(s) are credited and that the original publication in this journal is cited, in accordance with accepted academic practice. No use, distribution or reproduction is permitted which does not comply with these terms.
*Correspondence: Bo Xu, eGJ5ZjIwMDBAMTYzLmNvbQ==; Tiantao Cheng, dHRjaGVuZ0BmdWRhbi5lZHUuY24=