 Xin Sun1
 Xin Zhao
- 1School of Statistics and Applied Mathematics, Anhui University of Finance and Economics, Bengbu, China
- 2School of Public Economics, Shanghai Customs College, Shanghai, China
- 3School of Urban and Regional Science, Shanghai University of Finance and Economics, Shanghai, China
The digital economy is considered a driving force of green economic development. However, only a few studies have examined the relationship between the digital economy and green total factor productivity (GTFP). According to the principal component method and super-efficient Slacks-based measure model, the digital economy level and green total factor productivity GTFP were measured for China’s provinces based on panel data from 2013 to 2019. The spatial econometric model was then used to analyze the effects of the digital economy level on green total factor productivity GTFP. Results showed that the overall level of green total factor productivity GTFP maintained a steady growth trend, with an average yearly growth of 4.19%. Significant regional differences reflecting the development characteristics of eastern, central, and western regions were also observed. Most provinces showed either high or low values of both green total factor productivity GTFP and digital economic development thereby revealing spatial heterogeneity for the different provinces and cities. The spatial Durbin model showed that the digital economy had a significant direct effect (0.1498) and spatial spillover effect (0.3438) on green total factor productivity GTFP, the latter being greater than the former, with this conclusion supported by the robustness test. Technological innovation positively regulates the contribution of the region’s digital economy to green total factor productivity GTFP and negatively regulates the spatial spillover of the digital economy to green total factor productivity GTFP in neighboring regions.
1 Introduction
With the increasingly strict constraints on the ecological environment, economic development needs to proceed in a green and high-quality direction to reduce both resource and environmental loss. The green total factor productivity (GTFP) is the core indicator to measure the high-quality development of the economy by considering the “undesired output” problem of production activities. Taking economic growth and environmental protection into account, and under resource loss and environmental protection constraints, improving green total factor productivity GTFP to encourage the rational and efficient allocation of resources is necessary to realize green development. In this context, the digital economy provides a feasible path for dealing with environmental conservation issues. The extensive integration of the real economy and the digital economy has contributed significantly to the new development pattern of “dual circulation,” which will help Chinese enterprises transform and upgrade to sustainable production methods, such as low-carbon, symbiotic, and green methods. Thus, the environmental benefits of the digital economy should also be considered. In its 19th National Congress, the Communist Part of China also vehemently advocated for advancing the digital economy and considered it a predominant approach to developing a green economy. Hence, it makes sense to study how the digital economy affects GTFP and discuss how the China’s GTFP is progressing.
The GTFP integrates both economic benefits and the protection of ecological resources. Compared with total factor productivity (TFP), which accounts only for the input restraints of labor and capital, GTFP also considers the restraints of the environment and resources. In the measurement of GTFP, Pittman (1983) firstly incorporated environmental pollution into the economic model, and applied the data envelopment analysis approach to investigate undesired output. Later, researchers introduced the directional distance function and the Malmquist–Luenberger index, which expanded the method for the simultaneous estimation of multiple outputs and inputs to better fit the constraints of the environment and resources on the production process (Chung et al., 1997; Oh, 2010). Aparicio et al. (2017) used Malmquist–Luenberger index to evaluate GTFP from 1995 to 2007 and reported that technological progress was increasing, while technological efficiency declined rapidly, indicating the GTFP’s stagnation. Chen and Golley (2014) calculated the changing pattern of GTFP, and considered carbon dioxide emissions as the undesired output. Research has also focused on how various input factors affect GTFP, including economic factors (Zhou Y. Y. et al., 2019), trade cooperation (Zhao P. J. et al., 2020; Xie and Zhang, 2021), government regulations (Li and Wu, 2017), and technological innovation (Wang M. L. et al., 2021), among others. For instance, Li and Liao (2020) analyzed data of 40 countries obtained from 1991 to 2014, betwixt financial advancement and GTFP, a reverse U-shaped relationship exists. Cao and Wang (2017) reported that foreign trade could promote an increase in GTFP through developing (R&D) investment and improving labor levels. Zhou Y. et al. (2019) proposed that China’s foreign direct investment enhances the green economy in provinces. Wu et al. (2020) stated the mutual effect of government and environmental decentralization generates a “race to the bottom” effect, meanwhile, the environmental dispersion on the effectiveness of regional green growth has been gradually decreasing.
Few studies have directly and systematically evaluated the overall impact of the digital economy on GTFP, with the majority of them focused on the internet and information technology. Researchers have highlighted that information technology can improve labor productivity (Vu, 2013) and promote economic growth (Madden and Savage, 2000), to which GTFP is positively correlated. Niebel (2018) identified that ICT capital exerts a positive effect on gross domestic product (GDP) growth using various panel data regressions. Nguyen et al. (2020) proposed that ICT and financial development are effective stimuli of positive drivers of economic growth. Some researchers started by reducing environmental pollution and expenditure of energy (Gong et al., 2020). Moreover, according to Wu et al. (2021), the internet indirectly affects regional GTFEE by promoting regional innovation capabilities and by decreasing the degree of resource misallocation. Vidas-Bubanja (2014) stated the potential of the digital economy to enhance sustainability by making production and life more energy efficient. Meanwhile, the feasibility of sustainable development can be enhanced by the integration of the green and digital economies, while technological innovation can provide powerful solutions to climate change and environmental challenges. However, the ICT industry is not entirely ecologically friendly (Zhou X. et al., 2019). For example, the communications industry is energy-intensive, and the manufacturing, use, and disposal of related goods also requires a significant amount of energy (Salahuddin and Alam, 2015). Therefore, some researchers have proposed that ICT has a non-linear relationship with GTFP. Li et al. (2020) proposed that internet growth exerted a non-linear impact on China’s GTFP, and when human capital levels consistently exceeded a threshold, the influence shifted from weakly negative to positive.
In summary, although the existing literature on both digital economy- and GTFP-related content is extensive, only a few studies discussed how the former affects GTFP by being a new impetus for economic development (Han et al., 2022; Wang J. et al., 2022; Yang et al., 2022). However, Han et al. (2022) concentrated on how digital economy affects carbon reduction, and overlooked economic growth. Whereas, Yang et al. (2022) and Wang J. et al. (2022) did not consider geographical elements in support of panel regressions and non-spatial panels. Meanwhile, most prior studies considered the mechanisms of industrial transformation, human capital, and environmental regulation (Gu et al., 2022; Liu et al., 2022; Lyu et al., 2022). Technological innovation is the primary driver of economic growth and the digital economy. Nevertheless, its moderating impact on environmental effects of the digital economy has been neglected in previous studies (Luo et al., 2022). Moreover, the digital economy involves multiple fields and spans multiple industry sectors, hence there is no unified quantitative indicator that can be employed to assess it. Based on this, the present study explored how the digital economy affects GTFP from both theoretical and empirical perspectives. First, a theoretical framework was constructed for the digital economy and GTFP, and suggested corresponding theoretical assumptions and established an index system. The digital economy was evaluated using the principal component method. Quantitative processing was then conducted to provide a basis for discussion of: 1) the mechanism by which the digital economy affects GTFP; 2) the regulatory roles of technological innovation; 3) the effective path for the digital economy to promote GTFP.
This study provides the following marginal contributions: Firstly, the digital economy was evaluated from four dimensions: digital innovation, digital industrialization, digital infrastructure and industrial digitization; to provide a reference for digital economy-related measurements. Secondly, the model incorporated spatial elements to discuss the spatial effect of the digital economy on GTFP. Finally, a consideration of how technological innovation impacts the influencing mechanism of the digital economy on GTFP is made. The rest of this paper is organized as follows. In section 2, the theoretical mechanism and assumptions are described, in section 3 the measurement system and data used are presented, section 4 interprets the findings of the empirical analysis model, and in section 5 conclusions and recommendations are suggested.
2 Theoretical hypotheses
2.1 Linear effect of the digital economy on GTFP
The essence of the digital economy is that data is the core production factor and it promotes the innovation of production means to propels the green economic transformation (Ma and Zhu, 2022). The digital economy influences GTFP through scale effect, technology effect, and structural effect. As for the technology effect, the digital economy is a type of technological innovation. Its high-tech characteristics can promote the sharing of information resources to overcome the original spatial constraints of the industry, realize the precise connection of resources, and allow information technology to penetrate industrial circulation, improve overall production efficiency (Chen et al., 2019), and reduce resource misallocation (Berrone et al., 2013). Regarding scale effect, the expansion of emerging industries is driven by the digital economy, which gives rise to more talent, technological, and knowledge-based growth points in the emerging economy, realizes the industrial aggregation of the emerging economy, and promotes TFP improvement. In addition, in terms of structural effects, which can encourage dynamic change and empower green development with digital technology (Wang L. et al., 2021). The utilization of high-tech artificial intelligence has enhanced production processes by transforming and upgrading traditional industries as well as setting new industries and formats to achieve high output with low pollution and low input. Meanwhile, high-tech artificial intelligence can help drive technological innovation and resource utilization efficiency within the digital economy so it develops industry from mid-to-high end (Wang J. et al., 2022), thereby improving the GTFP. Thus, the following hypothesis was proposed:
2.2 The regulating effect of technological innovation
Green development cannot be separated from the harmonization of social, economic, and ecological dimensions, which includes resource utilization and economic development, and technological innovation has emerged as an indispensable means of balancing ecological friendliness and economic expansion. The digital economy encourages GTFP growth that relies on technological innovation development (Hao et al., 2022). Firstly, innovative information technology expands the digital economy’s development opportunities and competitive advantages, guarantees that green technology innovation is carried out in the digital environment, eliminates the technology gap limitation (Lu and Zhu, 2022), expedites the conversion of digital technology achievements to economic benefits, and encourages green economic development (Wang X. et al., 2022). Secondly, technological innovation can support the creation and use of products for the digital economy, advance production, energy-saving, and environmental protection technologies, and effectively optimize front-end production and end pollution treatment technologies of businesses (Li and Lin, 2017). It can also enhance production technology and pollution management in the industry and promote the entire industry to progress from primitive to technologically advanced. The endogenous growth theory assumes that increasing production efficiency requires technical advancement and the growth of strategic emerging industries and new energy (Liu and Dong, 2021). Technological advancement reduces the reliance on natural resources for urban development (Miao et al., 2017), enables enterprises to develop a variety of clean energy sources (Chen, 2022), replaces polluting energy sources, improves energy utilization, modifies the structure of energy use, accelerates the transition of highly polluting and energy-consuming enterprises to green and low-carbon operations, and subsequently reduces pollution.
Concurrently, there is a spillover of technological innovation, which may have a suppressive impact on the GTFP of nearby regions (Wang H. et al., 2021). It is likely that technological advancements could have a “siphon effect” (Sun, 2022) that attracts the migration of high-tech industries and enterprise personnel from neighboring regions. This results in the outflow of talent and resources from neighboring regions, and thereby suppresses the development of GTFP in neighboring regions. Additionally, environmental control standards rise in tandem with the advancement of green technology. This results in the relocation of companies that are highly polluting or with outdated production capabilities to the periphery of the region (Zhao H. et al., 2020). This creates a “polluters paradise” in neighboring regions and impedes their GTFP growth and green transformation. According to the above findings, the following hypotheses were proposed:
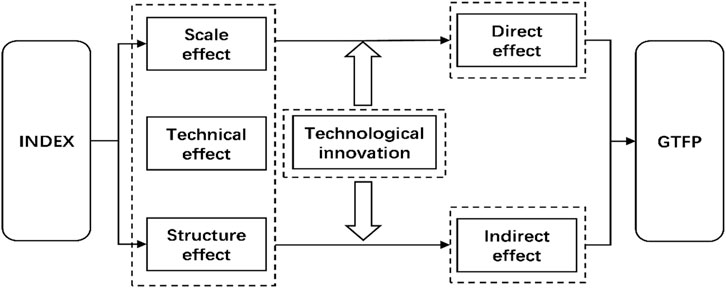
FIGURE 1. Theoretical mechanism model.
3 Materials and methods
3.1 Construction of the indicator system
The digital economy is an extension of the concept of the internet economy within the information economy. It is a new type of business involving many subjects and is not restricted to any specific industry. Industrial digitization, industrialization, digital infrastructure and digital innovation were used to construct our digital economy evaluation system (Table 1). Digital infrastructure lays the basis for the digital economy, and the improvement of basic facilities directly determines the level of hardware facilities in the digital economy. Whereas, digital industrialization and industrial digitization are the core of the development of the digital economy, The primary driving force behind the digital economy is R&D innovation, which guarantees economic long-term sustainability.
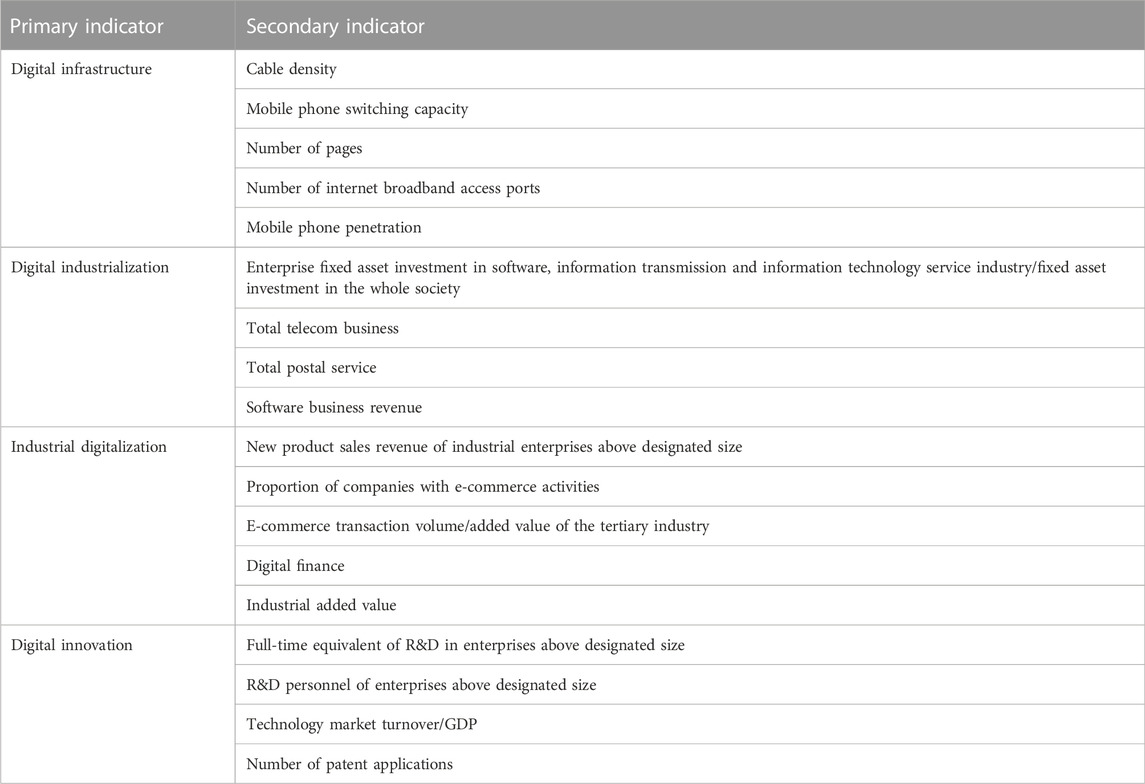
TABLE 1. Digital economy indicator system.
3.2 Research methods
3.2.1 Super-efficient slacks-based measure (SBM)
The principle of the model is as follows:
where q1 and q2 are the numbers of desired and undesired output indicators, respectively; m is the number of input indicators; ρ is spatial autoregressive coefficient value; λ is the weight vector; and
3.2.2 Spatial Durbin model
Spatial Durbin model measures the influence on the region and adjacent regions, and has been commonly employed in practice (Liu and Song, 2020; Wang H. et al., 2021; Wu et al., 2021; Zhao and Wang, 2022), The equation is given below.
where β and θ are the parameters to be estimated; X and Y are explanatory and explained variables respectively; then ρ is the spatial autoregressive coefficient; W is the spatial 0–1 weight matrix selected for this study, meaning that if two provinces are adjacent Wij = 1, otherwise Wij = 0; and ε is a random disturbance term.
3.3 Variable setting
3.3.1 Explained variables
GTFP (GTFP):By employing the perpetual inventory method (Hao et al., 2020), in this study the SBM model was used to estimate the number of employees as labor input, and energy input as total energy consumption. The constant GDP represented the desired output. The three industrial wastes—industrial wastewater chemical oxygen demand, industrial waste gas SO2, and industrial waste generation—represented undesired output.
3.3.2 Core explanatory variable
Digital economy (INDEX): Calculated using the principal component method in accordance with the index system constructed as explained in section 3.1.
3.3.3 Control variables
Economic development level (PGDP): Economic growth is intimately related to environmental quality. Utilizing the per capita gross regional product to evaluate PGDP (Zheng et al., 2022).
Financial development level (FINANCE): Financial development can alleviate the financing constraints encountered by enterprises while engaging in R&D innovation, release the vitality of enterprises’ industrial technological innovation, and provide capital power for the improvement of GTFP. This indicator was measured using the financial institutions’ loan-to-deposit ratio at the end of the year (Huang et al., 2014).
Environmental regulation (ENV): High-quality development cannot be achieved without the pushback effect of environmental regulation on economy, which can control the entry and expansion of high-polluting industries and enhance high-quality development. This indicator was measured by the ratio of government environmental protection expenditure to financial expenditure (Guo, 2019).
Foreign investment (FDI): The introduction of foreign capital results in management experience and technology spillover through the “demonstration effect” and “diffusion effect.” This can enhance industry productivity and drive urban economic development. The resource environment increases pressure and reduces the GTFP. This indicator was determined using the percentage of foreign investment in the GDP (Li et al., 2021).
Human capital (EDU): High-quality human capital is conducive to innovative R&D, can foster greater innovation development in the area, and is an essential driver for transforming the economic model. This indicator was measured by using the average years of education (Qiu et al., 2021).
3.3.4 Adjustment variables
Technological innovation (TECH): Technology innovation is essential to the economic transformation of China, promoting the creation and application of green Frontier technologies, as well as lowering manufacturing costs and increase industrial added value. This indicator was measured by weighted patents (Chen et al., 2022), more specifically, the number of weighted patents = the number of inventions obtained in the year × 0.5 + the number of utility models obtained in the year × 0.3 + the number of designs obtained in the year × 0.2. The data were collected from “the China Science and Technology Statistical Yearbook.”
3.4 Data sources
The data used in this study were panel data of 30 provinces (excluding Tibet, Hong Kong, Macao, and Taiwan). The data were collected from 2013 to 2019. The linear imputation method was utilized to replenish the missing data.
4 Results and discussion
4.1 Analysis of China’s GTFP
Overall, China’s GTFP value for the 2013–2019 period was low (Figure 2), demonstrating that the economy was extensively growing and there were certain deficiencies in ecological protection and environmental governance. Regarding evolutionary trends, China’s GTFP showed a modest overall fluctuation from 2013 to 2019 while maintaining an increasing trend. In 2019, the national average GTFP reached a high point of 1.0487 and thus achieved an effective level. The annual average growth rate was 4.19%, indicating the country’s environmental policy was maintained throughout this time.
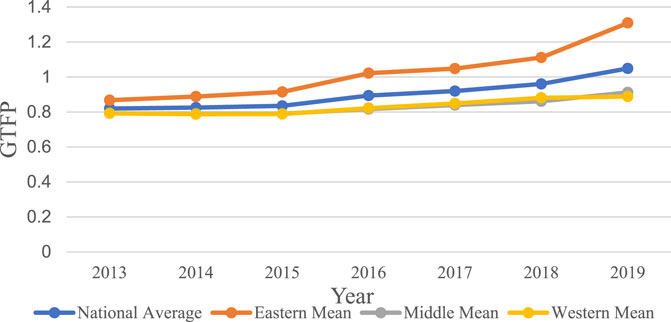
FIGURE 2. Regional green total factor productivity levels based on the super-efficient SBM model.
In terms of sub-regions, the GTFPs in China’s eastern, central, and western regions maintained a growth trend. The eastern regions’ average GTFP value (1.0228) was highest, followed by the western region (0.8297), and the central region (0.8286), with notable differences within regions. Moreover, the average annual GTFP value in the eastern region of the country during the sample observation period exceeded the national level. The reason is that eastern cities consider ecological balance and economic growth. Meanwhile, the central region’s GTFP was similar to that of the national level. For the western region, the average GTFP was the lowest, and lower than that of the national level. It is possible that the lackluster economic growth, the lack of effective exploitation, and low environmental protection awareness impeded the green economy. That is, the regional economic gap is not only reflected in the economic level but also economic quality.
4.2 Spatial correlation analysis
To avoid errors in the spatial econometric model, we assessed whether the digital economy and GTFP were spatially autocorrelated before conducting the econometric test. We also examined the spatial dependence characteristics of the different regions through the local spatial autocorrelation index using the following formulas. W presents the spatial weight matrix, which is identical to section 3.2.2. Xi and Xj represent the digital economic GTFP values of region i and region j, n is the regional sample size.
4.2.1 Global spatial autocorrelation analysis
The Moran’s index I) of GTFP and digital economy were both greater than 0 in Table 2, and the statistical testing indicated that GTFP and the digital economy had a substantial positive spatial autocorrelation. Overall, both digital economy and GTFP were affected by neighboring regions, showing an unstable state that resulted in unbalanced regional development.
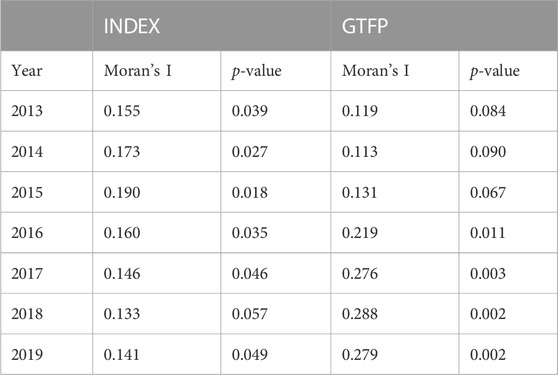
TABLE 2. Global Moran’s I.
4.2.2 Local Moran’s I
The local Moran’s I evidence the spatial aggregation features of the regional provinces (Figures 3, 4). The spatial agglomeration status of GTFP and the digital economy were investigated using the local Moran’s I for 2015 and 2019. Two obvious aggregation areas were evidenced: i) high-high and low-low aggregation in the first and third quadrants respectively, ii) provinces with high (low) values of the digital economy tended to cluster with provinces which with high (low) values of GTFP. This evidence demonstrates a significant positive spatial correlation. Additionally, whether it was GTFP or the digital economy, significantly more provinces appeared in the third quadrant than in the first quadrant, indicating that GTFP and digital economy development were still at a low level in most provinces in 2015–2019. There was no obvious provincial relocation in this period, indicating that some departments did not achieve significant results in the implementation of policy regulation. While actively responding to the national call, each province and city should earnestly understand their own development status, explore a reasonable and effective development path, and strive to migrate to the first quadrant.
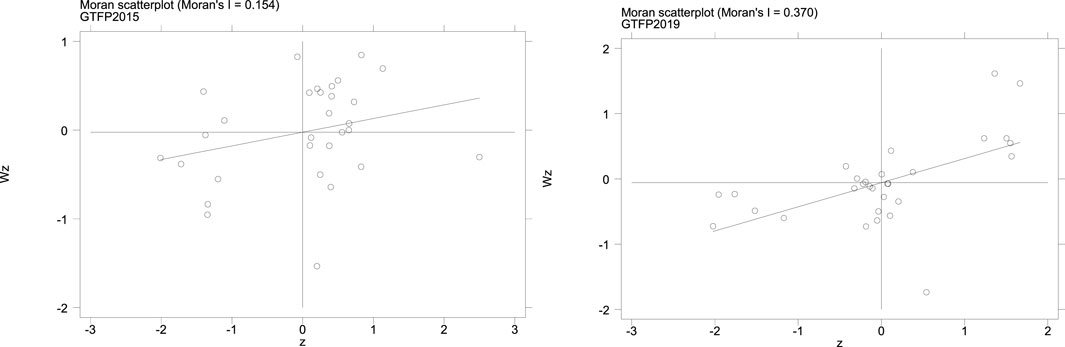
FIGURE 3. Moran’s I scatter plots of green total factor productivity in 2015 and 2019 for the 30 provinces.

FIGURE 4. Moran’s I scatter plots of index in 2015 and 2019 for the 30 provinces.
4.3 Analysis of spatial measurement results
4.3.1 Model testing
As the spatial autocorrelation test showed that the digital economy and GTFP were significantly correlated. Therefore, a spatial econometric model was used to further test the relationship. First, a model applicability test was conducted according to the general ordinary least squares (OLS) model to determine whether the model contained a spatial lag or a spatial error term (Table 3). Lagrange Multiplier Test (LM) showed that the LM spatial error value (114.318) was significantly higher than the LM spatial lag value (78.856), and the value of the robust (R)-LM spatial error (35.677) was higher than that of the R-LM spatial lag (0.114). However, to avoid residual errors due to autocorrelation on the model results, further estimations were conducted using the spatial Durbin model. Further model degradation, likelihood ratio (LR), and Wald tests were significant, thus rejecting the null hypothesis. Overall, model testing revealed that dual-fixed SDM was the most suitable model.
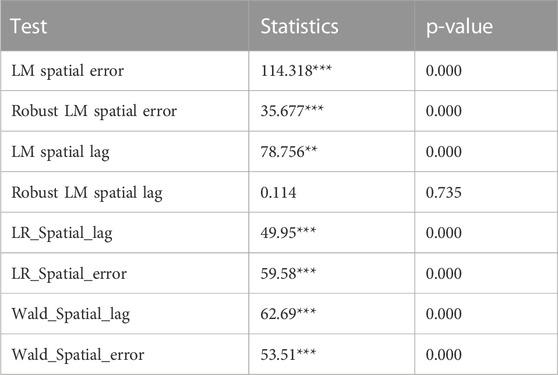
TABLE 3. Model testing.
4.3.2 SDM analysis
The outcomes of the dual fixed effects estimation were represented by Table 4 models 3) and 4), whereas models 1) and 2) reflected the time and spatial fixed regression, respectively. The results indicate the SDM autocorrelation coefficient rho was significantly positive, revealing that GTFP had a positive spatial spillover effect, accordant to the previous spatial correlation test results. The direct and spatial lag coefficients of the spatial economy remained positive and significant, revealing that the improvement of digital economy on GTFP in regions and neighboring regions occurred, thus verifying Hypothesis 1.
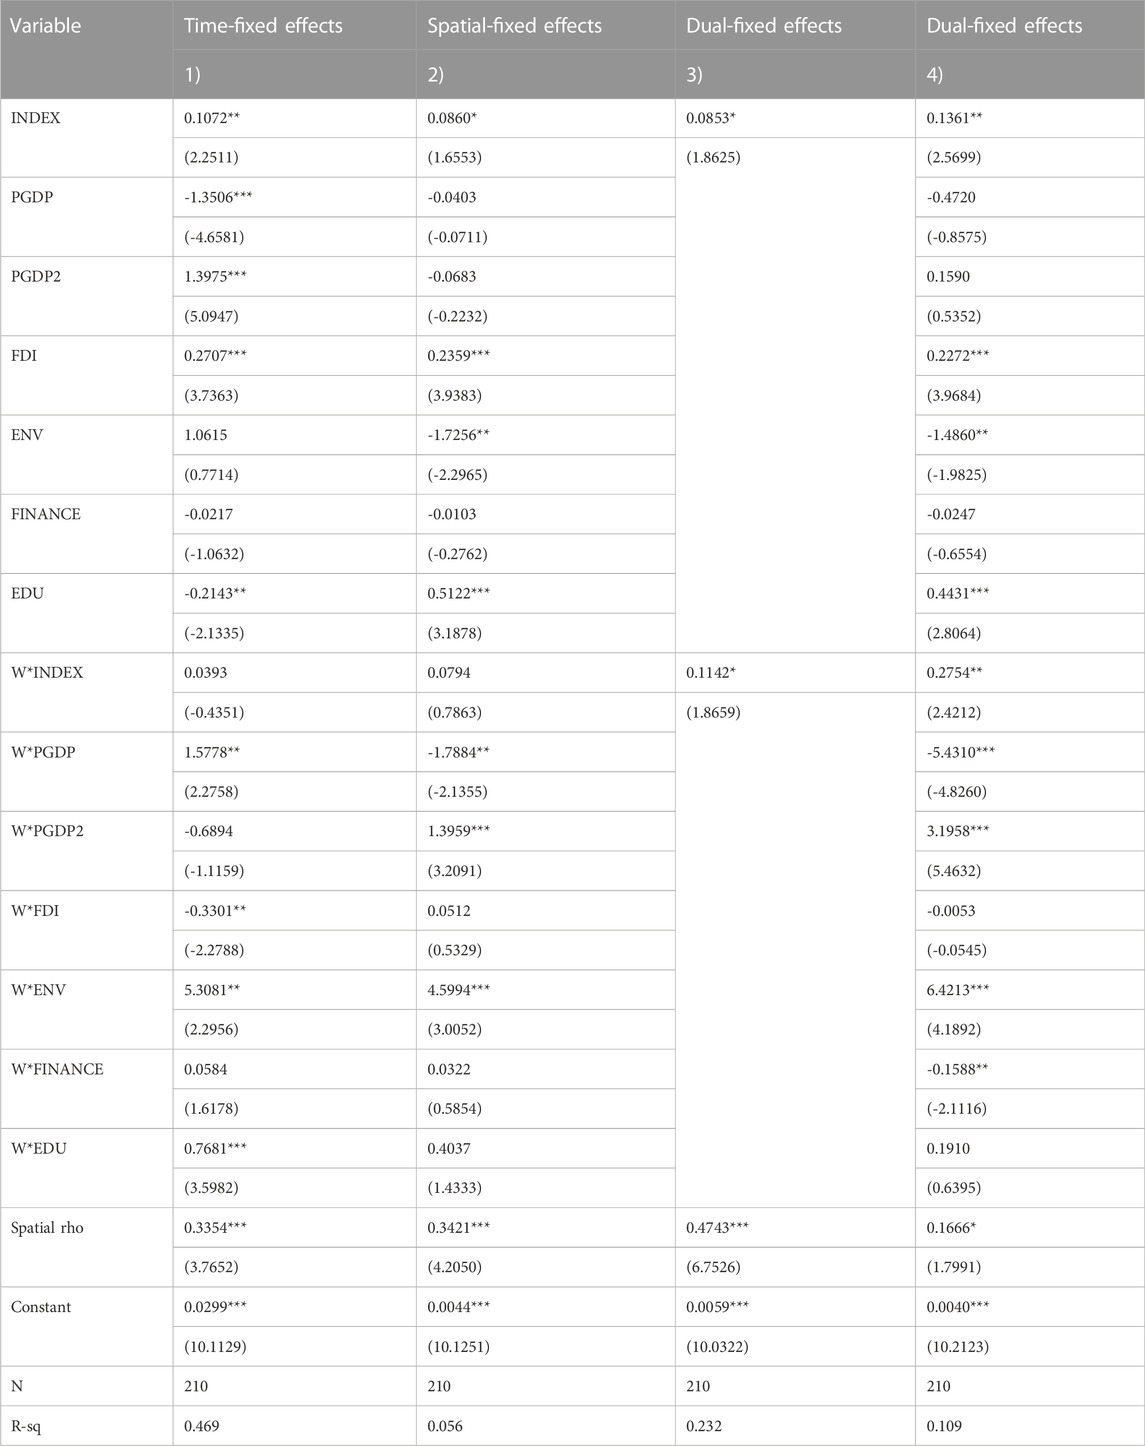
TABLE 4. SDM regression results.
4.3.3 Spatial effect decomposition
From a spatial perspective, the above model cannot fully reflect how the digital economy affected GTFP in a region and neighboring regions. Consequently, adopting the partial differential method to calculate the spatial distribution of the GTFP, based on LeSage and Pace (2009) This effect was decomposed (Table 5).
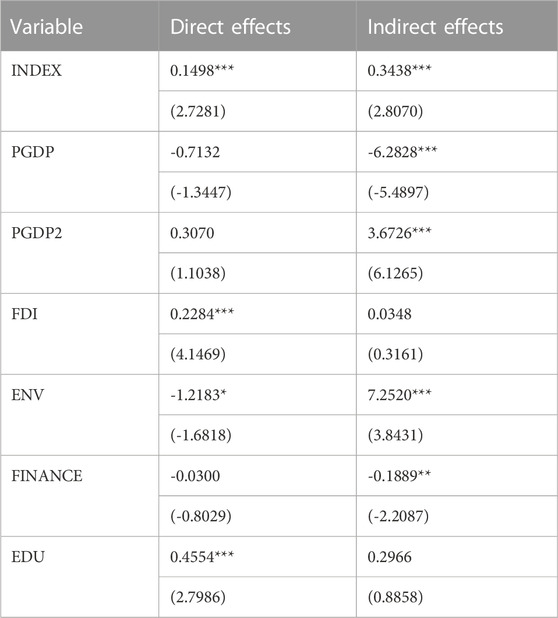
TABLE 5. Spatial effect decomposition.
The digital economy’s direct effect coefficient on GTFP was 0.1498, revealing that economic digital development shifted the real economy from “extensive development” to “high development.” The green transformation of quality development indicates the advancement of enterprises’ operation mode. Moreover, it indicates the traditional industry is gradually shifting towards a high-output, low-pollution mode, which reduces environmental pollution, and promotes GTFP. Perspective on the spillover effect, coefficient value was 0.3438 (Table 5) which is more significant that of the promotion effect on adjacent regions. Which evidences that the digital economy has produced the demonstration effect for neighboring regions, prompting imitation to improve production efficiency, accelerate technology transfer and factor spillovers, and promote the development of GTFP.
Regarding control variables, the PGDP spillover influence was negatively significant, demonstrating that over-exploitation and pursuit of economic growth, and will result in ecological degradation and consequently raise the environmental burden, hindering green development. Meanwhile, the economic development squared coefficient (PGDP2) was positive and had a U-shaped relationship (You and Lv, 2018; Mughal et al., 2022; Sun, 2022), indicating that China’s economic development accords with the EKC hypothesis. The FINANCE indirect effect was negative, hindering the GTFP. This can be attributed to the unreasonable allocation of financial resources, with capital elements flowing to other industries, resulting in limited funds and obstructing the region’s green economy. However, the direct effect is negligible had no impact on adjacent regions. Environmental regulation’s (ENV) indirect effects on GTFP revealed a significant promotion effect, displaying that China’s recent investment in environmental protection and regulation has yielded significant results, while environmental regulation in the region also generates competition and imitation effects, propelling the green development of neighboring regions. Nevertheless, a significant negative direct effect was observed, likely due to excessive environmental regulation causing a waste of labor and material resources, which is counterproductive as it can generate a “cost of compliance” effect and hinder GTFP. The FDI had a favorable direct impact on GTFP, implying that foreign investment significantly contributed to the GDP growth of China. Moreover, foreign investment introduces advanced environmental protection technology and management experience, which drives green transformation in enterprises and improves environmental quality. Human capital (EDU) had a beneficial impact on GTFP, and higher education level is equivalent to an increase in composite talents, which promotes the transformation of green achievements and provides talent assistance for the long-term growth of the green economy.
4.3.4 Robustness test
In this study, the model’s robustness was examined using endogenous discussion, Winsorize, and by adding control variables.
1) Instrumental variables approach. Referring to Nunn and Qian (2014), and Zhao T. et al. (2020), we introduced a panel instrumental variable with a time-varying variable. Specifically, the interaction was constructed between the number of landlines in 1984 and the amount of Internet users nationwide in the previous year to indicate the instrument variables of the digital economy of that year. Table 6 model 1) and 2) show that the Kleibergen Paap rk LM statistic was significant, while the Kleibergen Paap rk Wald F statistic was greater than the critical value at the 10% level of Stock Yogo. This demonstrates that the instrumental variable was reasonable and effective. Nevertheless, the digital economy’s coefficient was also significant.
2) Winsorize. Considering the potential effects of outliers, in this study a 1% bilateral tail reduction on the explained variables was conducted. The result is displayed in model 3). The digital economy coefficient remained positively significant, which is, consistent with the findings in this study.
3) Increase control variables. To avoid the potential effects of differences in economic development characteristics of different regions on the empirical results, control variables were increased, namely, government intervention (fiscal expenditure as a proportion of GDP), marketization level (Zhou and Li, 2021), and population density (total population at the end of the year). Model 4) in Table 6 reveals that the digital economy continued to be favorably significant on GTFP, so the model conclusion is reliable.
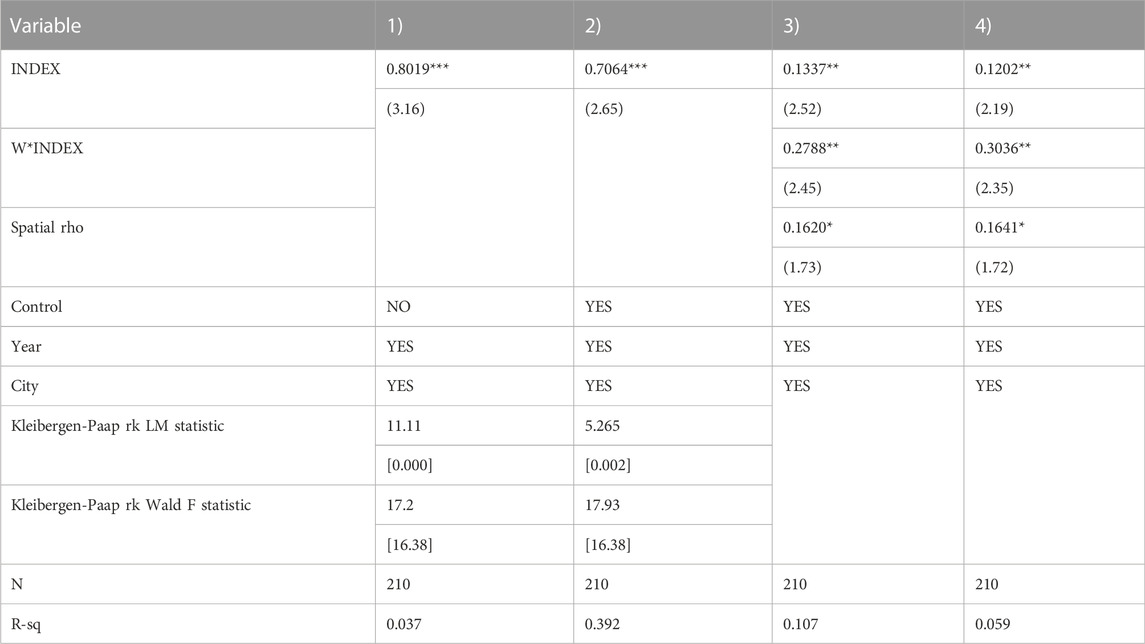
TABLE 6. Robustness test results.
4.3.5 Analysis of moderating effects
Results of the SDM regression with technological innovation as adjustment variables (models 1) and 2) in Table 7) showed a significantly positive interaction between technological innovation and the digital economy which exerted a considerable influence on regional GTFP. This verified Hypothesis 2. Meanwhile, a significantly negative indirect effect was observed, showing that technological innovation can impede a positive connection between the digital economy and GTFP, and thereby verified Hypothesis 3. In addition, the spatial autocorrelation coefficients of models 1) and 2) were significantly positive, further supporting that GTFP had a spatial spillover effect.
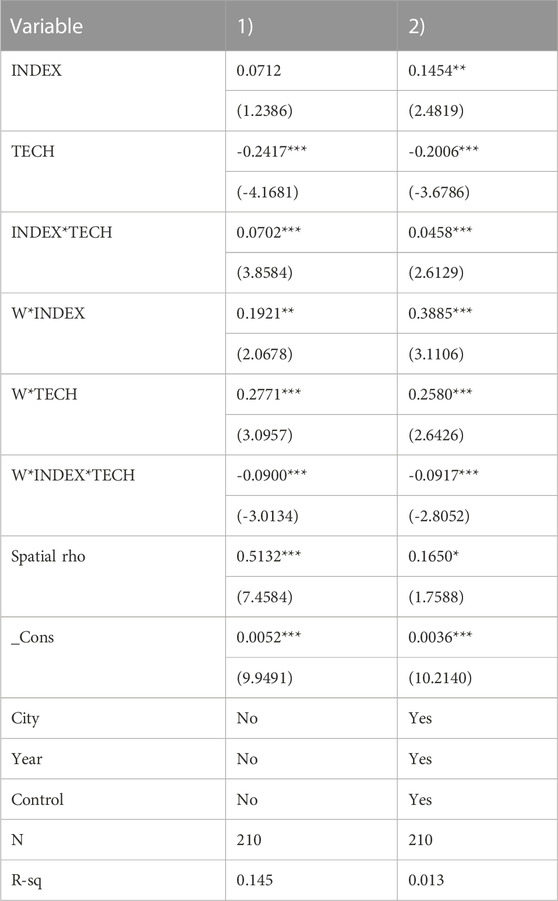
TABLE 7. Spatial Durbin model regression for technological innovation.
The spatial effects were decomposed and analyzed to further explore the moderating impacts of technological innovation (Table 8). Overall, the addition of the variables resulted in significant effects on digital economy, consistent with our conclusions in previous sections. The interaction between technological innovation and the digital economy provided a substantial effect on GTFP with direct effect coefficients on the GTFP of 0.0429. Thus, technological innovation significantly improved the local economies. This implies that a higher level of technological innovation can support green technology advancement more effectively, leading to better improved environmental pollution control and digital technology innovation, actively achieving technological change and green transformation, and driving the growth of regional GTFP. Nevertheless, a significant negative spillover effect was observed. According to the “pollution sanctuary” hypothesis, local environmental regulations drive high-polluting industries to relocate to nearby areas, aggravating environmental pollution there. Which lessens the benefits of convergence, rendering innovation ineffective and impeding the growth of GTFP in neighboring regions.
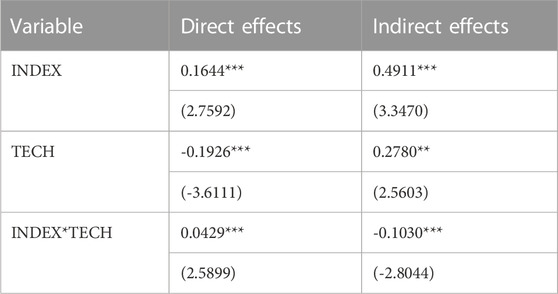
TABLE 8. Spatial effect decomposition of technological innovation.
5 Conclusions and recommendations
Based on panel data from 2013 to 2019, digital economy and GTFP were measured. The spatial econometric model was used to analyze how the digital economy affects GTFP. The following conclusions were drawn:
1) During the 2013–2019 observation period, China’s GTFP maintained a continuous growth trend, indicating that ecological protection policies have recently been implemented. Significant regional differences in GTFP were observed. The eastern region demonstrated the highest GTFP with 1.0228, while the central region revealed the smallest with 0.8286.
2) The spatial autocorrelation test showed that the country’s GTFP was significantly spatially autocorrelated, manifesting spatial agglomeration. The local autocorrelation test evidenced the GTFP’s spatial heterogeneity in different provinces, with provinces of high (or low) GTFP agglomerating with each other. Further, the SDM showed a positive spatial coefficient, indicating that China’s GTFP had both spatial dependence and a positive spatial spillover effect. The decomposition of spatial effects showed that the digital economy promoted GTFP in each province driving the growth of GTFP in neighboring provinces relying upon the spatial spillover effect; moreover, its indirect effect (0.3438) was greater than its direct effect (0.1498).
3) In terms of adjustment variables, the region’s technological innovation positively promoted the relation between the GTFP and the digital economy, negatively regulating the surrounding region digital economy’s impact on GTFP. According to the findings, this article proposed the following three policy recommendations:
1) Vigorously develop the digital economy to support green development. Actively guide the integration of traditional industries with the digital economy to enhance economic efficiency and develop industrial elements through the flow of data and information. On the one hand, importance should be attached to the digital information industry by promoting digital industrialization, 5G, and artificial intelligence within existing networks. While vigorously developing the internet platform economy and improving cross-platform cooperation in the digital economy industry for generating new industries and new business models. On the other hand, within the traditional economy, the integration of AI should be encouraged and low pollution and high output should be strived for.
2) Strengthen environmental regulations and reduce environmental pollution. As the research evidenced that government intervention significantly promoted GTFP. Consequently, the government should adjust and formulate reasonable environmental regulation policies and increase the investment in energy saving, zero pollution, and other clean energy and green innovation technologies. Simultaneously, regional environmental regulation should be incorporated into the official performance appraisal system, and the supervision and punishment for environmental violations should be strengthened. Enterprises should also strictly abide by national pollution discharge indicators, implement energy conservation, apply new industrial development patterns, and improve the previous resource-dependent model and the efficiency of pollution control devices.
3) Optimize the industrial structure and accelerate green transformation. Steadily advancing the development of primary and secondary industries, while centering around the growth of high-tech industries. Moreover, the opportunities from digital globalization should be pursued. Traditional industries should be conducted through the penetration and diffusion of information technology. Improving and enhancing the quality and efficiency of products in the entire industry, reducing unnecessary waste of resources, and enhancing the green transformation of the industrial structure through information resource sharing are equally important.
4) Strengthen regional linkages and improve GTFP. As GTFP has an obvious spatial spillover effect, it is imperative to break down regional barriers, strengthen exchanges and cooperation between regions, promote an exchange of green technology and information elements between regions, and form a regional linkage of resource exchange. This will promote green technology and knowledge spillover, comprehensively improve GTFP, and achieve common progress.
Limitations of this paper: 1) The sample data was only from a 7 years period, and detailed information was difficult to obtain due to a lack of data availability. 2) This study lacked did not investigate whether the digital economy and GTFP have a non-linear relationship (Pan et al., 2022), moreover, there may be other potential mediating channels for the mechanism of the digital economy on GTFP, such as energy structure, industrial transformation that were not revealed here. The aforementioned points represent the current study’s limitations and should be taken into account going forward.
Data availability statement
The original contributions presented in the study are included in the article/supplementary material, further inquiries can be directed to the corresponding author.
Author contributions
Writing-original draft, methodology, resources, writing-review and editing XS; conceptualization, data curation KJ; formal analysis, investigation, funding acquisition XZ; project administration, software ZC; supervision, validation, visualization JX.
Funding
This work was supported by the Natural Science Research Project of Colleges and Universities in Anhui Province (Grant Nos. KJ2019ZD45, KJ 2020A0120), Social Science Planning Project in Anhui Province (Grant No. AHSKF 2021D29), Innovation Development Research Project in Anhui Province (Grant No. 2021CX053), National Natural Science Foundation of China (Grant No. 71901088), National Social Science Fund of China (Grant No. 22BTJ048), and Postgraduate Research Fund Project in Anhui University of Finance and Economics (Grant No. ACYC2021318).
Conflict of interest
The authors declare that the research was conducted in the absence of any commercial or financial relationships that could be construed as a potential conflict of interest.
Publisher’s note
All claims expressed in this article are solely those of the authors and do not necessarily represent those of their affiliated organizations, or those of the publisher, the editors and the reviewers. Any product that may be evaluated in this article, or claim that may be made by its manufacturer, is not guaranteed or endorsed by the publisher.
References
Aparicio, J., Barbero, J., Kapelko, M., Pastor, J. T., and Zofío, J. L. (2017). Testing the consistency and feasibility of the standard Malmquist-Luenberger index: Environmental productivity in world air emissions. J. Environ. Manag. 196, 148–160. doi:10.1016/j.jenvman.2017.03.007
Berrone, P., Fosfuri, A., Gelabert, L., and Gomez-Mejia, L. R. (2013). Necessity as the mother of ‘green’inventions: Institutional pressures and environmental innovations. Strateg. Manag. J. 34 (8), 891–909. doi:10.1002/smj.2041
Cao, B., and Wang, S. (2017). Opening up, international trade, and green technology progress. J. Clean. Prod. 142, 1002–1012. doi:10.1016/j.jclepro.2016.08.145
Chen, G., Han, J., and Han, K. (2022). Urban digital economy development, skill-biased technological progress and labor underemployment. China Ind. Econ. (08), 118–136. doi:10.19581/j.cnki.ciejournal.2022.08.007
Chen, P. (2022). Is the digital economy driving clean energy development?-New evidence from 276 cities in China. J. Clean. Prod. 372, 133783. doi:10.1016/j.jclepro.2022.133783
Chen, S. Y., and Golley, J. (2014). Green' productivity growth in China's industrial economy. Energy Econ. 44, 89–98. doi:10.1016/j.eneco.2014.04.002
Chen, X., Gong, X., Li, D., and Zhang, J. (2019). Can information and communication technology reduce CO2 emission? A quantile regression analysis. Environ. Sci. Pollut. Res. 26 (32), 32977–32992. doi:10.1007/s11356-019-06380-8
Chung, Y. H., Färe, R., and Grosskopf, S. (1997). Productivity and undesirable outputs: A directional distance function approach. J. Environ. Manag. 51 (3), 229–240. doi:10.1006/jema.1997.0146
Gong, X. M., Zhang, J. P., Zhang, H. R., Cheng, M. W., Wang, F., and Yu, N. (2020). Internet use encourages pro-environmental behavior: Evidence from China. J. Clean. Prod. 256, 120725. doi:10.1016/j.jclepro.2020.120725
Gu, B., Liu, J., and Ji, Q. (2022). The effect of social sphere digitalization on green total factor productivity in China: Evidence from a dynamic spatial Durbin model. J. Environ. Manag. 320, 115946. doi:10.1016/j.jenvman.2022.115946
Guo, J. (2019). The impact of environmental regulation on green technology innovation-Chinese evidence of the "Porter effect. Finance Trade Econ. 40 (04), 147–160.
Han, D., Ding, Y., Shi, Z., and He, Y. (2022). The impact of digital economy on total factor carbon productivity: The threshold effect of technology accumulation. Environ. Sci. Pollut. Res. 29, 55691–55706. doi:10.1007/s11356-022-19721-x
Hao, X., Li, Y., Ren, S., Wu, H., and Hao, Y. (2022). The role of digitalization on green economic growth: Does industrial structure optimization and green innovation matter? J. Environ. Manag. 325, 116504. doi:10.1016/j.jenvman.2022.116504
Hao, Y., Gai, Z. Q., and Wu, H. T. (2020). How do resource misallocation and government corruption affect green total factor energy efficiency? Evidence from China. Energy Policy 143, 111562. doi:10.1016/j.enpol.2020.111562
Huang, J., Lv, H., and Wang, L. (2014). Mechanisms of financial development affecting regional green development-a study based on eco-efficiency and spatial measurement. Geogr. Res. 33 (03), 532–545.
LeSage, J., and Pace, R. K. (2009). Introduction to spatial econometrics. New York: Chapman and Hall/CRC.
Li, B., and Wu, S. S. (2017). Effects of local and civil environmental regulation on green total factor productivity in China: A spatial durbin econometric analysis. J. Clean. Prod. 153 (1), 342–353. doi:10.1016/j.jclepro.2016.10.042
Li, K., and Lin, B. (2017). An application of a double bootstrap to investigate the effects of technological progress on total-factor energy consumption performance in China. Energy 128, 575–585. doi:10.1016/j.energy.2017.04.044
Li, T. C., Han, D. R., Ding, Y. Y., and Shi, Z. Y. (2020). How does the development of the internet affect green total factor productivity? Evidence from China. Ieee Access 8, 216477–216490. doi:10.1109/access.2020.3041511
Li, T., Liao, G., Huang, D., and Zhang, P. (2020). Long noncoding RNA SNHG17 induced by YY1 facilitates the glioma progression through targeting miR-506-3p/CTNNB1 axis to activate Wnt/β-catenin signaling pathway. Cancer Cell Int. 8, 29. doi:10.1186/s12935-019-1088-3
Li, X., Xu, C., Cheng, B., Duan, J., and Li, Y. (2021). Does environmental regulation improve the green total factor productivity of Chinese cities? A threshold effect analysis based on the economic development level. Int. J. Environ. Res. Public Health 18 (9), 4828. doi:10.3390/ijerph18094828
Liu, H., and Song, Y. (2020). Financial development and carbon emissions in China since the recent world financial crisis: Evidence from a spatial-temporal analysis and a spatial Durbin model. Sci. Total Environ. 715, 136771. doi:10.1016/j.scitotenv.2020.136771
Liu, Y., and Dong, F. (2021). How technological innovation impacts urban green economy efficiency in emerging economies: A case study of 278 Chinese cities. Resour. Conservation Recycl. 169, 105534. doi:10.1016/j.resconrec.2021.105534
Liu, Y., Yang, Y., Li, H., and Zhong, K. (2022). Digital economy development, industrial structure upgrading and green total factor productivity: Empirical evidence from China’s cities. Int. J. Environ. Res. Public Health 19 (4), 2414. doi:10.3390/ijerph19042414
Lu, Y., and Zhu, S. (2022). Digital economy, scientific and technological innovation, and high-quality economic development: A mediating effect model based on the spatial perspective. Plos one 17 (11), e0277245. doi:10.1371/journal.pone.0277245
Luo, K., Liu, Y. B., Chen, P. F., and Zeng, M. L. (2022). Assessing the impact of digital economy on green development efficiency in the Yangtze River Economic Belt. Energy Econ. 112, 106127. doi:10.1016/j.eneco.2022.106127
Lyu, Y., Wang, W., Wu, Y., and Zhang, J. (2022). How does digital economy affect green total factor productivity? Evidence from China. Sci. Total Environ. 857 (2), 159428. doi:10.1016/j.scitotenv.2022.159428
Ma, D., and Zhu, Q. (2022). Innovation in emerging economies: Research on the digital economy driving high-quality green development. J. Bus. Res. 145, 801–813. doi:10.1016/j.jbusres.2022.03.041
Madden, G., and Savage, S. J. (2000). Telecommunications and economic growth. Int. J. Soc. Econ. 27, 893–906. doi:10.1108/03068290010336397
Miao, C., Fang, D., Sun, L., and Luo, Q. (2017). Natural resources utilization efficiency under the influence of green technological innovation. Resour. Conservation Recycl. 126, 153–161. doi:10.1016/j.resconrec.2017.07.019
Mughal, N., Arif, A., Jain, V., Chupradit, S., Shabbir, M. S., Ramos-Meza, C. S., et al. (2022). The role of technological innovation in environmental pollution, energy consumption and sustainable economic growth: Evidence from South Asian economies. Energy Strategy Rev. 39, 100745. doi:10.1016/j.esr.2021.100745
Nguyen, T. T., Pham, T. A. T., and Tram, H. T. X. (2020). Role of information and communication technologies and innovation in driving carbon emissions and economic growth in selected G-20 countries. J. Environ. Manag. 261, 110162. doi:10.1016/j.jenvman.2020.110162
Niebel, T. (2018). ICT and economic growth–Comparing developing, emerging and developed countries. World Dev. 104, 197–211. doi:10.1016/j.worlddev.2017.11.024
Nunn, N., and Qian, N. (2014). US food aid and civil conflict. Am. Econ. Rev. 104 (6), 1630–1666. doi:10.1257/aer.104.6.1630
Oh, D.-h. (2010). A metafrontier approach for measuring an environmentally sensitive productivity growth index. Energy Econ. 32 (1), 146–157. doi:10.1016/j.eneco.2009.07.006
Pan, W. R., Xie, T., Wang, Z. W., and Ma, L. S. (2022). Digital economy: An innovation driver for total factor productivity. J. Bus. Res. 139, 303–311. doi:10.1016/j.jbusres.2021.09.061
Pittman, R. W. (1983). Multilateral productivity comparisons with undesirable outputs. Econ. J. 93 (372), 883–891. doi:10.2307/2232753
Qiu, S., Wang, Z., and Geng, S. (2021). How do environmental regulation and foreign investment behavior affect green productivity growth in the industrial sector? An empirical test based on Chinese provincial panel data. J. Environ. Manage. 287, 112282. doi:10.1016/j.jenvman.2021.112282
Salahuddin, M., and Alam, K. (2015). Internet usage, electricity consumption and economic growth in Australia: A time series evidence. Telematics Inf. 32 (4), 862–878. doi:10.1016/j.tele.2015.04.011
Sun, H. (2022). What are the roles of green technology innovation and ICT employment in lowering carbon intensity in China? A city-level analysis of the spatial effects. Resour. Conservation Recycl. 186, 106550. doi:10.1016/j.resconrec.2022.106550
Vidas-Bubanja, M. (2014). “Implementation of green ICT for sustainable economic development,” in Paper presented at the 2014 37th International Convention on Information and Communication Technology, Electronics and Microelectronics (MIPRO), Opatija, Croatia, 26-30 May 2014, 1592–1597. doi:10.1109/MIPRO.2014.6859819
Vu, K. M. (2013). Information and Communication Technology (ICT) and Singapore’s economic growth. Inf. Econ. Policy 25 (4), 284–300. doi:10.1016/j.infoecopol.2013.08.002
Wang, H., Cui, H., and Zhao, Q. (2021). Effect of green technology innovation on green total factor productivity in China: Evidence from spatial durbin model analysis. J. Clean. Prod. 288, 125624. doi:10.1016/j.jclepro.2020.125624
Wang, J., Wang, W., Ran, Q., Irfan, M., Ren, S., Yang, X., et al. (2022). Analysis of the mechanism of the impact of internet development on green economic growth: Evidence from 269 prefecture cities in China. Environ. Sci. Pollut. Res. 29 (7), 9990–10004. doi:10.1007/s11356-021-16381-1
Wang, L., Chen, Y., Ramsey, T. S., and Hewings, G. J. D. (2021). Will researching digital technology really empower green development? Technol. Soc. 66, 101638. doi:10.1016/j.techsoc.2021.101638
Wang, M. L., Pang, S. L., Hmani, I., Hmani, I., Li, C. F., and He, Z. X. (2021). Towards sustainable development: How does technological innovation drive the increase in green total factor productivity? Sustain. Dev. 29 (1), 217–227. doi:10.1002/sd.2142
Wang, X., Xu, Z., Qin, Y., and Skare, M. (2022). Innovation, the knowledge economy, and green growth: Is knowledge-intensive growth really environmentally friendly? Energy Econ. 115, 106331. doi:10.1016/j.eneco.2022.106331
Wu, H. T., Li, Y. W., Hao, Y., Ren, S. Y., and Zhang, P. F. (2020). Environmental decentralization, local government competition, and regional green development: Evidence from China. Sci. Total Environ. 708, 135085. doi:10.1016/j.scitotenv.2019.135085
Wu, H., Xue, Y., Hao, Y., and Ren, S. (2021). How does internet development affect energy-saving and emission reduction? Evidence from China. Energy Econ. 103, 105577. doi:10.1016/j.eneco.2021.105577
Xie, F. M., and Zhang, B. (2021). Impact of China's outward foreign direct investment on green total factor productivity in "belt and road" participating countries: A perspective of institutional distance. Environ. Sci. Pollut. Res. 28 (4), 4704–4715. doi:10.1007/s11356-020-10849-2
Yang, W., Chen, Q., Guo, Q., and Huang, X. (2022). Towards sustainable development: How digitalization, technological innovation, and green economic development interact with each other. Int. J. Environ. Res. Public Health 19 (19), 12273. doi:10.3390/ijerph191912273
You, W., and Lv, Z. (2018). Spillover effects of economic globalization on CO2 emissions: A spatial panel approach. Energy Econ. 73, 248–257. doi:10.1016/j.eneco.2018.05.016
Zhao, C., and Wang, B. (2022). How does new-type urbanization affect air pollution? Empirical evidence based on spatial spillover effect and spatial durbin model. Environ. Int. 165, 107304. doi:10.1016/j.envint.2022.107304
Zhao, H., Liu, Y., Lindley, S., Meng, F., and Niu, M. (2020). Change, mechanism, and response of pollutant discharge pattern resulting from manufacturing industrial transfer: A case study of the pan-yangtze river delta, China. J. Clean. Prod. 244, 118587. doi:10.1016/j.jclepro.2019.118587
Zhao, P. J., Zeng, L. E., Lu, H. Y., Zhou, Y., Hu, H. Y., and Wei, X. Y. (2020). Green economic efficiency and its influencing factors in China from 2008 to 2017: Based on the super-SBM model with undesirable outputs and spatial Dubin model. Sci. Total Environ., 741. doi:10.1016/j.scitotenv.2020.140026
Zhao, T., Zhang, Z., and Liang, S. (2020). Digital economy, entrepreneurial activity and high quality development - empirical evidence from Chinese cities. Manag. World 36 (10), 65–76.
Zheng, H., Wu, S., Zhang, Y., and He, Y. (2022). Environmental regulation effect on green total factor productivity in the Yangtze River Economic Belt. J. Environ. Manage. 325, 116465. doi:10.1016/j.jenvman.2022.116465
Zhou, A., and Li, J. (2021). Investigate the impact of market reforms on the improvement of manufacturing energy efficiency under China’s provincial-level data. Energy 228, 120562. doi:10.1016/j.energy.2021.120562
Zhou, X., Zhou, D., Wang, Q., and Su, B. (2019). How information and communication technology drives carbon emissions: A sector-level analysis for China. Energy Econ. 81, 380–392. doi:10.1016/j.eneco.2019.04.014
Zhou, Y., Jiang, J. J., Ye, B., and Hou, B. J. (2019). Green spillovers of outward foreign direct investment on home countries: Evidence from China's province-level data. J. Clean. Prod. 215, 829–844. doi:10.1016/j.jclepro.2019.01.042
Keywords: spatial heterogeneity, green total factor productivity, spatial measurement, moderating effect, SBM
Citation: Sun X, Jiang K, Cui Z, Xu J and Zhao X (2023) Exploring the impact of the digital economy on green total factor productivity in China: A spatial econometric perspective. Front. Environ. Sci. 10:1097944. doi: 10.3389/fenvs.2022.1097944
Received: 14 November 2022; Accepted: 05 December 2022;
Published: 20 January 2023.
Edited by:
Muhammad Zahid Rafique, Center for Economic Research, Shandong University, ChinaReviewed by:
Chuanming Liu, Shandong University of Finance and Economics, ChinaGrzegorz Mentel, Rzeszów University of Technology, Poland
Copyright © 2023 Sun, Jiang, Cui, Xu and Zhao. This is an open-access article distributed under the terms of the Creative Commons Attribution License (CC BY). The use, distribution or reproduction in other forums is permitted, provided the original author(s) and the copyright owner(s) are credited and that the original publication in this journal is cited, in accordance with accepted academic practice. No use, distribution or reproduction is permitted which does not comply with these terms.
*Correspondence: Xin Zhao, emhhb3NoaW5fMTk5M0AxNjMuY29t