 Qiqi Yang
 Lijie Pu1*
 Caixia Jiang
 Hongmei Tan
95% of researchers rate our articles as excellent or good
Learn more about the work of our research integrity team to safeguard the quality of each article we publish.
Find out more
ORIGINAL RESEARCH article
Front. Environ. Sci. , 06 January 2023
Sec. Environmental Economics and Management
Volume 10 - 2022 | https://doi.org/10.3389/fenvs.2022.1096087
This article is part of the Research Topic Resources and Environmental Management for Green Development View all 26 articles
Under the constraint of carbon emission, measuring and analyzing the spatial-temporal evolution characteristics of urban land use efficiency in the Yangtze River Economic Belt is the inherent requirement of its ecological protection and sustainable development. In this paper, we calculated the urban land use efficiency of 107 cities in the Yangtze River Economic Belt from 2006 to 2020 by using the SBM-Undesirable model with unexpected output, and analyzed its temporal evolution trend and spatial correlation relationship by using kernel density and spatial autocorrelation method. The results showed that: except in 2020, the urban land use efficiency was generally low due to the COVID-19 epidemic, and the urban land use efficiency in other years was mostly concentrated in the middle levels, and showed a trend of slow fluctuation and rise year by year. The difference of urban land use efficiency level between regions increased, and the dispersion degree in upstream, midstream and downstream increased with each passing year. Urban land use efficiency spatial imbalance was significant, and the urban land use efficiency level of large and medium-sized cities was generally lower than that of cities with low economic development level. The spatial correlation was weak, and the global spatial autocorrelation was basically insignificant, while the local spatial agglomeration areas were mainly distributed in the upstream and downstream regions, with a small distribution range and weak spatial interaction. The distribution areas of the standard deviation ellipse were gradually flattened, and the center of gravity as a whole shift significantly to the southwest. The research results are helpful to understand the development history and future trend of urban land use efficiency in various regions, and propose that cities should consider the impact of public crisis events in advance, reasonably control the scale of land expansion, and lead coordinated development and other reasonable suggestions when formulating land use policies.
Land is the material carrier of economic, social and ecological systems, the foundation of human survival and development, and occupies an extremely important position in human society (Sun et al., 2020). As an important part of land resources, land is the basic condition of a city’s existence and development, and its utilization efficiency is closely related to the social and economic development of the city and the construction of human settlements (Wei et al., 2020). Globally, the urbanization process is accelerating, with urbanization rates exceeding 50%, resulting in great changes in urban land use, resource demands and ecological and environmental pressure, which is a common challenge faced by all countries. In addition, previous studies have demonstrated that the increase in urban land use has a significant impact on carbon emissions, which in turn will affect the global ecosystem (Carpio et al., 2021; Wang et al., 2021). In this context, improving urban land use efficiency (ULUE) has been considered as a better way to promote the long-term sustainable development of cities in the future (Bobylev, 2009). Therefore, it is of great significance to scientifically evaluate the ULUE considering carbon emissions to promote the low-carbon utilization of urban land and optimize the allocation of land resource.
Since the reform and opening up, China’s economy has entered a high-speed development stage, and the urbanization process is accelerating. The Statistical Yearbook of Urban Construction in China shows that from 1978 to 2020, the urbanization rate increased from 17.92% to 63.89% (Zhang et al., 2022). In order to meet the needs of urbanization, the urban land area is also expanding. However, while the expansion of urban space brings economic benefits, it also creates numerous problems. On the one hand, unreasonable urban planning and uncontrolled expansion of urban space cause serious resource idleness, resulting in inefficient urban land use (Long and Qu, 2018). On the other hand, in the process of urbanization, carbon emissions from industries, infrastructure construction and transportation will exert great pressure on the sustainable development of China (Lu et al., 2022). Therefore, the Chinese government has proposed land use policies such as strictly controlling the scale of construction land and vigorously promoting the construction of a land-saving and intensive land use system in order to solve problems such as rough land use and environmental pollution and promote the construction of a new type of urbanization (Deng, 2021).
As an important development axis in the “T” spatial strategic pattern of China’s territorial development and economic layout (Bian et al., 2021), the Yangtze River Economic Belt (YREB) accounts for more than 40% of the country’s population and gross domestic product (GDP), and has become one of the strongest regions in China in terms of comprehensive strength. High-intensity industrial activities and energy consumption, carbon emissions and the pressure of urban land resources in this area have restricted the sustainable development of this area (Wang et al., 2022). The development space and regional hinterland of the YREB are extremely vast, accounting for about 21.35% of the total land area of China. It spans the east, middle and west of China, with significant regional differences, and the contradictions of unbalanced and uncoordinated economic development of cities in the region are more prominent. Land use will not only bring social and economic benefits, but also have certain negative effects on ecology. High land use efficiency is to pursue the high output of economic and social benefits under reasonable input and the lowest possible ecological destructive output. Under the constraint of carbon emission, carbon emissions are taken as the measurement standard of ecological damage, and the value directly affects the level of land use efficiency. At the same time, the addition of unexpected outputs makes the measurement results more reasonable and reliable. In conclusion, based on the important strategic position and significant regional differences of the YREB, it is of great significance to discuss the regional ULUE and its spatial differences considering carbon emissions, so as to improve ULUE, promote sustainable land use and narrow the regional differences.
In view of this, based on panel data of 107 prefecture-level and above cities in the YREB, this paper uses SBM-Undesirable (SBM-UN) model to calculate the land use efficiency of cities in the YREB from 2006 to 2020. Moreover, with the help of ArcGIS software, kernel density estimation model, exploratory spatial data analysis (ESDA) method and standard deviational ellipse, the spatial and temporal evolution characteristics and regional differences of ULUE in the YREB are dissected in order to provide targeted theoretical support and decision-making reference for improving ULUE and promoting sustainable and coordinated regional development.
The structure of this article is as follows. Section 2 reviews the existing studies on ULUE. Section 3 presents the case study area, data, and methodology. Section 4 shows the results of the analysis. Section 5 discusses the findings and presents our recommendations. The last section concludes the study.
Urban land use efficiency describes the benefits of unit urban land, and is an important index to measure the rationality of land resource development and utilization. With the rapid development of social economy, people gradually realize that improving the efficiency of urban land use is the key to fundamentally solving the contradiction between land supply and demand. Therefore, in recent years, scholars have conducted extensive discussions on this issue. Scientific evaluation of ULUE is the starting point to explore how to realize rational development and utilization of urban land, and it is also the focus of current research.
The evaluation methods of ULUE mainly include comprehensive evaluation method, parametric analysis method represented by stochastic frontier method (SFA) and non-parametric analysis method marked by data envelopment analysis method (DEA). For example, Chen et al. (2007) used hierarchical analysis (AHP) and entropy method (EM) to define the weights of regional land use efficiency evaluation indicators. Then, the multi-factor comprehensive evaluation method was used to analyze the land use efficiency and its development in Zhanjiang City. In evaluating the land use efficiency of 36 mining cities in western China, Yuan et al. (2019) adopted the improved entropy weight method to select indicators and calculate the efficiency value. However, the comprehensive evaluation method is subjective in determining the weights of measurement indicators, which can lead to the deviation of the efficiency measurement results. Therefore, more and more scholars choose parametric and non-parametric methods to analyze ULUE. Liu et al. (2020) evaluated ULUE in China by using a single-stage SFA model and analyzed the potential for ULUE improvement. Dong et al. (2020) used SFA to calculate the ULUE of 108 cities in the YREB and analyzed the interaction between ULUE, industrial transformation, and carbon emissions. Zhu et al. (2019) used the SBM model to measure the ULUE of 35 megacities in China and found that the level was low and showed a slow growth trend.
As far as the research objects of ULUE is concerned, it mainly focuses on industry and efficiency evaluation. With the attention of many scholars on ULUE, the research on the driving factors and influence mechanism of ULUE has become a research hotspot. For example, in terms of industry, Xie and Wang (2015) analyzed the spatial differences in urban industrial land use efficiency and the dynamic changes in urban industrial land total factor productivity in six major economic regions in China. On the evaluation of ULUE and its influencing factors, Xue et al. (2022) evaluated the land use efficiency of 57 cities in the Yellow River Basin, and discussed its influencing factors. It was found that the proportion of secondary industries, population density, and introduction of foreign capital contributed significantly to land use efficiency in the basin, while the urbanization of land and environmental regulations had negative effects on the land use efficiency. Gao et al. (2020) took the Wuhan metropolitan area in China as an example and found that the regional economic integration can promote the optimal allocation of resources and thus improve ULUE.
Regarding the selection of ULUE indicators, first of all, in terms of the selection of input variables, most researchers agreed that land, capital and labor could be used (Gao et al., 2022). In contrast, the selection of output variables is not quite the same. Previously, some scholars only selected economic indicators as a single output variables (Huang et al., 2016). However, with the deepening of the research on ULUE, researchers began to select output variables from economic, social and environmental aspects (Yang et al., 2022). In the process of urban land use, undesired outputs such as sewage and exhaust gases were also generated. Therefore, some scholars have included pollutants as undesired outputs in the ULUE evaluation system (Pan et al., 2022; Zhang et al., 2022). For example, Wang et al. (2022) included carbon emissions as an undesired output in their comparative study of construction land use efficiency in China and United States; Lu et al. (2022) similarly measured ULUE in three major urban agglomerations in China using carbon emissions as an undesired output and found that technological progress was the main driver of land use efficiency improvement in each urban agglomeration. However, up to now, the research on ULUE under the constraint of carbon emission is still relatively few.
Through sorting out the relevant research progress, we can find that the existing research results are quite rich, but the complete theoretical system has not been fully formed, and there are still some deficiencies: first, the definition of the concept is not clear enough. Researchers have not yet reached a consensus on the connotation of urban land use efficiency, and their definitions are usually different based on different research perspectives; Secondly, in terms of the selection of evaluation methods, the traditional DEA model is often used at present, which not only ignores the relaxation of input and output, but also fails to bring the unexpected output into the study; Third, the efficiency measurement is not comprehensive enough. When measuring the land use efficiency, existing studies usually only consider the economic and social benefits brought by land use, but less consider its negative impact on the environment. Especially in the context of carbon emission reduction, the measurement of land use efficiency has not been paid enough attention to, which makes the measurement of urban land use efficiency inaccurate.
Based on the previous research progress and deficiencies, this paper takes 107 cities in the YREB as research objects, incorporates carbon emissions into the measurement framework as unexpected output, and uses the relaxation based unexpected output measurement model (SBM-UN) to reasonably measure the unexpected output, and reveals the temporal and spatial evolution characteristics of ULUE. It provides scientific reference for low carbon efficient utilization of cities in the YREB.
The research area of this paper is cities above the prefecture level in the YREB. Due to the change of administrative system, Chaohu, Bijie, Tongren, and Pu’er, which were eliminated or added during the period of 2006–2020, were excluded, and the data caliber was processed consistently, finally 107 cities in the YREB were obtained. The YREB covers 11 provinces and municipalities, including Shanghai, Jiangsu, Zhejiang, Anhui, Jiangxi, Hubei, Hunan, Chongqing, Sichuan, Yunnan, and Guizhou. It is divided into the upstream, midstream and downstream. The downstream area includes three provinces and one municipality, including Shanghai, Jiangsu, Zhejiang, and Anhui, covering an area of about 3,50,300 square kilometers, accounting for 17.1% of the YREB. The midstream area includes Jiangxi, Hubei and Hunan provinces, covering an area of 564,600 square kilometers, accounting for 27.5% of the YREB. The upstream area includes Chongqing, Sichuan, Guizhou and Yunnan, covering an area of 1,137,400 square kilometers, accounting for 55.4% of the YREB. See Figure 1 for details.
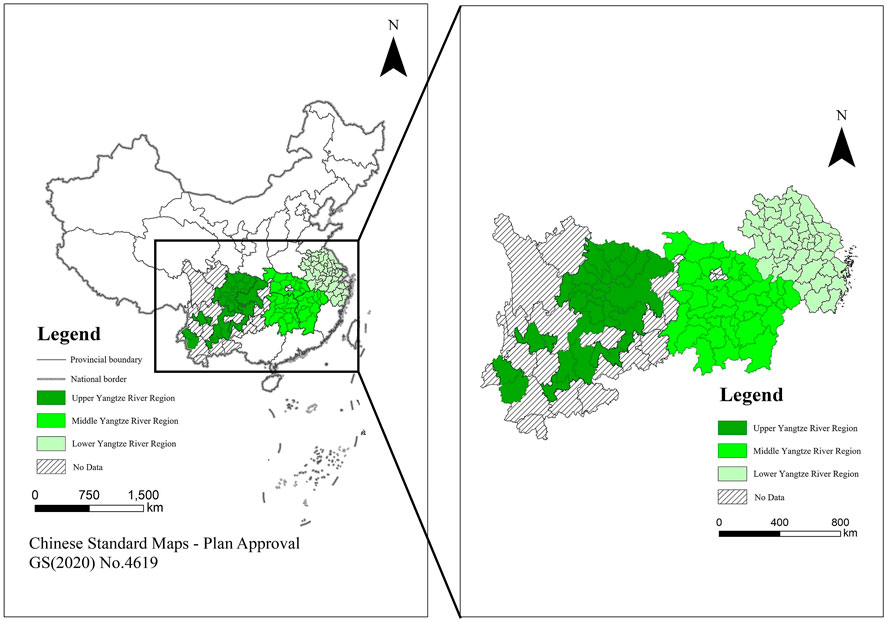
FIGURE 1. Study area.
When constructing the systematic evaluation index system of ULUE, the study not only considered the benefits of comprehensive land use on economic, social and environmental development, but also considered the adverse effects of land use on the environment. Referring to the existing research results, the study followed the scientific, comparable and representative principles of indicator selection, selected indicators that can reflect ULUE to a great extent, and built a comprehensive evaluation indicator system for ULUE (Table 1), as shown below.
(1) Input indicators: ①Land input. Urban land is the basic input element and spatial carrier of urban activities (Chen et al., 2022), and the area of urban built-up area shows the extent of urban space (Kityuttachai et al., 2013), which can reflect the status of urban land use. Therefore, the urban construction land area is chosen to represent land input in this paper. ②Capital input. The amount of investment in fixed assets is an important basis for the national investment plan and control of investment scale (Meng et al., 2021), so the investment in fixed assets is chosen as the index of capital input in this study. ③Labor input. Labor force is an important subject to promote the process of urban land use (Xiao et al., 2022), and the industries in the city are mainly secondary and tertiary industries, so this study selects the number of employees in secondary and tertiary industries as the capital input index. ④Resource input. The process of urban land development consumes a large amount of resources, and urban water supply is the lifeline of cities and an indispensable component of urban land use (Zhang et al., 2022). Therefore, the total urban water supply is chosen to represent the resource input in this paper.
(2) Desirable output indicators: ①Economic benefits. Economic benefits are the most important and measurable output of urban land use, and the development of cities mainly relies on secondary and tertiary industries (Song et al., 2021). So this study selects the output value of secondary and tertiary industries to represent the economic output benefit indicators of land use. ②Social benefits. The social benefits of ULUE are mainly reflected in the improvement of residents’ social level and quality of life (Li et al., 2014), and the disposable income of urban residents is used to represent the social benefits of urban land use output according to people’s good wishes. ③Environmental benefits. Environmental benefits reflect the environmental friendliness of urban land use, and green areas are conducive to increasing urban ecological diversity and improving ecological environment (Lu et al., 2022), so the greening coverage of urban built-up areas is chosen to represent the environmental expectation output.
(3) Undesirable output indicators: carbon dioxide is a direct manifestation of the negative externalities of urban economic activities on the environment (Lu et al., 2022), so this paper measures the total land use carbon emissions of each city by adding up the carbon emissions generated from electricity, gas and LPG, IPCC2006 emission coefficient is used to calculate the CO2 emissions of direct energy such as natural gas and liquefied petroleum gas. For the CO2 consumed by electricity, due to its complexity, referring to the calculation method of power CO2 emissions of (Wu and Guo, 2016) and (Zeng et al., 2022), that is, the power grid of each region uses the emission coefficient of the corresponding region, and the CO2 emissions generated by electricity use in the YREB can be calculated according to the baseline emission coefficient of the power grid of the region over the years and the electricity consumption of each region. The calculation formula of CO2 emissions is shown in the follow equation:
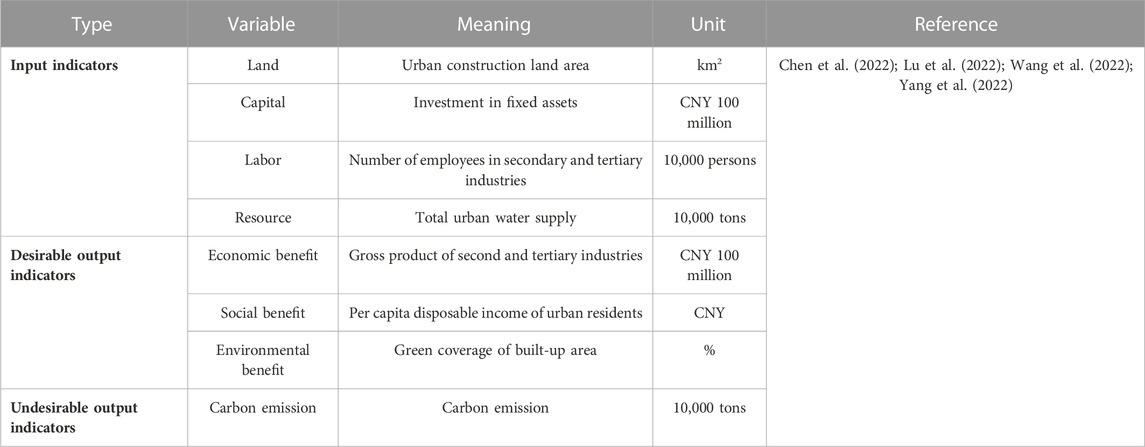
TABLE 1. ULUE index system.
CO2 represents the sum of CO2 emissions generated by multiple energy resources; CEi represents the CO2 emissions of the i-th energy resources, and n represents the type of energy; Ei represents the consumption of energy i, and EFi represents the emission factor of energy i.
This study analyzes the ULUE of 107 cities in the YREB of China. The data required in this paper are obtained from public information sources such as the China Urban Statistical Yearbook, China Urban Construction Statistical Yearbook, China Energy Statistical Yearbook and the statistical yearbooks of provinces and cities from 2006 to 2020, and the few missing data are estimated by linear interpolation.
In order to effectively measure the ULUE level of the YREB and demonstrate its spatio-temporal evolution characteristics, SBM-UN, KDE, ESDA, Standard evolutionary ellipse are used in the study, as shown in Figure 2 below:
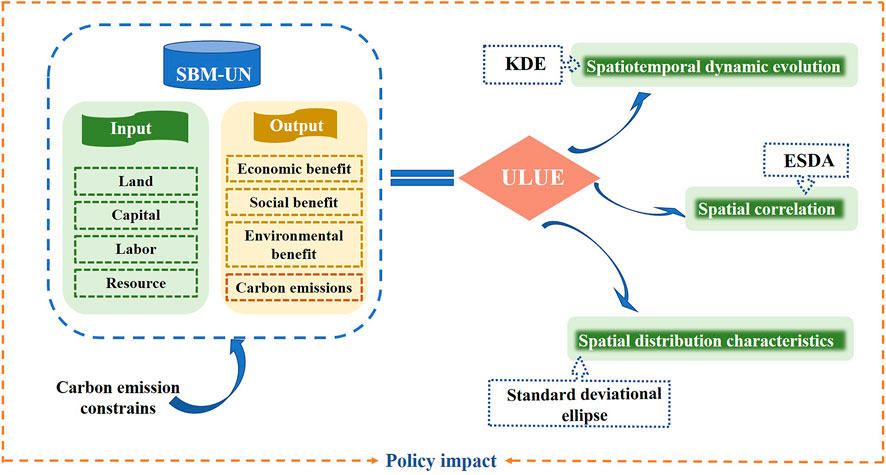
FIGURE 2. Workflow chart of ULUE research in the YREB.
DEA, which is a non-parametric frontier approach, has become a mainstream technical tool for assessing efficiency due to its many advantages such as no prior determination of functional relationships, non-subjective weighting, and reduced bias in efficiency measurement. The traditional DEA model doesn’t consider input or output slack, so Tone (2001) proposed a slack-based measure (SBM) model based on non-radial and non-angular, which integrates the input and output of each decision-making unit, and put slack variables directly into the objective function, thus solving the problem of input-output slack. However, undesirable outputs such as the negative impact of urban land use on the environment are not considered. Based on this, we adopt the SBM-UN model, which takes into account the unexpected outputs, so as to measure the ULUE of the YREB under the dual constraints of energy and environment more accurately.
The principle is as follows: each city is considered as a Decision Making Unit (DMU), and each DMU has an input vector, denoted as x ∈ Rm and two output vectors: desired and undesired outputs, denoted as Yg∈Rs1 and yb∈Rs2. Define the following matrix: X = [x1, x2, ⋯, xn] ∈Rm×n, Yg = [y1g, y2g, ⋯, yng] ∈ Rs1×n, Yb = [y1b, y2b, ⋯, ynb] ∈ Rs2×n. Based on the input and output realities, assuming xi> 0, yig> 0, yib> 0, the set of production possibilities p, i.e., all combinations of desired and undesired outputs produced by N factor inputs x, can be defined as:
According to this definition, the SBM-UN model is defined as follows.
In Eqs 3, 4,
Kernel density estimation is a non-parametric method for estimating probability density function of random variables with kernel as weight. It can intuitively describe the time dynamic evolution characteristics of variables, and can also avoid errors caused by improper assumptions about the data form, thus making the estimation results more fitting and robust (Tan et al., 2021). Considering this advantage, combined with the data type and content of this study, it is feasible to use kernel density estimation to characterize urban land use efficiency in the YREB. Therefore, this paper uses the ULUE value to analyze the dynamic distribution characteristics of ULUE in the Yangtze River Economic Belt in 2006, 2009, 2012, 2015, 2018, and 2020 from the overall and three major regions (upstream, midstream, and downstream). The formula is as follows.
In Eq. 5:
Exploratory spatial data analysis (ESDA) method is a collection of spatial data analysis techniques and methods. It is used to describe the spatial distribution patterns of data and represent them visually, identify outliers in spatial data, detect the spatial clustering effects of certain phenomena, explore the spatial structure of data, and reveal the spatial interaction mechanisms between phenomena (Messner et al., 1999). Spatial autocorrelation analysis is one of the core elements of ESDA technique and is often performed by Moran’s I. Moran’s I is further divided into global Moran’s I and local Moran’s I. The global Moran’s I is used to evaluate whether the ULUE level is relevant or random. If I value is greater than 0, the ULUE level is positively correlated in space; If I value is less than 0, ULUE level is negatively correlated in space; If I value is equal to 0, it is a random distribution. In addition, the study uses the local Moran’s I to reveal whether there is a significant difference between the ULUE level of a region and its surrounding ULUE levels, to analyze the local agglomeration characteristics of the ULUE level of the YREB, and thus obtain the cold and hot spots of the ULUE level. The specific formula is as follows.
(1) Global Moran’s I
In Eq. 7,
The significance level of Moran’s I was tested with the statistic
In Eq. 8:
(2) Local Moran’s I
In Eq. 9,
The standard deviational ellipse model is an analytical method proposed by Lefever (1926) to precisely portray the spatial distribution characteristics of the study object, which mainly includes the basic elements such as center of gravity, long and short axes, and azimuth. The center of gravity represents the main spatial location of the elements, which usually coincides roughly with the location of the arithmetic mean. The long axis indicates the direction of data distribution, while the short axis indicates the range of data distribution. The azimuth reflects the trend direction of the distribution of the study object. This paper applies this method to present the distribution pattern and evolution of ULUE in the YREB, as follows.
(1) Center of gravity coordinates
(2) Azimuth
(3) x-axis standard deviation, y-axis standard deviation
x-axis standard deviation:
y-axis standard deviation:
where
Figure 3A shows the ULUE kernel density curve of the whole YREB in 2006, 2009, 2012, 2015, 2018, and 2020. It can be seen from the shape that during the study period, the ULUE of YREB is basically double peaked, with the main peak on the left and the secondary peak on the right. It means that more regions are concentrated at the middle and low levels, while a few regions are concentrated at the high levels. In terms of location, from 2006 to 2018, the peaks were similar, with a slight downward trend, and mainly concentrated in the area of .5 on the right side of the X-axis. In 2020, the peak shifted significantly to the left, the main peak increased significantly, and the level of ULUE decreased significantly. From the point of distribution form, from 2006 to 2018, the distribution was “flat” with a large gap between regions. ULUE was mostly at a medium level and showed a slow upward trend. The possible reason is that the 18th National Congress of the Communist Party of China has integrated the concept of ecological civilization into urban construction and promoted the coordinated development of social and economic development and environmental protection, thus optimizing urban industrial institutions and improving the efficiency of urban land use. In 2020, the gap between the two peaks widened, and the regional gap narrowed, but the level of ULUE significantly decreased. The width of the main peak changed from “slightly widened” to “substantially narrowed” in 2020, indicating that the regional difference of the overall ULUE in the YREB increased slightly from 2006 to 2018, and then narrowed rapidly. The level of ULUE was gradually dispersed but it is extremely sensitive to external changes. The epidemic caused ULUE to become concentrated.
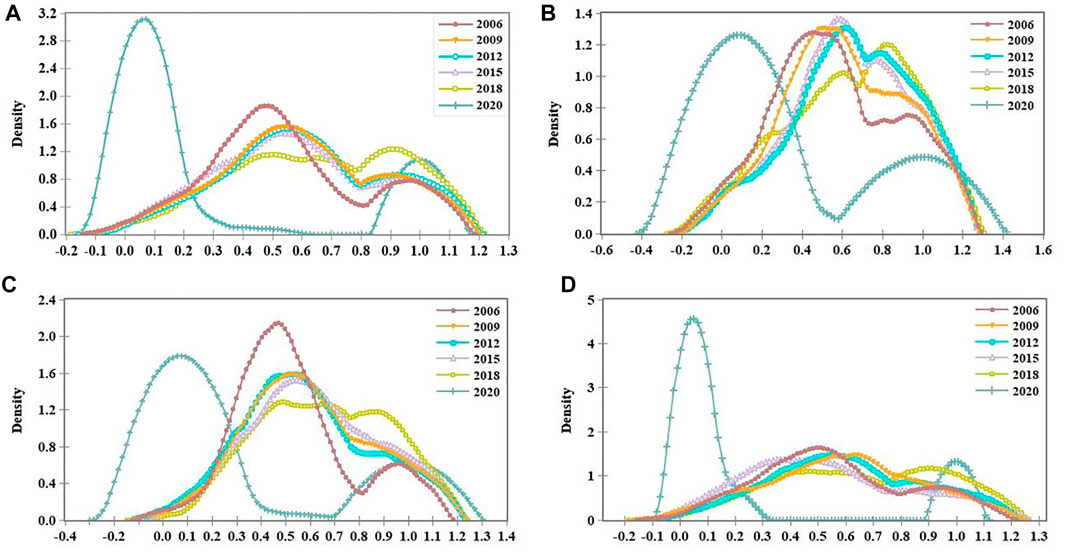
FIGURE 3. Kernel density distribution of ULUE in the YREB, (A) The whole YREB, (B) The upstream area, (C) The midstream area, (D) The downstream area.
Figures 3B–D, show the distribution dynamics of the upstream, midstream and downstream of the YREB. It can be seen that there are great differences in the kernel density curves of ULUE in the three regions. Specifically, the peak in the upstream of the YREB has experienced a process of shifting to the right first and then to the left. The ULUE first increased and then decreased. The peak height was relatively consistent, and the difference in the level of land use efficiency among cities in the upstream area was basically stable during the study period. The ULUE in the midstream also increased first and then decreased, but for the urban difference, there was a relatively obvious fluctuation in the midstream, and the difference between cities first expanded and then gradually narrowed. In the downstream, the change was relatively stable from 2006 to 2018. With the peak slowly moving to the right and gradually decreasing, the gap of ULUE between cities was widening, but the efficiency value showed an upward trend. However, in 2020, the peak shifted to the left and significantly increased, and the efficiency value decreased, and the urban difference was sharply reduced.
In order to more clearly observe the change trend of ULUE in each city from 2006 to 2020, the ULUE hotspot maps of 107 cities in the study sample from 2006 to 2020 were drawn (Figure 4). As can be seen from the figures, the relatively shallow color blocks accounted for a large proportion, indicating that the ULUE of most cities in the YREB was at a medium level of about .3–.7 during the study period. With the proposal of the development strategy of the YREB, various regions actively promote the optimization and upgrading of the urban industrial structure, and the level of ULUE fluctuates and rises over time, and then drops sharply in 2020. ULUE in most cities, except Lincang, Lijiang, Dazhou, Baoshan, Bazhong, Zhoushan, Wuhu, Shanghai, Changsha, Zhangjiajie, and so on, all dropped below .2 in 2020. For example, Wuhan began to improve gradually after a long period of low efficiency, and its ULUE reached 1 in 2019, while it was less than .1 in 2020. This may be mainly due to the impact of the COVID-19 epidemic, which made the developed land resources unable to play an effective value. In 2020, the sudden COVID-19 hit the social and economic development of many cities represented by Wuhan heavily, making the land, human resources, capital and other resources not effectively used, and reducing the output of economic and social benefits, thus greatly reducing the efficiency of land use. This also warns relevant departments to strengthen their ability to deal with sudden crises, improve predictability, adapt to the situation and formulate reasonable countermeasures.
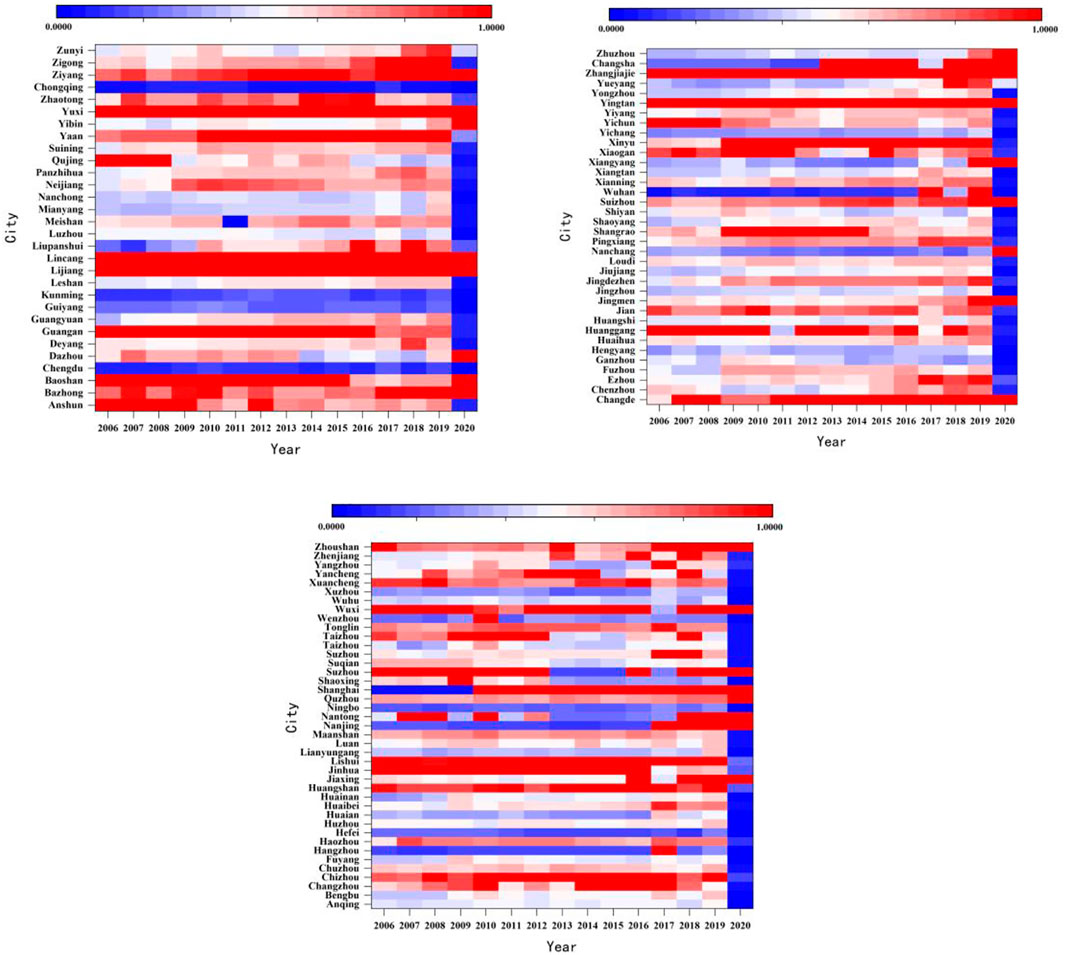
FIGURE 4. The hot spot maps of ULUE in the YREB.
In this study, ULUE in the YREB were equally divided into five categories, and visualized by ArcGIS software (Figures 5A–F). As can be seen from the figure, from 2006 to 2018, cities with ULUE higher than .8 and lower than .2 were scattered and interlaced in the upstream, midstream and downstream areas, which indicated that the overall level of ULUE in the three areas was relatively balanced. Cities with efficiency values less than .2 are mainly distributed in the upstream and downstream, and only Changsha and Wuhan have efficiency values less than .2 in the midstream. The polarization phenomenon in the midstream is relatively the weakest. Provincial capital cities, such as Changsha, Hefei, Nanjing, Nanchang, Guiyang, Kunming and other places, generally had ULUE in the level range of 0–.2 and .2–.4. Provincial capital cities are political, economic and cultural centers and key areas for development. However, in the process of development, disorder and excess lead to serious waste of resources, which leads to low ULUE level. In 2020, ULUE levels were generally low, mainly due to the impact of COVID-19.
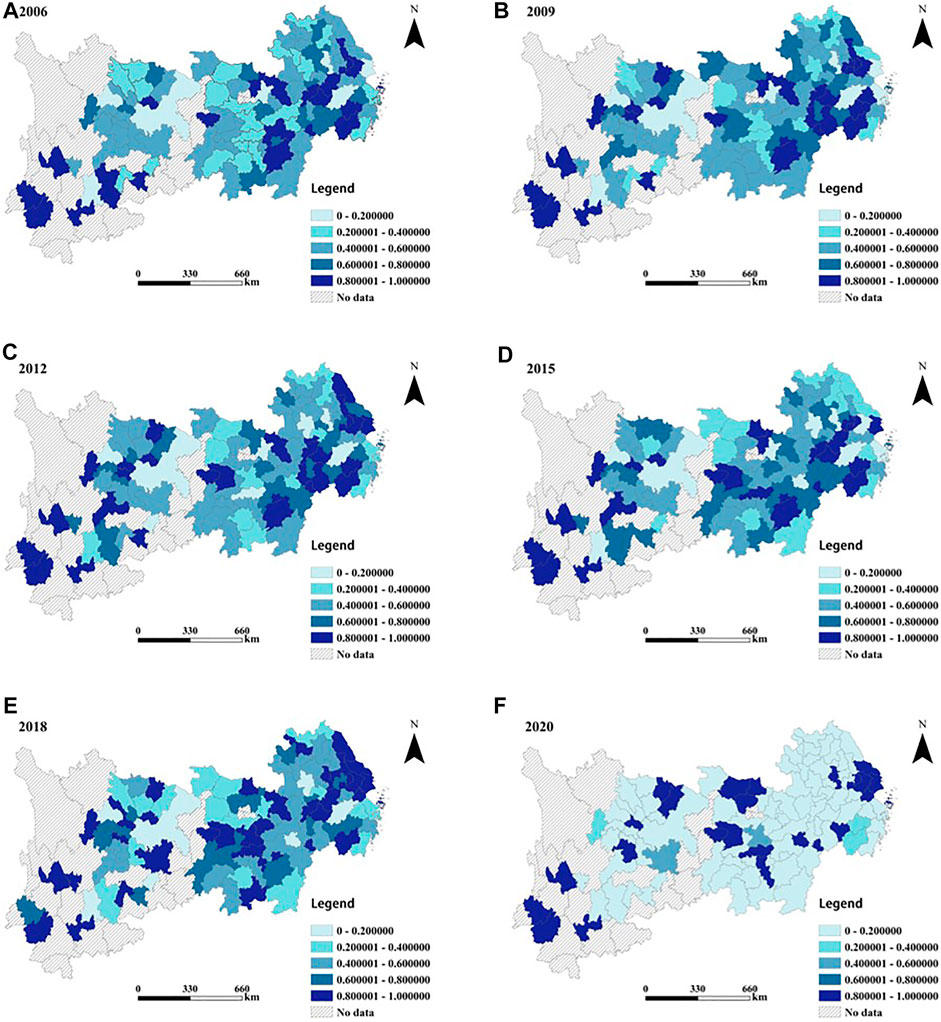
FIGURE 5. Evolution of ULUE in the YREB (A–F) represents the ULUE levels of the YREB in 2006, 2009, 2012, 5015, 2018, and 2020, respectively.
In order to explore the spatial correlation of ULUE in the YREB, ArcGIS was used to calculate the global Moran’s I (Table 2). It can be found that in 15 years, the value of the Moran’s I showed staggered distribution of positive and negative phases, and none of them was 0. However, only the Moran’s I in 2010 and 2020 passed the significance test, and the other years failed. It indicates that there was no significant interaction and spillover effect between ULUE of a city and ULUE of neighboring cities in the YREB except in 2010 and 2020, and the spatial relationship was randomly distributed. The correlations between 2010 and 2020 were significant at the level of 5%, and both were positive, indicating that ULUE in the YREB had positive spatial correlation in these 2 years.
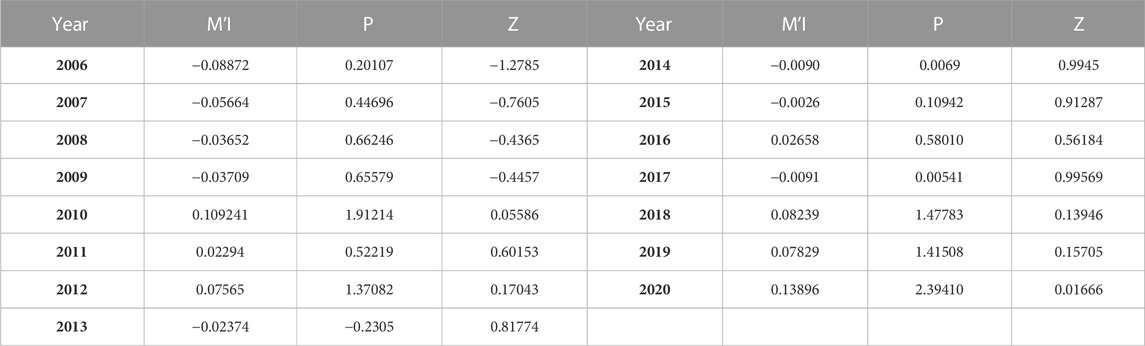
TABLE 2. ULUE global Moran’s I value of the YREB.
Based on the above-mentioned global spatial autocorrelation analysis, we can only see the global spatial correlation characteristics of ULUE in the YREB. In order to further explore and analyze the local spatial pattern of ULUE, and identify the four agglomeration modes of high-high (H-H), low-low (L-L), high-low (H-L), and low-high (L-H) in 107 samples studied in the YREB, the study used ArcGIS to draw local spatial agglomeration maps of ULUE in the YREB in 2006, 2009, 2012, 2015, 2018, and 2020 (Figure 6). In 2006, only H-L and L-H agglomeration modes existed in the study area, which were respectively distributed in Chuzhou, Anshun, Qujing, Yuxi, Panzhihua, Kunming, Liupanshui, Anqing, Hangzhou, Shanghai, and Wenzhou. From 2009 to 2018, H-L and L-H areas were reduced, and some H-H and L-L clustering areas appeared in Shanghai, Quzhou, Xianning, Suqian, etc. The clustering areas were unstable and constantly changing over time. In 2020, the number of agglomeration areas increased significantly, with L-H agglomeration accounting for the largest proportion. In general, the local spatial correlation of ULUE in the YREB was characterized by “small aggregation range and unstable location.” In 2020, a large range of L-L agglomeration areas appeared in the northeast of the YREB. In the subsequent development of these cities, the use of urban construction land should be strictly controlled, and the ability to resist risks should be improved to promote their transformation to H-H agglomeration.
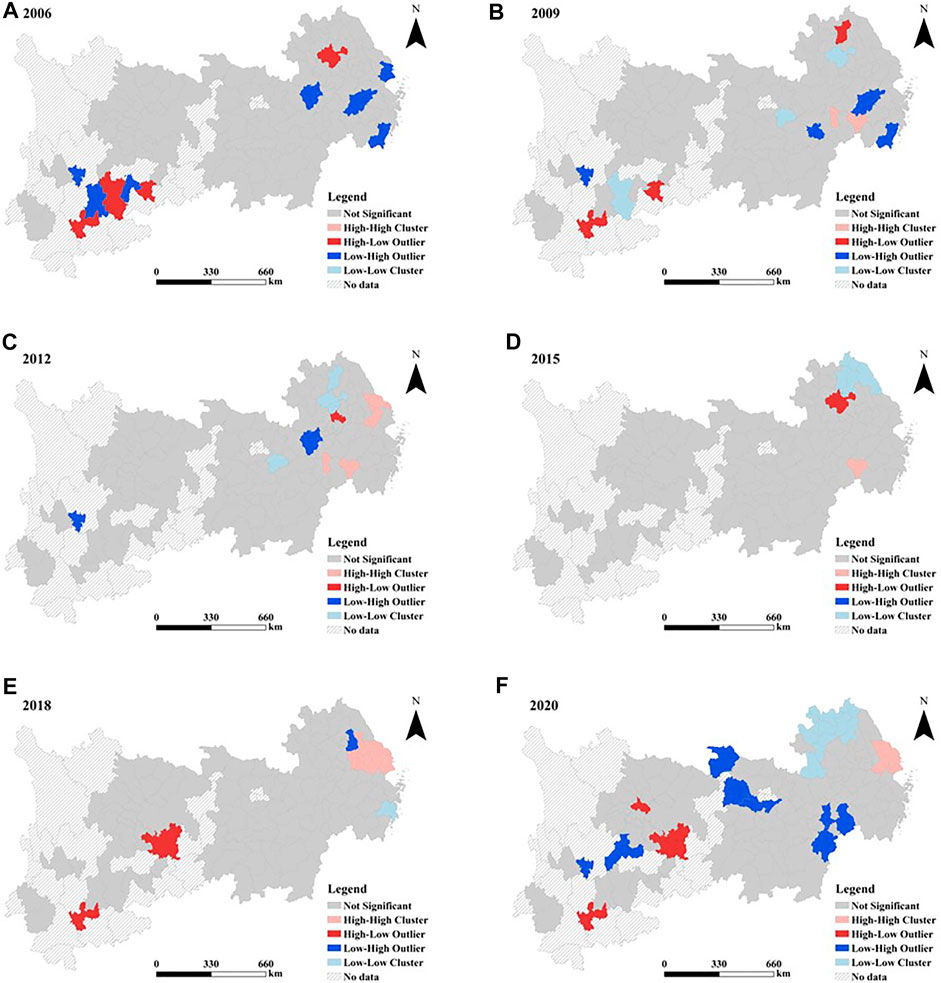
FIGURE 6. Local spatial agglomeration map of ULUE in the YREB (A–F) represents the local correlation of ULUE of YREB in 2006, 2009, 2012, 2015, 2018, and 2020, respectively.
In this study, ArcGIS10.6 was used to make the ULUE standard deviation elliptic graph of the YREB in 2006, 2009, 2012, 2015, 2018, and 2020 (Figure 7), from which it can be seen that the long axis was always larger than the short axis, showing an obvious distribution pattern of “northeast-southwest.” To be specific, the azimuth θ of ULUE in the YREB was always around 72° and 73°, and the variation range was less than 1°, which indicated that the center of gravity of ULUE in the YREB was relatively stable, and it basically moved around a straight line. During the study period, the distribution range of standard deviation ellipse showed a trend of decreasing fluctuation, and tended to be concentrated in spatial distribution. The fluctuation of the long axis increased, while the short axis gradually decreased, and the north-south direction gradually tended to be balanced.
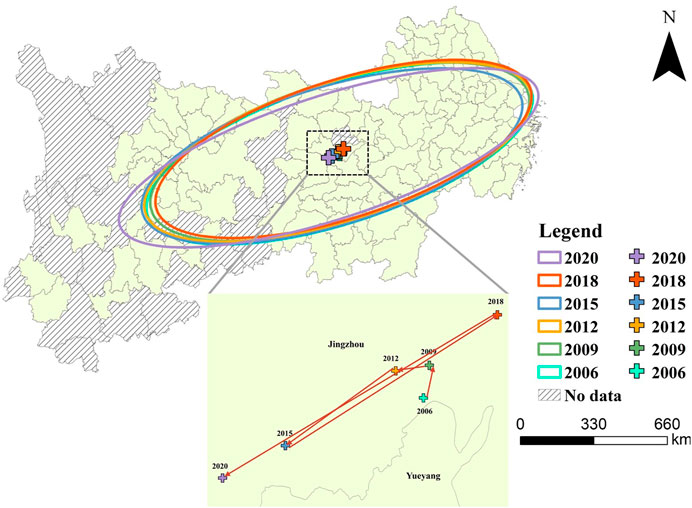
FIGURE 7. Diagram of standard deviation ellipse and center of gravity trajectory of ULUE in the YREB.
From the perspective of the distribution of the center of gravity, from 2006 to 2020, the center of gravity was always located in Jingzhou, with a slight deviation during the period. The center of gravity reflects the spatial distribution center of the ULUE level. The shift of the center of gravity means that the urban land use efficiency has changed to varying degrees between regions. The shift of the center of gravity to the right means that the improvement degree of the right region is higher than that of the left region. The moving path can be roughly divided into four stages: the first stage was from 2006 to 2009, when the center of gravity shifted slightly to the north, with a moving distance of about 7.9 km; In the second stage, the center of gravity shifted about 40.3 km to the southwest from 2009 to 2015; The third stage is from 2015 to 2018, with the center of gravity shifting about 60.8 km to the northeast; In the fourth stage, from 2018 to 2020, the center of gravity shifted to the southwest by a large margin, with an offset distance of 77.7 km. The shift direction of the center of gravity was extremely unstable during the study period, which indicated that the improvement amplitude of ULUE level in the YREB was quite different. For example, from 2006 to 2009, the improvement increment of ULUE in the northeast region was slightly larger than that in the southwest region, while from 2018 to 2020, the improvement increment of ULUE in the southwest region was significantly higher than that in the northeast region. On the whole, the ULUE center of gravity in the YREB shifted to the southwest during 2006–2020, and finally shifted to the southwest by about 52.7 km, indicating that the ULUE level of southwestern cities in the YREB was generally in a state of improvement. The reason may be that many cities in southwest China, such as Kunming and Lijiang, have unique natural and cultural advantages. For example, Yulong Snow Mountain in Lijiang and Kunming, which is known as the “Spring City,” etc. In recent years, relying on these advantages, they have vigorously developed tourism, which not only reduces the dependence of urban development on construction land investment, but also attracts a large number of tourists, significantly increasing the regional GDP. At the same time, the tourism industry is widely considered as a “smokeless industry,” with relatively low environmental pressure. All of the above have improved the level of ULUE.
ULUE reflects the balance of economy, society and environment in the process of realizing land use, and plays a key role in achieving the sustainable development goals of the land sector (Gao et al., 2017). When formulating land use policies, it is encouraged to choose different development models according to different environments and development levels in different regions (Sun et al., 2018), and adjust and optimize specific implementation policies over time (Bryan et al., 2018). Therefore, this study compared and analyzed the ULUE of different regions in recent 15 years, to help each region reasonably analyze its advantages and disadvantages, and according to historical experience, formulate ULUE promotion strategies that conform to the actual situation of the region, and ultimately achieve the sustainable development of the whole region.
First of all, in terms of calculation method, this study uses SBM-UN model considering unexpected output, which is different from the previous literature that used SFA or traditional DEA model to calculate ULUE (Cui et al., 2019; Lu et al., 2022). At the same time, in the selection of indicators, this study includes the negative externalities generated in the process of urban land use into the evaluation system, measure the efficiency of urban land use under the constraint of carbon emissions, and regard carbon emissions as unexpected output, so that the evaluation results are more comprehensive and accurate.
Second, from the perspective of development level, the ULUE of most cities in the YREB from 2006 to 2020 was at a medium level. It is worth noting that most cities generally have low ULUE levels in 2020, which may be affected by the impact of the COVID-19 break. Cities have always been the center of the COVID-19 outbreak (Sharifi & Khavarian-Garmsir, 2020). In order to prevent and control the COVID-19 epidemic, countries have increased the restrictions on population mobility, which has severely affected the secondary and tertiary industries, resulting in short-term basic stagnation of manufacturing and infrastructure investment, reduced GDP and increased unemployment rate. The impact on urban land use is huge (Corazza et al., 2021). Therefore, how to correctly deal with the impact of public crisis events on urban land use and management is particularly important for the future sustainable development of cities.
Thirdly, from the perspective of spatial pattern, there are great differences in the land use efficiency of cities in the YREB, and more cities are at the medium level of efficiency. In previous studies, Lu et al. (2022) found that the ULUE of the three major urban agglomerations in China kept improving, but there was obvious spatial imbalance. This finding is similar to the results of this study. Therefore, the implementation of regional coordinated development is an effective measure to improve the efficiency of urban land use in the YREB, which is consistent with the new regionalism principle of promoting regional integration and coordinated development proposed by Ethier (1998). In addition, we found that the provincial capitals, such as Hefei, Nanjing, and Guiyang, are generally located in the low level of ULUE. However, Yang et al. (2022) found that a high level of economic development was correlated with ULUE. The ULUE of central cities in the Yangtze River Delta in China remained high throughout the study period, which was contrary to the results of this study. The reason may be that the disorderly and excessive development of provincial capitals leads to the waste of resources and serious environmental pollution, which leads to the low level of ULUE. This proves that the land use of each city is different, so we believe that local governments can optimize the land use mode according to local conditions.
Based on the above analysis, this study proposed the following suggestions for policymakers to take transformative action.
Firstly, the government needs to consider the impact of public crisis events when planning urban land. For example, facilities such as parks, water bodies and emergency shelters can be added, and multi-level decentralized treatment of urban open space can be considered. We should be cautious about the development of high-rise modular building projects and moderately control the capacity of high-density residential areas. The impact on vulnerable areas and groups should be avoided or reduced in advance by making full use of space for time.
Secondly, rationally control the expansion scale of urban land and promote the intensive use of urban land. The rapid expansion of urban built-up areas will inhibit the efficiency of urban land use. Therefore, the central government should make an overall plan to control the scale of big cities in the YREB, reasonably develop medium cities and actively develop small towns (Mengbai, 1987). All regions should actively optimize the land use structure, ensure urban green space, reduce land used by high-pollution industries, and increase the proportion of land used for tertiary and high-tech industries.
Finally, break through the administrative barrier boundary and implement the regional urban land use coordinated development strategy. According to the previous analysis, the spatial spillover and interaction effect of ULUE in the YREB are not strong, which directly lead to the spatial imbalance of ULUE in the YREB. With the improvement of the transportation infrastructure, the central and the governments at all levels should take the YREB as a whole, and coordinate the layout of urban land use in the eastern, central and western regions, to break the administrative barriers and market boundaries, to promote the free flow of capital, technology, labor and efficient configuration, form downstream with the middle and upper middle belt pattern of land use efficiency.
In this paper, the SBM-UN model was used to measure the ULUE in the YREB from 2006 to 2020, and the spatial-temporal evolution trend was analyzed through kernel density and spatial autocorrelation calculation, etc., and the following conclusions were obtained: 1) ULUE varies greatly across the YREB. Since 2006, except for 2020, which showed a low level of low difference, ULUE showed an increasingly discrete trend, with the inter-city difference expanding slowly, and the overall level of ULUE increased slightly. The evolution dynamics of ULUE in the upstream, midstream and downstream were different. The density of ULUE was the highest in the median area, and the difference between cities was upstream > midstream > downstream, and the midstream was similar to the downstream, which had a great relationship with the most significant difference of urban development level in the upstream region. 2) Due to the COVID-19 epidemic, the ULUE level of most cities in the YREB decreased sharply in 2020, especially in large and medium-sized cities such as Changsha, Wuhan, and Nanjing. In addition, the ULUE level of all places showed a trend of fluctuation and rise from 2006 to 2018. 3) From the perspective of spatial distribution, the regional distribution of different levels of development was relatively scattered. What needs special attention is that the ULUE level of cities with high level of economic development, such as Chongqing, Chengdu, Kunming, and Guiyang, is relatively low. There were unreasonable input-output structure, resource waste and serious environmental pollution in these areas. 4) From the perspective of spatial correlation, the global spatial correlation was only significant in 2010 and 2020, but it was weak. The local spatial correlation showed a trend of weakening at first and then strengthening. The agglomeration areas were mainly concentrated in some upstream and downstream areas, and the scope of agglomeration area was small. On the whole, the spatial relationship of ULUE was relatively loose, and the spillover and interaction effects were weak. 5) From the point of space track, the standard deviation ellipse distribution gradually flattened, ULUE north-south difference abated, and the center of gravity moving trajectory was stable, but the direction was changeable, and eventually the southwest direction was substantially offset. Throughout the study period, southwest ULUE ascension increment was significantly higher than the northeast, further showing the level of urban development and structure optimization of ULUE boost.
The original contributions presented in the study are included in the article/supplementary material, further inquiries can be directed to the corresponding authors.
LP conceived and designed the study. QY completed the results analysis and summary. GG and XW were responsible for data collection and sorting, while CJ and GH calculated the collected data and made charts. HT checked the research manuscript and proposed amendments.
This research was financially supported by the National Natural Science Foundation of China (Grant No. 41871083; Grant No. 42171245).
The authors declare that the research was conducted in the absence of any commercial or financial relationships that could be construed as a potential conflict of interest.
All claims expressed in this article are solely those of the authors and do not necessarily represent those of their affiliated organizations, or those of the publisher, the editors and the reviewers. Any product that may be evaluated in this article, or claim that may be made by its manufacturer, is not guaranteed or endorsed by the publisher.
Bian, H., Gao, J., Wu, J., Sun, X., and Du, Y. (2021). Hierarchical analysis of landscape urbanization and its impacts on regional sustainability: A case study of the Yangtze River Economic belt of China. J. Clean. Prod. 279–123267. doi:10.1016/j.jclepro.2020.123267
Bobylev, N. (2009). Mainstreaming sustainable development into a city's master plan: A case of urban underground space use. Land Use Policy 26 (4), 1128–1137. doi:10.1016/j.landusepol.2009.02.003
Bryan, B. A., Gao, L., Ye, Y., Sun, X., Connor, J. D., Crossman, N. D., et al. (2018). China’s response to a national land-system sustainability emergency. Nature 559 (7713), 193–204. doi:10.1038/s41586-018-0280-2
Carpio, A., Ponce-Lopez, R., and Lozano-García, D. F. (2021). Urban form, land use, and cover change and their impact on carbon emissions in the Monterrey Metropolitan area, Mexico. Urban Clim. 39–100947. doi:10.1016/j.uclim.2021.100947
Charnes, A., Cooper, W. W., and Rhodes, E. (1978). Measuring the efficiency of decision making units. Eur. J. Operational Res. 2 (6), 429–444. doi:10.1016/0377-2217(78)90138-8
Chen, H., Meng, C., and Cao, Q. (2022a). Measurement and influencing factors of low carbon urban land use efficiency—based on non-radial directional distance function. Land 11 (7), 1052. doi:10.3390/land11071052
Chen, M., Wang, Q., Bai, Z., Shi, Z., Meng, P., and Hao, M. (2022b). Green land use efficiency and influencing factors of resource-based cities in the Yellow River Basin under carbon emission constraints. Buildings 12 (5), 551. doi:10.3390/buildings12050551
Chen, S., Liu, Y., and Chen, C. (2007). Evaluation of land-use efficiency based on regional scale: —a case study in Zhanjiang, guangdong province. J. China Univ. Min. Technol. 17 (2), 215–219. doi:10.1016/S1006-1266(07)60075-3
Corazza, M. V., Moretti, L., Forestieri, G., and Galiano, G. (2021). Chronicles from the new normal: Urban planning, mobility and land-use management in the face of the COVID-19 crisis. Transp. Res. Interdiscip. Perspect. 12–100503. doi:10.1016/j.trip.2021.100503
Cui, X., Fang, C., Wang, Z., and Bao, C. (2019). Spatial relationship of high-speed transportation construction and land-use efficiency and its mechanism: Case study of Shandong Peninsula urban agglomeration. J. Geogr. Sci. 29 (4), 549–562. doi:10.1007/s11442-019-1614-1
Deng, S. (2021). Exploring the relationship between new-type urbanization and sustainable urban land use: Evidence from prefecture-level cities in China. Sustain. Comput. Inf. Syst. 30–100446. doi:10.1016/j.suscom.2020.100446
Dong, Y., Jin, G., and Deng, X. (2020). Dynamic interactive effects of urban land-use efficiency, industrial transformation, and carbon emissions. J. Clean. Prod. 270–122547. doi:10.1016/j.jclepro.2020.122547
Ethier, W. J. (1998). The new regionalism. Econ. J. 108 (449), 1149–1161. doi:10.1111/1468-0297.00335
Gao, J., Song, J., and Wu, L. (2022). A new methodology to measure the urban construction land-use efficiency based on the two-stage DEA model. Land Use Policy 112–105799. doi:10.1016/j.landusepol.2021.105799
Gao, L., and Bryan, B. A. (2017). Finding pathways to national-scale land-sector sustainability. Nature 544 (7649), 217–222. doi:10.1038/nature21694
Gao, X., Zhang, A., and Sun, Z. (2020). How regional economic integration influence on urban land use efficiency? A case study of Wuhan metropolitan area, China? A case study of Wuhan metropolitan area, China. Land Use Policy 90–104329. doi:10.1016/j.landusepol.2019.104329
Huang, Z., He, C., and Wei, Y. H. D. (2016). A comparative study of land efficiency of electronics firms located within and outside development zones in Shanghai. Habitat Int. 56, 63–73. doi:10.1016/j.habitatint.2016.04.007
Kityuttachai, K., Tripathi, N. K., Tipdecho, T., and Shrestha, R. (2013). CA-markov analysis of constrained coastal urban growth modeling: Hua hin seaside city, Thailand. Sustainability 5 (4), 1480–1500. doi:10.3390/su5041480
Lefever, D. W. (1926). Measuring geographic concentration by means of the standard deviational ellipse. Am. J. Sociol. 32 (1), 88–94. doi:10.1086/214027
Li, Y., Liu, Y., Long, H., and Cui, W. (2014). Community-based rural residential land consolidation and allocation can help to revitalize hollowed villages in traditional agricultural areas of China: Evidence from Dancheng County, Henan Province. Land Use Policy 39, 188–198. doi:10.1016/j.landusepol.2014.02.016
Liu, S., Xiao, W., Li, L., Ye, Y., and Song, X. (2020). Urban land use efficiency and improvement potential in China: A stochastic frontier analysis. Land Use Policy 99–105046. doi:10.1016/j.landusepol.2020.105046
Long, H., and Qu, Y. (2018). Land use transitions and land management: A mutual feedback perspective. Land Use Policy 74, 111–120. doi:10.1016/j.landusepol.2017.03.021
Lu, X., Shi, Z., Li, J., Dong, J., Song, M., and Hou, J. (2022). Research on the impact of factor flow on urban land use efficiency from the perspective of urbanization. Land 11 (3), 389. doi:10.3390/land11030389
Lu, X., Zhang, Y., Li, J., and Duan, K. (2022). Measuring the urban land use efficiency of three urban agglomerations in China under carbon emissions. Environ. Sci. Pollut. Res. 29 (24), 36443–36474. doi:10.1007/s11356-021-18124-8
Meng, Y., Wang, K., and Lin, Y. (2021). The role of land use transition on industrial pollution reduction in the context of innovation-driven: The case of 30 provinces in China. Land 10 (4), 353. doi:10.3390/land10040353
Mengbai, L. (1987). The proper interpretation and implementation of the basic policy in China's urban development. Chin. Sociol. Anthropol. 19 (3-4), 101–116. doi:10.2753/CSA0009-4625190304101
Messner, S. F., Anselin, L., Baller, R. D., Hawkins, D. F., Deane, G., and Tolnay, S. E. (1999). The spatial patterning of county homicide rates: An application of exploratory spatial data analysis. J. Quantitative Criminol. 15 (4), 423–450. doi:10.1023/A:1007544208712
Pan, L., Yu, J., and Lin, L. (2022). The temporal and spatial pattern evolution of land-use carbon emissions in China coastal regions and its response to green economic development. Front. Environ. Sci. 1654. doi:10.3389/fenvs.2022.1018372
Sharifi, A., and Khavarian-Garmsir, A. R. (2020). The COVID-19 pandemic: Impacts on cities and major lessons for urban planning, design, and management. Sci. Total Environ. 749–142391. doi:10.1016/j.scitotenv.2020.142391
Song, X., Feng, Q., Xia, F., Li, X., and Scheffran, J. (2021). Impacts of changing urban land-use structure on sustainable city growth in China: A population-density dynamics perspective. Habitat Int. 107–102296. doi:10.1016/j.habitatint.2020.102296
Sun, M., Wang, J., and He, K. (2020). Analysis on the urban land resources carrying capacity during urbanization——a case study of Chinese YRD. Appl. Geogr. 116–102170. doi:10.1016/j.apgeog.2020.102170
Sun, X., Gao, L., Ren, H., Ye, Y., Li, A., Stafford-Smith, M., et al. (2018). China’s progress towards sustainable land development and ecological civilization. Landsc. Ecol. 33, 1647–1653. doi:10.1007/s10980-018-0706-0
Tan, S., Hu, B., Kuang, B., and Zhou, M. (2021). Regional differences and dynamic evolution of urban land green use efficiency within the Yangtze River Delta, China. Land Use Policy 106–105449. doi:10.1016/j.landusepol.2021.105449
Tone, K. (2001). A slacks-based measure of efficiency in data envelopment analysis. Eur. J. Operational Res. 130 (3), 498–509. doi:10.1016/S0377-2217(99)00407-5
Wang, G., Han, Q., and de vries, B. (2021). The multi-objective spatial optimization of urban land use based on low-carbon city planning. Ecol. Indic. 125–107540. doi:10.1016/j.ecolind.2021.107540
Wang, Y., Chai, J., Zhang, H., and Yang, B. (2022). Evaluating construction land use efficiency under carbon emission constraints: A comparative study of China and the USA. Environ. Sci. Pollut. Res. 29 (33), 49998–50009. doi:10.1007/s11356-022-19475-6
Wei, J., Ding, Z., Meng, Y., and Li, Q. (2020). Regional sustainable assessment at city level based on CSDIS (China sustainable development indicator system) concept in the new era, China. Chin. Geogr. Sci. 30 (6), 976–992. doi:10.1007/s11769-020-1158-4
Wu, J., and Guo, Z. (2016). Research on the convergence of carbon dioxide emissions in China: A continuous dynamic distribution approach. Stat. Res. 33, 54–60.
Xiao, Y., Zhong, J.-L., Zhang, Q.-F., Xiang, X., and Huang, H. (2022). Exploring the coupling coordination and key factors between urbanization and land use efficiency in ecologically sensitive areas: A case study of the loess plateau, China. Sustain. Cities Soc. 86–104148. doi:10.1016/j.scs.2022.104148
Xie, H., and Wang, W. (2015). Spatiotemporal differences and convergence of urban industrial land use efficiency for China’s major economic zones. J. Geogr. Sci. 25 (10), 1183–1198. doi:10.1007/s11442-015-1227-2
Xue, D., Yue, L., Ahmad, F., Draz, M. U., Chandio, A. A., Ahmad, M., et al. (2022). Empirical investigation of urban land use efficiency and influencing factors of the Yellow River basin Chinese cities. Land Use Policy 117–106117. doi:10.1016/j.landusepol.2022.106117
Yang, Q., Wang, L., Qin, X., Fan, Y., Wang, Y., and Ding, L. (2022). Urban land use efficiency and contributing factors in the Yangtze River Delta under increasing environmental restrictions in China. Chin. Geogr. Sci. 32 (5), 883–895. doi:10.1007/s11769-022-1306-0
Yuan, J., Bian, Z., Yan, Q., and Pan, Y. (2019). Spatio-temporal distributions of the land use efficiency coupling coordination degree in mining cities of western China. Sustainability 11 (19), 5288. doi:10.3390/su11195288
Zeng, H., Shao, B., Bian, G., Dai, H., and Zhou, F. (2022). Analysis of influencing factors and trend forecast of CO2 emission in chengdu-chongqing urban agglomeration. Sustainability 14 (3), 1167. doi:10.3390/su14031167
Zhang, H., Chen, M., and Liang, C. (2022). Urbanization of county in China: Spatial patterns and influencing factors. J. Geogr. Sci. 32 (7), 1241–1260. doi:10.1007/s11442-022-1995-4
Zhang, L., Yu, Y., and Chen, Y. (2022). The spatial-temporal evolution characteristics and driving factors of the green utilization efficiency of urban land in China. Front. Environ. Sci. 1005. doi:10.3389/fenvs.2022.955982
Zhang, X., Jie, X., Ning, S., Wang, K., and Li, X. (2022). Coupling and coordinated development of urban land use economic efficiency and green manufacturing systems in the Chengdu-Chongqing Economic Circle. Sustain. Cities Soc. 85–104012. doi:10.1016/j.scs.2022.104012
Keywords: urban land use efficiency, carbon emissions, Yangtze River Economic Belt, sustainable development, SBM-undesirable model
Citation: Yang Q, Pu L, Jiang C, Gong G, Tan H, Wang X and He G (2023) Unveiling the spatial-temporal variation of urban land use efficiency of Yangtze River Economic Belt in China under carbon emission constraints. Front. Environ. Sci. 10:1096087. doi: 10.3389/fenvs.2022.1096087
Received: 11 November 2022; Accepted: 21 December 2022;
Published: 06 January 2023.
Edited by:
Lei Gao, Commonwealth Scientific and Industrial Research Organisation (CSIRO), AustraliaReviewed by:
Rui Xiao, Wuhan University, ChinaCopyright © 2023 Yang, Pu, Jiang, Gong, Tan, Wang and He. This is an open-access article distributed under the terms of the Creative Commons Attribution License (CC BY). The use, distribution or reproduction in other forums is permitted, provided the original author(s) and the copyright owner(s) are credited and that the original publication in this journal is cited, in accordance with accepted academic practice. No use, distribution or reproduction is permitted which does not comply with these terms.
*Correspondence: Lijie Pu, bGpwdUBuanUuZWR1LmNu; Caixia Jiang, amlhbmdjYWl4aWFAc3R1LmNxdXQuZWR1LmNu
Disclaimer: All claims expressed in this article are solely those of the authors and do not necessarily represent those of their affiliated organizations, or those of the publisher, the editors and the reviewers. Any product that may be evaluated in this article or claim that may be made by its manufacturer is not guaranteed or endorsed by the publisher.
Research integrity at Frontiers
Learn more about the work of our research integrity team to safeguard the quality of each article we publish.