 Ruikun Peng
 Huichun Huang1
95% of researchers rate our articles as excellent or good
Learn more about the work of our research integrity team to safeguard the quality of each article we publish.
Find out more
ORIGINAL RESEARCH article
Front. Environ. Sci. , 03 January 2023
Sec. Environmental Economics and Management
Volume 10 - 2022 | https://doi.org/10.3389/fenvs.2022.1095394
This article is part of the Research Topic China's Insurance and Green Economy Development in the Context of Sustainable Development View all 15 articles
The study determines the coupling degree of green investment and green ecology in China using kernel density estimation, spatial autocorrelation analysis, and standard deviation ellipse model to empirically evaluate the data of 30 Chinese provinces from 2005 to 2019. Moreover, the study investigates the temporal evolution trend, spatial clustering characteristics, and spatial evolution trend of coupling degree. Although the coupling coordination value of green investment and green ecology gradually increased, it is generally at a low coordination stage. At the same time, regional disparities narrowed with the most significant variability in the eastern region. Moreover, results found that the aggregation effect of the coupling and coordination of green investment and green ecology is more significant, and the high-value aggregation area extended from the lower reaches of the Yangtze River to the midstream region, while the western region is dominated by low-value aggregation. Similarly, the degree of synergy between green investment and green ecology is increased; however, the fragmentation trend is inevitable. At the same time, the center of gravity of coupling coordination shifted to the western regions, and the spatial pattern gradually weakened in the “northeast-southwest” direction. The findings of the study stress that local governments of China should improve the green investment system for green ecological development in the surrounding areas of the Yangtze River Economic Belt. Moreover, it is required to focus on the Northeast revitalization and Western development strategies to promote the synergistic development of green investment and green ecology.
In parallel with global economic growth, environmental issues have increased (Khan et al., 2020). About 8.3 million people die each year due to environmental pollution (Khan & Ozturk, 2020) and most cases were found in China as it has ranked second in the world (Landrigan et al., 2018; Gu et al., 2019; Gu et al., 2020). Therefore, it is indispensable to advocate green ecological development in China, as an important for social welfare and human health (Wang et al., 2020). Green investment has involved in the field of renewable energy (Yao et al., 2016; Elahi et al., 2019; Elahi et al., 2022; Elahi et al., 2022) and promotes green economy (Ekeh et al., 2007), which also caters to the strong public demand (Liao and Shi, 2018). May studies have found a positive nexus between green investment and green ecology. Shen et al. (2021) studied the role of natural resource rents, green investment, financial development, and energy consumption in carbon emission reduction using panel data of Chinese provinces in recent years, and concluded that green investment is negatively related to carbon emissions, suggesting that green investment should be promoted to control carbon emissions. Zhu et al. (2014) suggested that environmental regulations as well as green investment can motivate pollution-intensive enterprises in China to maintain green ecology through technological innovation, industrial structure upgrading, and plant relocation. However, some scholars argue that there is a non-linear correlation between the two, that the effect of carbon neutrality and green transformation has a lag, that short-term green investment initiatives will increase the proportion of national eco-industrial R&D investment and weaken green ecological protection, and that the impact of green investment efforts on China’s green ecological quality shows a “U” shaped change (Fuyong and Xiang, 2022). There are different views on the study of the coupling mechanism between green investment and green ecology. Many gaps in the quantitative studies on coupling coordination, such as coupling trends and the evolution of the dynamics, have been found. To the best of our knowledge, this is the first attempt to explore the evolutionary trend of green investment and green ecology coupling from temporal and spatial dimensions. Moreover, it provides ideas for green investment and green ecology synergistic development policies in China.
Some scholars interpret green investment as “socially responsible investment”, i.e., investment based on a combination of environmental, social, and economic criteria, which is part of “green finance.” Others also innovatively interpreted green investment as the “environmental protection investment.” Zhang et al. (2022) used the entropy method and undesirable-SE-SBM model to measure provincial green finance and green development efficiency respectively from 2008 to 2018, and the results showed that green finance can significantly promote green development and improve green ecology after a certain percentage of R&D investment. Mesjasz-Lech (2017) analyzed the relationship between environmental protection expenditures and environmental governance effectiveness for sustainable development using principal component analysis for EU industrial sector related firms and observed that the increase in environmental protection expenditures in most countries was accompanied by improved environmental governance effectiveness. Green investment plays its capital allocation role to provide financial support to green industries for technological innovation, which leads to energy consumption reduction and pollution reduction, and improvement of green ecosystem.
Green ecology is an important development approach for social progress and green investment efficiency. Most of the existing literature focused on the impact of green ecology on economic growth (Peng et al., 2021; Peng et al., 2021; Zhao et al. 2020; Aldieri et al., 2020) reported that environmental regulations impacted the distribution of financial resources. Vogel (2000) justified that economic integration and green ecological regulation are compatible and that economic integration can provide a certain degree of an effective mechanism for raising regulatory standards. From the perspective of enterprises, Leiter et al. (2011), Testa et al. (2011), and Zhu et al. (2014) argued that a series of government management tools such as environmental controls, financial subsidies, and collection of emission fees can significantly optimize the production methods of enterprises and strengthen their level of green investment. Improving the level of green ecology can effectively enhance corporate investment in energy conservation and emission reduction, thus enhancing environmental protection investment, while green ecology can also enhance corporate environmental protection revenue by increasing corporate investment in energy conservation and emission reduction (Chesney et al. 2011; Jaraite et al. 2014).
Despite the green investment is a subdivision of the economy in the field of capital financing, a few studies focused on the coordination relationship between green investment and green ecology. Most of the existing literature focuses on the harmonious relationship between economic growth and green ecology. Kline (2000) believed that high-level economic growth and a high-quality environment can coexist in ecological cities. Feiock and Stream (2001) found that economic growth and the environment should be integrated and that they should have a harmonious development relationship to promote each other. Gan and Bu (2020) revealed that the coupling coordination between green finance and the eco-environment is developing from an uncoordinated level to a well-coordinated level, but failed to analyze their coupled coordination relationship in depth. On the one hand, Liu et al. (2018) argued that the social welfare brought by economic development can significantly improve the quality of the environment and gradually lead to the benign development of the overall environment. On the other hand, the gradual improvement of the environment can optimize the economic structure, stimulate economic vitality and adjust the economic scale.
By comparison of the above studies, it is found that most of the existing studies on green investment and green ecology focus on the improvement effect of green investment on green ecology and the promotion effect of green ecology on green investment efficiency, and there are still research gaps on issues of the coupling and coordination of green investment and green ecology, which need to be further explored. The existing studies on the spatial distribution of coupling and coordination mostly focused on the field of spatial clustering, and lack of in-depth exploration of the evolution of spatial and temporal patterns. Therefore, the current study selects general indicators of green investment and green ecology in 30 Chinese provinces and explores the coupling characteristics of green investment and green ecology in China from 2005 to 2019. While studying the temporal evolution trend of coupling coordination, it also delves into the spatial evolution characteristics of coupling coordination and examines whether there is a coupling effect between green investment and green ecology. Furthermore, the study provides ideas for synergistic development of green investment and green ecology in China.
Common methods of variable modeling studies include panel data (Khelfaoui et al., 2022; Khelfaoui et al., 2022), bias correction (Ahmed et al, 2021), structural equation modeling (Ahmed et al., 2021), and sample analysis (Ahmed et al., 2019), among others. The coordination model is used to estimate the degree of interaction between green investment and green ecology. Using the kernel density function, another estimation method is constructed to study the time-series evolution of the interaction between green investment and green ecological development. In addition, we used the spatial autocorrelation analysis method (Moran’s I index, Getis-Ord Gi* index) for exploratory spatial data analysis (ESDA) and the spatial standard deviational ellipse model to analyze the spatial global characteristics and local spatial clustering differences in the coordination of green investment and green ecology coupling.
As the indicators of green investment and green ecology differ in terms of units and areas of expertise. Therefore, to eliminate the influence of the innate defects of the system indicators on the empirical results, the values of the indicators should be carried out using dimensionless processing. Based on this theory, the indicators were standardized into positive and negative indicators using maximum difference denormalization (Wang et al., 2019).
where
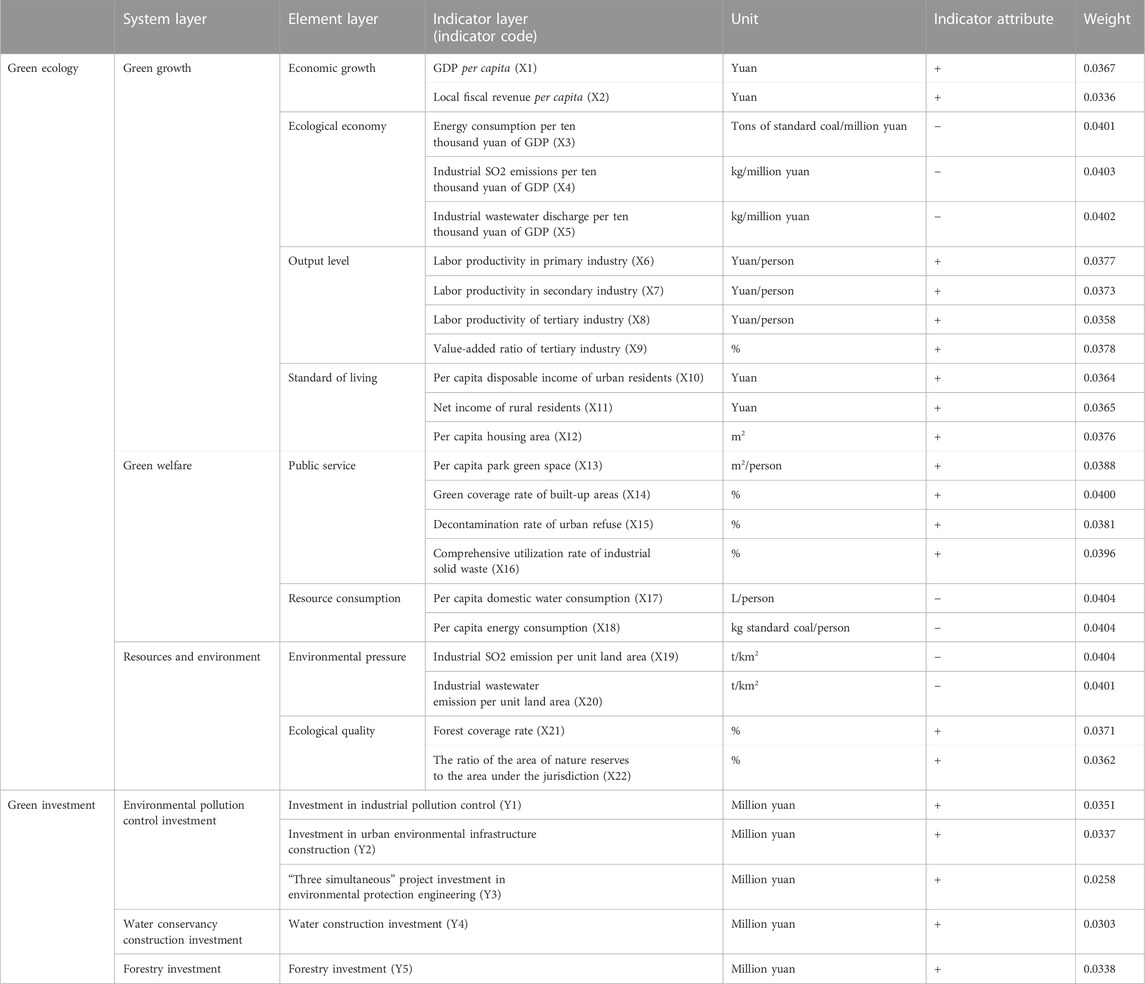
TABLE 1. Construction of a systematic index of green ecology and green investment.
The concept of coupling is taken from physics and it refers to the process in which two or more systems interact and thus influence each other. Many scholars used this concept in the fields of economics, ecology, and sociology. Similarly, in this study, we considered the “green investment-green ecology” system as the research object. Following Tang (2015), a coupling coordination model consisting of a coupling degree model and a coordination degree model was constructed.
where
Taking the coupling coordination value as the research object, the kernel density estimation method is applied to explore the time evolution pattern of the coupling relationship between green investment and green ecology. The kernel density estimation is based on non-parametric tests, which evaluate and analyzes the probability densities of variables, and ultimately investigate the evaluation method of data distribution dynamics. While in the fields of management, geography, and economics, the probability density distribution characteristics of the specified years within the study period of the sample can be used to compare the temporal evolution pattern of the study object using a given function.
where
To explore the variability characteristics of a certain research object in the research region, the convergence function (σ) can measure the variability of a certain index. In this study, the coupling coordination value is brought into the convergence function for a preliminary study on the variability of the coupling coordination between green investment and green ecology in each region of China. Following the studies of Wu et al. (2020), the specific equation can be written as:
where
The spatial autocorrelation method is a type of exploratory spatial data analysis to explore the interconnections and dependencies of variables among regions within the research object that consisted of two theoretical models i.e., global spatial autocorrelation and local spatial autocorrelation (Li et al., 2020). In this paper, we used Moran’s I index and Getis-Ord Gi* index, which are commonly used in the application of indices to focus on the spatial local clustering characteristics among provinces, autonomous regions, and municipalities that are directly under the central government.
Global spatial autocorrelation (Global Moran’s I):
Local spatial autocorrelation (Local Moran’s I):
Getis-Ord Gi* index:
where
If
This paper carries out an empirical study using a spatial standard deviational ellipse to investigate the spatial global characteristics for the coupling and coordination characteristics of green investment and green ecology. The standard deviational ellipse focuses on revealing the global characteristics of geographical elements’ spatial distribution and belongs to the statistical analysis method of spatial pattern. The model mainly describes the spatial distribution dynamics of geographical elements quantitatively with parameters such as the center of gravity, rotation angle θ, x-axis standard deviation, and y-axis standard deviation (Gong, 2002).
where
Green investment indicators and green ecological indicators are complex systems, including social, economic, environmental, and other factors (Peng et al, 2018; Peng et al, 2020; Zhao et al, 2021; Zhong et al, 2021). This paper upholds the principles of indicator availability, comprehensiveness, and scientific nature. Moreover, following Fei et al. (2020), He et al. (2017), and Lu et al. (2017) we selected a total of three first-level indicators for green ecosystems such as green growth, green welfare, and resource environment. Similarly, a total of three first-level indicators are selected from green investment such as investment in environmental pollution control, investment in water conservancy construction, and investment in forestry. The detail of the selection of indicators is given in Table 1.
The data were obtained from the China Statistical Yearbook on Environment, the China Water Statistical Yearbook, the China Forestry Yearbook, and the statistical yearbooks of each province from 2005 to 2019. The vector map of China was used to visualize the conclusions which it is derived by scanning the administrative boundaries of the region, and the individual missing values are filled in by linear regression interpolation.
Coordination degree refers to studying the degree of coupling while considering the coordination degree between systems, which is used to explore the good or bad coupling degree between green investment and green ecosystem, usually, the value of D is in the range of 0 and 1. This paper draws on the research results of Gan and Bu (2020) to make the following classification of coordination degree level (Table 2).
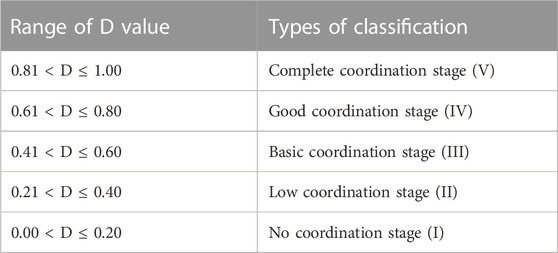
TABLE 2. Classification of coupling coordination level.
The coupling coordination values of green investment and green ecology were estimated based on the coupling coordination model. In particular, we selected 2005, 2010, 2014, and 2019 as time points to study the temporal characteristics of the coupling coordination in various provinces of China (Figure 1). Furthermore, the provinces were divided into eastern, central, and western regions to determine the spatial distribution of the coupling coordination between green investment and green ecology.
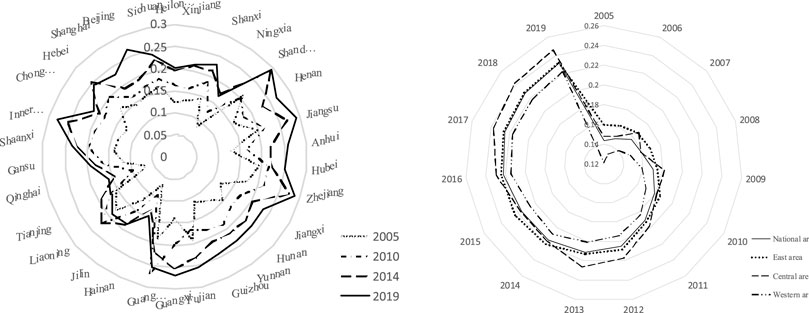
FIGURE 1. Evolution values of coupling coordination.
The results depict that from 2005 to 2019, the coupling coordination values of provinces showed a continuously increasing trend, but all of them were at the stage of serious disorder, and the coupling coordination values also vary widely between regions. It shows that the combination of green investment and green ecology in China has become deeper during the study period, but the interaction between the two is relatively chaotic and the development trends are different between regions. For instance, from 2005 to 2010, the coupling coordination values were generally larger in the eastern provinces of China particularly, Guangdong, Liaoning, and Shandong. It indicates that the superior economic advantages and infrastructure in the eastern regions provide a solid foundation for the combination of green investment and green ecology. Similarly, from 2010 to 2019, the coupling coordination values of developed eastern coastal provinces such as Jiangsu, Shanghai, Zhejiang, and Guangdong still ranked in the first echelon, but the mean value of coupling coordination values in the central region is higher than that in the eastern region during the period. It means that the coupling coordination values of eastern provinces particularly, Liaoning and Tianjin are too low and there is a certain degree of polarization.
Regarding types of coordination (Table 3), the types for coordinating green investment and green ecology in 2005–2019 are only the no coordination type and the low coordination type. Specifically, the type of coordination between green investment and green ecology in China from 2005 to 2010 is dominated by the type of no coordination, and the coordination relationship between green investment and green ecology is generally in a chaotic state during the period. From 2014 to 2019, the number of provinces in the low coordination type gradually increased by 66.7% and 76.7% of the total in 2014 and 2019, respectively. This implies that during this period China’s green investment and green ecology started the coordination phenomenon; however, the overall coordination level is still not high.
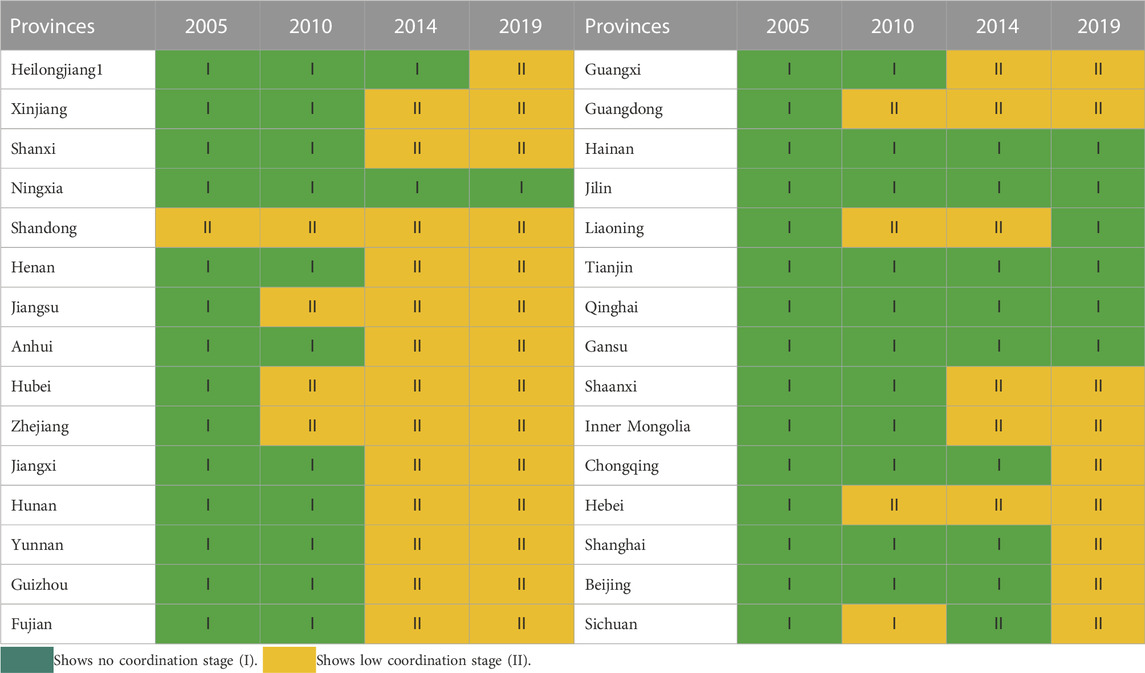
TABLE 3. Evolution of types of coupling coordination.
We used the kernel density estimation method and determined the evolution characteristics of the coupling coordination between green investment and green ecology. Figure 2 illustrates that from 2005 to 2019, there is an overall shift to the right in the center of the kernel density curve of the coupling coordination between green investment and green ecology, and the magnitude of the shift gradually increases. However, the change interval has decreased year by year. It suggests that the coupling coordination value of Chinese provinces has increased continuously over 15 years and the regional gap has narrowed.
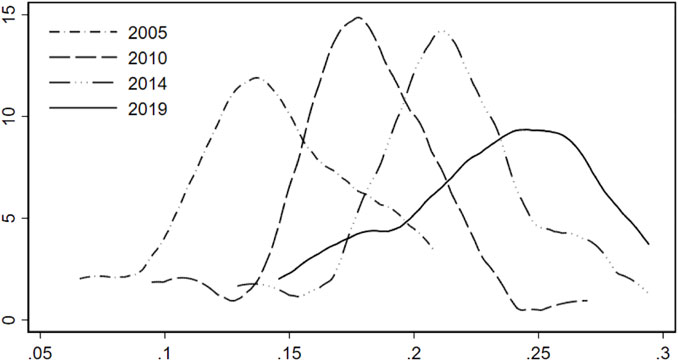
FIGURE 2. Kernel density distribution of coupling coordination.
From 2005 to 2019, the kernel density curve shows a shift from multiple peaks to a single peak. In 2005, there are two peaks, of which the kernel density value corresponding to the first peak is smaller than the second one, indicating a clear polarization of the coupling coordination between green investment and green ecology in each province. In 2010, the kernel density curve consists of the main peak and two side peaks, suggesting that the polarization characteristics of the coupling coordination of green investment and green ecology have been expanded gradually. The shape of the kernel density curve in 2014 is similar to that in 2005; however, the number of peaks decreased as compared to 2010 until the kernel density curve developed into a single peak in 2019. It means that the regional differences in the coupling coordination of green investment and green ecology in each province decreased gradually. This indicates that a higher level of agglomeration phenomenon and polarization characteristics disappeared.
From 2005 to 2019, the kurtosis of the kernel density curve of green investment and green ecological coupling coordination shifts to the right. It shows a shift from a “sharp peak” to a “broad peak.” From 2005 to 2014, the left peak of the kernel density curve gradually increased, and the spike feature of the crest become more and more significant, which means that the coupling coordination value of the green investment and green ecology increased in each province of China. Furthermore, Figure 2 illustrates that the kurtosis of the kernel density curve decreased year by year from 2014 to 2019, while the crest pattern gradually flattened out and evolved toward a broad peak feature. This implies that the number of regions with the coupling coordination value of the green investment and green ecology corresponding to each crest was expanded.
The convergence function (σ) was used to estimate the differences in the coupling coordination of green investment-green ecology among various regions of China (Figure 3). At the national level, from 2005 to 2014, the σ values continue to decline, indicating a gradual decrease in the variability of the coupling coordination between green investment and green ecology in China. Figure 3 illustrates that the value of σ increased slightly from 2014 to 2019, but it is still smaller than the σ values in 2005. It reveals an overall decrease in the variability of coupling coordination over the study period. At the regional level particularly in eastern and western regions, the values of σ experienced an evolutionary trend of slowly decreasing and then slowly increasing. The overall coupling coordination showed a convergence trend. From 2005 to 2014, the values of σ in the central region declined rapidly and then increased slowly from 2014 to 2019, which indicates a significant overall decrease in the variability of coupling coordination in the region. The order of σ values in the three regions is the highest in the eastern region, the second-highest in the western region, and the smallest in the central region, which shows that the central region has the least variability in the coupling coordination characteristics of green investment and green ecology.
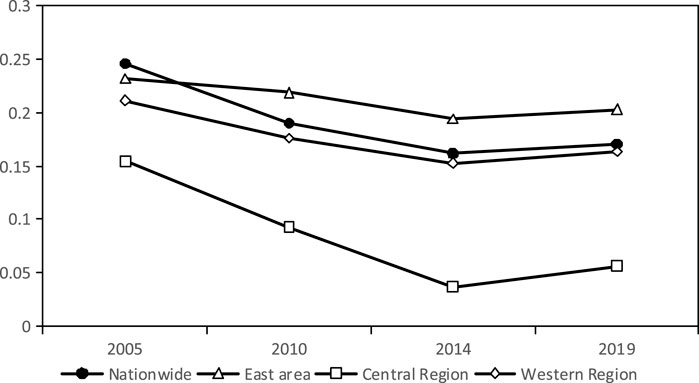
FIGURE 3. Convergence analysis of the coupling coordination.
The coupling coordination value of the green investment and green ecology were taken as the research variable and calculated Moran’s I index for 2005, 2010, 2014, and 2019. We performed 9999 randomizations to test the significance level (Table 4). In 2005, 2014, and 2019, the Moran'I index was greater than zero, and it showed an evolutionary trend of first decreasing and then increasing. It demonstrates that the coupling coordination of green investment and green ecology has spatial clustering characteristics at this time, and the clustering characteristics were continuously strengthened in 2014 and 2019. In 2010, the Moran'I index is less than zero, which means that the coupling coordination at this time does not have the characteristics of spatial agglomeration, but presents a certain degree of dispersion. Except in 2005, when the Z-value of coupling coordination passes the 5% significance test, the rest of the time points are not significant at the 5% or 10% statistical level. However, it is not proved that there is a lack of autocorrelation of coupling coordination between green investment and green ecology in China because the selection of spatial weights and the differences between regions may lead to insignificant coupling coordination values. Therefore, the spatial correlation analysis using the local Moran'I index is required.
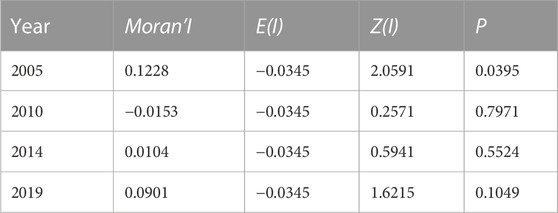
TABLE 4. Global Moran'I indexes.
The local Moran index can reasonably analyze the spatial autocorrelation of the study area. The local indicators of spatial association (LISA) clustering maps are plotted at a 5% significance level. Figure 4 illustrates that the coupling coordination of green investment and green ecology in China from 2005 to 2019 possesses four types of spatial agglomeration: 1) Significantly high-high type, i.e., the coupling coordination values of both itself and the surrounding areas are high, and the differences between regions are small. It reveals the phenomenon of high-value aggregation. In terms of its spatial distribution, it was mainly concentrated in Shandong, Jiangsu, Shanghai, Zhejiang, and Henan in 2005, while the number of high-value aggregation areas gradually disappeared in 2010. The number of significantly high-high type areas continued to increase from 2010 to 2019, extending to the middle and lower reaches of the Yangtze River provinces and their surrounding areas. 2) Significantly high-low type, i.e., the self-coupling coordination value is high, but the surrounding areas are small, and the spatial differences are more obvious. The regional distribution of this spatial agglomeration type is limited and existed only in Sichuan Province in 2005. 3) Significantly low-high type, i.e., the self-coupling coordination value is low, but the coupling coordination values of surrounding areas are high and the spatial differences are more significant. From 2005 to 2014, the spatial distribution is more regionally concentrated, mostly located in Anhui and Jiangxi provinces, and occasionally in Hainan and Shanghai in individual years. 4) Significantly low-low type i.e., the coupling coordination value between itself and the surrounding areas is low, and the spatial difference is small, showing a low-value aggregation. In 2005, a significantly low-low type is distributed only in Xinjiang and Gansu. After 2005, there are few low-value aggregation regions in Gansu Province.
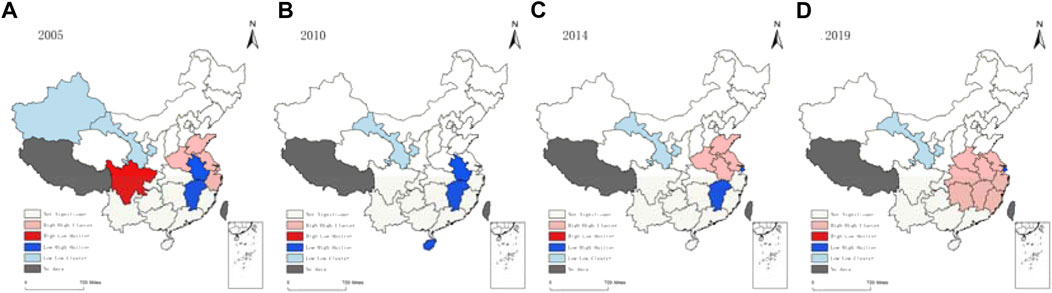
FIGURE 4. Local indicators of spatial association of the coupling coordination. (A) 2005, (B) 2010, (C) 2014, (D) 2019.
The Getis-Ord Gi* index can be calculated for each element of the research data, and the statistical method is different from the local Moran index, which is an important complement to local spatial autocorrelation. Therefore, this paper further explores the clustering characteristics of the coupling coordination of green investment and green ecology in China and divides them into cold spot areas, sub-cold spot areas, sub-hot spot areas, and hot spot areas using the natural break method (Figure 5). The results can be reported as: 1) The number of hot spot areas increased year by year, gradually developing from the coastal provinces in the lower reaches of the Yangtze River to the provinces in the middle and lower reaches of the Yangtze River and its surrounding areas, demonstrating that these provinces have higher coupling coordination values, have advantages in the combination of green investment and green ecology, and presented a high-value aggregation trend. 2) During 2005 and 2014, the number of sub-hot spot areas decreased gradually, initially concentrated in the central provinces of East China and some central provinces, and gradually shrinking to the coastal areas of East China. In 2014 and 2019, the number of sub-hot spot areas grew rapidly to 18 and was distributed in the eastern, central, and western regions. There are large differences in coupling coordination values between regions. 3) The development trend of the number of sub-cold spot areas is opposite to that of sub-hot spot areas, experiencing a development trend of gradual expansion followed by rapid shrinkage, and in 2019 there is Heilongjiang Province belonged to sub-cold spot areas. The regional differences are large. 4) The number of cold spot areas gradually decreased and is concentrated in the western region. After 2014, only Qinghai and Gansu existed. It shows that the low-value aggregation area of the coupling coordination value is gradually shrinking in the western region, and the regional differences are small.
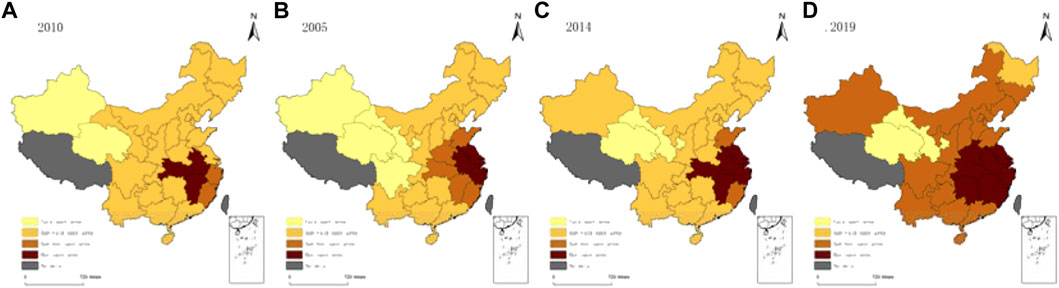
FIGURE 5. Cold and hot spot areas of the coupling coordination degree. (A) 2010, (B) 2005, (C) 2014, (D) 2019.
After proving the existence of spatial clustering characteristics of the coupling coordination of green investment and green ecology in China, this study further applies the center of gravity-standard deviation ellipse method to investigate the spatial evolutionary dynamics of the coupling coordination values. And, 2005, 2010, 2014, and 2019 are selected to study the spatial distribution characteristics of the coupling coordination of green investment and green ecology (Table 5; Figure 6).
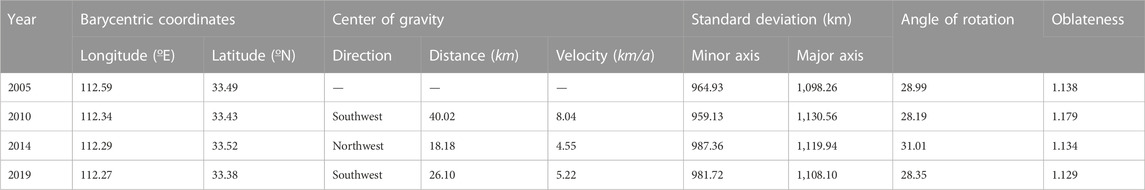
TABLE 5. Shift of the center of gravity for coupling coordination values and standard deviation ellipse parameters.
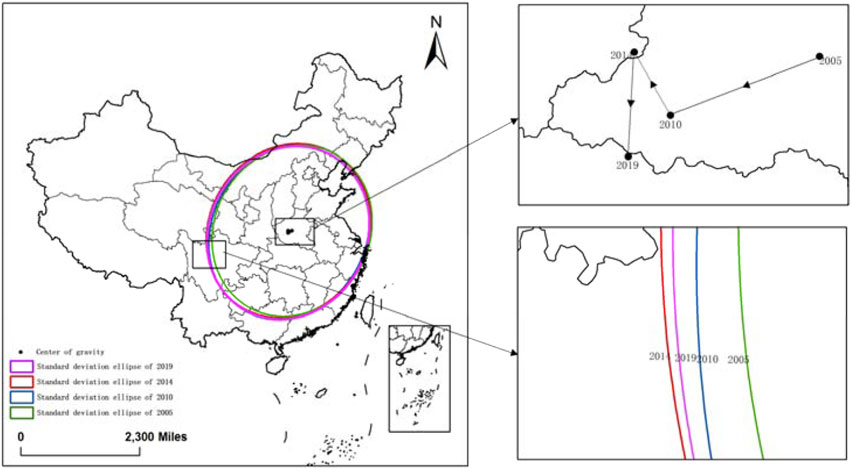
FIGURE 6. Spatial distribution of evolutionary trend of the coupling coordination degree.
Examining the distribution, distance, and rate of movement of the center of gravity in the center of gravity model, the centers of gravity of the coupling coordination between green investment and green ecology in China are all distributed in Henan Province. It indicates that in the generalized east-west direction, the combination of green investment and green ecology in eastern China is generally better than that in the western region. It is found that the center of gravity of the coupling coordination value in 2005 is located in Pingdingshan City, Henan Province. From 2005 to 2010, the center of gravity of the coupling coordination value shifted to the southwest from Baofeng County (Pingdingshan City) to Lushan County (Pingdingshan City), moving 40.02 km and 8.04 km/a, respectively. It is the farthest distance and the fastest moving rate. Similarly, the center of gravity shifted to the northwest from 2010 to 2014, moving from Baofeng County to Song County in Luoyang City, but the distance and rate of movement decreased to 18.18 km and 4.545 km/a, respectively. Moreover, the center of gravity of the coupling coordination value shifted to the southwest again in 2014 and 2019 and approached the edge of Nanyang City, at this time the moving distance increased slightly and the moving rate increased slowly. The above analysis shows that the center of gravity of China’s green investment and green ecological coupling coordination generally showed a westward shift in the east-west direction, and shifts northward and then southward in the north-south direction. It is gradually developed towards the middle reaches of the Yangtze River at the geographical level. The moving speed of the center of gravity generally showed a trend of “accelerating to gradually decreasing to slowly increasing.”
From the evolution of the rotation angle, the spatial pattern of the coupling coordination between green investment and green ecology in China from 2005 to 2019 showed a “northeast-southwest” phenomenon and a shift toward the “north-south” direction, while the rotation angle θ presents an overall trend of fluctuating declined. This indicated that the “northeast-southwest” spatial distribution pattern has a certain degree of tendency to weaken. Specifically, the rotation angle θ changed by 0.8° from 2005 to 2010, which showed that the spatial pattern of coupling coordination between green investment and green ecology has shifted from “northeast-southwest” to “due north-south” by 0.8°. From 2010 to 2014, the rotation angle θ increased to 31.01°, and the spatial distribution of the coupling coordination type shifted to the “due north-south” direction again by 2.66° from 2014 to 2019.
From the analysis of the length of the main axis, the standard deviation of both the major axis and the minor axis of the standard deviation ellipse from 2005 to 2019 showed a fluctuation with an increasing trend. It indicated that the coupling coordination between green investment and green ecology in China is gradually dispersed in the “northeast-southwest” and “southeast-northwest” directions. From the change of the major axis, the standard deviation of the major axis in 2005 gradually expanded from 1,098.26 to 1,130.56 km in 2010, suggesting that the coupling coordination is dispersed in the spatial direction of “northeast-southwest”. The standard deviation of the major axis decreased from 1,130.56 to 1,108.10 km from 2010 to 2019. It showed that the coupling coordination gradually polarized in the “northeast-southwest” direction during this period. From the change of the minor axis, the standard deviation of the minor axis decreased from 2005 to 2010 and from 2014 to 2019, which means that the coupling coordination is polarized in the “southeastward-northwestward” direction. The standard deviation gradually increased from 2010 to 2014. It indicated that the coupling coordination is dispersed in the direction of “southeastward - northwestward.” The change of the flatness rate fluctuates from 1.138 to 1.129 during the study period. This implies that the coupling coordination between green investment and green ecology in China showed a local aggregation trend, and the overall aggregation degree gradually decreased.
In this study, the coupling coordination characteristics of green investment and green ecology are studied in spatial and temporal dimensions. In particular, the coupling coordination is explored in three aspects: temporal evolution characteristics, spatial clustering analysis, and spatial pattern evolution.
Regarding the temporal evolution of coupling coordination, the national coupling coordination value developed from 0.1432 to 0.2314 from 2005 to 2019, and the coupling coordination value of the green investment and green ecology gradually increased. However, it is still at the stage of serious unbalanced development. Similar to the study of Gan and Bu (2020), who concluded that the coupling coordination of the green financial system and ecology was changed from the uncoordinated stage to the well-coordinated stage. The center of the kernel density curve shifted to the right, but the changed interval decreased year by year. At the same time, the number of peaks gradually decreased, showing a “spike-broad peak” transformation, indicating that the coupling coordination values of Chinese provinces have narrowed during the study period. Therefore, the clustering phenomenon is more significant, and the polarization characteristics have disappeared significantly. The results of the convergence analysis revealed that the differences in coupling coordination decreased across Chinese provinces, but the most significant difference was found in the eastern region. Probably because China first proposed the concept of ecological civilization in 2007, thus the coupling coordination value of green investment and green ecology gradually increased. Until 2016 when China announced the industrial green development and the green financial system planning, the green investment was formally involved in the green ecological construction, while the coupling coordination was still in the primary stage. However, green development policies vary from region to region, and regional characteristics were formed with the evolution over time. Thus the gap in regional coupling coordination was decreased. Among them, the economic base and geopolitical advantages of the eastern region are better than those of the central and western regions. The polarization phenomenon among the provinces in the eastern region is also the most significant, and therefore there is a greater variability of coupling coordination is found.
Regarding the analysis of spatial cluster, whether it is the local Moran'I index or the Getis-Ord Gi* index, the spatial distribution characteristics showed that the high-value agglomeration area developed gradually from the Yangtze River inlet and its vicinity to the middle reaches of the Yangtze River, making it a highland for the synergistic development of green investment and green ecology, and the radiation effect on the neighboring provinces has always existed, which is similar to the conclusion of other studies, for instance, Yao et al. (2014). In these studies, the significant economic and ecological agglomeration characteristics in the eastern part of China were found because China proposed the strategy of Yangtze River Golden Waterway, the Yangtze River estuary area represented by Shanghai, Jiangsu, Anhui, and Zhejiang which has a strong economic advantage. The amount of related environmental pollution control investment, water conservancy construction investment, and forestry investment is also more than sufficient. The geographical situation is mostly plain, coupled with a variety of policy resources, which can ensure that green investment is efficiently and sufficiently invested in the field of green ecology. In China, the combination of green ecology and green ecology is in the first echelon. However, low-value aggregation regions are only distributed in and around Gansu with the least obvious coupling coordination characteristics. Perhaps because the economic base of the western region represented by Gansu is relatively weak, and the ecological environment is relatively poor, the combination of the two has a long way to go.
Regarding spatial pattern evolution, the center of gravity of the coupling coordination of green investment and green ecology generally shifted 53.84 km to the southwest. The results are in line with the studies of Lai et al. (2020), who found the coupling coordination of ecology and economy in the central and western provinces gradually increased. Probably because the implementation of the Belt and Road and the Western Development Strategy proposed by China, led to the strengthening of the state’s support for the western and southwestern regions, providing an important policy backing for the economic development of the central and western regions and laying the foundation for the implementation of green investments. This also confirmed the conclusion that the coupled and coordinated high-value agglomeration region evolved towards the middle reaches of the Yangtze River. The deflection angle of the standard deviation ellipse fluctuated from 28.99° to 28.35°, with an overall shift in the “due north-south” direction, similar to the conclusion that the center of gravity shifted southward in the north-south direction, while the principal axis length of the standard deviation ellipse increased during the study period and the flattening of the ellipsoid decreased from 1.138 to 1.129, indicating that the distribution of coupling coordination expanded during 2005 and 2019, and the degree of synergy between green investment and green ecology increased, but its fragmentation was inevitable. This may be due to the gradual improvement of the green financial system, and the level of green investment is also tilted by policy resources. The provinces can put the amount of green investment into relevant fields, which makes the degree of synergistic development of green investment and green ecology gradually rise. However, the convergent policy requirements also restrict the development of each province, making it difficult to form regional characteristics, and thus creating a fragmented situation.
The findings of the study show a more significant coupling effect between green investment and green ecology in China, at the level of temporal evolution analysis, spatial clustering analysis, and spatial pattern evolution analysis.
The study focuses on the coupling coordination of green investment and green ecology in 30 Chinese provinces and cities from spatial and temporal dimensions using the coupling coordination model, kernel density estimation, spatial autocorrelation, and spatial standard deviation ellipse methods. The main findings of the study can be summarized as:
Overall, the study found that the coupling effect of green investment and green ecology in China is generally at a preliminary stage. In particular, the coupling coordination value of the green investment and green ecology is gradually increased, but the overall state is in a serious imbalance. Meanwhile, the regional gap of coupling coordination narrowed with the most significant variability in the eastern region. Specifically, the coupling coordination value of the green investment and green ecology in China developed from 0.143 to 0.231, but the coordination type is dominated by low-level coordination, while among all regions the difference coefficient in the eastern region is the highest.
The aggregation effect of the coupling coordination of green investment and green ecology is significant. The high-value aggregation area extends from the lower reaches of the Yangtze River to the middle reaches of the Yangtze River, while the western region is dominated by low-value aggregation. The specific performance of the significant high-high type and hot spot areas are from the Yangtze River estuary to the middle reaches of the Yangtze River transfer trend, but the western region such as Gansu has shown low-value aggregation characteristics. Therefore, it is suggested to highlight the dominant position of the Yangtze River Economic Belt, strengthen cooperation with neighboring regions, share green investment patterns and green ecological governance experience, and achieve the goal of coordinated development of green investment and green ecology in internationalized city clusters.
The degree of synergistic development between green investment and green ecology is increased, but fragmentation is inevitable. At the same time, the center of gravity of coupling coordination moved to the southwest, and the spatial pattern gradually weakened in the direction of “northeast-southwest.” Moreover, the distribution range of the standard deviation ellipse is expanded and the flattened ellipsoid is decreased. The center of gravity of the coupling coordination value is shifted to the southwest in Henan, and the deflection angle is also fluctuated down.
It is suggested that China should continue to improve the green financial system, refine the investment scope of green finance, provide important policy support for the in-depth participation of green investment in the fields of green welfare, green economy, and natural resources, and actively guide the flow of social capital to green ecology. Therefore, it is recommended that Chinese provinces give full play to their geographical advantages, actively carry out the Northeast Revitalization Strategy and Belt and Road Development Strategy, and develop green ecological development strategies according to local conditions.
This paper finds a coupling effect between green investment and green ecology through a quantitative study of coupling characteristics, indicating that there is a degree of positive effect between green investment and green ecology in China. On the other hand, this paper finds that the center of gravity of the combination of green investment and green ecology is close to the middle reaches of the Yangtze River, which shows the excellence of the Yangtze River Economic Belt strategy and provides a regional model for realizing the synergistic development of green investment and green ecology. Due to the complexity of the facilitation between green investment and green ecosystem, this study conducted a macro empirical analysis on the coupling coordination between green investment and green ecology at the provincial level, and ignored at the city level. Moreover, the study did not find the influencing factors of coupling and coordination. The above deficiencies and weaknesses can be overcome in future studies to make more valuable research on green investment and green ecology.
The raw data supporting the conclusion of this article will be made available by the authors, without undue reservation.
All authors listed have made a substantial, direct, and intellectual contribution to the work and approved it for publication.
The authors declare that the research was conducted in the absence of any commercial or financial relationships that could be construed as a potential conflict of interest.
All claims expressed in this article are solely those of the authors and do not necessarily represent those of their affiliated organizations, or those of the publisher, the editors and the reviewers. Any product that may be evaluated in this article, or claim that may be made by its manufacturer, is not guaranteed or endorsed by the publisher.
Ahmed, D., Shahab, Y., Ullah, F., and Ye, Z. (2019). Investor sentiment and insurers' financial stability: Do sovereign rating matter? Geneva papers on risk and insurance - issues and practice. Geneva Pap. Risk insur. Issues Pract. 45, 281–312. doi:10.1057/s41288-020-00160-z
Ahmed, D., Xie, Y., and Bhutta, U. (2021a). Insurers' risk management as a business process: A prospective competitive advantage or not? Eur. J. Manag. Bus. Econ. 31, 345–366. ahead-of-print. doi:10.1108/EJMBE-08-2021-0221
Ahmed, D., Xie, Y., and Issam, K. (2021b). Investor confidence and life insurance demand: Can economic condition limit life insurance business? Int. J. Emerg. Mark. 6, 0650. ahead-of-print(ahead-of-print). doi:10.1108/ijoem-06-2020-0650
Ai, J., Feng, L., Dong, X., Zhu, X., and Li, Y. (2016). Exploring coupling coordination between urbanization and ecosystem quality (1985–2010): A case study from lianyungang city, China. Front. Earth Sci. 10 (3), 527–545. doi:10.1007/s11707-015-0531-6
Aldieri, L., Makkonen, T., and Vinci, C. P. (2020). Environmental knowledge spillovers and productivity: A patent analysis for large international firms in the energy, water and land resources fields. Resour. Policy 69, 101877. doi:10.1016/j.resourpol.2020.101877
Cao, Y., Fan, X., Guo, Y., Li, S., and Huang, H. (2020). Multi-objective optimization of injection-molded plastic parts using entropy weight, random forest, and genetic algorithm methods. J J. Polym. Eng. 40 (4), 360–371. doi:10.1515/polyeng-2019-0326
Chesney, M., Taschini, L., and Wang, M. (2011). Experimental comparison between markets on dynamic permit trading and investment in irreversible abatement with and without non-regulated companies. SSRN J. 46, 1719026. doi:10.2139/ssrn.1719026
Ekeh, J. C., Wara, S. T., and Orovwode, H. E. (2007). Management of existing capacity of electric power with energy saving devices. Adv. Mat. Res. 19, 117–124. doi:10.4028/www.scientific.net/amr.18-19.117scientific.net/AMR.18-19.117
Elahi, E., Khalid, Z., and Zhang, Z. (2022a). Understanding farmers’ intention and willingness to install renewable energy technology: A solution to reduce the environmental emissions of agriculture. Appl. Energy 309, 118459. doi:10.1016/j.apenergy.2021.118459
Elahi, E., Weijun, C., Jha, S. K., and Zhang, H. (2019). Estimation of realistic renewable and non-renewable energy use targets for livestock production systems utilising an artificial neural network method: A step towards livestock sustainability. Energy 183, 191–204. doi:10.1016/j.energy.2019.06.084
Elahi, E., Zhixin, Z., Khalid, Z., and Xu, H. (2022b). Application of an artificial neural network to optimise energy inputs: An energy-and cost-saving strategy for commercial poultry farms. Energy 244, 123169. doi:10.1016/j.energy.2022.123169
Fei, R., Cui, A., and Qin, K. (2020). Can technology R&D continuously improve green development level in the open economy? Empirical evidence from China’s industrial sector. Environ. Sci. Pollut. Res. 27 (27), 34052–34066. doi:10.1007/s11356-020-09357-0
Feiock, R. C., and Stream, C. (2001). Environmental protection versus economic development: A false trade-off? Public Adm. Rev. 61 (3), 313–321. doi:10.1111/0033-3352.00032
Fuyong, C., and Xiang, G. (2022). Regional environmental pressures and corporate green innovation: An examination of low carbon city pilot policies. Commun. Finance Account. 21, 49–53+59. doi:10.16144/j.cnki.issn1002-8072.2022.21.027
Gan, Y., and Bu, Y. J. E. S. W. C. (2020). A coordinated assessment between green finance and ecological environment along the Yangtze River basin. E3S Web Conf. 194, 05038. doi:10.1051/e3sconf/202019405038
Gong, J. (2002). Clarifying the standard deviational ellipse. Geogr. Anal. 34 (2), 155–167. doi:10.1111/j.1538-4632.2002.tb01082.x
Gu, H., Cao, Y., Elahi, E., and Jha, S. K. (2019). Human health damages related to air pollution in China. Environ. Sci. Pollut. Res. 26 (13), 13115–13125. doi:10.1007/s11356-019-04708-y
Gu, H., Yan, W., Elahi, E., and Cao, Y. (2020). Air pollution risks human mental health: An implication of two-stages least squares estimation of interaction effects. Environ. Sci. Pollut. Res. 27 (2), 2036–2043. doi:10.1007/s11356-019-06612-x
He, J., Wang, S., Liu, Y., Ma, H., and Liu, Q. (2017). Examining the relationship between urbanization and the eco-environment using a coupling analysis: Case study of Shanghai, China. Ecol. Indic. 77, 185–193. doi:10.1016/j.ecolind.2017.01.017
Jaraite, J., Kazukauskas, A., and Lundgren, T. (2014). The effects of climate policy on environmental expenditure and investment: Evidence from Sweden. J. Environ. Econ. Policy 3 (2), 148–166. doi:10.1080/21606544.2013.875948
Jiang, Y., Huang, G., Yang, Q., Yan, Z., and Zhang, C. (2019). A novel probabilistic wind speed prediction approach using real time refined variational model decomposition and conditional kernel density estimation. Energy Convers. Manag. 185, 758–773. doi:10.1016/j.enconman.2019.02.028
Khan, M. A., and Ozturk, I. (2020). Examining foreign direct investment and environmental pollution linkage in Asia. Environ. Sci. Pollut. Res. 27 (7), 7244–7255. doi:10.1007/s11356-019-07387-x
Khan, Z., Ali, S., Umar, M., Kirikkaleli, D., and Jiao, Z. (2020). Consumption-based carbon emissions and International trade in G7 countries: The role of Environmental innovation and Renewable energy. Sci. Total Environ. 730, 138945. doi:10.1016/j.scitotenv.2020.138945
Khelfaoui, I., Xie, Y., Hafeez, M., Ahmed, D., Degha, H. E., and Meskher, H. (2022a). Information communication technology and infant mortality in low-income countries: Empirical study using panel data models. Int. J. Environ. Res. Public Health 19 (12), 7338. doi:10.3390/ijerph19127338
Khelfaoui, I., Xie, Y., Hafeez, M., Ahmed, D., Houssem Eddine, D., and Meskher, H. (2022b). Effects of health shocks, insurance, and education on Income: Fresh analysis using CHNS panel data. Int. J. Environ. Res. Public Health 19, 8298. doi:10.3390/ijerph19148298
Kline, E. (2000). Planning and Creating Eco-cities: Indicators as a tool for shaping development and measuring progress. Local Environ. 5 (3), 343–350. doi:10.1080/13549830050134275
Lai, Z., Ge, D., Xia, H., Yue, Y., and Wang, Z. (2020). Coupling coordination between environment, economy and tourism: A case study of China. PLoS One 15 (2), e0228426. doi:10.1371/journal.pone.0228426
Landrigan, P. J., Fuller, R., Acosta, N. J. R., Adeyi, O., Arnold, R., Basu, N. N., et al. (2018). The Lancet Commission on pollution and health. Lancet 391 (10119), 462–512. doi:10.1016/s0140-6736(17)32345-0
Leiter, A. M., Parolini, A., and Winner, H. (2011). Environmental regulation and investment: Evidence from European industry data. Ecol. Econ. 70 (4), 759–770. doi:10.1016/j.ecolecon.2010.11.013
Li, Y., Cui, Y., Cai, B., Guo, J., Cheng, T., and Zheng, F. (2020). Spatial characteristics of CO2 emissions and PM2.5 concentrations in China based on gridded data. Appl. Energy 266, 114852. doi:10.1016/j.apenergy.2020.114852
Liao, X., and Shi, X. (2018). Public appeal, environmental regulation and green investment: Evidence from China. Energy Policy 119, 554–562. doi:10.1016/j.enpol.2018.05.020
Liu, Y., Liu, D., Fu, Z., Yu, H., and Liyuan, Z. (2018). The differentiation mechanism of coupling degree among space exploitation, economy development and environment evolution in harbin-dalian giant urban Belt. Sci. Geogr. Sin. 38 (5), 662–671. doi:10.13249/j.cnki.sgs.2018.05.003
Lu, H., Zhou, L., Chen, Y., An, Y., and Hou, C. (2017). Degree of coupling and coordination of eco-economic system and the influencing factors: A case study in yanchi county, ningxia hui autonomous region, China. J. Arid. Land 9 (3), 446–457. doi:10.1007/s40333-017-0098-z
Mesjasz-Lech, A. (2017). Environmental protection expenditures and effects of environmental governance of sustainable development in manufacture enterprise. Environmental Economics and Managemen 05, 96647. doi:10.3389/fenvs.2022.96647
Peng, B., Chen, S., Elahi, E., and Wan, A. (2021a). Can corporate environmental responsibility improve environmental performance? An inter-temporal analysis of Chinese chemical companies. Environ. Sci. Pollut. Res. 28, 12190–12201. doi:10.1007/s11356-020-11636-9
Peng, B., Tu, Y., Elahi, E., and Wei, G. (2018). Extended Producer Responsibility and corporate performance: Effects of environmental regulation and environmental strategy. J. Environ. Manag. 218, 181–189. doi:10.1016/j.jenvman.2018.04.068
Peng, B., Zhang, X., Elahi, E., and Wan, A. (2021b). Evolution of spatial–temporal characteristics and financial development as an influencing factor of green ecology. Environ. Dev. Sustain. 24, 789–809. doi:10.1007/s10668-021-01469-y
Peng, B., Zheng, C., Wei, G., and Elahi, E. (2020). The cultivation mechanism of green technology innovation in manufacturing industry: From the perspective of ecological niche. J. Clean. Prod. 252, 119711. doi:10.1016/j.jclepro.2019.119711
Shen, Y., Su, Z.-W., Malik, M. Y., Umar, M., Khan, Z., and Khan, M. (2021). Does green investment, financial development and natural resources rent limit carbon emissions? A provincial panel analysis of China. Sci. Total Environ. 755, 142538. doi:10.1016/j.scitotenv.2020.142538
Tang, Z. (2015). An integrated approach to evaluating the coupling coordination between tourism and the environment. Tour. Manag. 46, 11–19. doi:10.1016/j.tourman.2014.06.001
Testa, F., Iraldo, F., and Frey, M. (2011). The effect of environmental regulation on firms' competitive performance: The case of the building & construction sector in some EU regions. J. Environ. Manage. 92 (9), 2136–2144. doi:10.1016/j.jenvman.2011.03.039
Vogel, D. (2000). Environmental regulation and economic integration. J. Int. Econ. LawJournal of International Economic Law 3 (2), 265–279. doi:10.1093/jiel/3.2.265
Wang, L., Su, C. W., Ali, S., and Chang, H. L. (2020). How China is fostering sustainable growth: The interplay of green investment and production-based emission. Environ. Sci. Pollut. Res. 27 (31), 39607–39618. doi:10.1007/s11356-020-09933-4
Wang, Y., Peng, B., Wei, G., and Elahi, E. (2019). Comprehensive evaluation and spatial difference analysis of regional ecological carrying capacity: A case study of the Yangtze River urban agglomeration. Int. J. Environ. Res. Public Health 16 (18), 3499. doi:10.3390/ijerph16183499
Wang, Y., and Zhi, Q. (2016). The role of green finance in environmental protection: Two aspects of market mechanism and policies. Energy Procedia 104, 311–316. doi:10.1016/j.egypro.2016.12.053
Wu, w., Li, S., and Ting, L. (2020). The distortion degree of relative price of factors and the convergence of regional differences. Soc. Sci. Res. 2, 75–83.
Yao, L., Gu, G., Lu, J., and Jiankang, W. (2014). Spatial pattern and regional disparity of regional economic integration and ecology-environmental stress in China. World Reg. Stud. 23 (1), 111–121.
Zhang, J., Li, F., and Ding, X. (2022). Will green finance promote green development: Based on the threshold effect of R&D investment. Environ. Sci. Pollut. Res. 29 (40), 60232–60243. doi:10.1007/s11356-022-20161-w
Zhao, X., Peng, B., Elahi, E., Zheng, C., and Wan, A. (2020). Optimization of Chinese coal-fired power plants for cleaner production using Bayesian network. J. Clean. Prod. 273, 122837. doi:10.1016/j.jclepro.2020.122837
Zhao, Y., Peng, B., Elahi, E., and Wan, A. (2021). Does the extended producer responsibility system promote the green technological innovation of enterprises? An empirical study based on the difference-in-differences model. J. Clean. Prod. 319, 128631. doi:10.1016/j.jclepro.2021.128631
Zhong, Z., Peng, B., and Elahi, E. (2021). Spatial and temporal pattern evolution and influencing factors of energy–environmental efficiency: A case study of Yangtze River urban agglomeration in China. Energy & Environ. 32 (2), 242–261. doi:10.1177/0958305x20923114
Keywords: green investment, green ecology, coupling coordination, spatial autocorrelation, China
Citation: Peng R, Huang H, Ge J and Yan W (2023) Study on the coupling coordination and pattern evolution of green investment and ecological development: Based on spatial econometric model and China’s provincial panel data. Front. Environ. Sci. 10:1095394. doi: 10.3389/fenvs.2022.1095394
Received: 11 November 2022; Accepted: 30 November 2022;
Published: 03 January 2023.
Edited by:
Yuantao Xie, University of International Business and Economics, ChinaReviewed by:
Danish Ahmed, Shanghai Jianqiao University, ChinaCopyright © 2023 Peng, Huang, Ge and Yan. This is an open-access article distributed under the terms of the Creative Commons Attribution License (CC BY). The use, distribution or reproduction in other forums is permitted, provided the original author(s) and the copyright owner(s) are credited and that the original publication in this journal is cited, in accordance with accepted academic practice. No use, distribution or reproduction is permitted which does not comply with these terms.
*Correspondence: Ruikun Peng, dGlhbnlhXzE5NzhAMTI2LmNvbQ==
Disclaimer: All claims expressed in this article are solely those of the authors and do not necessarily represent those of their affiliated organizations, or those of the publisher, the editors and the reviewers. Any product that may be evaluated in this article or claim that may be made by its manufacturer is not guaranteed or endorsed by the publisher.
Research integrity at Frontiers
Learn more about the work of our research integrity team to safeguard the quality of each article we publish.