 Su Liu
 Yuetao Yang2
- 1School of Economics, Zhongnan University of Economics and Law, Wuhan, China
- 2School of Business, Jiangsu University of Science and Technology, Zhangjiagang, China
We provide insights and innovative ideas for China to achieve green development and promote high-quality economic development by studying the impact of air quality on enterprise productivity. This paper uses data from 2008 to 2016 for A-share companies listed on the Shanghai and Shenzhen stock markets, as well as the levels of particulate matter under 2.5 μm in diameter for 214 major Chinese cities. At the same time, this paper innovatively applies regression discontinuity and the Spatial Durbin Model for empirical testing. Considering the endogeneity, we choose the air flow index as an instrumental variable and the generalized space two-stage least squares method for the endogenous test. Additionally, we use dynamic regression and different spatial weight matrix to conduct robustness tests and reselect data from 2008 to 2012 and 2013 to 2016 as samples. Moreover, we test corporate heterogeneity from three perspectives: pollutant type, firm equity, and an industry’s technological level. The results show that the deterioration of local air quality significantly inhibits firm productivity, while the spatial spillover effects of pollution from surrounding cities also have a significant dampening effect on firm productivity. This negative effect is transmitted through research and development innovation capacity, human capital, and government subsidies. This empirical evidence from listed companies can be used for evaluating air quality management to enhance enterprise productivity, as well as to provide policy recommendations for boosting firm productivity through improved air quality.
1 Introduction
Due to modernization, China’s economy has shifted from a stage of high-speed growth to high-quality development. High-quality development has become the primary task for China to move towards Chinese-style modernization. The key to promoting high-quality development lies in the transformation of economic momentum, which means that China must transform from “extensive growth” to “intensive growth.” Moreover, “intensive growth” can be achieved by increasing total factor productivity is regarded as the source of power for high-quality development. At the same time, any development must be based on the premise of protecting the ecological environment. Accelerating green and low-carbon development is the key link to promoting a comprehensive green transformation of economic and social development. As one of the main causes of environmental pollution, air pollution emission has become a matter of concern in academia and government. Therefore, this paper analyzes the impact of air quality on enterprise productivity, which has important theoretical value and practical significance for China to speed up green development to achieve high-quality economic development.
Particulate matter (PM) has become increasingly prominent as regional and composite air pollution and is one of the most significant air pollution sources threatening the health of people worldwide. With the intensification of air pollution, PM2.5, the primary pollutant hazardous to human health, has been receiving increasing attention from the public and governments1 In terms of public health, PM2.5 seriously harms immunity and triggers respiratory and cardiovascular diseases (Kioumourtzoglou et al., 2016). In the urbanization process, for every 10% increase in PM2.5, there are 2.7 outflows per 100 residents (Chen et al., 2017), which exacerbates regional health inequalities and shifts the focus of labor mobility decisions from urban-rural binary choices to multiple choices of healthier zones. Moreover, it has an irreversible impact on the inflow of regional labor and triggers the phenomenon of escaping from “Beijing, Shanghai, and Guangzhou,” which affects the urbanization process (Hanlon, 2016). Additionally, air pollution seriously impacts the stock prices and financial decisions of micro-enterprises (Lepori 2016), the cost of debt financing (Tan et al., 2022), the accrual earnings management (Jiang et al., 2022a; Jiang et al., 2022b), and investment efficiency (He and Lin 2022). Thus, air pollution with PM2.5 as the primary pollutant not only seriously affects regular life but also has a huge negative impact on microeconomic agents in China.
With China’s comprehensive promotion of green and high-quality development, enterprises are not only micro-entities for economic development but also important forces of environmental protection and the main landing point for implementing environmental regulation policies (Lin et al., 2020; Zhang and Liu 2021). For a long time, there have been many highly polluting, inefficient, and energy-consuming enterprises in the urbanization process in China (He et al., 2012) that seek benefits at the expense of air quality. However, López (2017) pointed out that there is a non-linear inverted U-shaped relationship between environmental pollution and income. Aznar and Ruiz (2016) also mentioned that when environmental pollution reaches a certain level, the economy will be difficult to sustain growth. Thus, air quality is closely related to macroeconomic growth; however, there is scant literature that goes deep into the micro-enterprise level, especially the listed company level. Therefore, the impact of air quality with PM2.5 as the primary pollutant on enterprise productivity deserves in-depth exploration to achieve high-quality economic growth from an ecological perspective.
Based on the above, this study empirically tests the impact of local air quality and spillover from surrounding cities on enterprise productivity using regression discontinuity and the spatial Durbin model (SDM) by selecting the PM2.5 as a proxy variable for air quality, with enterprises as micro subjects. Considering the endogeneity, we choose the air flow index as an instrumental variable and the generalized space two-stage least squares (GS2SLS) method for the endogenous test. Then, a series of robustness tests are conducted using the dynamic Gaussian mixture model (GMM) regression, using different spatial weight matrix and reselecting data from 2008 to 2012 and 2013 to 2016 as subsamples. The impact of air quality on firm productivity is explored from three perspectives: research and development (R&D) innovation capacity, human capital, and government subsidies. Furthermore, we test corporate heterogeneity from three perspectives: pollutant type, firm equity, and the technology industry.
This paper makes valuable contributions to the existing literature in four aspects. First, most of the previous studies examined the impact of air pollution from macroscopic aspects such as economic development and human health, and few of them involved enterprise productivity in the microscopic field. Therefore, this research provides important perspectives and ideas for China to promote high-quality economic development through green development. Second, this study not only analyzes how air quality affects enterprise productivity using regression discontinuity but also examines the impact of spatial spillover effects brought about by air pollution on listed enterprise productivity using the SDM and GS2SLS, to fully understand the relationship from the spatial perspective. Third, in terms of using data and selecting variables, most of the existing literature has used industrial enterprise databases; this study, however, uses micro-sample data of listed companies to measure the response variables and the PM2.5 obtained from ArcGIS software to measure the core explanatory variable of air quality, to avoid data manipulation and human measurement bias. Finally, this paper thoroughly analyzes the impact mechanism, clarifies the transmission pathway between air quality and enterprise productivity from the three intermediary mechanisms of R&D innovation capability, human capital effect, and government subsidy, and provides a useful supplement to the existing literature.
2 Literature review and mechanism analysis
Since Grossman and Krueger (1995) proposed the theory of the environmental Kuznets curve, many scholars have examined the relationship between air pollution with economic development and human health or behavior. For instance, about air pollution and economic development, Ibukun and Omisore (2022) proved that there is a bidirectional causal relationship between air pollution and economic development through the data of four MINT countries. Hu Q. et al. (2021) attributed it to the huge medical expenditure caused by air pollution. Shang et al. (2022) found that air pollution will also seriously restrict the development of a circular economy, lead to the outflow of foreign direct investment (Huang and Hsu 2022), reduce the upgrading of regional industrial structure (Zhang et al., 2022), and exacerbate the income gap (Liu et al., 2020).
On the other hand, air pollution seriously damages human physical health (Hassan et al., 2021) and mental health (Hu X. et al., 2021). For example, Hu and Guo (2021) systematically investigated the negative impact of air pollution on human health from the respiratory, urinary, circulatory, digestive, and nervous systems, as well as the probability of conception and life expectancy. Liu et al. (2021) considered human health as the transmission mechanism through which air pollution affects human wellbeing. Shen et al. (2021) found that air pollution greatly increased the possibility of depression; sad emotions, poor self-control, and comprehension are all seriously affected by air pollution (Balakrishnan and Tsaneva 2022). At the same time, air pollution can also have a serious impact on human behavior. Lin et al. (2022) found that air pollution makes people get jobs nearby, and it also makes people move away from heavily polluted residential areas (Yang et al., 2022), and even increases people’s crime rate (Kuo and Putra 2021).
However, Chang et al. (2016) showed in a study of a pear-packing plant that PM 2.5 with high penetration capacity in outdoor air significantly reduced the productivity of indoor workers, while pollutants with low penetration capacity (e.g., ozone) had almost no significant effect. Therefore, after a deep investigation, it was found that the impact of PM2.5 seems to have more importance.
In recent years, with deeper mining of firm-level data, many articles have delved into the micro domain to assess the impact of air pollution on enterprise development. For example, Xue et al. (2021) studied the relationship between air pollution and corporate human capital and they found that people are more inclined to seek jobs in less polluted locations. Liu et al. (2022) used human capital as the influencing mechanism to verify the negative effect between air pollution and corporate social responsibility. Tan et al. (2021) proved that air pollution reduces the liquidity of corporate property and the decision-making efficiency of operators, thus making companies need to hold more cash to resist unknown risks. Li et al. (2022) also found that air pollution increases the number of zombie firms and decreases corporate investment efficiency. Cui et al. (2021) investigated the location of enterprises’ foreign investment and found that foreign-invested enterprises are more willing to choose countries with good air quality to invest.
According to the literature, we can note that previous studies on the impact of air pollution focused more on macro aspects such as economic development and human health. Although some articles have gone into the microscopic field to assess the impact of air pollution on enterprise development, few have dealt with enterprise productivity. Cao et al. (2022) only studied the impact of air pollution on enterprises in the Yangtze River Delta region of China, while this paper expands the research perspective to listed companies in China, and examines the impact of spatial spillover effects brought about by air pollution on the productivity of listed companies. Thus, using a case study from China, we empirically investigate the impact of air quality (PM2.5) on listed firm productivity through the intermediate mechanisms of R&D innovation capacity, human capital, and government subsidies as follows.
1) PM2.5 can reduce enterprise productivity through R&D innovation capabilities. Akpalu and Normanyo (2017) found that mining areas will provide some environmental subsidies or increase the amount of medical insurance to compensate people affected by air pollution, Wang L. et al. (2021) and Lin et al. (2021) also found that to prevent brain drain caused by air pollution, companies will improve employee treatment, which increases the additional cost of enterprises, resulting in the reduction of investment funds for enterprise innovation. Wei and Liu (2022) attributed the negative effects of air pollution and innovation ability to labor costs, while Ai et al. (2022) subdivided this cost into internal pollution control costs and external pollution prevention costs. You (2022) proved by examining the structure of the three major industries that air pollution mainly affects the structure of the tertiary industry, thereby inhibiting the level of urban innovation. On the other hand, Tuncel and Oktay (2022) demonstrated that Turkish manufacturing firms improved their productivity through increased spending on innovation. Zhu et al. (2021) divided innovation into possibility innovation brought by R&D and process innovation brought by information and communication technology and proved that both innovations can improve enterprise productivity. However, Mishra et al. (2021) believe that product innovation and process innovation can improve enterprise productivity, while organizational innovation only brings negative effects. Fazlıoğlu et al. (2019) divide innovation into innovation input and innovation output. Since innovation input needs certain conditions and time to transform into innovation output, the latter can promote productivity more than the former.
2) PM2.5 reduces enterprise productivity through the human capital effect. Balakrishnan and Tsaneva (2021) described the level of human capital from the three aspects of basic learning skills, academic performance, and school grades, and found that air pollution has an adverse impact on it; Liu and Yu (2020) found that air pollution affects the physical health, mental health, and job satisfaction of workers, thereby reducing the willingness of migrants to settle in cities, and causing the loss of corporate talent, especially high-performance employees (Tan and Yan 2021). Similarly, Lai et al. (2021) found that air pollution greatly increases the probability of college graduates going to other cities for employment from the selection of employment locations of college graduates, leading to the loss of higher education talents. Chen et al. (2022) proved that air pollution has caused a sharp increase in the number of net immigrants in China, and people with higher education are also the main group of population loss. Air pollution mainly affects the level of human capital through the loss of population, especially the loss of high-quality and higher education talents. High-quality talents have richer management experience (Timothy 2022), and can better exert the corporate brand value (He et al., 2020). Therefore, when there is a shortage of high-quality talent, it will have a serious impact on the innovation ability of enterprises and the upgrading of industrial structure (Wang M. et al., 2021), thereby reducing productivity (Ramirez et al., 2020).
3) PM2.5 can reduce enterprise productivity through increasing government subsidies. Li et al. (2019) found that air pollution will stimulate the government to actively participate in the control of air pollution and increase government subsidies for environmental pollution. Similarly; Zhang and Zhang (2022) from the perspective of the iron and steel industry believe that the iron and steel industry will cause serious air pollution, so the government should implement active subsidy policies. It can be seen that in order to improve air pollution, the government often invests a lot of money (Xie and Wang 2019). However, government subsidies may lead to information asymmetry and adverse selection problems, leading to market failure, since enterprises receiving government subsidies are not entirely determined by the market but are also influenced by the relationship between the government and the enterprise (Fox and Heller 2000). To obtain more compensation, enterprises may overstate the degree of air pollution, resulting in rent-seeking behavior by some enterprises (Mao and Xu 2018). When enterprises engage in rent-seeking activities, they will incur corresponding costs. These non-productive expenditures will not only reduce the compensatory effect of government subsidies (Tassey 2004), but also not conducive to the formation of competitive advantages for enterprises, and will also reduce the profitability of enterprises (Ren and Zhang 2013), thus hindering the improvement of enterprise productivity.
Based on the above discussions, air quality has an impact on firm productivity. Therefore, we propose the following hypotheses:
Hypothesis 1: PM2.5 (as measured by the air quality) reduces firm productivity.
Hypothesis 2: The main channels by which PM2.5 reduces firm productivity are (1) reducing R&D innovation capacity, (2) reducing the number of employees, and (3) increasing government subsidies.
3 Methods and data
3.1 Regression discontinuity
This study refers to Chen et al. (2013) and uses a quasi-natural experiment on centralized heating policies in winter in northern China (north of the Qinling-Huaihe River boundary) to address the possible endogeneity problem between air pollution and firm productivity using regression discontinuity and Stata software. The reason for choosing the Qinling-Huaihe River is that there is a significant difference in the average January temperature between the south and north areas of the boundary; therefore, the centralized heating policy in winter in the north is an exogenous policy in a quasi-natural experiment. This study sets the following estimating equation.
where c denotes the city; the explanatory variable
3.2 Spatial effects regression
Referring to Tang et al. (2017), there is a spatial autocorrelation effect of environmental pollution in cities. Therefore, considering that firm productivity is affected by local urban air pollution and also by the spatial spillover effects of air pollution from other cities, we use local pollution and pollution from surrounding areas as the core variables to explore the total impact of local firm productivity by local pollution and pollution spillover from surrounding areas. Through the Moran index, it can be shown that there is a spatial autocorrelation effect of air pollution PM2.5 in the city where the enterprise is located, and this is consistent with the conclusions obtained by Fan et al. (2019) through the spatial correlation of haze pollution measurement3 Next, we add a spatial econometric model, as shown in Equations 5, 6.
where
3.3 Variables
The subject of this study is firm productivity, traditionally measured using ordinary least squares and fixed effects; however, these two methods may cause serious bias and endogeneity problems. There are two semi-parametric methods of OP and LP proposed by Olley and Pakes (1996) and Levinsohn and Petrin (2003) to estimate firm productivity. In the OP method, it is assumed that a manufacturer’s investment is a strictly increasing function of its own productivity, so the corresponding productivity can be determined by deriving the inverse function of the investment demand function. The OP method introduces survival probability and investment amount as proxy variables to solve the problems of selectivity and simultaneity bias, but the firm’s real investment value must be greater than zero. Thus, samples with zero investment are not estimated. However, as not every firm invests every year, many firm samples are discarded in the estimation process. Meanwhile, the LP method has lower data requirements. It does not use the amount of investment as a proxy variable and can instead use the input indicators of intermediate goods, which allows the researcher the flexibility to choose data. Therefore, we measure firm productivity using the LP method to determine the response variables in the benchmark regression.
The core explanatory variable in this study is air quality, as measured by the PM2.5. Air pollutants currently emitted in China are mainly sulfur dioxide, carbon dioxide, soot, and PM. Since the PM2.5 can synthetically include the above pollutants emitted from the combustion of fuels and further chemical reactions in the air, it is useful for the analysis of gaseous pollutants emitted from production enterprises and suitable for measuring air quality. Owing to the short time span and difficulty in obtaining pollution data in China, there may be problems such as data manipulation and falsification. Therefore, we used the world PM2.5 density map from 1998 to 2016, publicly available at the Data Center of the Astronaut Earth Observing System Data and Information System hosted by Columbia University4 Then, we positioned each raster to municipal administrative units by ArcGIS software, and then averaged the raster data falling in the municipal administrative units as the value of PM2.5 emission concentration of cities. Unlike ground-observed air pollution data, satellite-extracted data are better able to match mobile population data in time and space while avoiding problems such as data manipulation and human measurement bias (Ghanem and Zhang 2014).
Based on the mechanism analysis, we select the number of patent applications, number of enterprise employees, and government subsidies as mediating variables to represent the enterprise R&D innovation effect, human capital effect, and policy spillover effect, respectively, to test the mechanism of the effect of air quality on enterprise productivity. Among them, enterprise patents include three types of invention patents, utility model patents, and design patents. We choose the sum of three types of patent applications plus one to take the logarithm to measure the number of enterprise patent applications (Hall and Harhoff 2012); to narrow the data differences and obtain smoother data, the number of enterprise employees and government subsidies are logarithmically processed in this study.
In addition to the required variables to estimate air pollution and firm productivity, we include the following control variables. (1) Firm size. As the size of the firm increases, the firm will have a higher scale effect, stronger finances, a more standardized management system, and usually higher firm productivity (Lucas 1978; Majumdar 1997). (2) Return on total assets. We choose the ratio of the firm’s net profit for the year and total assets at the end of the period to measure the return on total assets. The more profitable a firm is, the more likely it is that sufficient funds will be available for R&D innovation and high-quality production activities (Bogliacino and Pianta 2013). (3) Fixed assets ratio and capital expenditure ratio. Fixed assets are a category of assets formed when capital expenditure is capitalized. When the fixed assets ratio or capital expenditure ratio is lower, the liquidity of the enterprise’s assets is faster and the capital operating capacity is stronger (Wang 2002). (4) Current gearing ratio and gearing ratio. Both reflect a firm’s financing constraint ability to a large extent. When the current gearing ratio is lower, the firm may face higher financial risk, which reduces productivity (Ayyagari et al., 2010). (5) Cash flow. In general, cash flow has a positive effect on firm productivity, and firms maintain a certain amount of cash flow to avoid the shortage of funds (Chen and Guariglia 2013). (6) Firm age: There may be two effects of firm age on firm productivity. On the one hand, as firms age, they accumulate more technical information, beneficial to firm productivity (Farinas and Moreno 2000). On the other hand, new market entrants may be more dynamic; in this case, firm productivity decreases as firms age (Brandt et al., 2012). Therefore, we add firm age and the squared terms of firm age as control variables. The specific expressions are shown in Table 1.

TABLE 1. Expression of variables.
3.4 Data
Considering that the data on listed companies in China before 2007 are missing and/or inadequate, the sample period selected for this study is 2008–2016. Our sample includes A-share companies listed on the Shanghai and Shenzhen stock markets by securities code and year identifier. We processed the data by removing the following: (1) missing control variables, (2) enterprises established after the listing time, and (3) and financial and insurance services and enterprises containing ST, ST*, and PT categories5 Then, the filtered data were matched with the PM2.5 level for 214 major cities. Next, most of the variables were logarithmically processed, resulting in a final sample of 8,594 observations from the 1,829 enterprises listed. Table 2 reports the descriptive statistics of all variables. To determine the viability of the variables, we performed multicollinearity and heteroscedasticity tests; the results showed that we did not need to worry about multicollinearity and homoscedasticity among the variables6
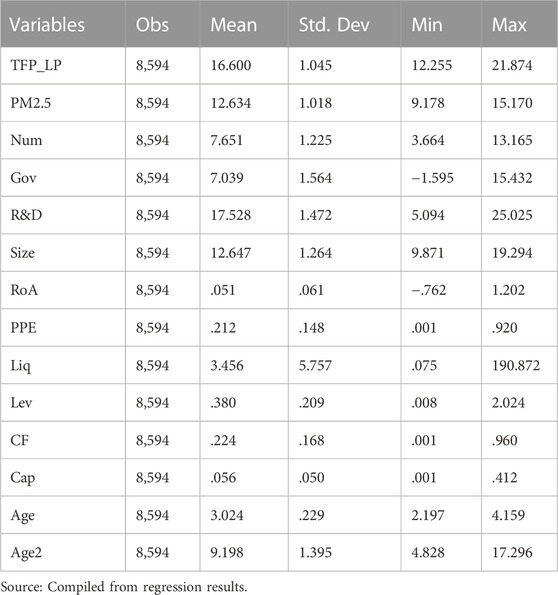
TABLE 2. Descriptive statistics.
4 Empirical results
4.1 Regression discontinuity results
Before conducting regression discontinuity estimation, it is first observed whether air pollution and firm productivity show discontinuity change and the results are shown in Figure 1. Figure 1 shows that regardless of whether the fit is linear or quadratic, both the productivity and PM2.5 of enterprises jump significantly at the discontinuity, that is, the PM2.5 emissions in the northern region are significantly higher than those in the southern region, this conclusion agrees with the findings of Chen et al. (2013). While the enterprises in the southern region have significantly higher productivity, indicating that relatively good air quality is beneficial to enterprise productivity. In addition, to accurately identify the causal relationship between variables, we also perform an endogeneity test in the 5.3 section.
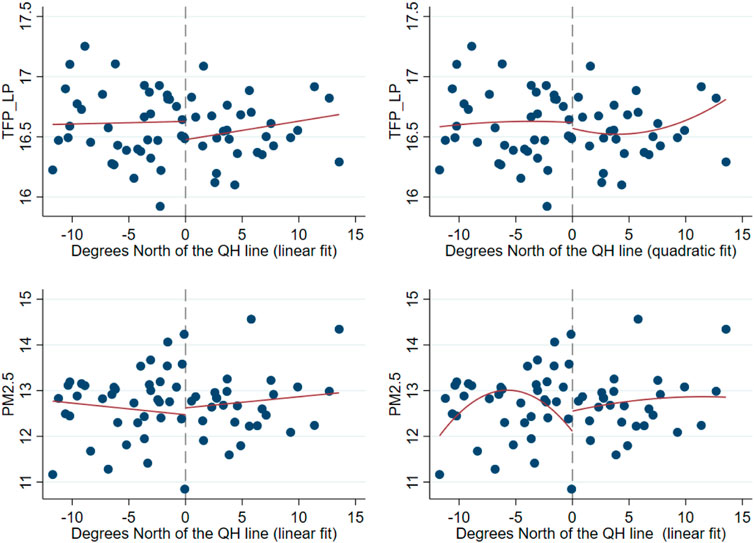
FIGURE 1. Discontinuity diagram of enterprise productivity and PM2.5 at the Qinling-Huai River boundary. Source: Compiled from regression results.
The results of this estimation are reported in Table 3; column (1) shows that the central heating policy has a significant impact on enterprise productivity, that is, the central heating policy makes the enterprise productivity in the southern region significantly higher than that in the northern region at the level of 1%. When control variables and fixed effects are added in columns (2) and (3), the regression results do not change significantly. Similarly, the results in column (4) show that the central heating policy has a significant impact on air pollution. After introducing control variables and controlling for fixed effects in columns (5) and (6), the central heating policy makes the average PM2.5 concentration in the southern region about 0.23 µg/m3 lower than that in the northern region. The estimation results in column (7) show that air pollution significantly reduces the productivity of enterprises. Columns (8) and (9) gradually add the corresponding control variables and fixed effects, and the regression results are all significant at the 1% level, that is, with every 1% increase in PM2.5 concentration, firm productivity decreases by 0.32%.
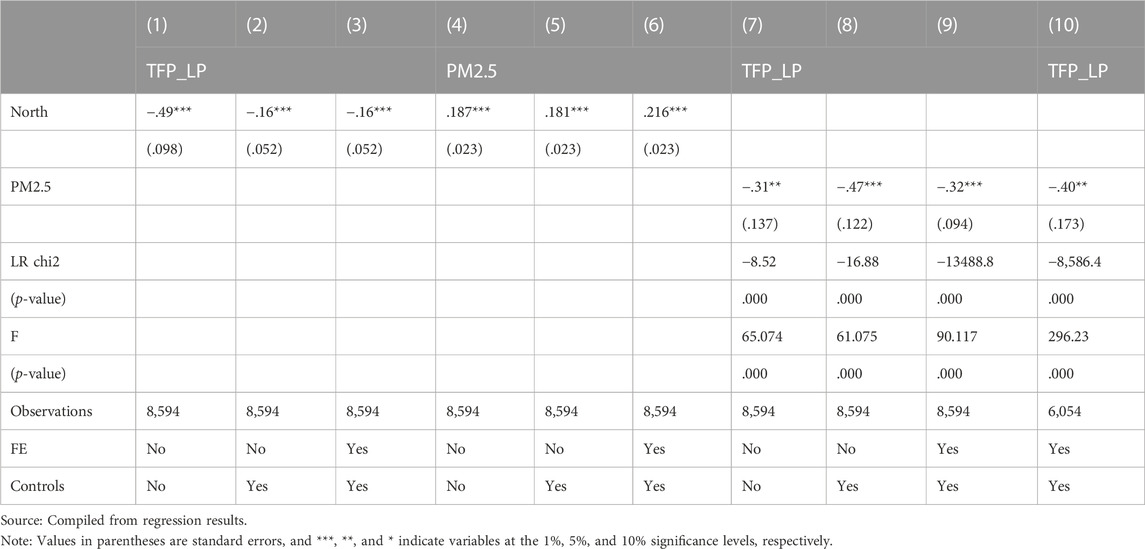
TABLE 3. Regression Discontinuity test.
In addition, we consider the air quality index (AQI) as a surrogate indicator of air pollution PM2.5 for robustness testing, which monitors six pollutants: sulfur dioxide, nitrogen dioxide, PM10, PM2.5, carbon monoxide, and ozone. We take the natural logarithm of AQI, and the regression results are reported in column (10) of Table 3. The results show that after adding a series of control variables and fixed effects, AQI still significantly reduces enterprise productivity, which is consistent with the explanatory variable PM2.5, showing the robustness and reliability of the conclusions.
4.2 Dynamic regression
Considering that firm productivity may be affected by its own lags, the model is constructed to examine its dynamic effects, as expressed in Equation 7.
Eq. 7 indicates that the productivity of firm i in year t-1 will affect that in year t. As indicated in column (1) in Table 4, the coefficient of PM2.5 is −0.01, which is highly significant. In addition, the coefficient of TFPi,t-1 is significantly positive. This result implies that the higher a company’s productivity in the previous year, the higher its productivity in the second year; that is, it has a certain “inertia.”
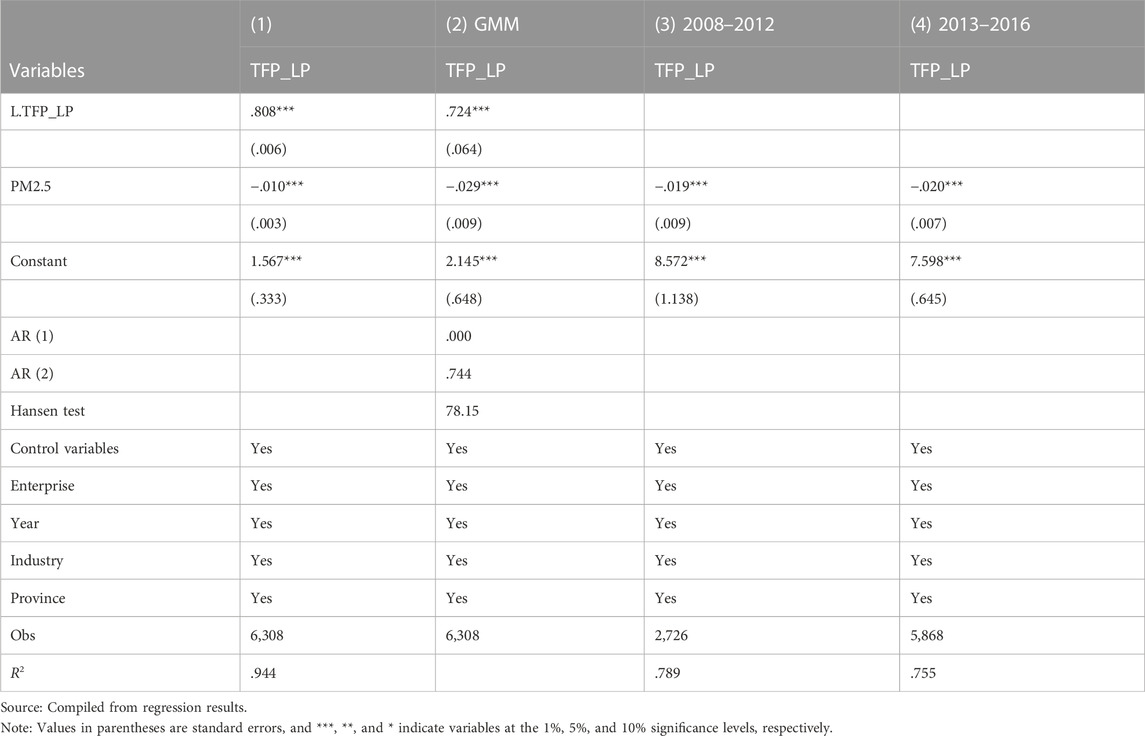
TABLE 4. Robustness test.
Considering unobservable individual effects, this may lead to inconsistent estimation results and endogeneity problems. In dynamic regression, GMM tests are generally used to solve the endogeneity problem, but compared to the systematic GMM, the instrumental variables of differential GMM are often weak. Therefore, we use the systematic GMM method to re-estimate this model to solve the endogenous problem of fixed effects (Blundell and Bond 1998), as presented in column (2) of Table 4. The regression results of the systematic GMM show that the first-order lagged terms of the explanatory variables pass the significance test, and this result is consistent with the fixed effects regression results, which indicate that an increase in PM2.5 effectively reduces firm productivity, further strengthening the reliability of our results.
In addition, at the theoretical level, the systematic GMM test needs to satisfy two hypotheses. First, the validity of the instrumental variables used is tested by the Sargan or Hansen overidentification constraint test, based on the original assumption that the instrumental variables are uncorrelated with the error term. The p-value of the Hansen test is greater than 0.1 in column (2) of Table 4, indicating that the null hypothesis is accepted; that is, the instrumental variables of the systematic GMM model are valid. Second, the second-order serial correlation of the random error terms of the difference equation is tested by the Arellano-Bond autocorrelation test, where the original hypothesis is that there is no second-order serial correlation in the random error terms of the first-order difference equation. If the original hypothesis is not rejected, it implies that the instrumental variables are valid and the model is set up correctly. Therefore, we need to focus on the p-value of the second order autoregressive model (AR (2)). The p-value of the AR (2) test in column (2) of Table 4 is greater than 0.1, indicating that the null hypothesis is accepted; that is, there is no second-order autocorrelation problem in the residual term of the systematic GMM model difference, and the model setting is reasonable.
4.3 Adjusting the sample period
Owing to the global financial crisis in 2008, China’s economic growth rate has dropped significantly since 2013 and has entered a new normal mode. Therefore, we reselect the data from 2008 to 2012 and from 2013 to 2016 as samples to eliminate exogenous effects and shocks caused by the financial crisis and new economic normal. Table 4 presents the regression results, with air pollution still having a significant inhibitory effect on corporate productivity, consistent with previous empirical findings.
5 Spatial econometric regression results
5.1 SDM regression results
Table 5 shows the selection process of the spatial effects model and the corresponding regression results. First, from the log-likelihood function values, the SDM has greater values than the spatial lagged model (SLM) and the spatial error model (SEM), which indicates that the SDM model is the best fit. Second, we test whether the SDM model degrades to the SLM or SEM model, and the likelihood ratio (LR) and Wald statistics both reject the original hypothesis at the 1% level, indicating that the SDM model cannot degenerate into an SLM or SEM model. Therefore, the SDM is determined to be most suitable for this study.
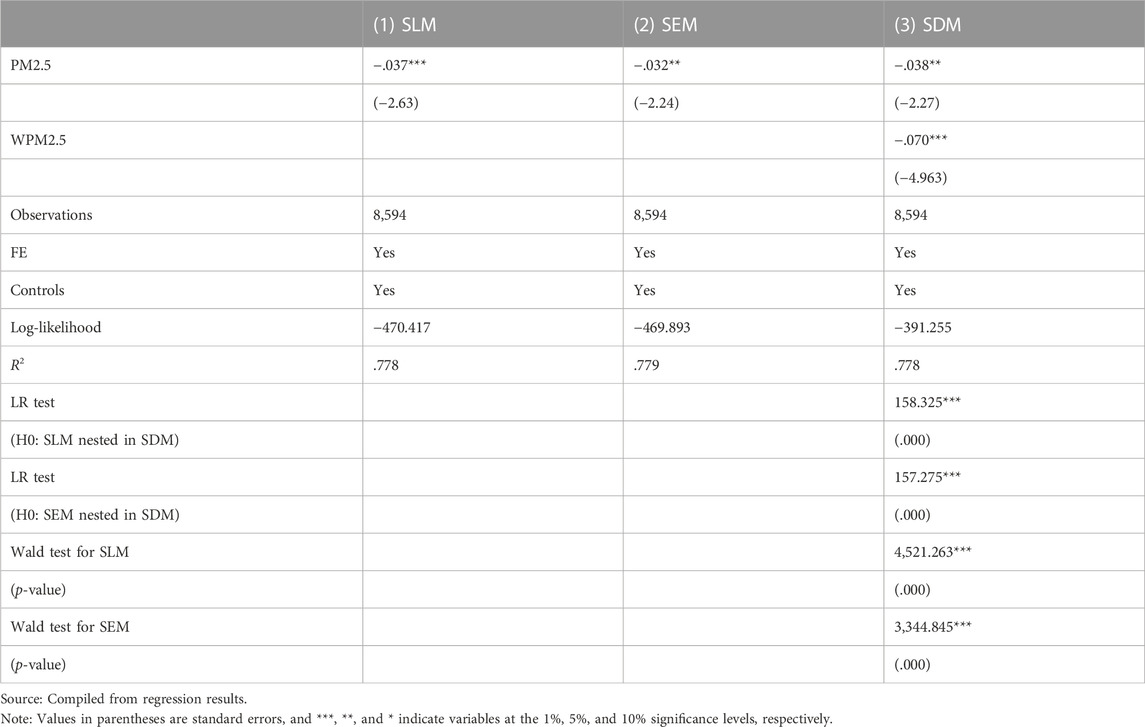
TABLE 5. Spatial Durbin Model Regression test.
Based on the existence of spatial autocorrelation of pollution in the city where the firm is located, column (3) of Table 5 reports the regression results of PM2.5 in the city where the firm is located and pollution spillover from surrounding cities on firm productivity under the SDM. The results show that both PM2.5 in the firm’s city and pollution spillover from surrounding cities significantly reduce firm productivity, indicating that firm productivity is not only negatively affected by local air pollution but also by PM2.5 spillover from surrounding cities.
5.2 Considering different regions and spatial weight matrix
China’s regional development is unbalanced and the terrain system is extremely complex; we should not ignore the differences in different regions. Therefore, this paper divides enterprises into 11 eastern enterprises such as Beijing, eight central enterprises such as Shanxi Province, and 12 western enterprises such as Sichuan Province according to the provinces where the enterprises are located7 and investigates the impact of PM2.5 on enterprise productivity in different regions. Meanwhile, purely distance-based spatial weights cannot effectively capture spatial relationships, especially if the phenomenon is environmental in nature. Therefore, in addition to the inverse distance spatial weight matrix W1 calculated by latitude and longitude, we also select the economic distance type spatial weight matrix W2 constructed by urban per capita GDP and the economic-geographic distance type spatial weight matrix W3, constructed by multiplying the two and normalizing the result.
According to the regression results in Table 6, under the three spatial weight matrix settings, the productivity of enterprises in the eastern, central, and western regions will be negatively affected by PM2.5. Poor air pollution will have a greater negative effect on the productivity of eastern enterprises, indicating that enterprises in eastern provinces are more sensitive to air pollution. In addition, the WPM2.5 coefficient is significantly negative at the levels of 1%, 5%, and 10%, indicating a significant spatial correlation between air pollution at similar geographical locations or similar levels of economic development. Pollution spillover from surrounding areas has a negative spillover effect on the productivity of enterprises in the central area, and enterprises in the central and western regions are more affected by PM2.5 in surrounding cities.
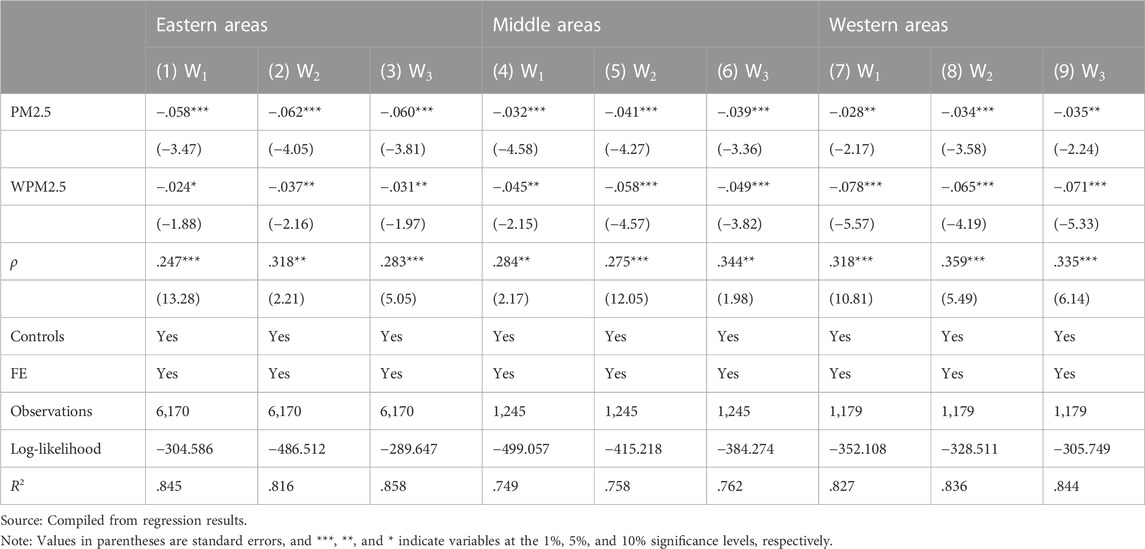
TABLE 6. SDM Regression test: Considering different region and spatial weight matrix.
5.3 Endogeneity test with GS2SLS
Although regression discontinuity can effectively solve the endogeneity problem, it can only be locally random (near the discontinuity), resulting in weak external validity. We have to further consider the endogeneity of the air pollution question. Specifically, on the one hand, air pollution may drag down enterprise productivity by affecting the human capital, government subsidies, and R&D innovation capabilities; on the other hand, enterprise productivity itself may also affect air pollution levels through factors such as economic activities and population aggregation. Therefore, in order to solve the endogeneity problem, referring to Broner et al. (2012); Hering and Poncet (2014), we use the air flow coefficient (Airflow) as an instrumental variable of air pollution. The reason for this is that air mobility is correlated with air pollution, and the air mobility coefficient depends on wind speed and atmospheric boundary layer height, which is not directly related to enterprise productivity, thus satisfying the validity and exogenous assumptions of instrumental variables (Broner et al., 2012; Hering and Poncet 2014). Meanwhile, we use GS2SLS to effectively control for endogeneity and spatial spillover effects.
The regression results are shown in Table 7. We still conduct inspections from the east, middle, and west, and report the GS2SLS two-stage estimation results based on the economic-geographical weight matrix (W3)8. All the regressions control for the control variables presented above and the fixed effects of year and city. According to the first-stage regression results, air flow is significantly negatively correlated with PM2.5 concentration, indicating that stronger air flow is more conducive to alleviating air pollution. The LM statistic and p-value at the 1% significance level rejected the null hypothesis of “no endogeneity in explanatory variables,” indicating that air pollution is an endogenous variable and that the endogeneity issue must be addressed in this paper. Furthermore, the F statistic is much greater than 10, indicating that air flow and PM2.5 are highly correlated, and thus rejecting the null hypothesis of “instrumental variables are weak instrumental variables.”
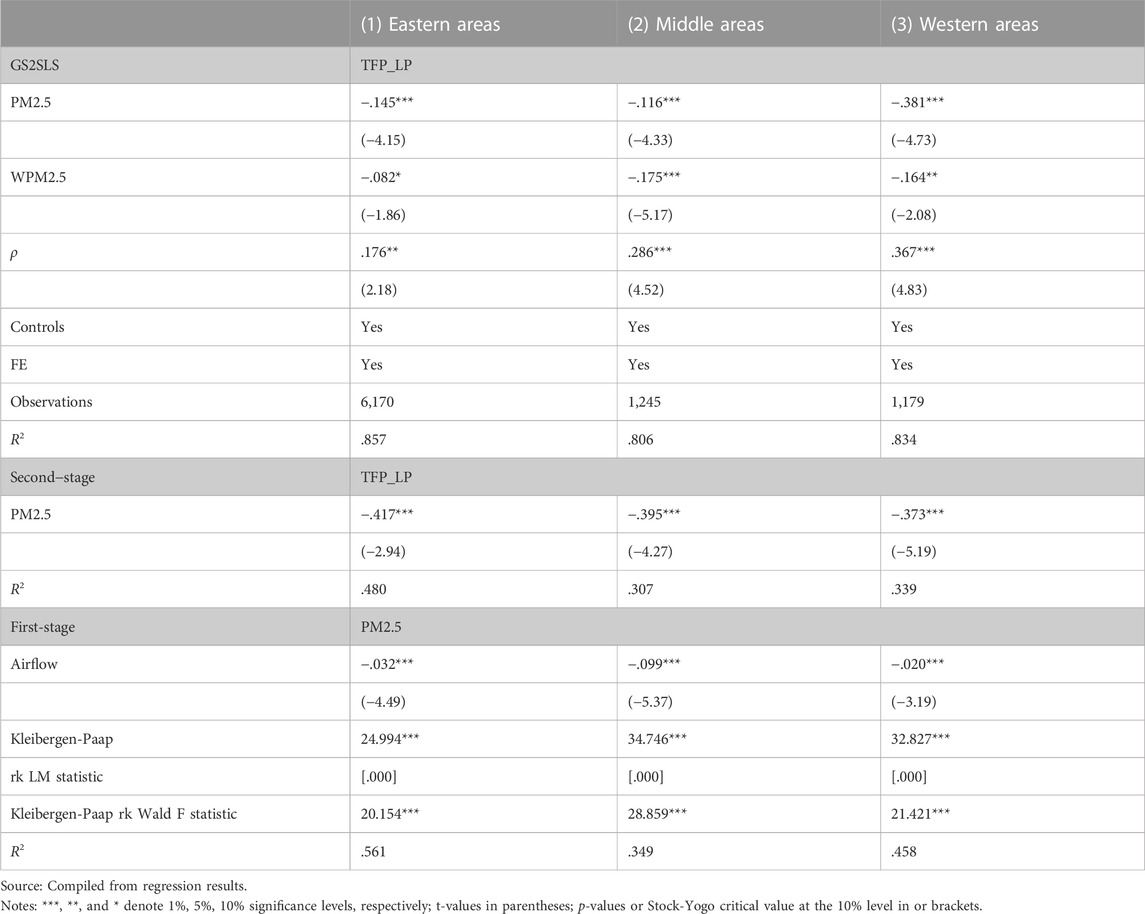
TABLE 7. Endogeneity test with GS2SLS.
In the regression results of the second stage, PM2.5 significantly inhibited enterprise productivity. In terms of spatial latitude, the coefficient estimation result of the spatial lag variable WPM2.5 based on the nested weight matrix W3 of economic-economic-geographical distance is significantly negative at the levels of 1%, 5%, and 10%, indicating that air pollution in surrounding cities has a significant negative spatial spillover effect on the productivity of firms located in central cities. It is consistent with the basic regression results, indicating that the conclusions are still reliable after dealing with the endogeneity issue.
6 Analysis of heterogeneity
6.1 Distinguishing investigation based on pollutant type
Different air pollutants may have different impacts on firm productivity. In this study, we match existing data with the newly released environmental research data of listed companies in the CSMAR database to obtain information such as emissions of listed companies by subdivision. However, after distinguishing the subsamples of two air pollutants, sulfur dioxide and soot emissions, only a small amount of data remains, as shown in columns (1) and (2) of Table 8. The regression results show that the coefficients of both air pollutants are negative, but neither is significant. To compensate for the above lack of sample size, this study collects sulfur dioxide and soot emissions from each city to match the existing data, as shown in columns (3) and (4) of Table 8. From the regression results, it can be seen that the data collected from each city and the data from the CSMAR database of environmental studies of listed companies are consistent, that is, the coefficients of sulfur dioxide and soot emissions are both negative, but neither is significant. This indicates that these two air pollutants bring much less inhibitory effect on firm productivity compared to PM2.5, which reflects the importance of choosing PM2.5 as the core variable in this study.
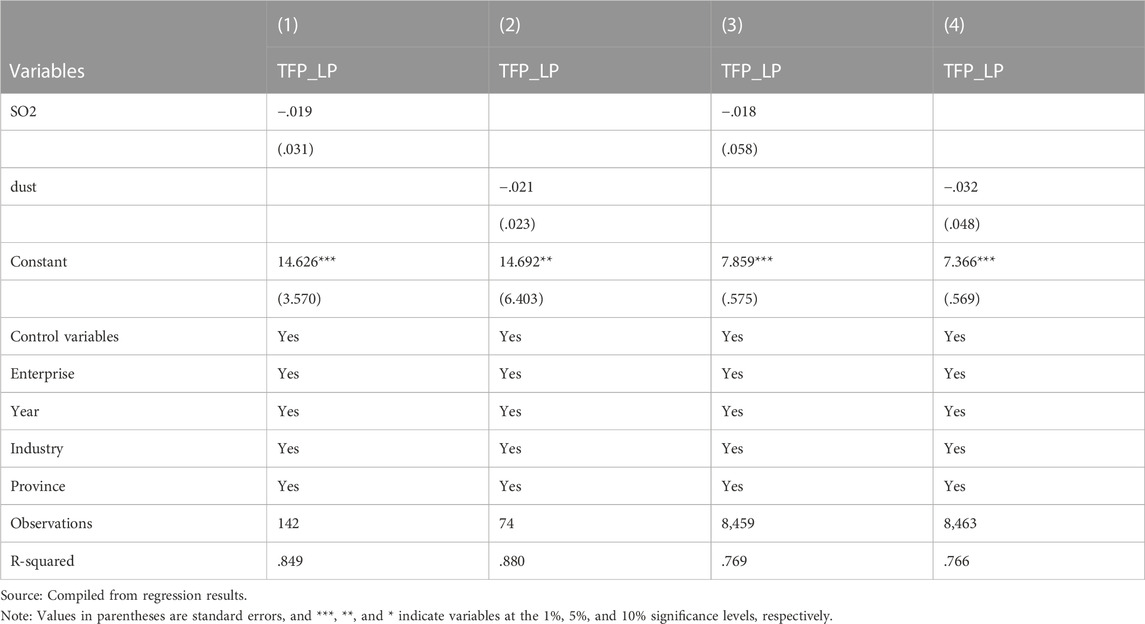
TABLE 8. Heterogeneity: Pollutant type.
6.2 Distinguishing investigation based on equity and technical level
By the end of 2020, the total assets and operating income of state-owned enterprises (SOEs) in China reached 218.3 and 59.5 trillion yuan, respectively, and their average annual growth rate during the “13th Five-Year Plan” period was 12.7% and 7.4%, respectively. After years of reform and development, SOEs have laid a solid foundation for China’s new stage of development. Simultaneously, the rapid development of the non-public sector has played a pivotal role in labor employment, technological innovation, national taxation, and economic development. Compared with SOEs, the vitality of non-SOEs is more affected by external policies and the environment. Meanwhile, compared with non-SOEs, the factor market price distortion of SOEs is more serious. Therefore, what is the difference in the impact of air quality on the productivity of SOEs and non-SOEs? For a better comparative analysis, columns (1) and (2) of Table 9 report the results of these two types of samples. The results show that the coefficient of PM2.5 is significantly negative at the 1% level, indicating that air pollution reduces productivity in SOEs and non-SOEs, with a greater impact on SOEs. Possibly, in China, the central and local governments control or invest in SOEs, which are not as sensitive as non-SOEs with respect to the cost pressure caused by air pollution control and the green innovations required to improve air quality. In addition, compared with non-SOEs, SOEs have insufficient information on the improvement of air quality, since the free flow of production factors is not flexible enough and the efficiency of resource reallocation is not high enough, which causes air pollution to have a greater impact on the productivity of SOEs.
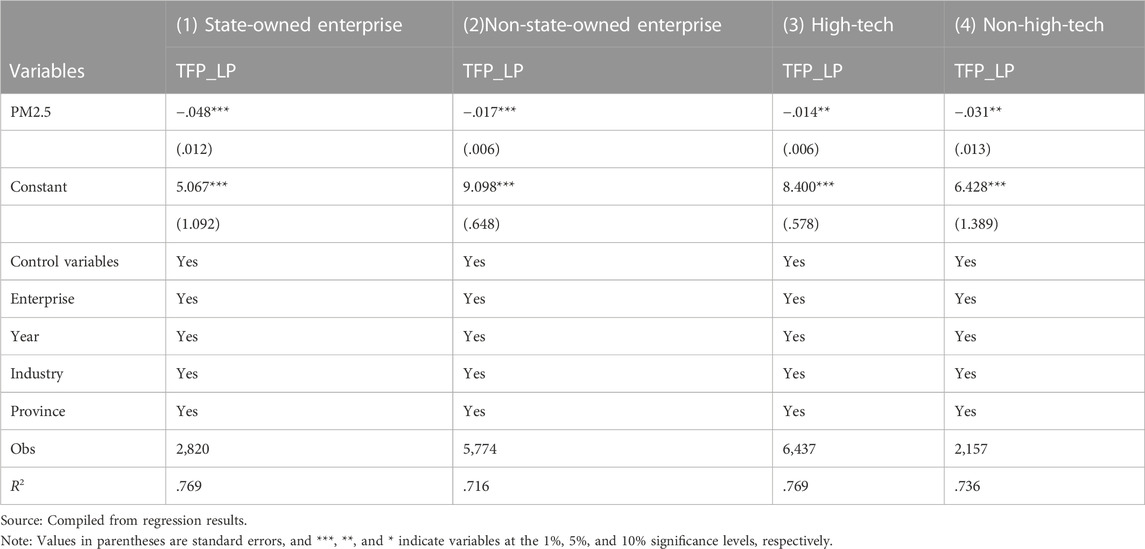
TABLE 9. Heterogeneity: Equity and technical level.
Further, innovation is the first driving force for development. Generally, high-tech enterprises have a strong sense of innovation and carry out R&D activities continuously to enhance their core independent intellectual property rights. Columns (3) and (4) of Table 9 report the regression results of dividing the total sample into high-tech and non-high-tech companies, according to their industry category. The results indicate that the coefficients of PM2.5 are all significantly negative. Specifically, the former coefficient is −0.014, and the absolute value is smaller than the latter’s coefficient of −0.031. This shows that air pollution reduces the productivity of enterprises in all industries. Compared with enterprises in high-tech industries, air pollution has a higher negative impact on enterprises in non-high-tech industries, which is contrary to the research of Cao et al. (2022). One possible reason is that human capital capabilities and contribution to corporate productivity of high-tech companies are greater. Therefore, in the face of air pollution, companies will try to make up for the environmental requirements of high-quality labor, and the productivity of high-tech enterprises will not be hit as badly as that of non-high-tech enterprises.
7 Analysis of influence mechanism
Based on the influence of air quality on enterprise productivity, this study analyzes how air quality affects enterprise productivity. According to a previous analysis, a mediation effect model was constructed. As expressed in Equations 8, 9,
where Med_var represents the mechanism test variable, including the human capital (Num), number of patent applications (R&D), and government subsidies (Gov). Table 10 reports the results of the mechanism tests. Columns (1), (3), and (5) report the regression results of formula (8); columns (2), (4), and (6) report the regression results of formula (9). In the test with R&D as the mediating variable, in column (1), R&D is negatively significant with respect to PM2.5 at the 1% level, indicating that R&D investment is negatively correlated with air pollution; in column (2), R&D and TFP_LP are positively significant at the 5% level, indicating that R&D investment is positively correlated with enterprise productivity; PM2.5 is negatively significant with respect to TFP_LP at the 1% level, indicating that air pollution will reduce TFP_LP by reducing R&D. R&D investment partially mediates air pollution and firm productivity. Similarly, in the tests in columns (3) and (4) with the Num as the mediating variable, Num is significantly negative with respect to PM2.5 and TFP_LP at the 1% level, and PM2.5 is significantly negative for TFP_LP at the 5% level; in columns (5) and (6) in the test with Gov as the mediating variable, Gov is significantly positive with respect to PM2.5 at the 1% level and significantly negative with respect to TFP_LP at the 5% level. Further, PM2.5 is significantly negative with respect to TFP_LP at the 1% level. The above results also show that air pollution can hamper productivity by reducing the number of employees and increasing government subsidies.
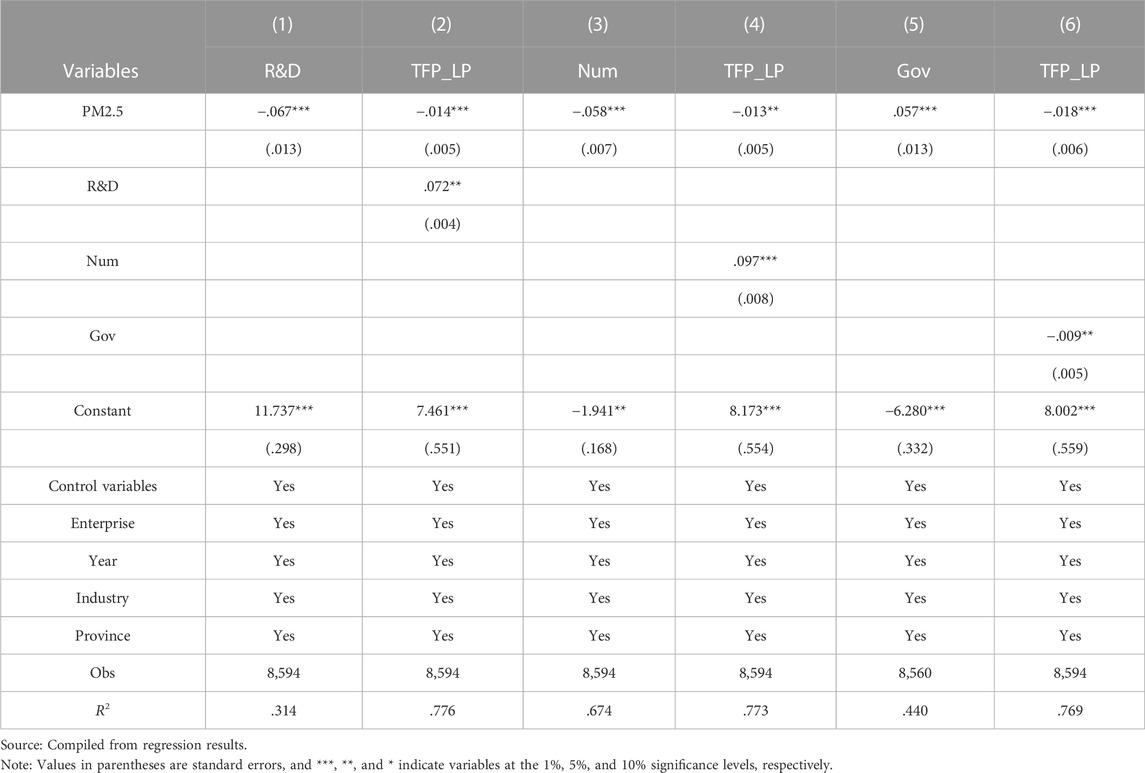
TABLE 10. Mechanism test.
To test the possibility that highly skilled people are reluctant to work in highly polluted areas, this study uses the ratio of people employed in the three types of highly skilled industries to the city population from the China Urban Statistical Yearbook as an explanatory variable. We use the regression discontinuity model to test the effect of air quality on highly skilled people9 The results show that air pollution leads to loss of highly skilled people10.
8 Conclusion and policy implications
We selected 8,594 samples from 1,829 A-share companies listed on the Shanghai and Shenzhen stock markets from 2008 to 2016 to analyze the impact of air quality on firm productivity. We used regression discontinuity to address the possible endogeneity of air pollution and firm productivity and a quasi-natural experiment on centralized heating policies in winter in northern China (north of the Qinling-Huai River boundary). As per the results, PM2.5 emissions in the northern region are significantly higher than those in the southern region, while enterprise productivity in the southern region is higher than that in the northern region, and air pollution significantly reduces firm productivity. Then, considering the possible spatial autocorrelation effect of environmental pollution in cities, we used local pollution and pollution from surrounding areas as the core variables in our analysis. The results showed that firm productivity is not only negatively affected by local air pollution but also by PM2.5 spillover from surrounding cities. Further, considering that China’s terrain system is extremely complex, purely distance-based spatial weights cannot effectively capture spatial relationships. Therefore, we divide the eastern, central, and western regions into three regions and changed the spatial weight matrix for SDM test. Meanwhile, we use the air flow coefficient as an instrumental variable along with the GS2SLS method for endogeneity tests. The results show that poor air pollution has a significant negative effect on the productivity of enterprises, and pollution spillovers from surrounding areas dampen local firm productivity in the eastern, central, and western regions. The conclusions of this paper are still reliable after addressing the endogeneity problem. Furthermore, we used dynamic GMM regression, and reselected data from 2008 to 2012 and 2013 to 2016 as samples for robustness tests. The results showed that regardless of the model, method, or sample employed in the estimations, deterioration of air quality significantly inhibits firm productivity. This conclusion is caused by reducing firms’ R&D innovation capacity and labor force, while eliciting them to receive more government subsidies. Using heterogeneity analysis, we also found that pollution emissions of sulfur dioxide and soot emissions have much weaker inhibitory effects on firm productivity than PM2.5. Meanwhile, deterioration in air quality leads to lower firm productivity in all equity properties and technology industries. In particular, the effect of air quality on SOEs and non-high tech industries is greater compared to non-SOEs and high tech industries.
While making policy recommendations, we must recognize that environmental protection and economic growth are not mutually exclusive, which provides important guidance for China to achieve high-quality economic development by accelerating green transformation in the future. The basic research in this paper concludes that severe air pollution has greatly reduced enterprise productivity. Therefore, the government should accelerate the improvement of the air quality regulatory system and develop environmental regulations of appropriate intensity. It is also necessary to increase investment in environmental protection, actively guide enterprises to cleaner production, and provide funding or financing channels for measures necessary to reduce environmental pollution. For enterprises, it is necessary to abandon overly polluting enterprises, regulate the factor endowment structure of enterprises, and promote the transformation and upgradation of enterprises.
This paper also finds that air pollution reduces firm productivity by affecting firm innovation levels and human capital effects. To this end, we can actively enhance the innovation capacity of enterprises, increase the investment in science and technology innovation, accelerate the transformation and upgradation of enterprises and green development; focus on the working environment of the workforce, and create a good working environment for the labor force, and increase investment in talent training and health insurance to prevent loss of highly skilled personnel. In addition, in the spatial measurement test, it is found that air pollution has a greater negative impact on the productivity of enterprises in the east. It can be because high energy-consuming and high-emission industries in the east coastal areas may be transferred to some central cities, inhibiting the productivity of local enterprises. Therefore, central cities need to combine their characteristics and competitive advantages and implement active talent introduction policies, avoid undertaking overly polluting enterprises, and implement clean and efficient production. Finally, in the heterogeneity test, it is found that the impact of air quality on non-high-tech industries is greater than that on high-tech industries. Thus, it is more relevant for enterprises in non-high-tech industries to consider possible environmental pollution problems, which fundamentally lie in regulating the factor endowment structure of enterprises and accelerating the transformation of the leading industrial structure from labor-intensive to capital- and technology-intensive.
It should be noted that owing to limited availability of data, our sample only contains A-share companies listed on the Shanghai and Shenzhen stock markets from 2008 to 2016; the data for 2017–2021 and a large number of unlisted companies are not included, resulting in a substantial reduction in the sample size. The findings can be empirically tested in future studies using more comprehensive data. In addition, air quality may affect corporate productivity through other areas of corporate finance, such as corporate investment and capital attraction, as well as corporate executive behavior, which can be investigated in future research.
Data availability statement
The original contributions presented in the study are included in the article/Supplementary Material, further inquiries can be directed to the corresponding author.
Author contributions
Introduction and Literature review, SL and YY; Method and data, SL and YY; Empirical results and discussion, SL; Heterogeneity analysis, SL and YY; Conclusions and discussions, SL and LC; Writing–Original Draft Preparation, SL and YY; Writing–Review and Editing, LC, SL, and YY. All authors have read and agreed to the published version of the manuscript.
Conflict of interest
The authors declare that the research was conducted in the absence of any commercial or financial relationships that could be construed as a potential conflict of interest.
Publisher’s note
All claims expressed in this article are solely those of the authors and do not necessarily represent those of their affiliated organizations, or those of the publisher, the editors and the reviewers. Any product that may be evaluated in this article, or claim that may be made by its manufacturer, is not guaranteed or endorsed by the publisher.
Supplementary material
The Supplementary Material for this article can be found online at: https://www.frontiersin.org/articles/10.3389/fenvs.2022.1095393/full#supplementary-material
Footnotes
1PM2.5 refers to particulate matter in ambient air with an aerodynamic equivalent diameter of less than or equal to 2.5 μm.
2The Qinling-Huai River boundary covers the latitude range of 33.03°–34.25°. Hence, referring to Chen et al. (2013), this study selects the value of 33.64 as the latitude of the breakpoint boundary.
3For details of the spatial autocorrelation analysis of pollution in the cities where the enterprises are located, please refer to Supplementary Appendix S1.
4Sourced from http://beta.sedac.ciesin.columbia.edu. These data cover earth pollution information from 70° N to 60° S, with an observation accuracy of.5 ° × 0.5 °.
5If a listed company experiences losses for two consecutive years, loss for 1 year and its net assets fall below par, or if there is a major violation of the law in the course of the company’s business, the exchange will give special treatment to the company’s stock, also known as the ST system. For ST companies, if further problems arise, such as continued losses in the following year, thus reaching the limit of three consecutive years of losses as stipulated in the Company Law, the company will be subject to PT treatment. The asterisk (*) after ST is the delisting risk warning, and ST* stocks will be suspended if they continue to lose money the following year.
6For the results of the multicollinearity and homoscedasticity tests, please refer to Supplementary Appendix S2.
7According to the statistical method of the National Bureau of Statistics, the eastern region is divided into Beijing City, Tianjin City, Hebei Province, Liaoning Province, Shanghai City, Jiangsu Province, Zhejiang Province, Fujian Province, Shandong Province, Guangdong Province, and Hainan Province; the central region is divided into Shanxi Province, Anhui Province, Jilin Province, Heilongjiang Province, Jiangxi Province, Henan Province, Hubei Province, and Hunan Province; the western region is divided into Inner Mongolia Autonomous Region, Guangxi Zhuang Autonomous Region, Chongqing City, Sichuan Province, Guizhou Province, Yunnan Province, Tibet Autonomous Region, Shaanxi Province, Gansu Province, Qinghai Province, Ningxia Hui Autonomous Region, and Xinjiang Uygur Autonomous Region.
8Table 6 shows that both the likelihood and R2 values are higher than W1 and W2, indicating that the goodness of fit of the economic-geographic spatial weight matrix is better. Hence, we report only the regression results of W3 in 5.3 section.
9In the China Urban Statistics Yearbook, three categories of industries can be considered high technology industries: information transmission and computer services and software; financial intermediation; and scientific research and technical service.
10We validate the impact of air quality on highly skilled people with regression discontinuity; please refer to the specific empirical results in Supplementary Appendix S3.
References
Ai, H., Wang, M., Zhang, Y. J., and Zhu, T. T. (2022). How does air pollution affect urban innovation capability? Evidence from 281 cities in China. Struct. Change Econ. Dyn. 61, 166–178. doi:10.1016/j.strueco.2022.02.012
Akpalu, W., and Normanyo, A. K. (2017). Gold mining pollution and the cost of private healthcare: The case of Ghana. Ecol. Econ. 142, 104–112. doi:10.1016/j.ecolecon.2017.06.025
Ayyagari, M., Demirgü-Kunt, A., and Maksimovic, V. (2010). Formal versus informal finance: Evidence from China. Rev. Financial Stud. 23 (8), 3048–3097. doi:10.1093/rfs/hhq030
Aznar-Marquez, J., and Ruiz-Tamarit, J. R. (2016). Environmental pollution, sustained growth, and sufficient conditions for sustainable development. Econ. Model. 54, 439–449. doi:10.1016/j.econmod.2016.01.017
Balakrishnan, U., and Tsaneva, M. (2021). Air pollution and academic performance: Evidence from India. World Dev. 146, 105553. doi:10.1016/j.worlddev.2021.105553
Balakrishnan, U., and Tsaneva, M. (2022). Impact of air pollution on mental health in India. J. Dev. Stud. 2022, 1–15. doi:10.1080/00220388.2022.2120804
Blundell, R., and Bond, S. (1998). Initial conditions and moment restrictions in dynamic panel data models. J. Econ. 87 (1), 115–143. doi:10.1016/S0304-4076(98)00009-8
Bogliacino, F., and Pianta, M. (2013). Profits, R&D, and innovation: A model and a test. Industrial Corp. Change 22 (3), 649–678. doi:10.1093/icc/dts028
Brandt, L., Van, J. B., and Zhang, Y. (2012). Creative accounting or creative destruction? Firm-level productivity growth in Chinese manufacturing. J. Dev. Econ. 97 (2), 339–351. doi:10.1016/j.jdeveco.2011.02.002
Broner, F., Bustos, P., and Carvalho, V. M. (2012). Sources of comparative advantage in polluting industries. Natl. Bureau Econ. Res. 2012, 18337. doi:10.3386/w18337
Cameron, T. A., and McConnaha, I. T. (2006). Evidence of environmental migration. Land Econ. 82 (2), 273–290. doi:10.3368/le.82.2.273
Cao, Y., Wang, Q., and Zhou, D. (2022). Does air pollution inhibit manufacturing productivity in Yangtze River Delta, China? Moderating effects of temperature. J. Environ. Manag. 306, 114492. doi:10.1016/j.jenvman.2022.114492
Chang, T., Graff Zivin, J., Gross, T., and Neidell, M. (2016). Particulate pollution and the productivity of pear packers. Am. Econ. J. Econ. Policy 8 (3), 141–169. doi:10.1257/pol.20150085
Chen, M., and Guariglia, A. (2013). Internal financial constraints and firm productivity in China: Do liquidity and export behavior make a difference? J. Comp. Econ. 41 (4), 1123–1140. doi:10.1016/j.jce.2013.05.003
Chen, S., Oliva, P., and Zhang, P. (2022). The effect of air pollution on migration: Evidence from China. J. Dev. Econ. 156, 102833. doi:10.1016/j.jdeveco.2022.102833
Chen, Y., Ebenstein, A., Greenstone, M., and Li, H. (2013). Evidence on the impact of sustained exposure to air pollution on life expectancy from China’s Huai River policy. Proc. Natl. Acad. Sci. 110 (32), 12936–12941. doi:10.1073/pnas.1300018110
Chen, Y., Ge, R., Pittman, J. A., Veeraraghavan, M., and Zolotoy, L. (2017). Obscured by clouds: The impact of weather-induced managerial mood on corporate tax avoidance. SSRN Working Paper. doi:10.2139/ssrn.3067343
Cui, Q., Yuan, B., Zhou, Y., Chen, H., and Hu, Y. (2021). Will bad air quality affect the siting of foreign-invested manufacturing enterprises? The evidence from China. Appl. Econ. 53 (45), 5221–5241. doi:10.1080/00036846.2021.1922588
Fan, Q., Yang, S., and Liu, S. (2019). Asymmetrically spatial effects of urban scale and agglomeration on haze pollution in China. Int. J. Environ. Res. Public Health 16 (24), 4936. doi:10.3390/ijerph16244936
Farinas, J. C., and Moreno, L. (2000). Firms’ growth, size, and age: A nonparametric approach. Rev. Industrial Organ. 17 (3), 249–265. doi:10.1023/A:1007834210622
Fazlıoğlu, B., Dalgıç, B., and Yereli, A. B. (2019). The effect of innovation on productivity: Evidence from Turkish manufacturing firms. Industry Innovation 26 (4), 439–460. doi:10.1080/13662716.2018.1440196
Fox, M. B., and Heller, M. (2000). Lessons from fiascos in Russian corporate governance. SSRN Working Paper. doi:10.2139/ssrn.203368
Ghanem, D., and Zhang, J. (2014). Effortless perfection: Do Chinese cities manipulate air pollution data? J. Environ. Econ. Manag. 68 (2), 203–225. doi:10.1016/j.jeem.2014.05.003
Grossman, G. M., and Krueger, A. B. (1995). Economic growth and the environment. Q. J. Econ. 110 (2), 353–377. doi:10.2307/2118443
Hall, B. H., and Harhoff, D. (2012). Recent research on the economics of patents. Annu. Rev. Econ. 4 (1), 541–565. doi:10.1146/annurev-economics-080511-111008
Hanlon, W. W. (2016). Coal smoke and the costs of the industrial revolution. NBER Working Paper 22921. doi:10.3386/w22921
Hassan Bhat, T., Jiawen, G., and Farzaneh, H. (2021). Air pollution health risk assessment (AP-HRA), principles and applications. Int. J. Environ. Res. Public Health 18 (4), 1935. doi:10.3390/ijerph18041935
He, C., Pan, F., and Yan, Y. (2012). Is economic transition harmful to China’s urban environment? Evidence from industrial air pollution in Chinese cities. Urban Stud. 49 (8), 1767–1790. doi:10.1177/0042098011415719
He, G., and Lin, T. (2022). Does air pollution impair investment efficiency? Econ. Lett. 215, 110490. doi:10.1016/j.econlet.2022.110490
He, Q., Guaita-Martinez, J. M., and Botella-Carrubi, D. (2020). How brand equity affects firm productivity: The role of R&D and human capital. Econ. Research-Ekonomska Istraživanja 33 (1), 2976–2992. doi:10.1080/1331677X.2019.1686045
Hering, L., and Poncet, S. (2014). Environmental policy and exports: Evidence from Chinese cities. J. Environ. Econ. Manag. 68 (2), 296–318. doi:10.1016/j.jeem.2014.06.005
Hu, F., and Guo, Y. (2021). Health impacts of air pollution in China. Front. Environ. Sci. Eng. 15 (4), 74–18. doi:10.1007/s11783-020-1367-1
Hu, Q., Feng, Y., and Xu, M. (2021). Are there heterogeneous impacts of air pollution on mental health? Front. Public Health 9, 780022. doi:10.3389/fpubh.2021.780022
Hu, X., Sun, H., Luo, X., Ni, S., and Yan, Y. (2021). Health and economic impacts from PM2. 5 pollution transfer attributed to domestic trade in China: A provincial-level analysis. Environ. Sci. Pollut. Res. 28 (36), 49559–49573. doi:10.1007/s11356-021-13954-y
Huang, J. T., and Hsu, H. S. (2022). Air pollution and outward foreign direct investment—a cross-country empirical study. Singap. Econ. Rev. 2022, 1–16. doi:10.1142/S0217590822500382
Ibukun, C. O., and Omisore, W. M. (2022). Air pollution, health expenditure and economic growth in MINT countries: A trivariate causality test. J. Econ. Adm. Sci. (ahead-of-print). doi:10.1108/JEAS-03-2022-0074
Jiang, D., Li, W., Shen, Y., and Yu, S. (2022b). Does air pollution affect earnings management? Evidence from China. Pacific-Basin Finance J. 72, 101737. doi:10.1016/j.pacfin.2022.101737
Jiang, D., Li, W., Shen, Y., and Zhang, Y. (2022a). Does air quality affect firms’ investment efficiency? Evidence from China. Int. Rev. Econ. Finance 79, 1–17. doi:10.1016/j.iref.2022.01.001
Kioumourtzoglou, M. A., Schwartz, J. D., Weisskopf, M. G., Melly, S. J., Wang, Y., Dominici, F., et al. (2016). Long-term PM2. 5 exposure and neurological hospital admissions in the northeastern United States. Environ. Health Perspect. 124 (1), 23–29. doi:10.1289/ehp.1408973
Kuo, P. F., and Putra, I. G. B. (2021). Analyzing the relationship between air pollution and various types of crime. PLoS One 16 (8), e0255653. doi:10.1371/journal.pone.0255653
Lai, W., Song, H., Wang, C., and Wang., H. (2021). Air pollution and brain drain: Evidence from college graduates in China. China Econ. Rev. 68, 101624. doi:10.1016/j.chieco.2021.101624
Lepori, G. M. (2016). Air pollution and stock returns: Evidence from a natural experiment. J. Empir. Finance 35, 25–42. doi:10.1016/j.jempfin.2015.10.008
Levinsohn, J., and Petrin, A. (2003). Estimating production functions using inputs to control for unobservables. Rev. Econ. Stud. 70 (2), 317–341. doi:10.1111/1467-937X.00246
Li, B., Liu, Y., Yang, Y., and Wang, Y. J. (2022). Impact of air pollution on the formation of zombie firms: Evidence from China. J. Environ. Prot. Ecol. 23 (3), 1290–1298.
Li, B., Zhang, X., and Zeng, Y. (2019). The impact of air pollution on government subsidies obtained by Chinese listed companies. Ekoloji 28 (107), 1947–1954.
Lin, S., Xiao, L., and Wang, X. (2021). Does air pollution hinder technological innovation in China? A perspective of innovation value chain. J. Clean. Prod. 278, 123326. doi:10.1016/j.jclepro.2020.123326
Lin, T., Qian, W., Wang, H., and Feng, Y. (2022). Air pollution and workplace choice: Evidence from China. Int. J. Environ. Res. Public Health 19 (14), 8732. doi:10.3390/ijerph19148732
Lin, Y. C., Chen, C. L., Chao, C. F., Chen, W. H., and Pandia, H. (2020). The study of evaluation index of growth evaluation of science and technological innovation micro-enterprises. Sustainability 12 (15), 6233. doi:10.3390/su12156233
Liu, F., Zheng, M., and Wang, M. (2020). Does air pollution aggravate income inequality in China? An empirical analysis based on the view of health. J. Clean. Prod. 271, 122469. doi:10.1016/j.jclepro.2020.122469
Liu, J., Pan, X., Qu, Y., Wang, C., and Wu, W. (2022). Air pollution, human capital and corporate social responsibility performance: Evidence from China. Appl. Econ. 54 (4), 467–483. doi:10.1080/00036846.2021.1963413
Liu, Y., Zhu, K., Li, R. L., Song, Y., and Zhang, Z. J. (2021). Air pollution impairs subjective happiness by damaging their health. Int. J. Environ. Res. Public Health 18 (19), 10319. doi:10.3390/ijerph181910319
Liu, Z., and Yu, L. (2020). Stay or leave? The role of air pollution in urban migration choices. Ecol. Econ. 177, 106780. doi:10.1016/j.ecolecon.2020.106780
López, R. (2017). “The environment as a factor of production: The effects of economic growth and trade liberalization 1,” in International trade and the environment (London, UK: Routledge), 239–260.
Lucas, R. E. (1978). Asset prices in an exchange economy. Econ. J. Econ. Soc. 46 (6), 1429–1445. doi:10.2307/1913837
Majumdar, S. K. (1997). The impact of size and age on firm-level performance: Some evidence from India. Rev. Industrial Organ. 12 (2), 231–241. doi:10.1023/A:1007766324749
Mao, Q., and Xu, J. (2018). The more subsidies, the longer survival? Evidence from Chinese manufacturing firms. Rev. Dev. Econ. 22 (2), 685–705. doi:10.1111/rode.12361
Mishra, A. K., Sinha, A. K., Khasnis, A., and Vadlamani, S. T. (2021). Exploring firm-level innovation and productivity in India. Int. J. Innovation Sci. 13, 583–609. doi:10.1108/IJIS-10-2020-0179
Olley, G. S., and Pakes, A. (1996). The dynamics of productivity in the telecommunications equipment industry. Econometrica 64 (6), 1263–1297. doi:10.2307/2171831
Ramirez, S., Gallego, J., and Tamayo, M. (2020). Human capital, innovation and productivity in Colombian enterprises: A structural approach using instrumental variables. Econ. Innovation New Technol. 29 (6), 625–642. doi:10.1080/10438599.2019.1664700
Ren, S. M., and Zhang, J. (2013). The subsidy, the rent-seeking cost and the rate of the markup: A case study on the equipment-manufacturing enterprises in China. Manag. World 2013 (10), 118–129.
Shang, Y., Song, M., and Zhao, X. (2022). The development of China's circular economy: From the perspective of environmental regulation. Waste Manag. 149, 186–198. doi:10.1016/j.wasman.2022.05.027
Shen, W. T., Yu, X., Zhong, S. B., and Ge, H. R. (2021). Population health effects of air pollution: Fresh evidence from China health and retirement longitudinal survey. Front. Public Health 9, 779552. doi:10.3389/fpubh.2021.779552
Tan, J., Chan, K. C., and Chen, Y. (2022). The impact of air pollution on the cost of debt financing: Evidence from the Bond market. Bus. Strategy Environ. 31 (1), 464–482. doi:10.1002/bse.2904
Tan, J., Tan, Z., and Chan, K. C. (2021). Does air pollution affect A firm's cash holdings? Pacific-Basin Finance J. 67, 101549. doi:10.1016/j.pacfin.2021.101549
Tan, Z., and Yan, L. (2021). Does air pollution impede corporate innovation? Int. Rev. Econ. Finance 76, 937–951. doi:10.1016/j.iref.2021.07.015
Tang, X., Chen, X., and Tian, Y. (2017). Chemical composition and source apportionment of PM2.5: A case study from one year continuous sampling in the chang-zhu-tan urban agglomeration. Atmos. Pollut. Res. 8 (5), 885–899. doi:10.1016/j.apr.2017.02.004
Tassey, G. (2004). Underinvestment in public good technologies. J. Technol. Transf. 30 (1), 89–113. doi:10.1007/s10961-004-4360-0
Timothy, V. L. (2022). The effect of top managers’ human capital on SME productivity: The mediating role of innovation. Heliyon 8 (4), e09330. doi:10.1016/j.heliyon.2022.e09330
Tuncel, C. O., and Oktay, D. (2022). Innovation and productivity in Turkish manufacturing firms. Appl. Econ. Lett. 29 (17), 1610–1614. doi:10.1080/13504851.2021.1950904
Wang, L., Da, Y., and Kong, D. (2021). Air pollution and employee treatment. J. Corp. Finance 70, 102067. doi:10.1016/j.jcorpfin.2021.102067
Wang, M., Xu, M., and Ma, S. (2021). The effect of the spatial heterogeneity of human capital structure on regional green total factor productivity. Struct. Change Econ. Dyn. 59, 427–441. doi:10.1016/j.strueco.2021.09.018
Wang, Y. J. (2002). Liquidity management, operating performance, and corporate value: Evidence from Japan and taiwan. J. Multinatl. Financial Manag. 12 (2), 159–169. doi:10.1016/S1042-444X(01)00047-0
Wei, L. Y., and Liu, Z. (2022). Air pollution and innovation performance of Chinese cities: Human capital and labour cost perspective. Environ. Sci. Pollut. Res. 1, 67997–68015. doi:10.1007/s11356-022-20628-w
Xie, X., and Wang, Y. (2019). Evaluating the efficacy of government spending on air pollution control: A case study from beijing. Int. J. Environ. Res. Public Health 16 (1), 45. doi:10.3390/ijerph16010045
Xue, S., Zhang, B., and Zhao, X. (2021). Brain drain: The impact of air pollution on firm performance. J. Environ. Econ. Manag. 110, 102546. doi:10.1016/j.jeem.2021.102546
Yang, Y., Zhang, X., and Fu, Y. (2022). Foreign tourists’ experiences under air pollution: Evidence from big data. Tour. Manag. 88, 104423. doi:10.1016/j.tourman.2021.104423
You, Y. (2022). Air pollution, service development and innovation: Evidence from China. PloS One 17 (5), e0263883. doi:10.1371/journal.pone.0263883
Zhang, C., and Zhang, X. (2022). Evolutionary game analysis of air pollution Co-investment in emission reductions by steel enterprises under carbon quota trading mechanism. J. Environ. Manag. 317, 115376. doi:10.1016/j.jenvman.2022.115376
Zhang, F., Li, Y., Li, Y., Xu, Y., and Chen, J. (2022). Nexus among air pollution, enterprise development and regional industrial structure upgrading: A China's country panel analysis based on satellite retrieved data. J. Clean. Prod. 335, 130328. doi:10.1016/j.jclepro.2021.130328
Zhang, R. L., and Liu, X. H. (2021). Evaluating ecological efficiency of Chinese industrial enterprise. Renew. Energy 178, 679–691. doi:10.1016/j.renene.2021.06.119
Keywords: air quality, enterprise productivity, regression discontinuity, spatial Durbin model, GS2SLS
Citation: Liu S, Yang Y and Cai L (2023) Impact of air quality on enterprise productivity: Evidence from Chinese listed companies. Front. Environ. Sci. 10:1095393. doi: 10.3389/fenvs.2022.1095393
Received: 11 November 2022; Accepted: 29 December 2022;
Published: 12 January 2023.
Edited by:
Bing Xu, Heriot-Watt University, United KingdomReviewed by:
Roni Bhowmik, Guangdong University of Foreign Studies, ChinaDesire Wade Atchike, Taizhou University, China
Copyright © 2023 Liu, Yang and Cai. This is an open-access article distributed under the terms of the Creative Commons Attribution License (CC BY). The use, distribution or reproduction in other forums is permitted, provided the original author(s) and the copyright owner(s) are credited and that the original publication in this journal is cited, in accordance with accepted academic practice. No use, distribution or reproduction is permitted which does not comply with these terms.
*Correspondence: Su Liu, MTU1NDU3MzM3NjZAMTYzLmNvbQ==