 Yan Han
 Jiajie Zhang
 Mengjie Yuan2
- 1Institute of Geographic Sciences and National Resources Research, Chinese Academy of Sciences, Beijing, China
- 2School of Economics and Management, Lanzhou Jiaotong University, Lanzhou, China
In the context of global countries’ pursuit of sustainable development and “dual carbon” goals of China, this paper combines the Tapio decoupling model, Kaya’s equation and LMDI decomposition method to analyze the relationship between carbon emissions and economic growth and the driving factors of carbon emissions in the Yellow River Basin (YRB) of China from 2001 to 2019. It is found that the decoupling state of CO2 and economic growth in the Yellow River Basin shows a trend of expansion negative decoupling - expansion connection - weak decoupling - strong decoupling, but different regions shows some heterogeneity. The economic intensity effect and population size effect generally play a positive role in driving carbon emissions, while carbon emission intensity, industrial structure and energy structure effect play a negative role in driving carbon emissions in most years. From the regional perspective, the energy consumption structure in the middle reaches is the most important factor to promote carbon emissions. In terms of time period, the industrial structure effect is the driving factor of carbon emissions in the decoupling state overall as expansionary linkage, while it is the inhibitor of carbon emissions in the decoupling state overall as weak decoupling. This study also puts forward countermeasures such as optimize the energy structure and upgrade the industrial structure to achieve green and high-quality economic development in the YRB.
1 Introduction
Nowadays, global warming has been a heated issue of discussion among nations, and it is mostly caused by human socioeconomic activity, with carbon emissions from human economic activities being the most significant source of warming (Kaur-Sidhu et al., 2020; Rosselot et al., 2022). In 2018, worldwide carbon dioxide emissions from fossil fuels and industry reached 36.6 billion tons, climbed by 2.1% compared to the previous year (Huang et al., 2021). How to strike a balance between economic growth and lowering carbon dioxide emissions has become an urgent issue for countries to address. At present, carbon-neutral has become the direction of development in various countries, and many countries have reached a consensus on reducing greenhouse gas emissions (Kaur-Sidhu et al., 2020). To accomplish the target of the 2015 Paris Agreement - to limit global warming to 1.5–2°C - greenhouse gas emissions must be lowered by 25–50% in the next decade (Mo et al., 2018). As the greatest economy in the world, the United States has set its emissions reduction target at 50–52% below 2005 levels by 2030 (Spawn et al., 2019). The government of the United Kingdom has promised that it is committed to achieving a reduction in greenhouse gas emissions of at least 68% by the year 2030 compared to the levels that existed in 1990, and 100% reduction in carbon emissions by 2050 achieving Net zero emissions (Ekundayo et al., 2019). 127 nations have now made the commitment to achieve carbon neutrality by the middle of the 21st century (Xiang et al., 2022).
Since the nation began implementing economic reform and opening-up new markets, China’s economy has continued to expand at a rapid pace (Liang et al., 2022), nevertheless, at the same time China’s annual carbon emissions have been increasing year by year, and it is now world’s largest carbon emitter (Bai et al., 2020). The massive problem is attributed to China’s economic development model (Zhang Y. et al., 2019), which poses a threat to the environment. In response, the Chinese government has made it abundantly clear that it would make every effort to attain the peak level of carbon emissions by the year 2030 and achieve carbon neutrality by the year 2060 (Gao and Han, 2022). In December 2021, China issued the “China’s Policies and Actions to Address Climate Change”, which clearly defines China’s new philosophy on climate change, its national strategy to actively address climate change, and its initiative to create a fair and equitable system of global climate governance via mutually beneficial collaboration. This shows that China is committed to integrating carbon peaking and carbon neutrality into its overall economic and social development, promoting synergistic efficiency in pollution reduction and carbon reduction, a comprehensive green transformation of economic and social growth, and a movement from quantity to quality in ecological and environmental challenges.
The Yellow River Basin (YRB), known as the “Basin of Energy” (Xu et al., 2020), is a crucial economic zone and ecological barrier in China, contributing significantly to the country’s ecological security, economic growth (Zhang P. Y. et al., 2019). The area of the eight provinces in the YRB accounts for 32.13% of the total land area of the country, and the proportion of GDP of the whole basin in 2019 is as high as 20.35% of the country, but CO2 emissions account for 33.38% of the country (Rong et al., 2020). The green low-carbon development level of the eight provinces in the YRB has a significant geographical characteristic of gradually decreasing from east to west (Song et al., 2022), and the level of green low-carbon development varies greatly among provinces and regions (Zhang X. et al., 2022). As the energy supply base of China (Wu et al., 2022), the paradigm of development that the YRB has involves high levels of energy consumption and emissions (Jin, 2019). This model has exacerbated the waste of energy and resources, making the conflict between environmental protection and socioeconomic development extremely prominent (Xu et al., 2021), and its energy consumption intensity and carbon intensity exceed the national average level. The industrial sector in the YRB is mainly concentrated in resource and energy industries such as mining and washing coal, oil and gas extraction, non-ferrous metal smelting and rolling processing, and heavy chemical industries and other high-carbon industries (Su et al., 2021; Zhao et al., 2022), of which the proportion of resource mining and its processing industries in the YRB is as high as 36.34%, which is 9.17% higher than the national average (Dong and Long, 2021). Environmental protection and superior progress in the YRB are reliant on carbon-neutral growth (Sun et al., 2022). How to balance the relationship between CO2 emissions and economic progress in the YRB has become a pressing issue, and the related study results have major reference values for other areas in China and developing nations throughout the globe.
In this paper, eight provinces in the YRB are studied in an attempt to answer the following questions: first, determine the degree to which carbon emissions and economic development are decoupling in the YRB and determine if there are variations across the upper, middle and down reaches of this basin; second, among the driving factors affecting carbon emissions, which factors mainly promote carbon emissions and which factors mainly inhibit them; third, for different years and different regions in the YRB, to investigate whether there is significant heterogeneity in these driving factors.
The following are some of the minor advances that this publication makes to the existing body of research: first, this study examines the situation of decoupling of economic growth and CO2 emissions, enriches the research related to the factors influencing carbon emissions, and provides reliable insights into the link between goals for economic growth and greenhouse gas emissions. Second, the Tapio decoupling model and LMDI decomposition method are introduced to explore the main driving factors of carbon emissions. Local governments may use the study findings as a significant foundation for coordinating emission reduction and implementing local policies in accordance with their real circumstances. Third, the differences of each driving factor are elucidated from the perspective of time and space, and practical solutions are provided to different regions.
The remaining parts of this work are structured in the following manner. In Section 2, a literature review is presented, which provides a synopsis of the variables that influence carbon emissions and the research methodologies that are relevant to this topic. The methodology and data sources that were used for this work are discussed in Section 3. The results of the computation are discussed in Section 4, and the remaining content consists of a conclusion and suggested countermeasures.
2 Literature review
2.1 The relationship between carbon emissions and economic growth
There is a clear correlation between the uncertainty of economic growth and changes in carbon dioxide emissions in the long term (Adams et al., 2020). In general, there is a positive relationship between Carbon Dioxide and economic growth (Balsalobre-Lorente and Leitao, 2020), and some scholars have even found through their studies that for every 1% increase in economic growth, carbon dioxide emissions increase by 1.05% (Hundie, 2021). In addition, there is a two-way causal relationship between CO2 emissions and GDP per capita on a time scale, which implies that reducing CO2 emissions will have a negative impact on economic growth (Khalfaoui et al., 2021). Although economic growth is strongly correlated with carbon emissions, heterogeneity still exists across economies (Razzaq et al., 2021). For example, economic growth has a relatively small impact on carbon emissions in developed countries, while it has a relatively large impact on carbon emissions in less developed countries. In this context, in order to analyze the relationship between economic growth and carbon emissions, many scholars have adopted decoupling theory, which is the basic theoretical basis for contemporary academic research on carbon emissions and economic growth. The decoupling analysis was originally proposed by OECD (Organization for Economic Co-operation and Development), which mainly refers to the process of severing the link between industrial pollution and economic growth (Dong et al., 2020), i.e., total material consumption is not synchronized with economic growth (Han, 2021). This suggests that the greater the decoupling relationship between economic growth and CO2 emissions, the less dependent the economy will be on energy-intensive sectors and the more sustainable the economic development will be, and vice versa.
Currently, the decoupling relationship between economic growth and CO2 has been analyzed by various scholars from different research perspectives according to their research objectives. First, many scholars have compared the decoupling status of carbon emissions and economic growth in the world’s major economies. Since the changes of economic aggregates and carbon emissions of the world’s major economies play a pivotal role in the global economy, some scholars have studied the differences in the decoupling status between carbon emissions and economic development in China, the United States, Japan and India, which are the world’s major economies (Yang and Sun, 2019); some scholars have also conducted in-depth analysis of the decoupling status of economic development and carbon emissions in BRICS (Brazil, Russia, India, China, and South Africa) countries (Wang et al., 2021). Second, some literature has studied the decoupling status between carbon emissions and economic growth in regions at different levels of economic development. For example, a part of scholars have studied the correlation between GDP and carbon emissions in developed countries (Mikayilov et al., 2018), in contrast, Hossain and Chen have studied the link between HDI and CO2 emissions in Bangladesh from the perspective of developing countries for the period 1990–2018 (Hossain and Chen, 2022). Finally, there are also some studies in the literature that have been developed from different country contexts. Marques et al. (2018) and Dahmani et al. (2021) have studied the decoupling relationship between economic growth and CO2 emissions in Australia and Tunisia, respectively, while some other researchers have purposefully studied the decoupling dynamics of carbon emissions and economic growth in other countries. From the previous studies, it can be seen that most scholars tend to study the decoupling status of carbon emissions and economic growth from a macro perspective, either in a comparative analysis of the decoupling status among major world economies or in a study of the decoupling status of different countries, while relatively little literature is involved in the study of a particular region of the country.
2.2 Decomposition of carbon emission driving factors
In terms of research methods, most scholars have studied the driving factors of carbon emissions using the extended Kaya constant equation and the LMDI method. For example, Karakaya et al. (2019) used the extended Kaya constant equation and LMDI method to calculate the drivers of CO2 emission changes in Wang et al. (2018) compared the decoupling between China and the United States in terms of economic growth leading to carbon emissions and dissected the decoupling index using the LMDI method. At the same time, there is a literature studying the driving factors of carbon emissions using other models. Some scholars have used the extended STIRPAT model in their studies to explore the drivers of CO2 emissions and emission reduction pathways (Wang et al., 2022), while others have used the LMDI and SDA decomposition methods to study carbon emissions. In general, most scholars currently studying the drivers of carbon emissions have combined the LMDI factor decomposition technique with the Kaya constant equation (Shi et al., 2022), which is the approach used in the next part of this paper to study the driving factors of carbon emissions.
In terms of carbon emission driving factors, most of the literature mainly focuses on the total carbon emission of a country or region, while a small part of the literature explores the drivers of per capita carbon emission (Moutinho et al., 2020). It is found that generally the economic intensity effect and population size effect are the main drivers of carbon emissions, while the energy consumption structure effect is effective in reducing carbon emissions (Moutinho et al., 2020; Wang et al., 2021). However, further research found that the drivers of carbon emissions can be heterogeneous depending on national and regional differences. For example, some scholars found that the increase of carbon emissions in Brazil is mainly due to the increase of personal living standards, exports and population size (Lundquist, 2021). The YRB has its own special characteristics, and in this context, it is important to investigate the individual drivers of carbon emissions in the YRB.
It can be seen from the above studies that most of the previous studies have conducted research to examine the relationship between carbon emissions and economic activities, but there are few papers that focused the YRB of China. The decoupling status between carbon emissions and economic development in YRB is unclear. Thus, exploring variations in carbon emissions and its influencing causes and examining its decoupling from economic development, is vital for creating emission reduction programs and ensuring ecological security, which can be a reference for China and other countries in the world.
3 Methods and data
3.1 Study area
In this paper, eight provinces of Shandong, Henan, Shaanxi, Shanxi, Inner Mongolia, Gansu, Qinghai and Ningxia are taken as the study areas (Figure 1). The YRB is divided into upper reaches, middle reaches and down reaches according to the location of each province (Table 1).
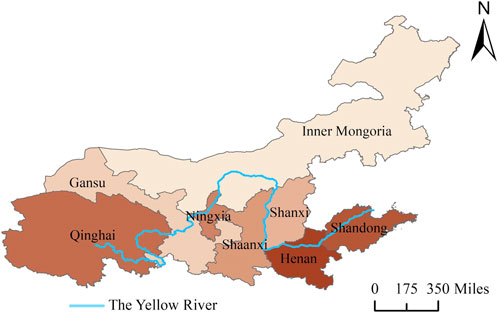
FIGURE 1. Location map of provinces in the YRB.

TABLE 1. Provinces in the upper, middle and down reaches of the YRB.
3.2 Methods
3.2.1 Decoupling theory
Drawing on previous studies (Sun and Zhou, 2017), there are two main widely used measures of decoupling status, which are the decoupling factor method presented by the OECD group and Tapio’s proposed decoupling elasticity coefficient technique. In this paper, the Tapio decoupling analysis model is adopted (Tapio, 2005). The Tapio model of decoupling can study the effects of numerous variables on decoupling indicators by establishing causal chains, and the elasticity coefficient approach may effectively overcome measurement outline variations. The formula for its calculation is as follows:
Where
According to Tapio’s classification of the elasticity index, and drawing on the research of (Zhuang, 2022) and (Gai et al., 2014), this paper classifies the elasticity values into eight types according to decoupling or non-decoupling (Table 2). The most desirable one is strong decoupling (SD), that is, with economic growth CO2 is reduced and economic development is sustainable. For weak decoupling, despite the fact that both carbon emissions and the economy are rising, the economy is growing faster than carbon emissions. For recession decoupling, although both total economy and carbon emissions are decreasing, carbon dioxide emissions are dropping faster than the economy. Therefore, these two states are more desirable for the economy. When the link between economic expansion and carbon emissions shows an expansionary connection (EC) or a recessionary connection (RC), it demonstrates that the region’s economic growth is becoming more energy dependent and needs attention. Further, when link between greenhouse gas emissions and economic expansion shows an expansionary negative decoupling (END) and a recessionary decoupling (WND), it is an indication that the economic development of an area is largely reliant on the use of energy, and that this dependency on energy is continuously rising over time. The least desirable state is Strong Negative Decoupling (SND), which means that a decline in the economy is followed by a rise in carbon emissions. The specific decoupling status is as follows (Figure 2).
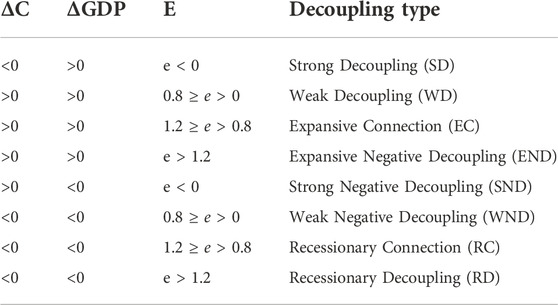
TABLE 2. Decoupling status Division.
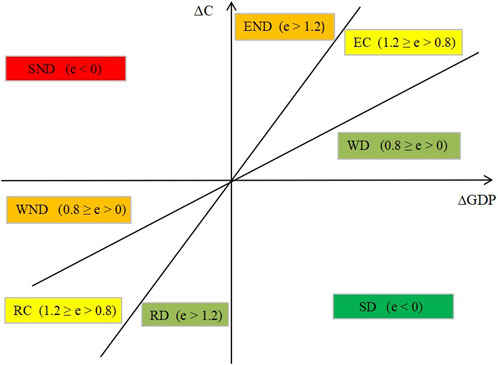
FIGURE 2. Division of Tapio decoupling elasticity index.
3.2.2 LMDI decomposition
The method of exponential decomposition is based on the basic principle of Kaya’s equation, which decomposes multiple influencing factors by constructing a chain product form (Kaya, 1989). The equation presented by Japanese academic Yoichi Kaya, and its basic equation is shown in Eq. 2.
Where
Since Kaya’s equation has good openness and expandability, the equation is expanded to:
Simplifying Eq. 3 gives
In which:
Eq. 4 is further abbreviated as:
In which:
If the contribution value of each factor effect is greater than 0, it means that the factor will cause the increase of carbon emission in YRB, and vice versa, it means that it will suppress carbon emission.
This paper further depicts the mechanism map of carbon emission influencing factors in the YRB. From Figure 3, it can be seen that the variables responsible for carbon emissions are population size effect, economic intensity effect, carbon emission intensity effect, energy consumption structure effect and industrial structure effect.
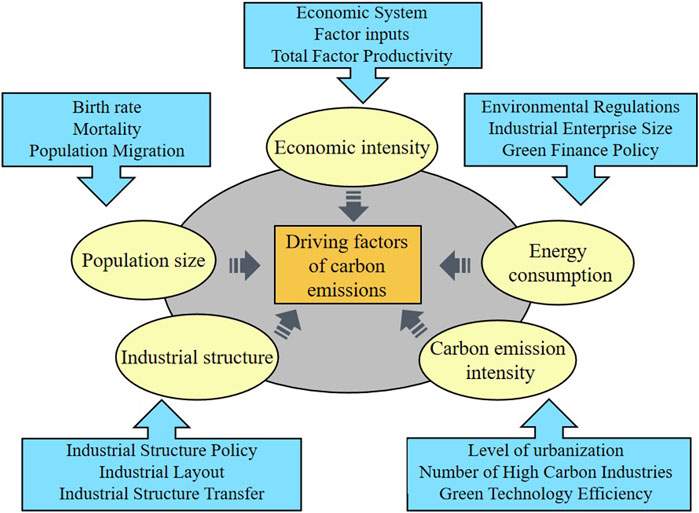
FIGURE 3. Driving factors of carbon emissions.
For the population size effect, the link between population growth and greenhouse gas emissions is the focus of many scholars’ attention (Liu et al., 2020; Wei et al., 2020). In general, the difference between birth rate and death rate directly affects the change of population size. With constant carbon emissions per capita, when the population of an area increases, the carbon emissions of that area will increase, and conversely when the population decreases, the carbon emissions will decrease accordingly. It is worth mentioning that the promotion of low-carbon lifestyle will significantly reduce the per capita carbon emissions (Hanbury et al., 2019), which will change the total carbon emissions of a region.
For the economic intensity effect, carbon emissions and the size of the economy are strongly connected (Waheed et al., 2019). Generally speaking, carbon emissions in economically backward regions will increase as the size of the economy increases due to the crude development pattern. However, for developed economies, due to their low dependence on energy-intensive industries, often the expansion of their economic scale does not have a big influence on carbon emissions.
For the carbon intensity effect, since carbon intensity refers to the emission of carbon dioxide per unit of GDP (Yu et al., 2018), the carbon dioxide emission of a place is directly proportional to carbon intensity. However, as the efficiency of green technology increases, the intensity of carbon emissions decreases, so with the same total GDP, carbon emissions will also decrease (Dong et al., 2022).
For the energy consumption effect, carbon emissions will be drastically decreased as a consequence of the growing popularity of clean energy usage and the enhancement of energy usage efficiency. Among the factors influencing the structure of energy consumption, the local government’s environmental regulation policies have a direct impact on the share of each type of energy (Xia et al., 2021). In addition, the size of local industrial enterprises can intensify the demand for energy, while financial policies supporting the development of green industries can provide funds for the growth of enterprises related to alternative forms of energy (Sun and Chen, 2022). The above mechanisms can have a direct or indirect impact on the structure of energy consumption and thus on carbon emissions.
For the industrial structure effect, the share of secondary industries in any industrial structure will have an immediate effect on carbon emissions (Xue et al., 2019). If a region’s industrial structure is dominated by oil, chemical, steel and other industries, it will undoubtedly result in a rise in carbon emissions; on the contrary, if the industrial structure is dominated by finance, electronic information, tourism and other industries, carbon emissions will be significantly reduced.
3.3 Data
The data in this paper are obtained from the China Statistical Yearbook, and other data are obtained from the China Carbon Accounting Database, the China Energy Statistics Yearbook, and the National Bureau of Statistics of China. Since the data inside the Carbon Accounting Database is only updated until 2019, the time period of the study is taken as 2001–2019.
Carbon emissions are calculated using the IPCC-described carbon emission coefficient approach for energy use. This technique combines the carbon emission coefficients of each energy source with eight distinct carbon sources, including coal, coke, kerosene, and natural gas. The following formula was utilized to calculate carbon emissions:
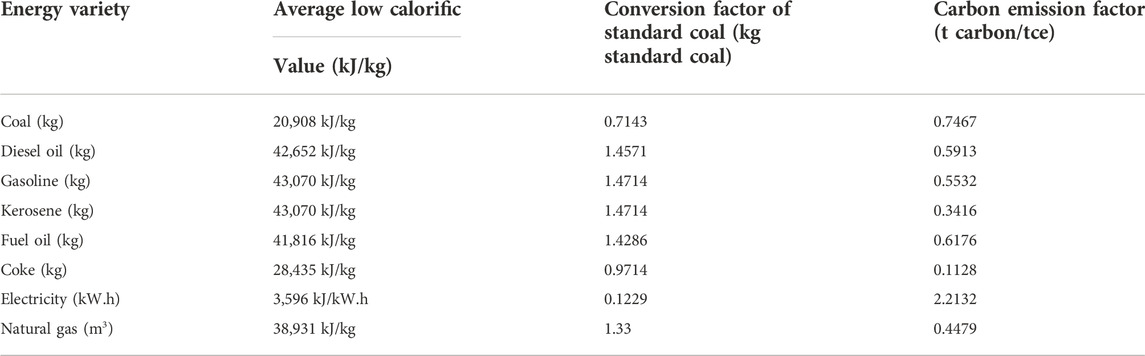
TABLE 3. Carbon emission factor and typical coal conversion factor.
The stats are descriptive for all variables are as below (Table 4).
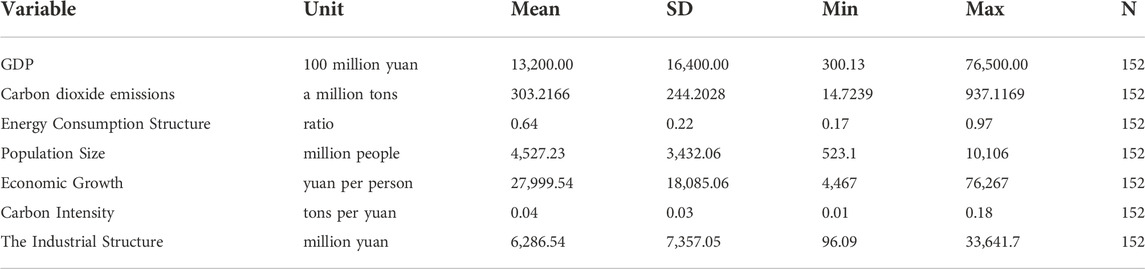
TABLE 4. Descriptive statistics of variables.
4 Analysis of results
4.1 Carbon emissions and economic growth in the YRB
Before commencing the study of decomposition, it is vital to have a solid understanding of the long-term patterns, as well as the current development state. As can be seen in Figure 4, the amount of carbon emissions produced by the entire YRB have increased on an annual basis from 2001 to 2019. However, the rate of economic growth has gradually slowed down as the Chinese economy has advanced to a level of development that is both of medium and high quality. Nevertheless, the pace of increase of carbon emissions has slowed down after experiencing tremendous growth, particularly during the period from 2012 to 2017 when carbon emissions showed nearly no rise at all.
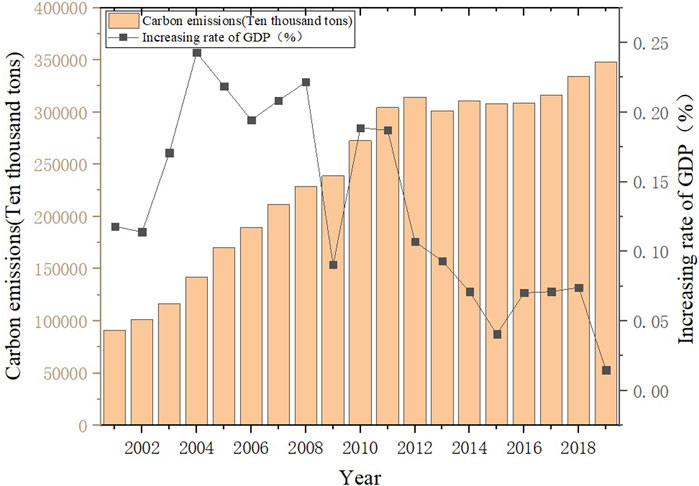
FIGURE 4. Carbon emissions and economic growth in the YRB.
As is shown in Figure 5, the pace of expansion of the economy in the upper reaches of the YRB is relatively slow, but the carbon emissions in this region are growing rapidly. After a short period of zero growth from 2012 to 2016, the carbon emissions show a rapid growth after 2017. This indicates that the economic development of the upper YRB relies heavily on high energy-consuming industries and the economic growth is not sustainable. After 2012, carbon emissions increase rate in the middle reaches of the YRB slowed down, which implies that these regions are not speeding up the growth rate of carbon emissions while simultaneously attaining economic progress. The economic expansion in the down reaches of the YRB is much superior to that of other areas, and the annual rate of economic expansion in these down reaches is noticeably larger than that of the upper and middle reaches. In the meanwhile, the pace of expansion of carbon dioxide output in the down reaches is also slowing down year by year. This trend became particularly noticeable in 2013 when the carbon emissions showed a more pronounced decline.

FIGURE 5. Carbon emission and economic growth of various regions in the YRB.
4.2 Decoupling relationship between carbon emissions and economic growth in the YRB
Overall, carbon emissions and economic expansion in the YRB exhibit an Expansion Negative Decoupling—Expansion Connection—Weak Decoupling—Strong Decoupling (Table 5). CO2 emissions and the growth of the economy in the majority of years exhibit a weak decoupling of economic growth and a slow increase in carbon emissions, while a few years exhibit a strong separation between growth in the economy and a drop in carbon emissions.
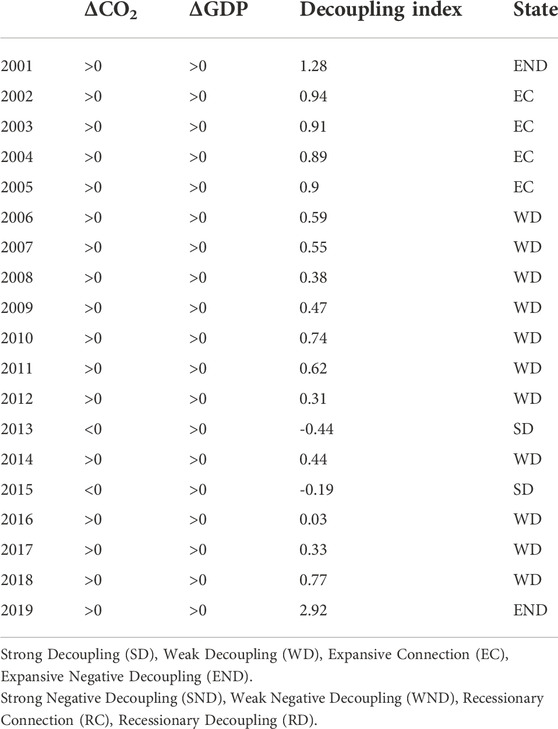
TABLE 5. Decoupling state of carbon emissions and economic growth in the YRB.
As seen below (Table 6), the decoupling of greenhouse gas emissions and economic development in the upper reaches weakens, displaying weak and strong decoupling until 2016, but strong negative decoupling, expansionary connection, and expansionary negative decoupling from 2016 to 2019. The decoupling of greenhouse gas emissions and economic development in the middle reaches exhibits a “U" shape, with expansionary negative decoupling before 2002 and weak decoupling after 2002, meaning a specific level of GDP gain is connected with a lesser increase in CO2 emissions. But in 2019, the middle reaches show an expansionary negative decoupling again. Before 2006, the dynamics of decoupling of carbon emissions and economic development in the down reaches showed an expansion negative decoupling and expansionary relationship with unsustainable economic growth. After 2006, it decoupled weakly and strongly in certain years.

TABLE 6. Decoupling of carbon emissions and economic growth in various regions of the YRB.
For each province in the YRB, it can be seen from Figure 6 that the decoupling relationship between emissions of carbon dioxide and the expansion of the economy in each province shows heterogeneity, which may essentially be classified into three primary groups. The first category is the four provinces of Henan, Shaanxi, Gansu and Qinghai, which show an overall trend of Expansion Negative Decoupling—Expansionary Connection—Weak Decoupling—Strong Decoupling. The second category is Shanxi and Shandong provinces, where emissions of carbon dioxide and the expansion of the economy generally show a Expansion Negative Decoupling—Weak Decoupling—Expansion Negative Decoupling, showing an “U"-shaped fluctuating trend. The third category is Ningxia and Inner Mongolia, whose carbon emissions and economic growth show an overall Weak Decoupling—Negative Decoupling, especially Ningxia is changing from the previous strong decoupling to the expansion negative decoupling. Inner Mongolia shows a weak decoupling overall until 2016, which means that as the economy expands, so do emissions of carbon; nonetheless, the rate of rise in emissions of carbon is usually lower than the pace of economic development; however, starting in 2016, emissions of greenhouse gases and economic expansion exhibit a strong negative decoupling.
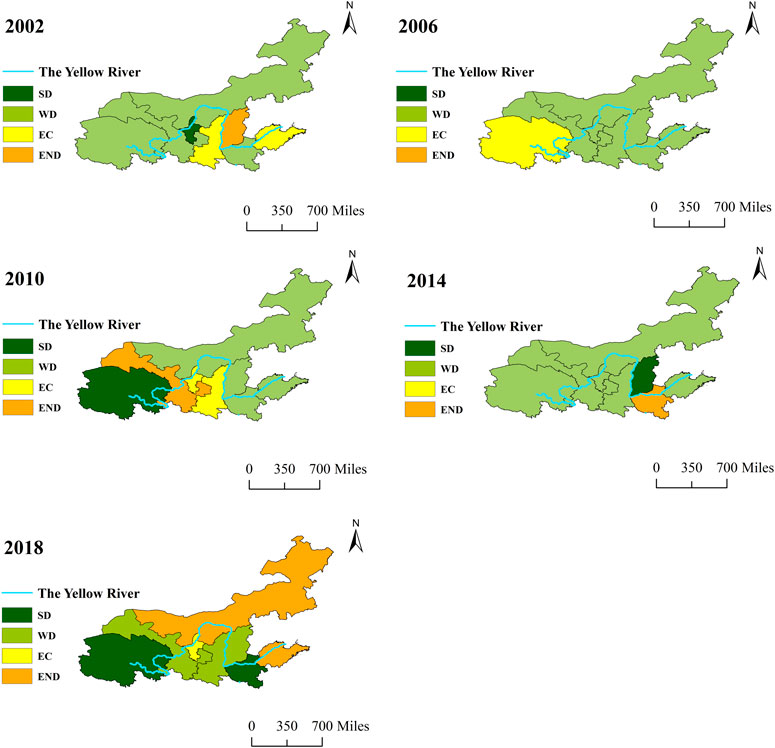
FIGURE 6. Decoupling of carbon emissions and economic growth in the YRB.
4.3 Carbon emission driving factors in the YRB
The results shown in Table 7 demonstrate that the influence of each driving element, as measured by the percentage change in total carbon emissions in the YRB, varies significantly, which are ranked in descending order of the degree of influence (the absolute value of the overall contribution of each decomposition factor to energy carbon dioxide output in the YRB), economic intensity effect, whose contribution rate is 233.33%, carbon emission intensity effect, whose contribution rate is -104.9%, energy consumption structure effect, whose contribution rate is -21.33%, industrial structure effect, whose contribution rate is -13.59%, and population size effect, whose contribution rate is 7.54%. In particular, the economic intensity effect and the population size effect are both positive in most years, which indicates that they have a positive driving effect on the change in carbon emission levels in general, and the expansion of these two effects, along with the increase in the total output value of the YRB, will cause the increase of energy carbon emission in the YRB; on the other hand, both the energy structure effect and the industrial structure effect are typically negative, which indicates that they have a negative driving result on the change in carbon emission Figure 7 provides a visual representation of the influence that each driving element has on carbon emissions. The growth in carbon emissions from YRB may be slowed down by decreasing the carbon intensity as well as improving the industrial and energy mix.
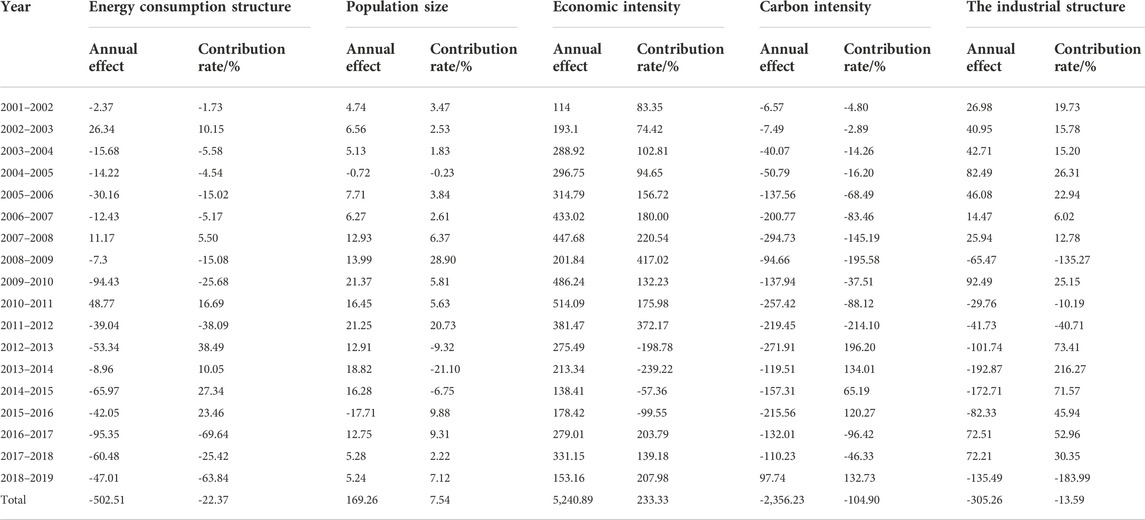
TABLE 7. Annual effects of various driving factors of carbon emissions in the YRB from 2001 to 2018.
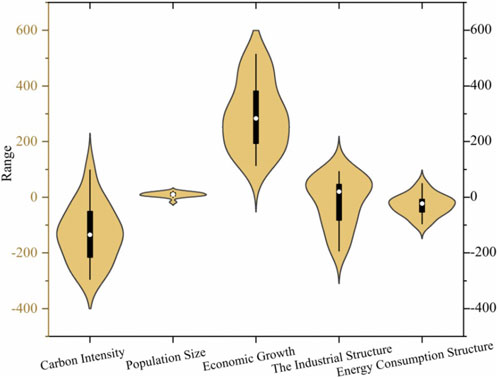
FIGURE 7. Contribution of each driving factor of carbon emissions in YRB from 2001 to 2018.
As for sub-regional, the underlying causes of carbon emissions in the upper and down reaches remain consistent with the whole YRB (Table 8), with economic intensity, energy consumption structure and carbon emission intensity remaining the three main influencing factors influencing greenhouse gas emissions. The key factor promoting carbon emissions is economic intensity, whereas the main variables reducing them are the structure of energy use and the intensity of carbon emissions. Roughly speaking, what influences carbon emissions in the middle reaches clearly show heterogeneity with the upper and down reaches. Although the influence of economic intensity and carbon emission intensity on carbon emissions remains consistent with upper and down reaches, energy consumption structure is no longer a factor inhibiting carbon emissions, but instead becomes the most significant factor affecting carbon emissions in the middle reaches.

TABLE 8. Effect of driving factors of carbon emissions in different regions.
Table 9 shows that, in the YRB from 2001 to 2005, the state of decoupling between increases in carbon emissions and overall economic growth is often expansionary connection state and the decoupling status is not perfect, meaning that emissions of carbon dioxide are growing at the same rate as the expansion of the economy. During this time period, the primary contributors to the rise in carbon emissions are the level of economic activity and the composition of the industrial sector, while carbon intensity inhibits the growth of greenhouse gas emissions. Between 2006 and 2018, the CO2 emissions and economic expansion in the YRB were typically in a favorable decoupling condition, which meant that, combined with economic expansion, the rate of carbon emissions rose at a low pace than the pace of economic development. During this period, the economic intensity still has the most significant bearing on levels of carbon emissions, and becomes the main factor to aggravate carbon emissions. And the structure of energy consumption, carbon emission intensity and industrial setting have become the main factors to curb carbon emissions. The comparison shows that the effect of industrial structure changed from a driving force to a suppressing force of carbon emissions in these two periods, from promoting carbon emissions in 2001–2005 to suppressing carbon emissions in 2006–2018. This proves that the industrial structure of the YRB is gradually upgrading and the level of advanced industrial structure is increasing.
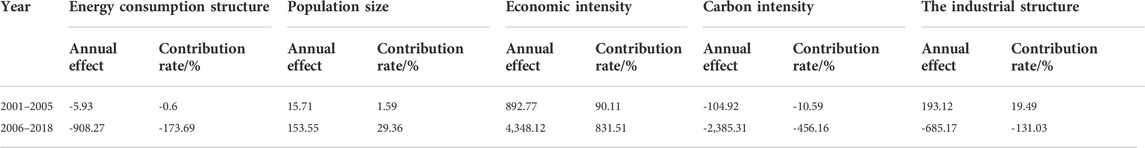
TABLE 9. Driving factors of carbon emissions in different periods.
5 Discussion
In academic circles, the relationship between carbon emissions and economic growth is always hot topic. At present, studies on the decoupling of the two have concentrated on the national, provincial and municipal levels, and less attention has been paid to the YRB, a special region. Therefore, the findings of this paper can provide important reference values for the whole other regions of China as well as other countries in the world.
In this research, we find that both increases in carbon emissions and economic development in the YRB indicate a general expansion. - negative decoupling - expansion connection - weak decoupling - strong decoupling, with the majority of years demonstrating a trend toward weak decoupling. It indicates that the economy depends less on energy and the sustainability of the economy has gradually increased, and these study’s conclusions are in line with the results of other scholars (Shi and Guo, 2022). It is worth mentioning that 2005 was the turning point of the change in the degree to which carbon emissions and economic development are uncoupled in the YRB, and the decoupling status changed from expansionary linkage to weak decoupling. This is mainly due to the high oil prices in 2005 that prompted many countries to adjust their energy policies, and countries have taken new initiatives to save energy and expand energy development. In this study, most of the four provinces in the first category, Henan, Shaanxi, Gansu, and Qinghai, show a strong decoupling of carbon emissions and growth after 2013, which is mostly connected to the actions taken by the Chinese government to save energy and reduce emissions during the 11th and 12th Five-Year Plans (Zhang and Xu, 2022). This relates mostly to the Chinese government’s energy-saving and measures for reducing emissions during the 11th and 12th Five-Year Plans. The uncoupling of growth in economic activity and increases in carbon emissions in Shanxi and Shandong provinces in the second category shows an inverted U-shape, indicating that although their economies have achieved rapid development, their industrial structure is not reasonable and their reliance on secondary industries is relatively large. In the third category, the decoupling trend of Inner Mongolia and Ningxia Autonomous Regions is gradually deteriorating. This is mostly attributable to the fact that the patterns of economic development in these two areas are excessively vast, and the expansion of their economies is highly reliant on sectors that have a high need for energy.
Among the variables that contribute to the YRB’s carbon emissions, on the one hand, the effects of economic intensity and population size have a favorable impact on carbon emissions, in general, which indicates that the economic growth in the YRB is strongly dependent on energy-consuming industries, while the expansion of population size generates more carbon emissions in all aspects of clothing, food, housing and transportation, and therefore also has a favorable impact on carbon emissions. On the other hand, industry structure and energy structure consequences have a dampening effect on carbon dioxide output in most years. Changes in industrial structure alter the magnitude of economic development and the manner in which the economy expands, which influence carbon emissions directly. As the industrial structure is upgraded, economic growth relies more on information and technology rather than raw energy inputs, which leads to a reduction in carbon dioxide output. Because the proportion of change in high-carbon energy consumption to the total energy consumed in each province (coke and raw coal are high-carbon energy sources, and their coefficients of carbon emissions are much higher than other energy sources) is associated with the growth of carbon emissions (Sun et al., 2022; Yuan et al., 2022), we should reduce the consumption of traditional fossil fuels and accelerate the development of new energy sources.
Through further heterogeneity analysis, this paper finds that the energy consumption structure in the middle reaches of the YRB is no longer a factor inhibiting carbon emissions, but instead becomes a factor driving carbon emissions. The key reason for this is because Shanxi province in the middle reaches of the YRB is the main concentration area of modern coal chemical industry in China, and the province’s industries are mainly concentrated in energy industries and industries with a high energy use such as coal, alumina, coke, iron and steel, and electric power, while light industries such as paper and textile account for less than 1% of the national share (Zhang X. M. et al., 2022). Due to the high energy consumption of heavy industries and the rigid demand for coke from heavy industries such as iron and steel, there is an imbalance in industrial setting and industrial structure (Yang et al., 2019). It results in a high intensity of energy usage and greenhouse gas emissions.
Finally, by time periods, this paper finds that the carbon emissions are driven by industrial structure influence in the decoupling state as a whole is the expansionary linkage state, while in the decoupling state as a whole is the weak decoupling state, the industrial structure effect becomes the inhibiting force of carbon dioxide output. This is primarily for the reason that the enhancement of industrial structure would encourage the development of energy efficiency, hence reducing carbon dioxide output, which is compatible with the findings of scholar study (Xiong et al., 2019).
6 Conclusion and recommendations
This paper investigates the decoupling of carbon emissions and economic development in the YRB of China using the Tapio model for decoupling elasticity decomposition and LMDI decomposition from different dimensions, as well as the factors that drive carbon dioxide output in the YRB, and the following conclusions are obtained.
First, the decoupling status of the YRB shows an Expansion Negative Decoupling—Expansion Connection—Weak Decoupling—Strong Decoupling, with most years showing a weak decoupling of economic expansion and slow increase in carbon dioxide output, and a few years showing a strong decoupling of growth in the economy and carbon emissions. The decoupling status of the down reaches is good, but the decoupling status of the upper and middle reaches is not optimistic, especially the decoupling status of the upper reaches even tends to deteriorate in recent years. In terms of provinces, four provinces in the first category, Henan, Shaanxi, Gansu and Qinghai, have a good decoupling trend, while two provinces in the second category, Shanxi and Shandong, show an “U"-shaped fluctuation in the decoupling trend of CO2 emissions and economic expansion. The condition of decoupling carbon dioxide output from economic development has worsened in the third group, which consists of the Ningxia and the Inner Mongolia.
Second, for the variables responsible for carbon emissions in the YRB, the economic intensity effect, the energy consumption structure effect and the industrial structure effect have the greatest influence on carbon dioxide output, among which the economic intensity effect becomes the most crucial motivating component of carbon emissions, while the energy consumption structure effect and the industrial structure effect mainly play a suppressing role on carbon emissions.
Third, further heterogeneity analysis reveals that, by region, for the middle reaches, energy consumption structure is no longer a factor inhibiting carbon emissions, however, this becomes the single most significant contributor to overall carbon emissions, and becomes the most crucial aspect influencing carbon emissions in the middle reaches. By time period, carbon emissions are mostly driven by the industrial structural impact in the decoupling state as a whole for the expansionary linkage state, while it becomes the inhibiting force of carbon dioxide output in the decoupling state as a whole for the weak decoupling state.
Based on this, the following suggestions for public policy are offered as a result of this study.
First, encourage the development of low-carbon industrial structure in the YRB. Efforts should be made to promote the low-carbon development of industries in the middle and lower reaches, and effectively implement the requirements of reducing carbon emission intensity. Improve the penetration rate of industrial Internet, artificial intelligence and big data to traditional industries, and promote the green transformation, intelligent upgrading and digital empowerment of the advantageous manufacturing industries in the YRB. Support Lanzhou New Area, Xi’an New Area and other national new areas and Zhengzhou Airport Economic Comprehensive Experimental Zone to refine and strengthen the leading industries. Give full play to the role of Gansu Lanbai Economic Zone, Ningxia Yinchuan-Shizuishan, Jinshan-Shaanxi-Yuanghe Golden Triangle to undertake industrial transfer demonstration area, and improve the ability to undertake domestic and foreign industrial transfer. Accelerate the improvement of the total carbon emission control system, in steel, chemical coal, thermal power and other industries to carry out pilot demonstrations of collaborative control of air pollutants and greenhouse gases.
Second, constantly optimize the energy structure. Henan and Shanxi will be included in the coal reduction and replacement areas, and improve the ecological compensation value mechanism. Explore the mechanism of trading the rights and interests of resources and environment in the YRB, and improve carbon trading and taxation policies. Implement clean energy price subsidies, improve the price and subsidy policy synergy mechanism for new energy development and utilization, and strengthen the coordination of clean energy subsidy policy with natural gas prices, electricity prices and other pricing mechanisms. Improve the policy of differential electricity prices for key industries such as metallurgical and chemical industry in the YRB, and guide coal-fired power plant enterprises to invest in the research, development and promotion of technology.
Third, according to local circumstances, energy conservation and emission reduction programs should be formulated rationally. The industrial structure and resource endowment of each region of the YRB varies greatly, local governments should make energy-saving emission reduction policies based on not only local economic growth and decoupling from carbon emissions, but also the city’s resource endowment, industrial advantages. At the same time, it should actively absorb the low-carbon development experience of the Pearl River Delta, the Yangtze River Delta, and the Beijing-Tianjin-Hebei region, promote the coordinated development of various industries, avoid falling into the trap of “resource curse” such as industrial structure homogenization and heavy-duty, and promote the establishment of low-carbon cooperative governance mechanisms among urban clusters such as Shandong Peninsula and Guanzhong Plain to encourage the qualitative development of the YRB.
However, the shortcomings of this paper are the lack of in-depth examination of the influencing mechanism of institutions that use energy, carbon emission intensity, industrial structure, economic intensity and population size on carbon emissions, and the insufficient use of data. In future studies, it is essential to further construct and empirically test the carbon emission impact mechanism model, and use more data for categorization and comparison in order to provide region-specific countermeasures.
Data availability statement
The raw data supporting the conclusion of this article will be made available by the authors, without undue reservation.
Author contributions
Conceptualization, YH and JZ; Methodology, YH and JZ; Resources, YH, JZ, and MY; Data curation, JZ and MY; Formal analysis, YH and JZ; Writing—original draft preparation, JZ and MY; Writing—review and editing, YH and JZ All authors have read and agreed to the published version of the manuscript.
Funding
This research was funded by the National Natural Science Foundation of China (72050001, and 72163020).
Conflict of interest
The authors declare that the research was conducted in the absence of any commercial or financial relationships that could be construed as a potential conflict of interest.
Publisher’s note
All claims expressed in this article are solely those of the authors and do not necessarily represent those of their affiliated organizations, or those of the publisher, the editors and the reviewers. Any product that may be evaluated in this article, or claim that may be made by its manufacturer, is not guaranteed or endorsed by the publisher.
References
Adams, S., Adedoyin, F., Olaniran, E., and Bekun, F. V. (2020). Energy consumption, economic policy uncertainty and carbon emissions; causality evidence from resource rich economies. Econ. Analysis Policy 68, 179–190. doi:10.1016/j.eap.2020.09.012
Bai, C. Q., Zhou, L., Xia, M. L., and Feng, C. (2020). Analysis of the spatial association network structure of China's transportation carbon emissions and its driving factors. J. Environ. Manag. 253, 109765. doi:10.1016/j.jenvman.2019.109765
Balsalobre-Lorente, D., and Leitao, N. C. (2020). The role of tourism, trade, renewable energy use and carbon dioxide emissions on economic growth: Evidence of tourism-led growth hypothesis in EU-28. Environ. Sci. Pollut. Res. 27, 45883–45896. doi:10.1007/s11356-020-10375-1
Dahmani, M., Mabrouki, M., and Ragni, L. (2021). Decoupling analysis of greenhouse gas emissions from economic growth: A case study of Tunisia. Energies 14, 7550. doi:10.3390/en14227550
Dong, B. Y., Ma, X. J., Zhang, Z. L., Zhang, H. B., Chen, R. M., Song, Y. Q., et al. (2020). Carbon emissions, the industrial structure and economic growth: Evidence from heterogeneous industries in China. Environ. Pollut. 262, 114322. doi:10.1016/j.envpol.2020.114322
Dong, Z., and Long, F. (2021). Executive summary of the policy study on the 14th five-year plan for structural adjustment and low carbon development in the Yellow River Basin. Beijing: Environmental Planning Institute of the Ministry of Ecology and Environment, 1–16.
Dong, F., Zhu, J., Li, Y. F., Chen, Y. H., Gao, Y. J., Hu, M. Y., et al. (2022). How green technology innovation affects carbon emission efficiency: Evidence from developed countries proposing carbon neutrality targets. Environ. Sci. Pollut. Res. 29, 35780–35799. doi:10.1007/s11356-022-18581-9
Ekundayo, D., Babatunde, S. O., Ekundayo, A., Perera, S., and Udeaja, C. (2019). Life cycle carbon emissions and comparative evaluation of selected open source UK embodied carbon counting tools. Constr. Econ. Build. 19, 220–242. doi:10.5130/ajceb.v19i2.6692
Gai, M., Cao, G., Tian, C., and Ke, L. (2014). Decoupling analysis of energy carbon emissions and regional economic growth in the liaoning coastal economic belt. Resour. Sci. 36, 1267–1277.
Gao, X., and Han, X. (2022). Study on the spatial differentiation and influencing factors of carbon emissions in the Yellow River Basin. Econ. Surv. 39, 13–23.
Han, Y. (2021). Study on the decoupling between economic development and resource and environment carrying capacity—take Gansu province as an example. Statistics Decis. 37, 121–124.
Hanbury, H., Bader, C., and Moser, S. (2019). Reducing working hours as a means to foster low(er)-carbon lifestyles? An exploratory study on Swiss employees. Sustainability 11, 2024. doi:10.3390/su11072024
Hossain, M. A., and Chen, S. (2022). The decoupling study of agricultural energy-driven CO2 emissions from agricultural sector development. Int. J. Environ. Sci. Technol. 19, 4509–4524. doi:10.1007/s13762-021-03346-7
Huang, P. P., Huang, J. H., Li, J. Y., Zhang, L., He, J., Caputo, C. A., et al. (2021). Effect of carbon doping on CO2-reduction activity of single cobalt sites in graphitic carbon nitride. Chemnanomat 7, 1051–1056. doi:10.1002/cnma.202100164
Hundie, S. K. (2021). Income inequality, economic growth and carbon dioxide emissions nexus: Empirical evidence from Ethiopia. Environ. Sci. Pollut. Res. 28, 43579–43598. doi:10.1007/s11356-021-13341-7
Jin, F. (2019). Coordinated promotion strategy of ecological protection and high-quality development in the Yellow River Basin. Chongqing: Reform, 33–39.
Karakaya, E., Bostan, A., and Ozcag, M. (2019). Decomposition and decoupling analysis of energy-related carbon emissions in Turkey. Environ. Sci. Pollut. Res. 26, 32080–32091. doi:10.1007/s11356-019-06359-5
Kaur-Sidhu, M., Ravindra, K., Mor, S., and John, S. (2020). Emission factors and global warming potential of various solid biomass fuel-cook stove combinations. Atmos. Pollut. Res. 11, 252–260. doi:10.1016/j.apr.2019.10.009
Kaya, Y. (1989). Impact of carbon dioxide emission on GNP growth: Interpretation of proposed scenarios. Washington: IPCC Response Strategies Working Group.
Khalfaoui, R., Tiwari, A. K., Khalid, U., and Shahbaz, M. (2021). Nexus between carbon dioxide emissions and economic growth in G7 countries: Fresh insights via wavelet coherence analysis. J. Environ. Plan. Manag. 66, 31–66. doi:10.1080/09640568.2021.1978062
Liang, L. W., Chen, M. X., and Lu, D. D. (2022). Revisiting the relationship between urbanization and economic development in China since the reform and opening-up. Chin. Geogr. Sci. 32, 1–15. doi:10.1007/s11769-022-1255-7
Liu, J. L., Yin, M. J., Wang, K., Zou, J., and Kong, Y. (2020). Long-term impacts of urbanization through population migration on China's energy demand and CO2 emissions. Mitig. Adapt. Strateg. Glob. Change 25, 1053–1071. doi:10.1007/s11027-020-09919-0
Lundquist, S. (2021). Explaining events of strong decoupling from CO2 and NOx emissions in the OECD 1994-2016. Sci. Total Environ. 793, 148390. doi:10.1016/j.scitotenv.2021.148390
Marques, A. C., Fuinhas, J. A., and Leal, P. A. (2018). The impact of economic growth on CO2 emissions in Australia: The environmental kuznets curve and the decoupling index. Environ. Sci. Pollut. Res. 25, 27283–27296. doi:10.1007/s11356-018-2768-6
Mikayilov, J. I., Hasanov, F. J., and Galeotti, M. (2018). Decoupling of CO2 emissions and GDP: A time-varying cointegration approach. Ecol. Indic. 95, 615–628. doi:10.1016/j.ecolind.2018.07.051
Mo, J., Duan, H., Fan, Y., and Wang, S. (2018). China's energy and climate targets in the Paris agreement: Integrated assessment and policy options. Econ. Res. J. 53, 168–181.
Moutinho, V., Santiago, R., Fuinhas, J. A., and Marques, A. C. (2020). The driving forces of energy-related carbon dioxide emissions from South Latin American countries and their impacts on these countries' process of decoupling. Environ. Sci. Pollut. Res. 27, 20685–20698. doi:10.1007/s11356-020-08510-z
Razzaq, A., Fatima, T., and Murshed, M. (2021). Asymmetric effects of tourism development and green innovation on economic growth and carbon emissions in top 10 GDP countries. J. Environ. Plan. Manag., 1–30. doi:10.1080/09640568.2021.1990029
Rong, T. Q., Zhang, P. Y., Jing, W. L., Zhang, Y., Li, Y. Y., Yang, D., et al. (2020). Carbon dioxide emissions and their driving forces of land use change based on economic contributive coefficient (ECC) and ecological support coefficient (ESC) in the lower Yellow River region (1995-2018). Energies 13, 2600. doi:10.3390/en13102600
Rosselot, K., Allen, D. T., and Ku, A. Y. (2022). Global warming breakeven times for infrastructure construction emissions are underestimated. ACS Sustain. Chem. Eng. 10, 1753–1758. doi:10.1021/acssuschemeng.1c08253
Shi, H., and Guo, Y. (2022). Decoupling relationship between economic development and carbon emissions in the Yellow River Basin. Sci. Technol. Industry 22, 226–230.
Shi, W., Tang, W. W., Qiao, F. W., Sha, Z. Q., Wang, C. Y., and Zhao, S. X. (2022). How to reduce carbon dioxide emissions from power systems in Gansu province-analyze from the life cycle perspective. Energies 15, 3560. doi:10.3390/en15103560
Song, H. H., Gu, L. Y., Li, Y. F., Zhang, X., and Song, Y. (2022). Research on carbon emission efficiency space relations and network structure of the Yellow River Basin city cluster. Int. J. Environ. Res. Public Health 19, 12235. doi:10.3390/ijerph191912235
Spawn, S. A., Lark, T. J., and Gibbs, H. K. (2019). Carbon emissions from cropland expansion in the United States. Environ. Res. Lett. 14, 045009. doi:10.1088/1748-9326/ab0399
Su, Z. X., Zhang, G. X., Xu, L., Geng, G. H., Wang, Y. C., and Ali, I. (2021). Carbon emission performance in logistics in the Yellow River Basin. Desalination Water Treat. 220, 14–21. doi:10.5004/dwt.2021.27072
Sun, H. Y., and Chen, F. S. (2022). The impact of green finance on China's regional energy consumption structure based on system GMM. Resour. Policy 76, 102588. doi:10.1016/j.resourpol.2022.102588
Sun, X. M., Zhang, H. T., Ahmad, M., and Xue, C. K. (2022). Analysis of influencing factors of carbon emissions in resource-based cities in the Yellow River basin under carbon neutrality target. Environ. Sci. Pollut. Res. 29, 23847–23860. doi:10.1007/s11356-021-17386-6
Sun, Y., and Zhou, M. (2017). Decoupling and driving factors analysis between the energy carbon emissions and economic growth in China. Rev. Econ. Manag. 33, 21–30.
Tapio, P. (2005). Towards a theory of decoupling: Degrees of decoupling in the EU and the case of road traffic in Finland between 1970 and 2001. Transp. Policy 12, 137–151. doi:10.1016/j.tranpol.2005.01.001
Waheed, R., Sarwar, S., and Wei, C. (2019). The survey of economic growth, energy consumption and carbon emission. Energy Rep. 5, 1103–1115. doi:10.1016/j.egyr.2019.07.006
Wang, B., Wang, L., Xiang, N., Qu, Q., and Xiong, C. (2022). Comparison of ArcGIS and SAS geostatistical analyst to estimate population-weighted monthly temperature for US counties. J. Resour. Ecol. 13, 220–229. doi:10.5814/j.issn.1674-764x.2012.03.004
Wang, J., Li, Z., and Gu, J. (2021). Decoupling analysis between energy consumption and economic growth in BRICS countries: Based on Tapio decoupling and LMDI model analysis. World Reg. Stud. 30, 501–508.
Wang, Q., Zhao, M. M., Li, R. R., and Su, M. (2018). Decomposition and decoupling analysis of carbon emissions from economic growth: A comparative study of China and the United States. J. Clean. Prod. 197, 178–184. doi:10.1016/j.jclepro.2018.05.285
Wei, L. Y., Li, C., Wang, J., Wang, X., Wang, Z., Cui, C., et al. (2020). Rising middle and rich classes drove China's carbon emissions. Resour. Conservation Recycl. 159, 104839. doi:10.1016/j.resconrec.2020.104839
Wu, H., Fang, S. M., Zhang, C., Hu, S. W., Nan, D., and Yang, Y. Y. (2022). Exploring the impact of urban form on urban land use efficiency under low-carbon emission constraints: A case study in China's Yellow River Basin. J. Environ. Manag. 311, 114866. doi:10.1016/j.jenvman.2022.114866
Xia, C. X., Wang, Z. L., and Xia, Y. H. (2021). The drivers of China's national and regional energy consumption structure under environmental regulation. J. Clean. Prod. 285, 124913. doi:10.1016/j.jclepro.2020.124913
Xiang, X. W., Ma, M. D., Ma, X., Chen, L. M., Cai, W. G., Feng, W., et al. (2022). Historical decarbonization of global commercial building operations in the 21st century. Appl. Energy 322, 119401. doi:10.1016/j.apenergy.2022.119401
Xiong, S. Q., Ma, X. M., and Ji, J. P. (2019). The impact of industrial structure efficiency on provincial industrial energy efficiency in China. J. Clean. Prod. 215, 952–962. doi:10.1016/j.jclepro.2019.01.095
Xu, L. N., Li, Y. N., Chen, S. Z., and Yang, X. F. (2020). Analyzing impact factors of energy consumption in Yellow River Basin of China-taking Shanxi province as an example. J. Coast. Res. 115, 539–542. doi:10.2112/jcr-si115-147.1
Xu, M., Zhang, X., Shen, S., Wei, S. J., and Fan, J. L. (2021). Assessment of potential, cost, and environmental benefits of CCS-EWR technology for coal-fired power plants in Yellow River Basin of China. J. Environ. Manag. 292, 112717. doi:10.1016/j.jenvman.2021.112717
Xue, Z. Q., Li, N., Mu, H. L., and Jiang, Y. Q. (2019). Abatement potential and shadow price of carbon dioxide emissions from fuel combustion in China's secondary industry. Clim. Res. 79, 9–22. doi:10.3354/cr01572
Yang, H., Peng, C., Yang, X. N., and Li, R. X. (2019). Does change of industrial structure affect energy consumption structure: A study based on the perspective of energy grade calculation. Energy Explor. Exploitation 37, 579–592. doi:10.1177/0144598718784032
Yang, Y., and Sun, J. (2019). Study on decoupling and driving factors of carbon emissions from energy consumption in major countries in the world. Coal Eng. 51, 173–177.
Yu, S. W., Hu, X., Fan, J. L., and Cheng, J. H. (2018). Convergence of carbon emissions intensity across Chinese industrial sectors. J. Clean. Prod. 194, 179–192. doi:10.1016/j.jclepro.2018.05.121
Yuan, X. L., Sheng, X. R., Chen, L. P., Tang, Y. Z., Li, Y., Jia, Y. S., et al. (2022). Carbon footprint and embodied carbon transfer at the provincial level of the Yellow River Basin. Sci. Total Environ. 803, 149993. doi:10.1016/j.scitotenv.2021.149993
Zhang, P. Y., Pang, B., Li, Y. Y., He, J. J., Hong, X., Qin, C. Z., et al. (2019a). Analyzing spatial disparities of economic development in Yellow River Basin, China. Geojournal 84, 303–320. doi:10.1007/s10708-018-9860-9
Zhang, X., Huang, X., Da, Z., Geng, T., Tian, L., Fan, Y., et al. (2022a). Energy economy under carbon neutral target transformation path and policy research. J. Manag. World 38, 35–66.
Zhang, X. M., Su, B., Yang, J., and Cong, J. H. (2022b). Analysis of Shanxi Province's energy consumption and intensity using input-output framework (2002-2017). Energy 250, 123786. doi:10.1016/j.energy.2022.123786
Zhang, Y., Kang, W. M., Wang, M., and Zhuang, L. (2019b). Carbon tariffs' impacts on China's economy and carbon emission: A study based on META-regression analysis. Chn. J. Urb. Environ. Stud. 7, 1950012. doi:10.1142/s234574811950012x
Zhang, Y., and Xu, X. Y. (2022). Carbon emission efficiency measurement and influencing factor analysis of nine provinces in the Yellow River basin: Based on SBM-DDF model and tobit-CCD model. Environ. Sci. Pollut. Res. 29, 33263–33280. doi:10.1007/s11356-022-18566-8
Zhao, J. J., Kou, L., Wang, H. T., He, X. Y., Xiong, Z. H., Liu, C. Q., et al. (2022). Carbon emission prediction model and analysis in the Yellow River Basin based on a machine learning method. Sustainability 14, 6153. doi:10.3390/su14106153
Keywords: carbon emissions, economic growth, Tapio decoupling model, Kaya’s equation, LMDI decomposition method
Citation: Han Y, Zhang J and Yuan M (2022) Carbon emissions and economic growth in the Yellow River Basin: Decoupling and driving factors. Front. Environ. Sci. 10:1089517. doi: 10.3389/fenvs.2022.1089517
Received: 04 November 2022; Accepted: 21 November 2022;
Published: 30 November 2022.
Edited by:
Minda Ma, Lawrence Berkeley National Laboratory, United StatesCopyright © 2022 Han, Zhang and Yuan. This is an open-access article distributed under the terms of the Creative Commons Attribution License (CC BY). The use, distribution or reproduction in other forums is permitted, provided the original author(s) and the copyright owner(s) are credited and that the original publication in this journal is cited, in accordance with accepted academic practice. No use, distribution or reproduction is permitted which does not comply with these terms.
*Correspondence: Yan Han, eWluZ3l1aHlAMTYzLmNvbQ==; Jiajie Zhang, amlhamllemhhbmcyNThAMTYzLmNvbQ==