 Yong Yang
 Rensheng Chen
 Yongjian Ding
 Qiudong Zhao
 Hongyuan Li
 Zhangwen Liu
- 1Qilian Alpine Ecology and Hydrology Research Station, Northwest Institute of Eco-Environment and Resources, Chinese Academy of Sciences, Lanzhou, China
- 2Key Laboratory of Ecohydrology of Inland River Basin, Northwest Institute of Eco-Environment and Resources, Chinese Academy of Sciences, Lanzhou, China
- 3College of Urban and Environmental Sciences, Northwestern University, Xi’an, China
- 4State Key Laboratory of Cryospheric Sciences, Northwest Institute of Eco-Environment and Resources, Chinese Academy of Sciences, Lanzhou, China
- 5University of Chinese Academy of Sciences, Beijing, China
The hydrological processes in the Three-River Headwaters Region (TRHR), which is located in the Qinghai-Tibetan Plateau and includes the Yangtze River Headwater Region (YARHR), the Yellow River Headwater Region (YERHR), and the Lantsang River Headwater Region (LARHR), have changed under climate warming. Based on multi-source data, the spatial and temporal changes in precipitation, evapotranspiration, soil water storage, glacier melt, snowmelt and runoff in the Three-River Headwaters Region from 1982 to 2014 were comprehensively analysed. The annual precipitation data for the Three-River Headwaters Region from ERA5-Land, the Climatic Research Unit, the China Meteorological Forcing Dataset and the Global Land Data Assimilation System (GLDAS) all showed an increasing trend; the annual evapotranspiration data from ERA5-Land, Global Land Data Assimilation System, Global Land Evaporation Amsterdam Model (GLEAM) and Terrestrial Evapotranspiration Dataset across China (TEDC) all showed an increasing trend; and the annual soil water storage data from ERA5-Land, Global Land Data Assimilation System and Global Land Evaporation Amsterdam Model all showed an increasing trend. The annual snowmelt data from ERA5-Land, Global Land Data Assimilation System and SMT-Y datasets all showed a decreasing trend. The annual glacier melt increased in the Yangtze River Headwater Region and Yellow River Headwater Region and decreased in the Lantsang River Headwater Region. The increases in precipitation, evapotranspiration, soil water content and glacial melt, and the decreases in snowfall and snowmelt indicate an accelerated hydrological cycle in the Three-River Headwaters Region over the 1982 to 2014 period. The significant increase in precipitation is the main reason for the significant increase in runoff in the Yangtze River Headwater Region. The increase in precipitation in the Yellow River Headwater Region was less than the sum of the increase in evapotranspiration and soil water storage, resulting in a decreasing trend of runoff in the Yellow River Headwater Region. The increase in precipitation in the Lantsang River Headwater Region was slightly larger than the sum of that in evapotranspiration and soil water storage, and there was an insignificant increase in the runoff in the Lantsang River Headwater Region.
1 Introduction
Climate warming is changing the hydrological cycle, which poses significant challenges to ecosystems, the environment and human society (Held and Soden, 2006; Zika et al., 2018). Understanding the changes in the water cycle under global warming is critical to mitigating the impact of climate change (Sohail et al., 2022). Due to its unique high altitude and topography, the Qinghai-Tibetan Plateau is considered to be an “initiator” and “amplifier” of climate change (Meng et al., 2022). From 1980 to 2018, the Qinghai-Tibetan Plateau warmed at 0.42°C per decade, twice the global average rate, and marked atmospheric warming has changed the hydrological cycle of this so-called Asian water tower (Yao et al., 2022). The Three-River Headwaters Region (TRHR), in the hinterland of the Qinghai-Tibetan Plateau in China, includes three separate headwater regions, namely, the Yellow River Headwater Region (YERHR), the Yangtze River Headwater Region (YARHR) and Lantsang River Headwater Region (LARHR). Changes in the water cycle of the TRHR under climate warming will directly affect the freshwater supply of China and its surrounding regions.
The TRHR has experienced clear climate changes over the past few decades (Chu et al., 2019; Tang and Cao, 2021), and many studies have reported trends in hydro-climatic indicators based on in-situ observation data. Observation data obtained from 20 meteorological stations inside the TRHR revealed that the spatial averaged warming rate was 0.37°C/(10a) from 1961 to 2019, which was above the global average, and also significantly higher than that at the same latitude and in China (Jin et al., 2021). Shi et al. (2016) analysed precipitation data from 29 meteorological stations inside and around the TRHR from 1961 to 2014, and found that the annual precipitation of 26 stations showed an increasing trend, with 16 stations showing a statistically significant change. Evapotranspiration is one of the most important components of the hydrological cycle. Due to the lack of actual evapotranspiration observations in conventional observation data from meteorological stations, only pan evaporation has been observed. Qi et al. (2015) studied pan evaporation at 14 meteorological stations in the TRHR and found that annual pan evaporation showed a significant upward trend from 1964 to 2013. Using the Penman-Monteith formula, Wen et al. (2020) calculated potential evapotranspiration at 14 meteorological stations in the TRHR and found an increasing trend from 2000 to 2018. In recent years, many studies based on data from hydrological stations, have reported runoff changing trends in the TRHR. The annual runoff from 1960 to 2009 showed a decrease trend in the YERHR and LARHR and an increase trend in the YARHR (Mao et al., 2016). In-situ observation data demonstrate the changes in the hydrological processes in the TRHR. However, most of the meteorological stations in the TRHR are located in low-elevation areas in the lower reaches of the YERHR in the northeastern part of the region (Jin et al., 2021). Due to the lack of high-elevation meteorological stations, in-situ observation data may not represent the overall hydrological changes of the entire TRHR. To better understand the temporal and spatial changes in hydrological processes in the TRHR, gridded hydrometeorological data have been used.
The gridded hydrometeorological data in the TRHR are mainly obtained by interpolation of meteorological station observation data, and various data products come from reanalysis, remote sensing, data assimilation or hydrological models. Yi et al. (2013) used the spline method to interpolate the precipitation data from 12 meteorological stations into the TRHR to analyse the precipitation changes, and found that the annual and seasonal precipitation in the TRHR increased from 1961 to 2010, but the summer precipitation in the LARHR and the autumn precipitation in the YARHR decreased. Based on the reference evapotranspiration calculated at 25 meteorological stations, Wang et al. (2020) used the inverse distance weighting method to generate a 0.5° × 0.5° gridded reference evapotranspiration dataset in the TRHR for 1961 to 2016, and found a statistically significant increase for most grid cells and a decreased for only a few grid cells located at the southern and northern edges of the TRHR. Using the GSMaP remote sensing products and ERA5 reanalysis data, Meng et al. (2022) analysed the spatial and temporal variability of precipitation from 2001 to 2019, and concluded that the annual precipitation decreased slightly in the north and west and increased slightly in the east and south parts of the TRHR. Xu et al. (2018) used soil moisture data from the Global Land Data Assimilation System (GLDAS) to analyse the spatial and temporal variability of soil water, and found that soil water increased mainly appeared in the peripheral regions of the TRHR, but decreased for most parts of the TRHR from 2003 to 2014. However, these studies focused on the spatiotemporal variation in individual water cycle elements. The four fundamental variables of the watershed hydrological cycle, precipitation, evapotranspiration, soil water storage and runoff (Masuda et al., 2001), have seldom been simultaneously considered for the TRHR. In addition, most previous studies were based on only one dataset. Comprehensive analysis of multiple data sets can narrow down uncertainties and better capture the temporal and spatial variations of hydrometeorological variables (Gusain et al., 2020; Shang et al., 2021).
Due to its high elevation and low temperature, cryospheric elements such as glaciers, snow, permafrost and seasonal frozen ground are found across the TRHR throughout the year. With the accelerated warming in the region, the cryospheric elements have changed, affecting the regional hydrological processes (Li et al., 2021b). According to Landsat Thematic Mapper/Operational Land Imager data, from 2000 to 2018, the number of glaciers in the TRHR region decreased by 69, and the glacier area decreased by 271.95 km2 (Zhang et al., 2022a). Under the conditions of rapid regional warming, the glacier runoff in the three basins all present an obvious increasing trend from 1961 to 2012 (Jiang et al., 2016). The observation data from 19 meteorological stations show that the mean annual snowfall in the TRHR was 146.5 mm from 1961 to 2019, and snowfall has decreased by 14.8 mm per 10 years (Liu et al., 2022). Due to the decrease in snowfall, the contribution of snowmelt water to the total streamflow decreased from 1971 to 2017 among the three basins, and the rate of decrease was highest over the LARHR, at 0.24%/year (Li et al., 2021a). Permafrost degradation in the TRHR also affects hydrological processes, which may lead to an increase in the proportion of winter discharge contribution to total annual flow and a decreased recession coefficient (Wang et al., 2017).
The aim of this study was to systematically and comprehensively analyse the changes in the hydrological cycle in the TRHR due to climate warming based on multi-source hydrometeorological data, to 1) investigate the spatiotemporal variation of hydrological variables in the TRHR, 2) analyse the changes of glacier melt and snowmelt in the TRHR and 3) explore the differences in changes in the hydrological cycles of the three sub-basins of the TRHR. The results reveal the characteristics of the hydrological cycle in the region and provide a reference for understanding the changes in hydrological processes in the Qinghai-Tibetan Plateau and other cold regions against the background of climate warming.
2 Materials and methods
2.1 Study area
The Three-River Headwaters Region (TRHR), is located in the hinterland of the Qinghai-Tibetan Plateau. Previous studies of the region have used slightly different study areas. Some researchers have chosen the Sanjiangyuan National Nature Reserve as the research area (Ding et al., 2018; Wang et al., 2020), while others have chosen the three watershed basins area controlled by three hydrological sections as their research object (Chu et al., 2019; Li et al., 2021b). In this paper, the study area is a synthesis of the above two areas (31.02°N–37.14°N and 89.40°E–103.41°E), with an area of about 42.60 × 10⁴ km2 (Figure 1). The topography of the TRHR is mainly mountainous, and the elevation in the TRHR ranges widely from 2000 to 6,580 m, with an average elevation of 4,430 m. The TRHR has a typical plateau continental climate, with alternating hot and cold seasons, distinct wet and dry seasons (Jiang et al., 2017). In 2008, the TRHR contained 1,555 glaciers distributed in the northwest, southwest, central, and eastern parts of the region and covering an area of 2,297.93 km2 (Chen et al., 2022). Alpine meadows and alpine grasslands are the main vegetation types in the TRHR (Liu et al., 2008). The three sub-basins, the YERHR, YARHR and LARHR, are controlled by Tangnaihai, Zhimenda and Changdu hydrological stations, respectively, which are 12.3 × 10⁴ km2, 13.9 × 10⁴ km2 and 5.4 × 10⁴ km2 in size, respectively.
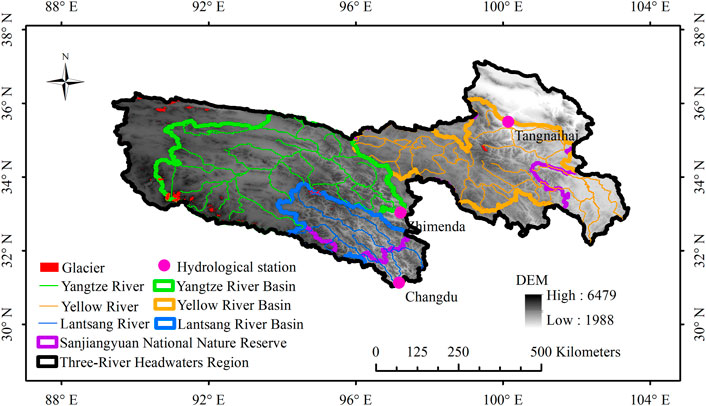
FIGURE 1. Distribution of hydrological stations and three sub-basins in the Three-River Headwaters Region.
2.2 Data collection
In this study, multi-source hydrometeorological datasets were selected to comprehensively analyse the hydrological process changes in the TRHR. To unify the timescale of the spatiotemporal changes, all data except glacier area were collected for the 1982 to 2014 period. The basic information about the collected datasets is shown in Table 1. The soil water storage data were derived from the soil water content data of each dataset and unified as the total water content of the 200 cm thick soil layer, without considering groundwater.
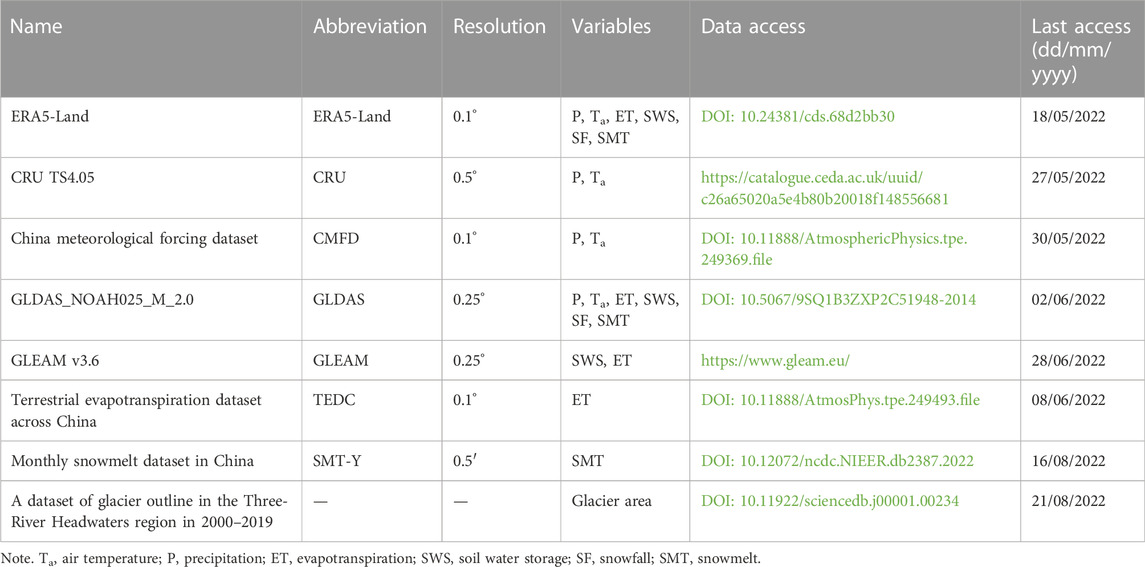
TABLE 1. Summary of datasets used in this study.
2.2.1 ERA5-Land
The ERA5-Land dataset of the European Centre for Medium-Range Weather Forecasts (ECMWF) replays the land component of ERA5 climate reanalysis. It is a reanalysis dataset providing a consistent view of the evolution of land variables over several decades at an enhanced resolution compared to ERA5. Data are available hourly or monthly and can be downloaded on a regular latitude/longitude grid of 0.1° × 0.1° (Muñoz-Sabater et al., 2021). In this study, multiple ERA5-Land data including air temperature, precipitation, snowfall, snowmelt and soil water data were collected for the TRHR.
2.2.2 CRU TS v4.05
Gridded Climatic Research Unit (CRU) Time-Series (TS) version 4.05 data, with a spatial resolution of 0.5° × 0.5°, were produced by CRU at the University of East Anglia and funded by the UK National Centre for Atmospheric Science. The data were produced using angular-distance weighting interpolation for the 1901–2020 period (Harris et al., 2020). In this study, two CRU data including air temperature and precipitation were collected for the TRHR.
2.2.3 China meteorological forcing dataset
As a high spatial-temporal resolution gridded near-surface meteorological dataset, the China Meteorological Forcing Dataset (CMFD) was made by fusing remote sensing products, reanalysis dataset and in-situ observation data at meteorological stations. With a spatial resolution of 0.1° × 0.1°, the CMFD was developed specifically for studies of land surface processes in China (He et al., 2020). In this study, two CMFD data including air temperature and precipitation were collected for the TRHR.
2.2.4 GLDAS Noah Land Surface Model V2.0
The Global Land Data Assimilation System (GLDAS) is a global land surface data assimilation system jointly developed by National Aeronautics and Space Administration and National Oceanic and Atmospheric Administration (Rodell et al., 2004). The GLDAS includes multiple land surface models, and the air temperature, precipitation, soil water, snowfall and snowmelt data from the Noah Land Surface Model were selected for this study.
2.2.5 GLEAM V3.6a
With a spatial resolution of 0.25° × 0.25°, the Global Land Evaporation Amsterdam Model (GLEAM) is a set of algorithms dedicated to the estimation of terrestrial evapotranspiration and soil moisture from satellite data (Martens et al., 2017). The GLEAM evapotranspiration and soil water data were used in this study.
2.2.6 Terrestrial evapotranspiration dataset across China
The Terrestrial Evapotranspiration Dataset across China (TEDC) dataset (version 1.5) is derived from a calibration-free nonlinear complementary relationship model. The inputs of the model are from CMFD, ERA5-Land and global land surface satellite (GLASS) products and National Centers for Environmental Prediction (NCEP) data. The spatial resolution of this dataset is 0.1° × 0.1° (Ma et al., 2019).
2.2.7 Monthly snowmelt dataset in China
Based on high spatial resolution precipitation and temperature data, Yang et al. (2022a) produced a monthly snowmelt dataset for China (SMT-Y) using a simple temperature index model. Because snowmelt is difficult to measure directly, the calculated snowmelt was verified using snowfall, snow depth, snow cover extent and snow water equivalent data, which indicated that is reliable (Yang et al., 2022b). The spatial resolution of this data is 0.5′ × 0.5′.
2.2.8 Glacier area and glacier melt in the TRHR
In the first Chinese glacier inventories (CGI) (Li et al., 2008; Wu and Li, 2011), the aerial photographs and topographic maps were used to establish glacier distributions in the TRHR in 1966, 1967, 1969, 1970, 1971 and 1974. In this study, the data from CGI are taken as the glacier areas in 1970s in the TRHR. Based on ASTER GDEM and Landsat TM/OLI images acquired, Zhang et al. (2022b) used the band ratio method combined with manual revision to obtain the outlines of glaciers in the TRHR in 2000, 2010, and 2019. In this study, the change in glacier areas in the TRHR were analysed for four periods: the 1970s, 2000, 2010 and 2019. The glacier melt data in the TRHR from 1982 to 2014 were collected from the published paper (Zhao et al., 2019).
2.2.9 River runoff in the TRHR
Monthly runoff data from three hydrological gauging stations including Tangnaihai, Zhimenda and Changdu were obtained from the Hydrographic Yearbooks of the People’s Republic of China.
2.3 Trend analysis
In this study, the non-parametric Mann-Kendall test (Mann, 1945; Kendall, 1975) was used to examine the trend and significance level of the hydrometeorological variables from 1982 to 2014. The standard normal statistic Z was calculated as follows:
where n is the number of datasets, m is the number of tied groups and ti denotes the number of ties of extent i, and xj and xk are the data values in time series j and k, respectively. A tied group is a set of sample data having the same value. A positive value of Z indicates an increasing trend, and a negative value indicates a decreasing trend. Testing trends is done at the specific α significance level. If
Sen’s slope method (Sen, 1968) was used to analyse the slope of the variation:
where β > 0 represents an increase in the trend, and β < 0 represents a decrease in the trend. The value of β indicates the steepness of the trend.
3 Results
3.1 Spatial and temporal variability in hydrometeorological variables
3.1.1 Air temperature
Four different datasets—ERA5-Land, CRU, CMFD and GLDAS—were used to analyse the spatial and temporal variability in air temperature. These multi-source datasets firmly support a strong warming trend in the TRHR. The mean annual air temperature in the TRHR from 1982 to 2014 according to ERA5-Land, CRU, CMFD and GLDAS was −5.29°C, −3.04°C, −3.51°C and −2.77°C, respectively. The mean annual air temperatures from the different datasets show similar spatial distribution characteristics, gradually increasing from the west to the east (Figures 2A,D,G,J). The Sen’s slopes for the four datasets show that the annual temperature increased from 1982 to 2014 in almost all grids (Figures 2B, E,H,K). The annual temperatures only decreased in a few areas in the northeastern TRHR according to the GLDAS data (Figure 2K), but the decrease was not statistically significant (Figure 2L). There were spatial differences in the statistically significance of the temperature increases indicated by the four datasets. The Mann-Kendall test showed that the ERA5-Land dataset identified the smallest area with a significant increasing trend in temperature from 1982 to 2014, and this area was distributed in the eastern part of the TRHR, that is, the downstream region of the YERHR; in contrast, the area with a significant increasing trend identified by CMFD dataset covered almost the whole of the TRHR. The CRU and GLDAS datasets showed similar spatial distributions of significant temperature change, mainly in the YARHR, LARHR and the upstream region of the YERHR (Figures 2C, F,I,L). From 1982 to 2014, the linear trends of annual air temperature increases in the TRHR according to the ERA5-Land, CRU, CMFD and GLDAS were 0.23°C, 0.27°C, 0.66°C, and 0.26°C per decade, respectively (Figure 3A). Only the temperature change indicated by the ERA5-Land data was not statistically significant.
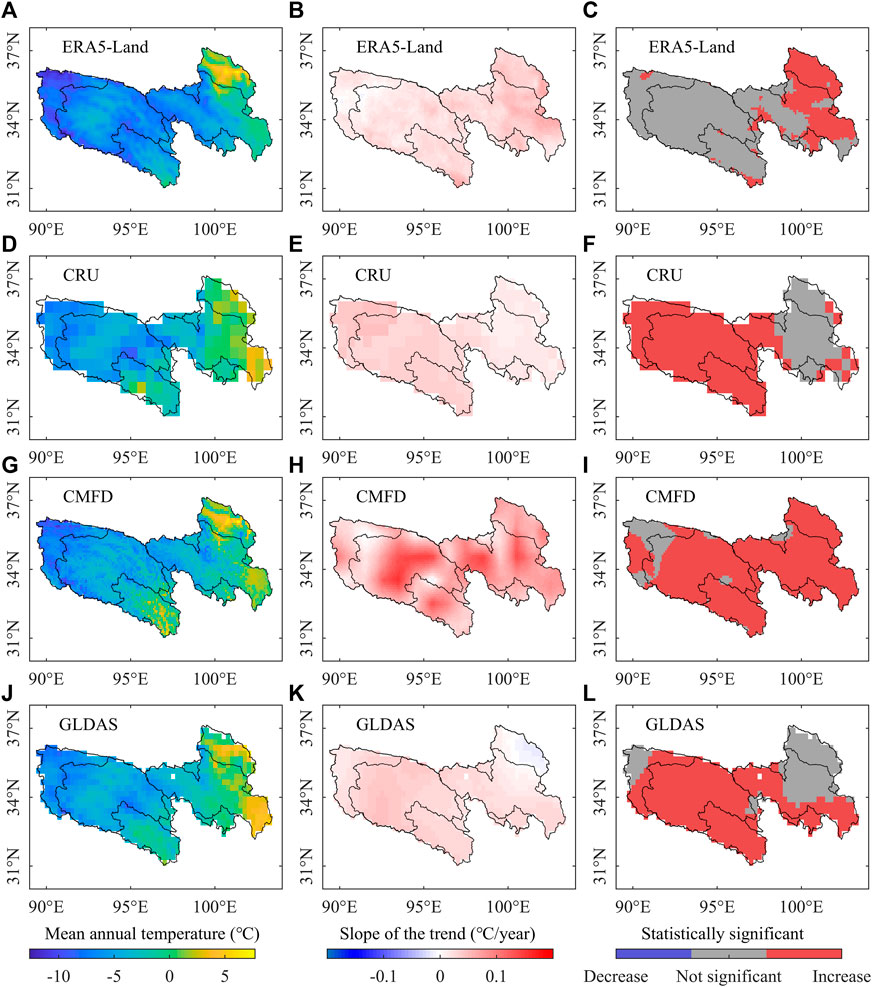
FIGURE 2. Spatial distribution of mean annual air temperature (A,D,G,J), Sen’s slope of the annual air temperature (B,E,H,K) and trends in annual air temperature based on the Mann-Kendall method (C,F,I,L) in the TRHR using ERA5-Land, CRU, CMFD and GLDAS data for the 1982–2014 period.
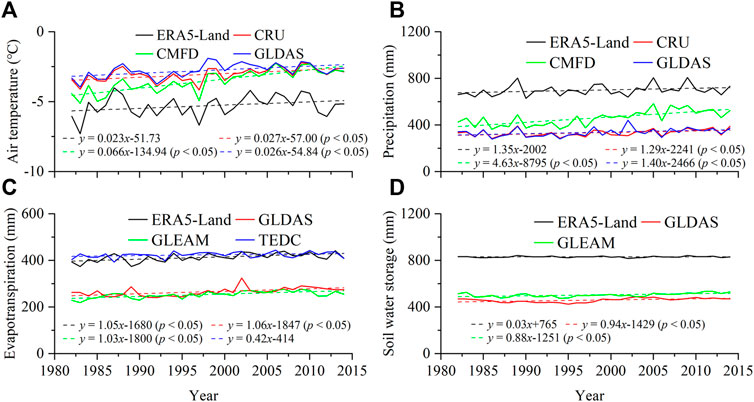
FIGURE 3. Interannual variability in the air temperature (A), precipitation (B), evapotranspiration (C) and soil water storage (D) from different data sources in the TRHR from 1982 to 2014.
3.1.2 Precipitation
Like air temperature, the spatiotemporal variability in precipitation in the TRHR was analysed using the ERA5-Land, CRU, CMFD and GLDAS datasets. From 1982 to 2014, the mean annual precipitation in the TRHR according to ERA5-Land data was significantly higher than that indicated by the other three datasets, followed by the CMFD, while the mean annual precipitation data from the CRU and GLDAS showed little difference. According to the ERA5-Land, CRU, CMFD and GLDAS data, the mean annual precipitation in the TRHR was 698.5, 332.3, 459.4 or 336.4 mm, respectively. Although there were differences in the mean annual precipitation among the four datasets, their spatial patterns were similar. The mean annual precipitation in the TRHR decreased from southeast to northwest and was mainly concentrated in the YERHR and LARHR (Figures 4A,D,G,J). From 1982 to 2014, the Sen’s slopes from the four datasets show the annual precipitation indicated by the CRU and GLDAS data increased in almost all areas, while the ERA5-Land and CMFD data show that it increased in most areas, but decreased in a few areas in the eastern TRHR (Figures 4B,E,H,K). The Mann-Kendall test showed that the areas with a significant increasing trend in annual precipitation from 1982 to 2014 were mainly distributed in the western and northern TRHR. The annual precipitation in the northwestern YARHR increased significantly according to all four datasets. The annual precipitation data from the CRU and CMFD showed a significant increase in some areas of the YERHR. Only CMFD data showed that annual precipitation increased significantly in some areas of the LARHR (Figures 4C,F,I,L). From 1982 to 2014, the linear trends of annual precipitation increases in the TRHR according to the ERA5-Land, CRU, CMFD and GLDAS were 13.5, 12.9, 46.3 and 14.0 mm per decade, respectively (Figure 3B). Only the precipitation change indicated by the ERA5-Land data was not statistically significant.
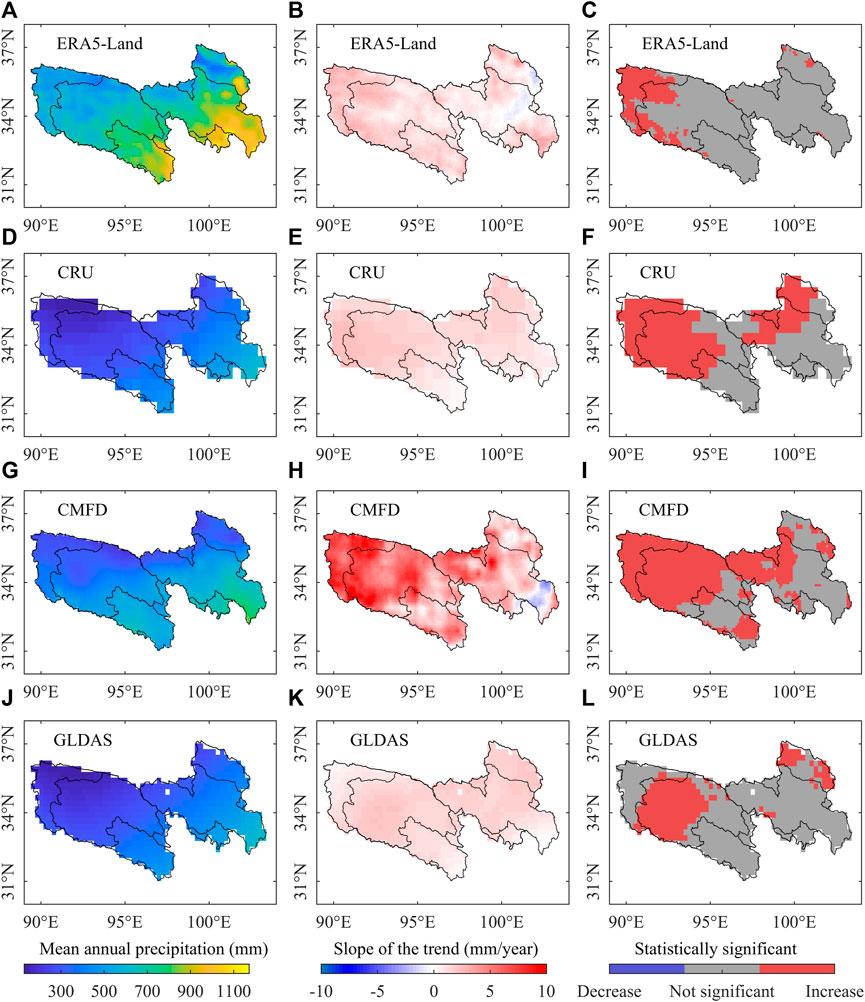
FIGURE 4. Spatial distribution of mean annual precipitation (A,D,G,J), Sen’s slope of the annual precipitation (B,E,H,K) and trends in annual precipitation based on the Mann-Kendall method (C,F,I,L) in the TRHR using ERA5-Land, CRU, CMFD and GLDAS data for the 1982–2014 period.
3.1.3 Evapotranspiration
The ERA5-Land, GLDAS, GLEAM and TEDC datasets were used to analyse the spatial and temporal variability in evapotranspiration in the TRHR. Among these four datasets, the values of mean annual evapotranspiration from 1982 to 2014 from ERA5-Land and TEDC were significantly higher than those from the GLDAS and GLEAM. According to the ERA5-Land, GLDAS, GLEAM and TEDC data, mean annual evapotranspiration in the TRHR was 413.1, 265.4, 253.3 or 423.8 mm, respectively. The spatial distribution characteristics of the mean annual evapotranspiration from the four different datasets were similar, increasing gradually from northwest to the southeast (Figures 5A,D,G,J). From 1982 to 2014, the Sen’s slopes show the annual evapotranspiration from the GLDAS and GLEAM both increased in almost all areas in the TRHR, while according to the ERA5-Land, annual evapotranspiration increased in most areas but decreased in a few areas of the LARHR. According to the TEDC, annual evapotranspiration decreased in the southern, central and northern areas of the TRHR and increased in the other areas (Figures 5B,E,H,K). The Mann-Kendall test showed that annual evapotranspiration according to the ERA5-Land, GLDAS and GLEAM data increased significantly from 1982 to 2014 in many areas of the TRHR. The areas with a significant increasing trend based on ERA5-Land and GLEAM data were mainly distributed in the YARHR and YERHR, while the areas with a significant increasing trend based on GLDAS data were mainly distributed in the YARHR, YERHR and LARHR. The Mann-Kendall test based on the TEDC showed that annual evapotranspiration increased significantly in the northeastern TRHR, but decreased significantly in a few areas in the southern and northern TRHR (Figures 5C,F,I,L). From 1982 to 2014, the linear trends of annual evapotranspiration from the ERA5-Land, GLDAS, GLEAM and TEDC in the TRHR were 10.5, 10.6, 10.3, and 4.2 mm per decade, respectively (Figure 3C). Only the change in evapotranspiration indicated by the TEDC data was not statistically significant.
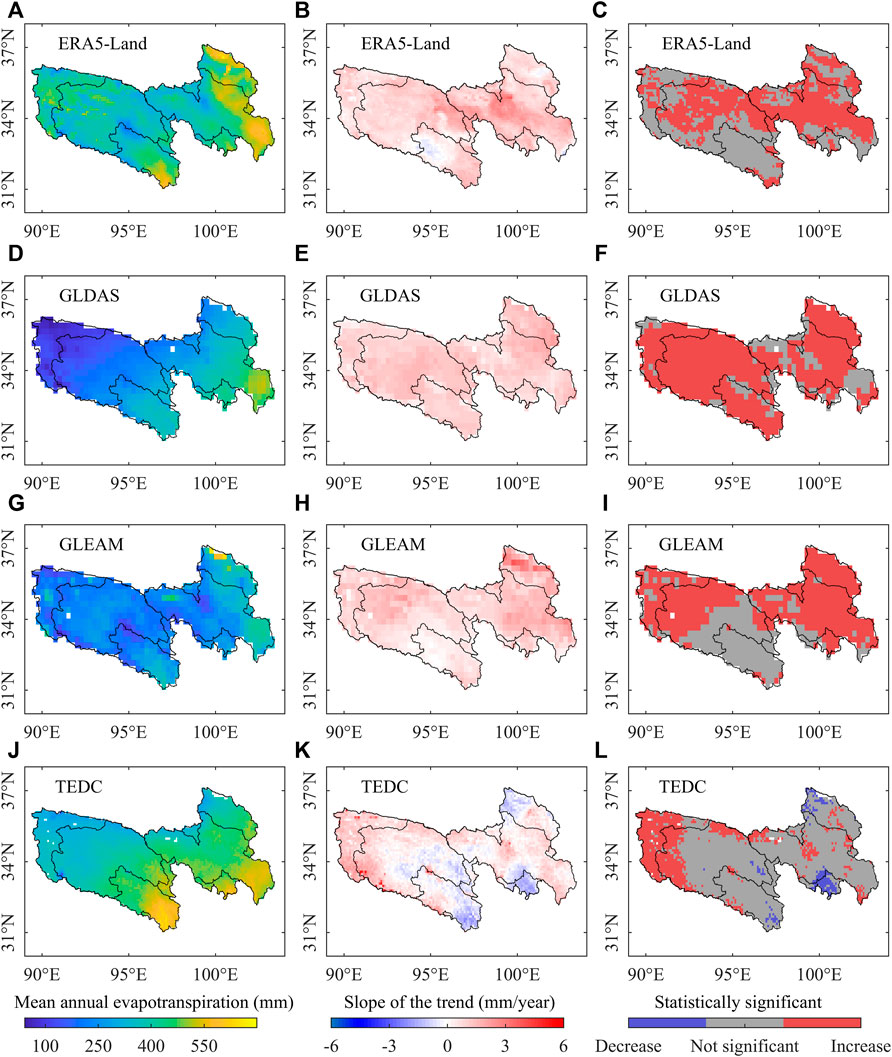
FIGURE 5. Spatial distribution of mean annual evapotranspiration (A,D,G,J), Sen’s slope of the an-nual precipitation (B,E,H,K) and trends in annual precipitation based on the Mann-Kendall method (C,F,I,L) in the TRHR using ERA5-Land, GLDAS, GLEAM and TEDC data for the 1982–2014 period.
3.1.4 Soil water storage
The ERA5-Land, GLDAS and GLEAM datasets were used to analyse the spatial and temporal variability in soil water storage in the TRHR. Among these three datasets, the mean annual soil water storage from 1982 to 2014 from the ERA5-Land data was significantly higher than that indicated by the GLDAS and GLEAM data, at 830.5, 459.0, and 503.5 mm, respectively. The spatial distribution characteristics of the soil water storage indicated by the ERA5-Land data were different from those derived from the GLDAS and GLEAM. The high value areas of soil water storage from the ERA5-Land were mainly located in the middle of the TRHR, while GLDAS and GLEAM data showed the opposite pattern (Figures 6A,D,G). From 1982 to 2014, the Sen’s slopes show that soil water storage from the ERA5-Land increased in the northern and southern TRHR, but decreased in the central and northeastern TRHR. The soil water storage indicated by the GLDAS and GLEAM data increased in most areas in the TRHR, while data from the GLDAS indicated a decrease in the southeastern TRHR and those from the GLEAM indicated a decrease in the southern and southeastern TRHR (Figures 6B,E,H). The Mann-Kendall test showed that the soil water storage from the GLDAS and GLEAM increased significantly from 1982 to 2014 in many areas of the TRHR, mainly in the north. The area with a significant increasing trend of soil water storage according to ERA5-Land data was smaller than those based on the GLDAS and GLEAM data, and the ERA5-Land data indicated that soil water storage decreased significantly in some parts of the TRHR, mainly in the central and northeastern areas (Figures 6C,F,I). From 1982 to 2014, the linear trends of soil water storage in the TRHR according to the ERA5-Land, GLDAS and GLEAM data were 0.3, 9.4 and 8.8 mm per decade, respectively (Figure 3D). Only the change in soil water storage indicated by ERA5-Land data was not statistically significant.
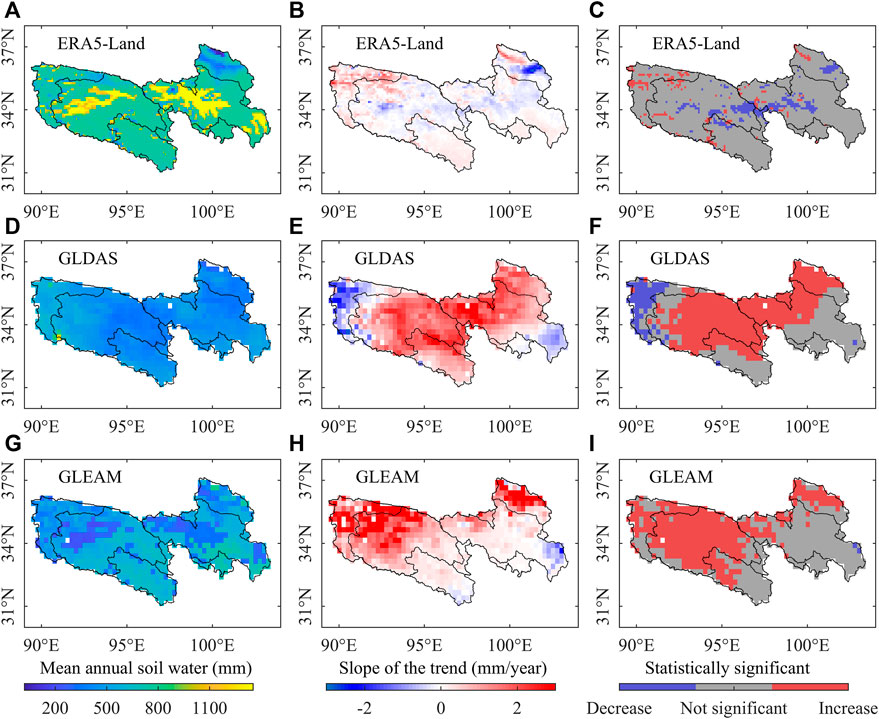
FIGURE 6. Spatial distribution of mean annual soil water storage (A,D,G), Sen’s slope of the annual soil water storage (B,E,H) and trends in annual soil water storage based on the Mann-Kendall method (C,F,I) in the TRHR using ERA5-Land, GLDAS and GLEAM data for the 1982–2014 period.
3.2 Spatial and temporal variability in glacier melt and snowmelt
3.2.1 Glacier area and glacier melt
Glaciers in the TRHR receded from the 1970s to 2019 (Figure 7A). Compared with the 1970s, the glacier areas in the YARHR, YERHR and LARHR in 2019 had decreased by 39.4%, 27.4% and 61.4%, respectively. The fastest area loss was in the LARHR and the slowest was in the YERHR. The total glacier area of the three sub-basins decreased by 868.1 km2, accounting for about 41.6% of the area in the 1970s. From 1982 to 2014, the mean annual glacier melts in the YARHR, YERHR and LARHR were 4.7, 0.7 and 1.8 × 10⁸ m3, respectively. The linear trends of annual glacier melt in the YARHR, YERHR and LARHR were 0.84 × 10⁸ m3, 0.07 × 10⁸ m3 and −0.02 × 10⁸ m3 per decade. The change trend of glacier melt in the YARHR was statistically significant (Figure 7B).
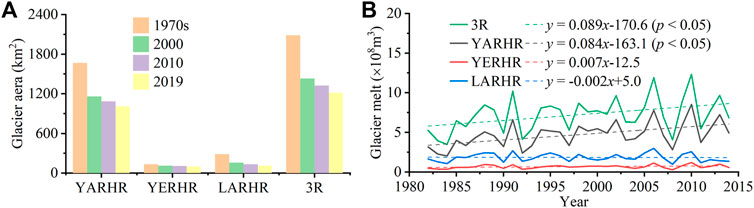
FIGURE 7. Glacier areas in different periods (A) and interannual variability in the glacier melt in the TRHR from 1982 to 2014 (B) (YARHR, YERHR and LARHR are the Yangtze River Headwater Region, Yellow River Headwater Region and Lantsang River Headwater Region, respectively. 3R stands for the synthesis of YARHR, YERHR and LARHR).
3.2.2 Snowfall and snowmelt
The ERA5-Land and GLDAS data were used to analyse the spatial and temporal variability in snowfall in the TRHR. The mean annual snowfall from 1982 to 2014 indicated by ERA5-Land data, with a value of 281.7 mm, was significantly higher than that indicated by the GLDAS, with a value of 53.5 mm. Although the mean annual snowfall in the TRHR indicated by the two datasets is different, their spatial distributions show similar patterns (Figures 8A,D). The areas with high mean annual snowfall are generally located in the high-elevation areas, glacial areas, and the watersheds of the three sub-basins. From 1982 to 2014, the Sen’s slopes show the snowfall indicated by the ERA5-Land data increased in the northwestern TRHR and decreased in the other areas of the region. The snowfall indicated by the GLDAS data increased in the eastern TRHR and the central YARHR, and decreased in the remaining areas (Figures 8B,E). The Mann-Kendall test showed that the snowfall indicated by the ERA5-Land data decreased significantly in the eastern and central TRHR, and that indicated by the GLDAS data decreased significantly in the southern TRHR and in a few areas in the upstream region of the YERHR. No areas had a significant increasing trend in snowfall for either dataset (Figures 8C,F). From 1982 to 2014, the linear trends of the snowfall from the ERA5-Land and GLDAS data in the TRHR were −10.7 and −1.8 mm per decade, respectively, with a statistically significant decreasing trend in the former (Figure 9A).
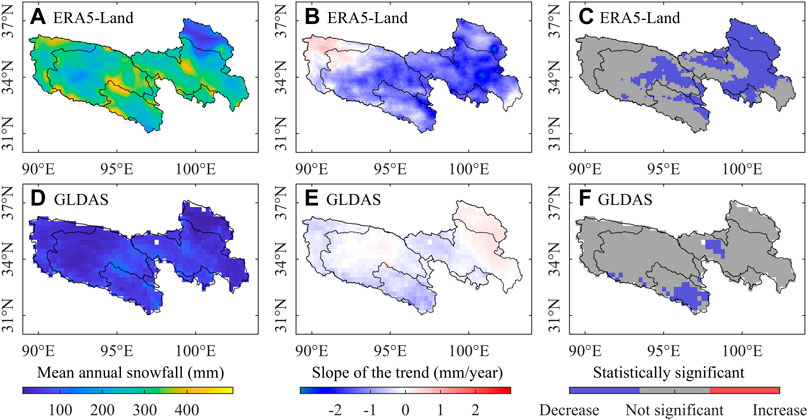
FIGURE 8. Spatial distribution of mean annual snowfall (A,D), Sen’s slope of the annual snowfall (B,E) and trends in annual snowfall based on the Mann-Kendall method (C,F) in the TRHR using ERA5-Land and GLDAS data for the 1982–2014 period.
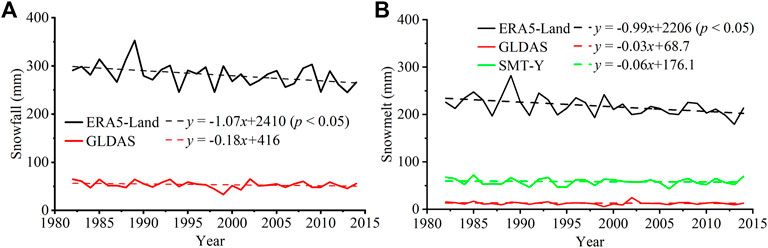
FIGURE 9. Interannual variability in the snowfall (A) and snowmelt (B) from ERA5-Land, GLDAS and SMT-Y data sources in the TRHR from 1982 to 2014.
The ERA5-Land, GLDAS and SMT-Y data were used to analyse the spatial and temporal variability in snowmelt in the TRHR. From 1982 to 2014, the mean annual snowmelt in the TRHR was 218.2, 12.6 and 58.2 mm, according to the ERA5-Land, GLDAS and SMT-Y, respectively. The spatial distribution of snowmelt from the three data showed similar patterns, similar to the spatial pattern of snowfall. The areas with high snowmelt are generally located in the high-elevation areas, glacial areas and the watersheds of the three sub-basins (Figures 10A,D,G). From 1982 to 2014, the Sen’s slopes showed the snowmelt indicated by the ERA5-Land data increased in the northwestern TRHR and a few areas in the southeastern TRHR, and decreased in the remaining areas. The snowmelt indicated by the GLDAS data increased in the eastern TRHR and the central YARHR, while according to the SMT-Y data snowmelt increased in the northeastern, southern and southeastern TRHR and in the central YARHR (Figures 10B,E,H). The Mann-Kendall test showed that the areas with a significant decreasing trend of snowmelt from 1982 to 2014 based on the ERA5-Land data were mainly distributed in the northeastern TRHR and the central YARHR, and no areas with a significant increasing trend in snowmelt were identified. The snowmelt change trends according to the GLDAS data were not statistically significant in most areas of the TRHR. The snowmelt indicated by the SMT-Y decreased significantly in the northwestern TRHR, and increased significantly in some areas in the southern and southeastern TRHR (Figures 10C,F,I). From 1982 to 2014, the linear trends of the annual snowmelt in the TRHR according to the ERA5-Land, GLDAS and SMT-Y data were −9.9, −0.3 and −0.6 mm per decade, respectively (Figure 9B). Only the decreasing trend indicated by the ERA5-Land was statistically significant.
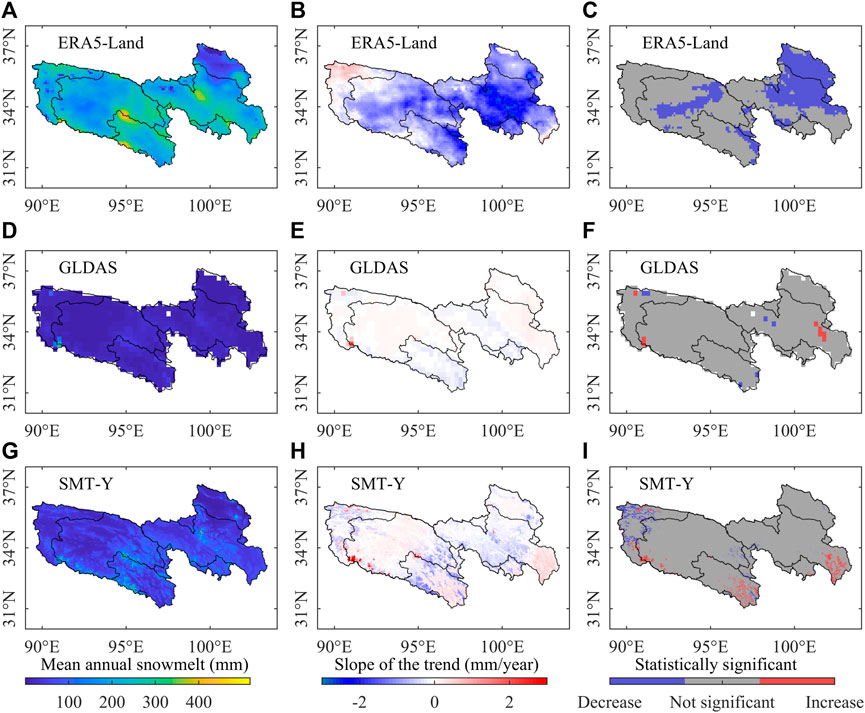
FIGURE 10. Spatial distribution of mean annual snowmelt (A,D,G), Sen’s slope of the annual snowmelt (B,E,H) and trends in annual snowmelt based on the Mann-Kendall method (C,F,I) in the TRHR using ERA5-Land, GLDAS and SMT-Y data for the 1982–2014 period.
3.3 Variation in hydrological variables in three sub-basins
The observation data from the Zhimenda, Tangnaihai and Changdu hydrological stations from 1982 to 2014 show that the mean annual runoff in the YARHR, YERHR and LARHR was 1.37 × 10¹⁰ m3, 1.97 × 10¹⁰ m3 and 1.50 × 10¹⁰ m3, respectively. The annual runoff in the YARHR and LARHR showed an increasing trend, while the annual runoff in YERHR showed a decreasing trend. From 1982 to 2014, the linear trends of the annual runoff in the YARHR, YERHR and LARHR were 0.14 × 10¹⁰ m3, −0.10 × 10¹⁰ m3 and 0.11 × 10¹⁰ m3 per decade, respectively. Only the runoff change trend in the YARHR was statistically significant (Figure 11).
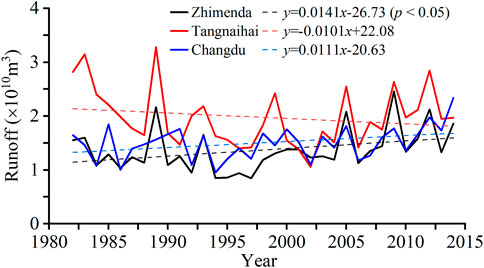
FIGURE 11. Interannual variability in the observed annual runoff at three hydrological stations in the TRHR from 1982 to 2014.
To analyse the changes of hydrological variables in the three sub-basins, the data collection period (1982–2014) was divided into two 16-year periods (1982–1997 and 1999–2014). Compared with the 1982–1997 period, the mean annual values of precipitation during the 1999–2014 period in the YARHR, YERHR and LARHR increased by 14.6%, 6.8% and 7.7%, respectively, the mean annual values of evapotranspiration increased by 6.0%, 5.7% and 3.2%, respectively, and the mean annual values of soil water storage increased by 3.1%, 2.0% and 2.7%, respectively (Figure 12). The mean annual values for snowmelt in all three sub-basins during the 1999–2014 period were smaller than those during the 1999–2014 period, and the change ratios in the YARHR, YERHR and LARHR were −1.8%, −4.9% and −4.3%, respectively. Compared with the 1982–1997 period, the mean annual values of glacier melt during the 1999–2014 period in the YARHR and YERHR increased by 36.8% and 16.1%, respectively, while that in the LARHR decreased by 2.4%. Compared with the 1982–1997 period, the mean annual values of runoff during the 1999–2014 period in the YARHR and LARHR increased by 25.1% and 14.2%, respectively, and that in the YERHR decreased by 5.8%.
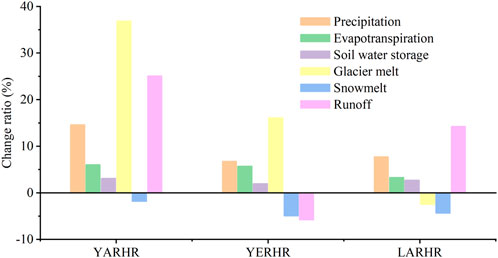
FIGURE 12. Change ratios of the mean annual values of hydrological variables during the 1999–2014 period compared with those during the 1982–1997 period in the three sub-basins in the TRHR.
4 Discussion
4.1 Comparisons between previous studies and this study
Table 2 shows the comparisons of changes in hydrological variables in the TRHR from published studies and this study. Overall, the trends of hydrological variables in this study are largely consistent with the previous studies. For example, the previous studies and this study all show an increasing trend in precipitation in the TRHR. Only few studies show different trends in hydrological variables, most notably because of the different study periods. For example, the changes of runoff observation from hydrological stations show opposite trends in different statistical periods. In addition, different data sources may result in different trends being presented. Take the trend of evapotranspiration in the TRHR as example, using evapotranspiration data delivered by using surface energy balance system algorithm and MODIS satellite data, Xu et al. (2018) reported that the evapotranspiration showed a decreasing trend from 2003 to 2014, while using the calculation results by the annual evapotranspiration model, Li et al. (2012) reported that the evapotranspiration showed an increasing trend from 1980 to 2000. Due to the differences in trend changes that may be caused by different data sources, this study selected multi-Source data to reduce their uncertainties. In addition, this study analyzed the trends of glacier melt, snowmelt and the four fundamental variables of the watershed hydrological cycle in the TRHR, which have not been studied simultaneously in the previous studies.
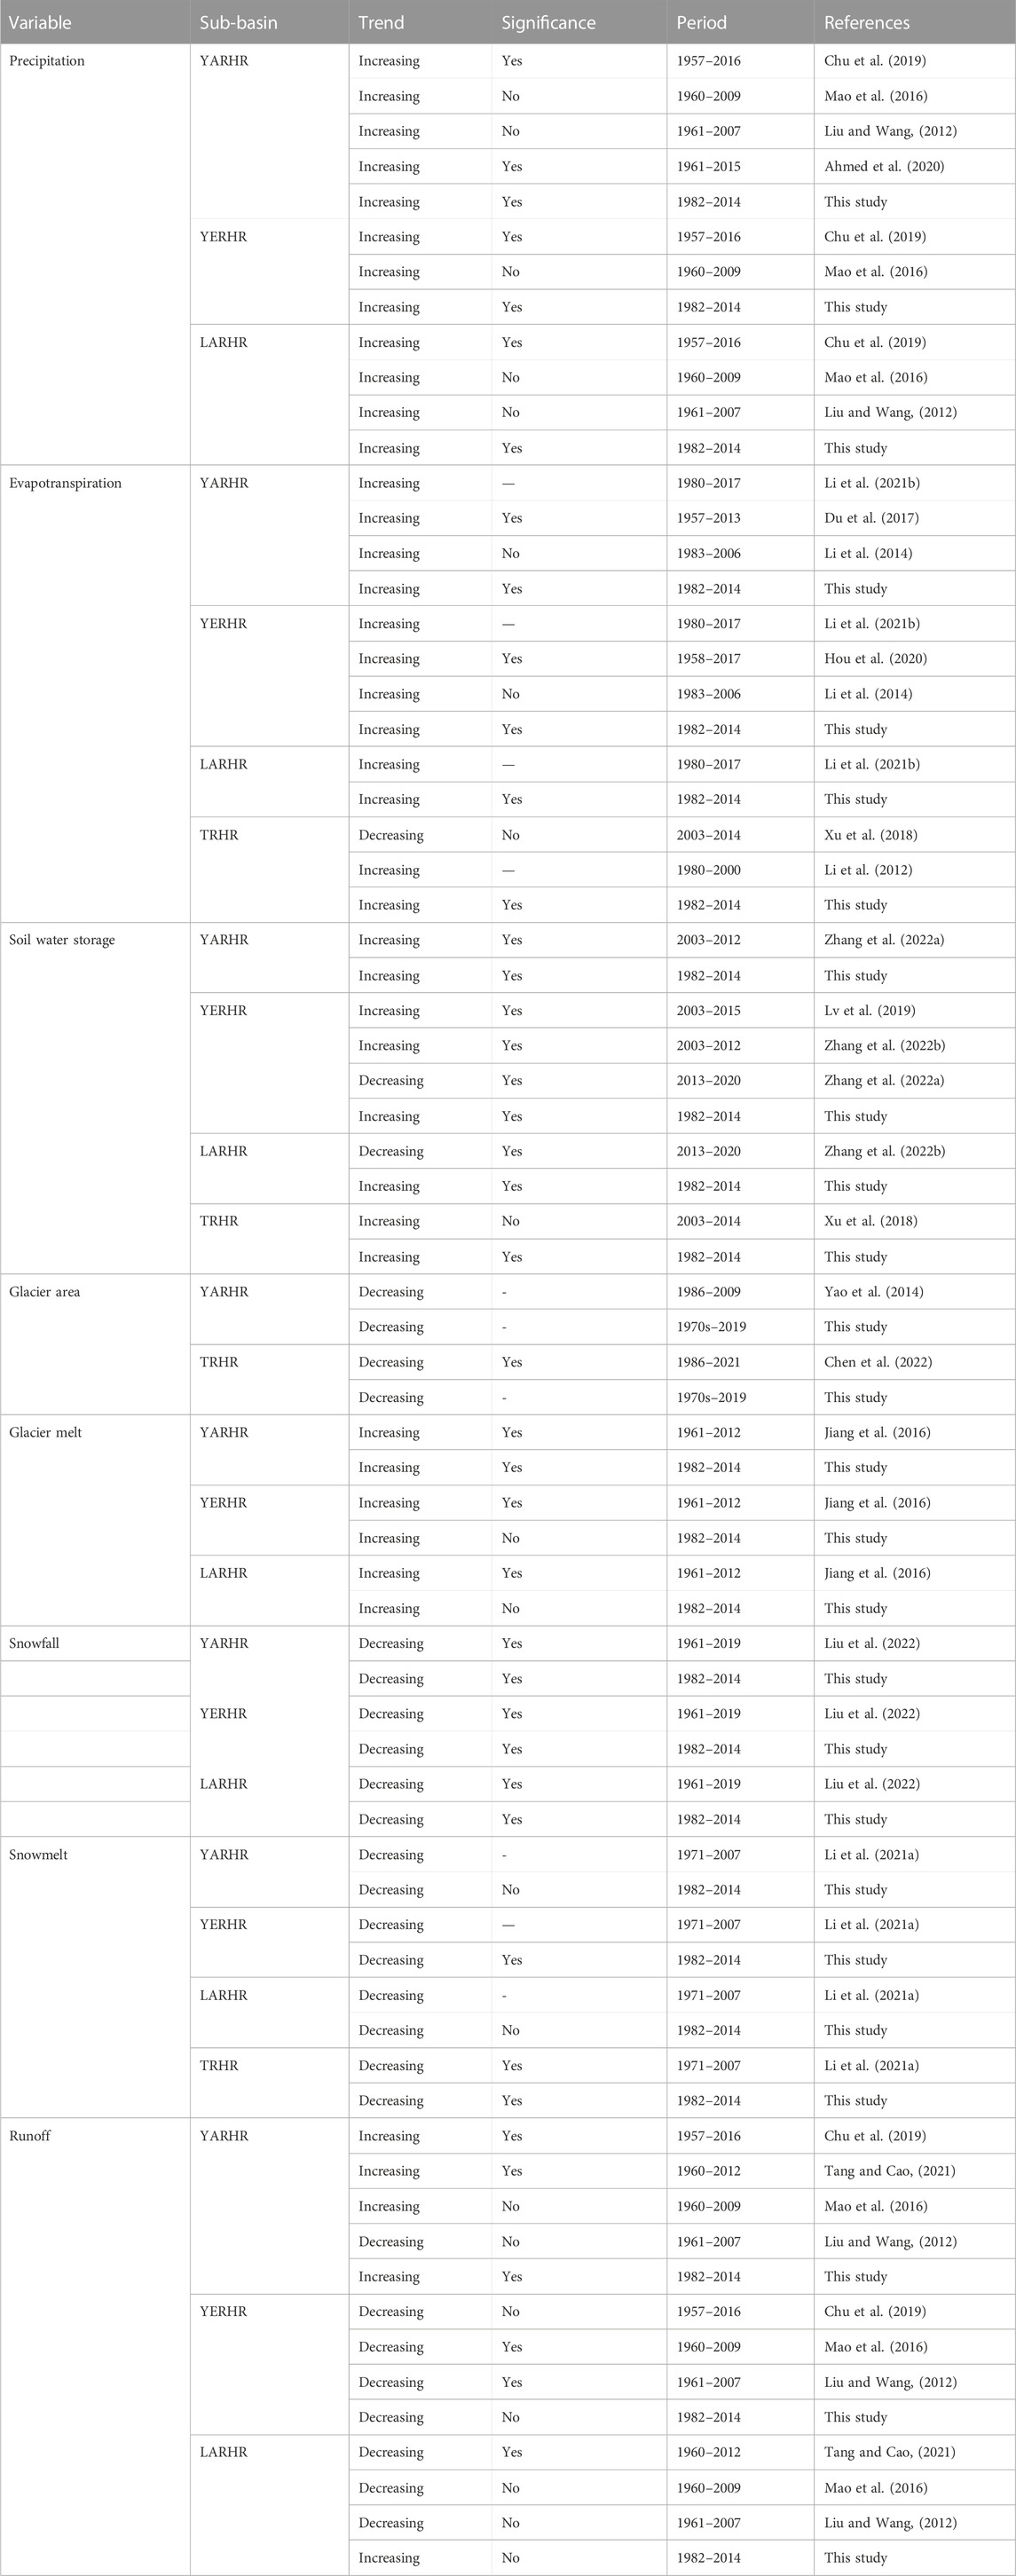
TABLE 2. Comparisons of changes in hydrological variables in the TRHR from published studies and this study.
4.2 Acceleration of the hydrological cycle in the TRHR
In this study, the different data sources all indicate that the TRHR became warmer from 1982 to 2014. Under this background of warming, as the input term of hydrological cycle, the precipitation in the TRHR increased significantly (Figures 2B, 4), as reported by previous studies. Xi et al. (2018) reported there was a significant upward trend in precipitation of more than 13.3 mm per decade in many parts of the TRHR during the 1961–2015 period. The increased precipitation is possibly related to enhanced water vapor transport from the South China Sea and tropical oceans caused by the anomalous cyclone in the Maritime Continent and anomalous anticyclone in the western North Pacific (Shang et al., 2021). Deng et al. (2019) found that a significant positive correlation between soil moisture and precipitation in most areas of the TRHR. The data examined in this study also show an increasing trend of soil water storage with increasing precipitation in the TRHR (Figures 3D, 6). More soil water means more water is available for evapotranspiration, and the increase in temperature has led to an increase in potential evapotranspiration in the TRHR (Wang et al., 2020). More soil water and higher potential evapotranspiration has led to greater actual evapotranspiration in the TRHR. All of the evapotranspiration data collected in this study validate the increasing trend of evapotranspiration in the region (Figures 3C, 5). The increases in precipitation, soil water and actual evapotranspiration indicate an acceleration of hydrological cycle in the TRHR.
In a warming climate, the glaciers in the TRHR are retreating and the glacier areas in the YARHR, YERHR and LARHR are all shrinking (Figure 7A). Although the glacier melt in the LARHR decreased slightly (not significantly), the overall glacier melt in the TRHR increased significantly (Figure 7B), suggesting that more solid water was transformed into liquid water and accelerated into the hydrological cycle. Although precipitation increased, snowfall in the TRHR showed a decreasing trend (Figures 8, 9A), because the snowfall/precipitation ratio became smaller due to the warming climate (Berghuijs et al., 2014). Snowfall is solid water that can temporarily accumulate on the land surface. Rainfall infiltrates the soil and generates runoff more quickly than snowfall, and a reduction in snowfall means more rainfall and a faster hydrological cycle. In addition, climate warming results in an earlier onset of snowmelt (Barnhart et al., 2020), further accelerating the hydrological cycle. Overall, changes in cryospheric elements such as glaciers and snow in the TRHR under climate warming have further accelerated the hydrological cycle in this region.
4.3 Differences in hydrological cycle in the three sub-basins
The annual runoff in the three sub-basins of the TRHR showed different trends from 1982 to 2014 (Figure 11). The annual runoff in the YARHR and LARHR showed an increasing trend while the runoff in the YERHR was slightly reduced. According to the basin-scale water balance, runoff is equal to precipitation minus evapotranspiration and minus the change in soil water storage (Masuda et al., 2001). Although the precipitation, evapotranspiration and soil water storage in the three sub-basins all showed an increasing trend, there were differences in the ratio of increase, resulting in runoff showing different changes. In the YARHR and LARHR, the increasing ratio of precipitation was greater than the sum of the increasing ratio of evapotranspiration and the increasing ratio of soil water storage, which leads to an increase of runoff in these two sub-basins. The increasing ratio of precipitation in the YARHR was significantly greater than that in the LARHR (Figure 12), and only the runoff change trend in the YARHR was statistically significant. Although precipitation also showed an increasing trend in the YERHR, the increasing ratio was less than the sum of the increasing ratio of evapotranspiration and the increasing ratio of soil water storage, which may be the reason for the decrease in runoff in the YERHR.
The annual glacier melts in the YARHR and YERHR showed an increasing trend while that in the LARHR showed a decreasing trend (Figures 7B, 12). In a warming climate, glacier melt is expected to increase in an unstable trend that may reverse when glaciers continuously retreat (Zhang et al., 2013). Glacier melt will begin to decline when increasing melting rates due to rising temperatures fail to compensate for the negative impact of decreasing glacier area on glacial melt. Zhao et al. (2019) concluded that the glacier melt in the YARHR will increase for at least the 2020s (2021–2030), while the that in the LARHR had exceeded its tipping point at the beginning of the 21st century. Glacier melts account for 4.7%, 0.7%, and 1.8% of the runoff during the 1982–2014 period in the YARHR, YERHR and LARHR, respectively. The significant increase in glacier melt in the YARHR may have contributed to the increase in runoff. All three sub-basins showed a decreasing trend in snowmelt. The ratio of snowmelt reduction was the largest for the YERHR, followed by the LARHR and YARHR. Because snowmelt is more effective at generating runoff than rainfall (Li et al., 2017; Jenicek and Ledvinka, 2020), the relatively large reduction in snowmelt in the YERHR may also be responsible for the decline in runoff.
4.4 Uncertainties and limitations
Due to the high elevations and complex topography of the TRHR, the accuracy of collected gridded hydrometeorological data may be uncertain, which may bring uncertainty to this study. Indeed, the values of hydrometeorological variables in the TRHR from different data sources are different. For example, ERA5-Land reports higher precipitation and lower temperature than the other datasets (Figure 3). Li et al. (2022) used the observation data of 28 meteorological stations to evaluate the CMFD and ERA5-Land data in the Qilian Mountains, Qinghai-Tibetan Plateau, and found that both datasets underestimated the temperature, and the amount of precipitation was overestimated by ERA5-Land. Qi et al. (2018) used gauge-based data and a hydrological model to evaluate the GLDAS data for the Qinghai-Tibetan Plateau, and found that the precipitation from GLDAS had high uncertainty. Huang et al. (2021) concluded that the accuracy of the ERA5-Land and GLDAS decreases with increasing elevation, and suggested that caution was needed when using those data for mountainous regions with complex terrain. Nevertheless, although the values of the hydrometeorological variables may be uncertain in the high-elevation areas, some studies suggest that they still reflect the spatial pattern and reproduce the seasonal variation (Chen et al., 2021; Li et al., 2022). This study mainly focuses on the spatial pattern and temporal variation trends of hydrological variables in the TRHR, and the comprehensive analysis from multiple different data sources reduces the uncertainty.
Permafrost is widespread in the TRHR, and in the eastern part permafrost is sporadic and the seasonally frozen ground is found at low elevations (Hu et al., 2022). The changes in permafrost and seasonal frozen soil under the background of climate warming have affected the hydrological process and runoff changes in the region (Zheng et al., 2018; Song et al., 2021). Unfortunately, due to the complexity of frozen soil changes, there is still a lack of accurate and continuous data about frozen soil changes in the TRHR, and the changes in the permafrost and seasonal frozen soil and their impact on the hydrological cycle are not considered in this study. In addition, the variability of other hydrological elements such as lakes and groundwater are not considered in this study, although they have also changed under climate warming in the TRHR (Xu et al., 2018; Fan, 2021).
5 Conclusion
This study focuses on the spatial and temporal variability of hydrological variables in the TRHR from 1982 to 2014 based on multi-source datasets, and analyses the changes in the hydrological cycle under climate warming. The air temperature data from the ERA5-Land, CRU, CMFD and GLDAS data show an increasing trend in the annual temperature of the TRHR from 1982 to 2014, with only the increasing trend in the ERA5-Land data being statistically insignificant. The annual precipitation in the TRHR indicated by the ERA5-Land, CRU, CMFD and GLDAS data increased from 1982 to 2014, and only the increasing trend indicated by the ERA5-Land data was statistically insignificant. The annual evapotranspiration in the TRHR indicated by the ERA5-Land, GLDAS, GLEAM and TEDC data increased from 1982 to 2014, and only the increasing trend in the TEDC data was statistically insignificant. The annual soil water storage indicated by the ERA5-Land, GLDAS and GLEAM data increased from 1982 to 2014, and only the increasing trend in the ERA5-Land data was statistically insignificant. From 1982 to 2014, the annual glacier melt increased in the YARHR and YERHR and decreased in the LARHR. The annual snowmelt indicated by the ERA5-Land, GLDAS and SMT-Y data decreased from 1982 to 2014, but only the decreasing trend in the ERA5-Land data was statistically significant.
Overall, precipitation, evapotranspiration, soil water content and glacial melt increased, while snowfall and snow melt water decreased, indicating that the hydrological cycle in the TRHR has accelerated. Although the precipitation showed an increasing trend in all three sub-basins, the precipitation in the YARHR increased the most, which was the main reason for the significant increase in the runoff in the YARHR. The sum of the increases in evapotranspiration and soil water storage in the YERHR was greater than the increase in precipitation, resulting in a decrease in runoff in the YERHR. The increase in precipitation in the LARHR, which was between that in the YARHR and in the YERHR, was slightly larger than the sum of the increase in evapotranspiration and soil water storage, and the runoff in the LARHR showed an insignificant increasing trend. As the climate continues to warm, the hydrological cycle in the TRHR may be further accelerate, posing a challenge to the utilization of water resources in the TRHR and its downstream. Future work should focus on the future changes in the water cycle of the TRHR, which will be more helpful for planning water resources management under climate change.
Data availability statement
The original contributions presented in the study are included in the article/Supplementary Material, further inquiries can be directed to the corresponding author.
Author contributions
Conceptualization, YY, RC, and YD; methodology, YY and RC; validation, YY, RC, YD, QZ, HL, and ZL; formal analysis, YY, RC, and YD; data curation, QZ, HL, and ZL; writing-original draft preparation, YY and RC. All authors have read and agreed to the published version of the manuscript.
Funding
This work was carried out with financial support from the Joint Grant from Chinese Academy of Sciences-People’s Government of Qinghai Province on Sanjiangyuan National Park (LHZX-2020-11), the National Key Research and Development Project (2019YFC1510505), the Sciences and Technology Plan Project of Gansu Province (21JR7RA056), and the Open Research Fund of the National Cryosphere Desert Data Center (2021kf09).
Acknowledgments
The authors thank the institutions and individuals mentioned in this article for providing data.
Conflict of interest
The authors declare that the research was conducted in the absence of any commercial or financial relationships that could be construed as a potential conflict of interest.
Publisher’s note
All claims expressed in this article are solely those of the authors and do not necessarily represent those of their affiliated organizations, or those of the publisher, the editors and the reviewers. Any product that may be evaluated in this article, or claim that may be made by its manufacturer, is not guaranteed or endorsed by the publisher.
References
Ahmed, N., Wang, G., Booij, M. J., Oluwafemi, A., Hashmi, M. Z.-u.-R., Ali, S., et al. (2020). Climatic variability and periodicity for upstream sub-basins of the Yangtze River, China. Water 12, 842. doi:10.3390/w12030842
Barnhart, T. B., Tague, C. L., and Molotch, N. P. (2020). The counteracting effects of snowmelt rate and timing on runoff. Water Resour. Res. 56, e2019WR026634. doi:10.1029/2019wr026634
Berghuijs, W. R., Woods, R. A., and Hrachowitz, M. (2014). A precipitation shift from snow towards rain leads to a decrease in streamflow. Nat. Clim. Change 4, 583–586. doi:10.1038/nclimate2246
Chen, L., Zhang, W., Yi, Y., Zhang, Z., and Chao, S. (2022). Long time-series glacier outlines in the three-rivers headwater region from 1986 to 2021 based on deep learning. IEEE J. Sel. Top. Appl. Earth Obs. Remote Sens. 15, 5734–5752. doi:10.1109/jstars.2022.3189277
Chen, Y., Sharma, S., Zhou, X., Yang, K., Li, X., Niu, X., et al. (2021). Spatial performance of multiple reanalysis precipitation datasets on the southern slope of central Himalaya. Atmos. Res. 250, 105365. doi:10.1016/j.atmosres.2020.105365
Chu, H., Wei, J., Qiu, J., Li, Q., and Wang, G. (2019). Identification of the impact of climate change and human activities on rainfall-runoff relationship variation in the Three-River Headwaters region. Ecol. Indic. 106, 105516. doi:10.1016/j.ecolind.2019.105516
Deng, M., Meng, X., Li, Z., Lyv, Y., Lei, H., Zhao, L., et al. (2019). Responses of soil moisture to regional climate change over the three rivers source region on the Tibetan plateau. Int. J. Climatol. 40, 2403–2417. doi:10.1002/joc.6341
Ding, Z., Wang, Y., and Lu, R. (2018). An analysis of changes in temperature extremes in the Three River Headwaters region of the Tibetan Plateau during 1961–2016. Atmos. Res. 209, 103–114. doi:10.1016/j.atmosres.2018.04.003
Du, Y., Berndtsson, R., An, D., Zhang, L., Hao, Z., and Yuan, F. (2017). Hydrologic response of climate change in the source region of the Yangtze River, based on water balance analysis. Water 9, 115. doi:10.3390/w9020115
Fan, H. (2021). Lake dynamic monitoring and regional climate response analysis in the source region of three rivers based on time. Master’s thesis (Beijing: Series China University of Geosciences).
Gusain, A., Ghosh, S., and Karmakar, S. (2020). Added value of CMIP6 over CMIP5 models in simulating Indian summer monsoon rainfall. Atmos. Res. 232, 104680. doi:10.1016/j.atmosres.2019.104680
Harris, I., Osborn, T. J., Jones, P., and Lister, D. (2020). Version 4 of the CRU TS monthly high-resolution gridded multivariate climate dataset. Sci. Data 7, 109. doi:10.1038/s41597-020-0453-3
He, J., Yang, K., Tang, W., Lu, H., Qin, J., Chen, Y., et al. (2020). The first high-resolution meteorological forcing dataset for land process studies over China. Sci. Data 7, 25. doi:10.1038/s41597-020-0369-y
Held, I. M., and Soden, B. J. (2006). Robust responses of the hydrological cycle to global warming. J. Clim. 19, 5686–5699. doi:10.1175/jcli3990.1
Hou, B., Jiang, C., and Sun, O. J. (2020). Differential changes in precipitation and runoff discharge during 1958–2017 in the headwater region of Yellow River of China. J. Geogr. Sci. 30, 1401–1418. doi:10.1007/s11442-020-1789-5
Hu, J., Nan, Z., and Ji, H. (2022). Spatiotemporal characteristics of NPP changes in frozen ground areas of the Three-River Headwaters region, China: A regional modeling perspective. Front. Earth Sci. 10, 838558. doi:10.3389/feart.2022.838558
Huang, X., Han, S., and Shi, C. (2021). Multiscale assessments of three reanalysis temperature data systems over China. Agriculture 11, 1292. doi:10.3390/agriculture11121292
Jenicek, M., and Ledvinka, O. (2020). Importance of snowmelt contribution to seasonal runoff and summer low flows in Czechia. Hydrol. Earth Syst. Sci. 24, 3475–3491. doi:10.5194/hess-24-3475-2020
Jiang, C., Li, D., Gao, Y., Liu, W., and Zhang, L. (2017). Impact of climate variability and anthropogenic activity on streamflow in the three rivers headwater region, Tibetan plateau, China. Theor. Appl. Climatol. 129, 667–681. doi:10.1007/s00704-016-1833-7
Jiang, C., Li, D., Gao, Y., Liu, X., Liu, W., and Zhang, L. (2016). Spatiotemporal variability of streamflow and attribution in the Three-Rivers Headwater Region, northwest China. J. Water Clim. Change 7, 637–649. doi:10.2166/wcc.2016.047
Jin, Z., You, Q., Wu, F., Sun, B., and Cai, Z. (2021). Changes of climate and climate extremes in the Three-Rivers Headwaters’ Region over the Tibetan Plateau during the past 60 years. Trans. Atmos. Sci. 43, 1042–1055. (in Chinese). doi:10.13878/j.cnki.dqkxxb.20201008001
Li, D., Wrzesien, M. L., Durand, M., Adam, J., and Lettenmaier, D. P. (2017). How much runoff originates as snow in the Western United States, and how will that change in the future? Geophys. Res. Lett. 44, 6163–6172. doi:10.1002/2017gl073551
Li, H., Liu, G., and Fu, B. (2012). Estimation of regional evapotranspiration in alpine area and its response to land use change: A case study in Three-River Headwaters region of qinghai-tibet plateau, China. Chin. Geogr. Sci. 22, 437–449. doi:10.1007/s11769-012-0550-0
Li, S., Liu, M., Adam, J. C., Pi, H., Su, F., Li, D., et al. (2021a). Contribution of snow-melt water to the streamflow over the Three-River Headwater region, China. Remote Sens. 13, 1585. doi:10.3390/rs13081585
Li, X., Cheng, G., Jin, H., Kang, E., Che, T., Jin, R., et al. (2008). Cryospheric change in China. Glob. Planet. Change 62, 210–218. doi:10.1016/j.gloplacha.2008.02.001
Li, X., Wang, L., Chen, D., Yang, K., and Wang, A. (2014). Seasonal evapotranspiration changes (1983-2006) of four large basins on the Tibetan Plateau. J. Geophys. Res. Atmos. 119 (13), 13,079–13,095. doi:10.1002/2014jd022380
Li, Y., Qin, X., Liu, Y., Jin, Z., Liu, J., Wang, L., et al. (2022). Evaluation of long-term and high-resolution gridded precipitation and temperature products in the qilian Mountains, qinghai-tibet plateau. Front. Environ. Sci. 10, 906821. doi:10.3389/fenvs.2022.906821
Li, Z., Li, Z., Feng, Q., Wang, X., Mu, Y., Xin, H., et al. (2021b). Hydrological effects of multiphase water transformation in Three-River Headwaters Region, China. J. Hydrology 601, 126662. doi:10.1016/j.jhydrol.2021.126662
Liu, G., and Wang, G. (2012). Insight into runoff decline due to climate change in China's Water Tower. Water Sci. Technol. Water Supply 12, 352–361. doi:10.2166/ws.2012.003
Liu, J., Xu, X., and Shao, Q. (2008). Grassland degradation in the “Three-River Headwaters” region, Qinghai Province. J. Geogr. Sci. 18, 259–273. doi:10.1007/s11442-008-0259-2
Liu, Y., Li, H., Shen, H., Liu, L., Ren, D., and Li, J. (2022). The variation characteristics of snowfall and its infulence on runoff in three-rivers-source region. Plateau Meteorol. 41, 420–429. (in Chinese). doi:10.7522/j.issn.1000-0534.2021.00096
Lv, M., Ma, Z., Li, M., and Zheng, Z. (2019). Quantitative analysis of terrestrial water storage changes under the grain for green program in the Yellow River basin. J. Geophys. Res. Atmos. 124, 1136–1351. doi:10.1029/2018jd029113
Ma, N., Szilagyi, J., Zhang, Y., and Liu, W. (2019). Complementary-relationship-based modeling of terrestrial evapotranspiration across China during 1982–2012: Validations and spatiotemporal analyses. J. Geophys. Res. Atmos. 124, 4326–4351. doi:10.1029/2018jd029850
Mann, H. B. (1945). Nonparametric tests against trend. Econometrica 13, 245–259. doi:10.2307/1907187
Mao, T., Wang, G., and Zhang, T. (2016). Impacts of climatic change on hydrological regime in the Three-River Headwaters region, China, 1960-2009. Water Resour. manage. 30, 115–131. doi:10.1007/s11269-015-1149-x
Martens, B., Miralles, D. G., Lievens, H., van der Schalie, R., de Jeu, R. A. M., Fernández-Prieto, D., et al. (2017). GLEAM v3: Satellite-based land evaporation and root-zone soil moisture. Geosci. Model Dev. 10, 1903–1925. doi:10.5194/gmd-10-1903-2017
Masuda, K., Hashimoto, Y., Matsuyama, H., and Oki, T. (2001). Seasonal cycle of water storage in major river basins of the world. Geophys. Res. Lett. 28, 3215–3218. doi:10.1029/2000gl012444
Meng, X., Deng, M., Liu, Y., Li, Z., and Zhao, L. (2022). Remote sensing-detected changes in precipitation over the source region of three rivers in the recent two decades. Remote Sens. 14, 2216. doi:10.3390/rs14092216
Muñoz-Sabater, J., Dutra, E., Agustí-Panareda, A., Albergel, C., Arduini, G., Balsamo, G., et al. (2021). ERA5-Land: A state-of-the-art global reanalysis dataset for land applications. Earth Syst. Sci. Data 13, 4349–4383. doi:10.5194/essd-13-4349-2021
Qi, D., Li, X., Xiao, H., Zhou, W., Su, W., Hu, A., et al. (2015). Study on changing characteristics and impact factor of evaporation over three-river source area in recent 50 years. Resour. Environ. Yangtze Basin 24, 1613–1620. (in Chinese). doi:10.11870/cjlyzyyhj201509024
Qi, W., Liu, J., and Chen, D. (2018). Evaluations and improvements of GLDAS2.0 and GLDAS2.1 forcing data's applicability for basin scale hydrological simulations in the Tibetan plateau. J. Geophys. Res. Atmos. 123, 13128–13148. doi:10.1029/2018jd029116
Rodell, M., Houser, P. R., Jambor, U., Gottschalck, J., Mitchell, K., Meng, C.-J., et al. (2004). The global land data assimilation system. Bull. Amer. Meteor. Soc. 85, 381–394. doi:10.1175/BAMS-85-3-381
Sen, P. K. (1968). Estimates of the regression coefficient based on Kendall's tau. J. Am. Stat. Assoc. 63, 1379–1389. doi:10.1080/01621459.1968.10480934
Shang, S., Zhu, G., Wei, J., Li, Y., Zhang, K., Li, R., et al. (2021). Associated atmospheric mechanisms for the increased cold season precipitation over the Three-River Headwaters region from the late 1980s. J. Clim. 34, 1–8046. doi:10.1175/jcli-d-21-0077.1
Shi, H., Li, T., Wei, J., Fu, W., and Wang, G. (2016). Spatial and temporal characteristics of precipitation over the Three-River Headwaters region during 1961-2014. J. Hydrology Regional Stud. 6, 52–65. doi:10.1016/j.ejrh.2016.03.001
Sohail, T., Zika, J. D., Irving, D. B., and Church, J. A. (2022). Observed poleward freshwater transport since 1970. Nature 602, 617–622. doi:10.1038/s41586-021-04370-w
Song, C., Wang, G., Sun, X., and Hu, Z. (2021). River runoff components change variably and respond differently to climate change in the Eurasian Arctic and Qinghai-Tibet Plateau permafrost regions. J. Hydrology 601, 126653. doi:10.1016/j.jhydrol.2021.126653
Tang, J., and Cao, H. (2021). Multiscale variability of streamflow in the Three Rivers Headwater Region, China, and links to large-scale atmospheric circulation indices. J. Water Clim. Change 12, 521–532. doi:10.2166/wcc.2020.255
Wang, K., Xu, Q., and Li, T. (2020). Does recent climate warming drive spatiotemporal shifts in functioning of high-elevation hydrological systems? Sci. Total Environ. 719, 137507. doi:10.1016/j.scitotenv.2020.137507
Wang, X., Chen, R., and Yang, Y. (2017). Effects of permafrost degradation on the hydrological regime in the source regions of the Yangtze and Yellow rivers, China. Water 9, 897. doi:10.3390/w9110897
Wen, X., Pan, W., Sun, X., Li, M., Luo, S., Cao, B., et al. (2020). Study on the variation trend of potential evapotranspiration in the Three-River Headwaters region in China over the past 20 years. Front. Earth Sci. 8, 582742. doi:10.3389/feart.2020.582742
Wu, L., and Li, X. (2011). “Data quality evaluation for database of the first Chinese glacier inventory,” in 2011 international conference on remote sensing (Nanjing, China: Environment and Transportation Engineering). doi:10.1109/RSETE.2011.5964712
Xi, Y., Miao, C., Wu, J., Duan, Q., Lei, X., and Li, H. (2018). Spatiotemporal changes in extreme temperature and precipitation events in the three-rivers headwater region, China. J. Geophys. Res. Atmos. 123, 5827–5844. doi:10.1029/2017jd028226
Xu, M., Kang, S., Chen, X., Wu, H., Wang, X., and Su, Z. (2018). Detection of hydrological variations and their impacts on vegetation from multiple satellite observations in the Three-River Source Region of the Tibetan Plateau. Sci. Total Environ. 639, 1220–1232. doi:10.1016/j.scitotenv.2018.05.226
Yang, Y., Chen, R., Liu, G., Liu, Z., and Wang, X. (2022a). Monthly snowmelt dataset in China during 1951-2020. (Lanzhou, China: National Cryosphere Desert Data Center). [data set]. doi:10.12072/ncdc.NIEER.db2387.2022
Yang, Y., Chen, R., Liu, G., Liu, Z., and Wang, X. (2022b). Trends and variability in snowmelt in China under climate change. Hydrol. Earth Syst. Sci. 26, 305–329. doi:10.5194/hess-26-305-2022
Yao, T., Bolch, T., Chen, D., Gao, J., Immerzeel, W., Piao, S., et al. (2022). The imbalance of the Asian water tower. Nat. Rev. Earth Environ. 3, 618–632. doi:10.1038/s43017-022-00299-4
Yao, Z., Liu, Z., Huang, H., Liu, G., and Wu, S. (2014). Statistical estimation of the impacts of glaciers and climate change on river runoff in the headwaters of the Yangtze River. Quat. Int. 336, 89–97. doi:10.1016/j.quaint.2013.04.026
Yi, X., Li, G., and Yin, Y. (2013). Spatio-temporal variation of precipitation in the Three-River Headwater region from 1961 to 2010. J. Geogr. Sci. 23, 447–464. doi:10.1007/s11442-013-1021-y
Zhang, H., Chang, X., Zhu, G., Zhou, M., and Liu, W. (2022b). Analysis on the variation of groundwater storage in Three-River Headwater region from 2003to 2020. J. Geod. Geodyn. 42, 312–317. 325(in Chinese). doi:10.14075/j.jgg.2022.03.017
Zhang, L., Su, F., Yang, D., Hao, Z., and Tong, K. (2013). Discharge regime and simulation for the upstream of major rivers over Tibetan Plateau. J. Geophys. Res. Atmos. 118, 8500–8518. doi:10.1002/jgrd.50665
Zhang, Y., Yao, X., Zhou, S., and Zhang, D. (2022a). Glacier changes in the sanjiangyuan nature Reserve of China during 2000-2018. J. Geogr. Sci. 32, 259–279. doi:10.1007/s11442-022-1946-0
Zhao, Q., Ding, Y., Wang, J., Gao, H., Zhang, S., Zhao, C., et al. (2019). Projecting climate change impacts on hydrological processes on the Tibetan Plateau with model calibration against the glacier inventory data and observed streamflow. J. Hydrology 573, 60–81. doi:10.1016/j.jhydrol.2019.03.043
Zheng, D., van der Velde, R., Su, Z., Wen, J., Wang, X., and Yang, K. (2018). Impact of soil freeze-thaw mechanism on the runoff dynamics of two Tibetan rivers. J. Hydrology 563, 382–394. doi:10.1016/j.jhydrol.2018.06.024
Keywords: Three-River Headwaters Region, global warming, hydrological cycle, runoff, multi-source dataset, acceleration
Citation: Yang Y, Chen R, Ding Y, Zhao Q, Li H and Liu Z (2022) Variation in the hydrological cycle in the Three-River Headwaters Region based on multi-source data. Front. Environ. Sci. 10:1088467. doi: 10.3389/fenvs.2022.1088467
Received: 03 November 2022; Accepted: 05 December 2022;
Published: 14 December 2022.
Edited by:
Hainan Gong, Institute of Atmospheric Physics (CAS), ChinaReviewed by:
Yibo Wang, Lanzhou University, ChinaLei Wang, Institute of Tibetan Plateau Research (CAS), China
Copyright © 2022 Yang, Chen, Ding, Zhao, Li and Liu. This is an open-access article distributed under the terms of the Creative Commons Attribution License (CC BY). The use, distribution or reproduction in other forums is permitted, provided the original author(s) and the copyright owner(s) are credited and that the original publication in this journal is cited, in accordance with accepted academic practice. No use, distribution or reproduction is permitted which does not comply with these terms.
*Correspondence: Rensheng Chen, Y3JzMjAwOEBsemIuYWMuY24=