 Na Wang1
 Yalin Shu
- 1State Grid Economics and Technology Research Institute Co. Ltd, Beijing, China
- 2School of Economics and Management, Shanghai University of Electric Power, Shanghai, China
Achieving “peak carbon” and “carbon neutrality” and designing energy conservation and emission reduction policies in China require giving full play to the effect of green technology innovation. This paper uses annual data from 1993 to 2020 in China, including the number of green invention patents and green utility model patents, and tests the long-term and short-term effects of green innovation on carbon emission intensity by constructing an ARDL model. The results show that the effect of green invention patents and green utility model patents on CO2 emission intensity is different. Specifically, green invention patents contribute to reducing carbon emission intensity in the short term but act as a barrier in the long term. Green utility model patents suppress carbon emission intensity in the short and long terms. In addition, adjustment of the industrial structure characterized by “shrinking the secondary sector and developing the tertiary sector” has the most excellent effect on reducing carbon emission intensity in the short term. The relative energy price’s carbon emission reduction effect is weaker than the industrial structure. Foreign direct investment and non-fossil energy consumption increase carbon emission intensity in the short term. In the long term, increasing the proportion of non-fossil energy is crucial to reducing carbon emission intensity. The carbon emission reduction effect of energy price is insignificant, and foreign direct investment is not conducive to carbon emission reduction. Finally, this paper analyzes the policy implications of the empirical results and proposes recommendations for reducing China’s CO2 emission intensity accordingly.
Introduction
With the deepening urbanization level, China’s economy has completed leapfrog development. Its prosperity comes at the expense of large amounts of fossil energy inputs and environmental resources, which has led to a dramatic increase in CO2 emission intensity. China’s energy consumption-related carbon emissions were only 29.1% of those of the United States in 1980. However, in 2007, China surpassed the United States to become the world’s largest CO2 emitter. According to the Global Carbon Project (https://www.globalcarbonproject.org/index.htm), China accounts for 30.7% of global CO2 emissions in 2020. Such high-carbon emissions have led China to face the problem of domestic ecological support, the complex negotiation of a new international framework for greenhouse gas emission reduction, and the game of political diplomacy between different interest groups. In 2020, the Chinese government proposed a dual carbon reduction target of “30–60” at the 75th session of the UN General Assembly. It means that China needs less than 10 years to achieve “peak carbon” and another 30 years to achieve “carbon neutrality.” In other words, a rapid decrease in carbon emissions after reaching the peak and the task of reducing emissions to achieve the dual-carbon target in China is extremely arduous. Reducing CO2 emissions per unit of GDP, i.e., reducing CO2 emissions intensity, is undoubtedly one of the most important ways to achieve carbon emission reduction and ultimately achieve “peak carbon” and “carbon neutrality.” China’s 14th Five-Year Plan proposes to “implement a system based on carbon intensity control, supplemented by total carbon emission control” and aims to reduce CO2 intensity by 18%.
In this context, many scholars have devoted themselves to researching the factors influencing CO2 intensity and have achieved fruitful results. According to the analytical methods, the most widely applied ones are mainly factor decomposition and econometric regression. Among them, the LMDI method proposed by Ang and Liu (2001) can effectively avoid the residual problem and deal with zero and negative values. Therefore, scholars in China widely use the LMDI method for CO2 emission problems. Mousavi et al. (2017), Chong et al. (2019), Chang et al. (2018), and Hasan and Chongbo (2020) studied the drivers of CO2 emissions in Iran, Malaysia, Japan, and Bangladesh, respectively. Moreover, the LMDI method is also widely applied to the CO2 emission problem in China, Xie et al., 2019, Song et al. (2019), and Quan et al. (2020) studied the drivers of CO2 emissions in the power sector, transportation sector, and logistics industry in China, respectively. Econometric modeling, including VAR models, cointegration theory, and error correction models, is also one of the mainstream research methods in this direction. For example, Munir et al. (2020), Cerqueira et al. (2020), and Wasti and Zaidi (2020) applied the econometric regression approach to the study of CO2 emissions in Tunisia, ASEAN-5, United Kingdom, and Kuwait, respectively, while Wang and Lin, (2017), Ouyang et al. (2020), Xie et al. (2020), and Xie et al. (2022) used econometric models to investigate the factors influencing CO2 emissions in the commercial sector, heavy industry, and power sector, respectively, in China.
Based on the existing literature, we find the following points. Some scholars have achieved many results on the factors influencing CO2 emission intensity in China. However, technological innovation, especially green technology innovation, has rarely been examined in depth. Innovation is the fundamental driving force that leads to the economic development of a country or region. It is considered the most critical core factor, determining the sustainable and high-quality growth of China’s economy in the future (Liu et al., 2019). At the same time, science and technological innovation can bring both energy saving and emission reduction and have a positive effect on environmental management. Therefore, it is considered one of the ways to effectively solve environmental pollution (Xu and Zhang, 2021). Patents as the outcome of innovation output are an essential indicator of innovation capability. Intellectual property rights, at their core, have surpassed traditional elements such as natural resources and capital as a strategic resource as a source of international low-carbon competitive advantage (Zhou and Nie, 2013). Since the official promulgation of the Patent Law of the People’s Republic of China in 1984, the number of patent applications and grants in China has shown explosive growth, and China became the world’s top patent-filing country in 2012 and has maintained it since then. Since the development and dissemination of patented technologies are often not synchronized and are subject to rebound effects. It can have a positive or negative practical effect on CO2 emission intensity (Weina et al., 2016); Su and Moaniba, 2017; Du et al., 2019). Therefore, it is necessary to conduct further research on the substantial effect of China’s technological innovation in reducing CO2 emission intensity. In particular, green science and technology innovation analyze the direction and degree of influence of green technological innovation on CO2 emission intensity to comprehensively understand the strategic value of scientific and technological innovation for China to achieve “carbon peak” and “carbon neutrality.”
In recent years, autoregressive distributed lag (ARDL) was a new cointegration test. The ARDL model is often used by scholars, especially in empirical research on CO2 emissions (Xie et al., 2021) analyzed power dependence with ARDL (Mehmood, 2021). The link between globalization and carbon dioxide emissions is explored in Singapore using data from 1970 to 2014 (Ahmad and Du, 2017). The relationship between energy production, carbon dioxide emissions, and economic growth is investigated in Iran, and the results showed that CO2 emissions were positively correlated with economic growth (He F et al., 2020). The ARDL method is used to test the relationship between trade, foreign direct investment (FDI), and carbon dioxide emissions in BRICS countries (Kashif Raza and Festus Fatai, 2021). The ARDL simulation method is used to analyze the positive and negative changes in energy consumption, industrial growth, urbanization, and carbon emission on economic growth in Pakistan (Abbasi and Adedoyin, 2021). A novel dynamic ARDL simulation model is used to study the effects of energy use, economic policy uncertainty, and economic growth on carbon dioxide emissions in China during 1970–2018. In conclusion, the ARDL model is a favorable tool to study the influencing factors of CO2 emissions and the long-term and short-term relationships between variables, but at present, few scholars use ARDL to analyze the impact of technological innovation on carbon emissions. Considering that green patents can better reflect the green technology innovation ability and technology development level and the global competition of intellectual property rights represented by patents in the low-carbon field. This paper uses green invention patents and green utility model patents as proxy variables of green technology innovation. It investigates the short-term impact and long-term effect of green patents on China’s CO2 emission intensity by establishing ARDL long-term and short-term effect estimation models. A reference for promoting “peak carbon” and “carbon neutrality” is provided by promoting the change in the China’s patent system.
In comparison with the existing references, the contribution of this paper mainly lies in the following two points: 1) In terms of research perspective, this paper selects green invention patents and green utility model patents as proxy variables for green science and technology innovation, incorporates them into the same analytical framework, and analyzes the differences in the dynamic effects of different types of green patents on the reduction of CO2 emission intensity and their policy implications in both the short and long terms. 2) In terms of research methodology, we adopt the marginal cointegration test based on the ARDL model. The model has unique advantages in testing the long-term equilibrium and short-term dynamic relationships between variables under small sample data. It makes the measurement results more reliable.
Model building
Baseline model
In this paper, we first derive the energy consumption function equation from the general firm cost function equation, which draws from Fisher-Vanden et al. (2004) and Yao and Yu (2012). The decision model of energy CO2 emission intensity is then derived. In general, we can write the cost function of the firm as follows:
where C is the cost input factor, P is the price input factor, K is the capital input factor, L is the labor input factor, E is the energy input factor, Q is the gross output, and A is the production technique level. Assuming that the production function is Cobb–Douglas production function with the Hicks-neutral effect, we can write the cost production function as follows:
where αi is the output elasticity of factor i. According to Shephard’s lemma, the demand for a given factor of production is the partial derivative of the cost of the production function concerning the price of such a production factor. Thus, for a determined total output and other factors of production, the equation for the energy consumption function is
Equation 3 shows that the total output value, production technology level, energy price, and total factor input price jointly determine the energy consumption in actual production.
Assumption:
where
where
Since fossil energy consumption is the primary source of CO2 emissions, that is, CO2 emissions are related to energy consumption and energy structure, we further obtain the determining equation of CO2 emission intensity according to Eq. 5.
where CI is the CO2 emission intensity and E.S. is the energy consumption structure.
Therefore, Eq. 6 shows that under constant returns to scale, the output elasticity of energy and other factors, production technology level, energy structure, and the relative price of energy determine the CO2 emission intensity of enterprises.
As mentioned earlier, this paper mainly examines the effect of green technology innovation on CO2 emission intensity. At the same time, in the analysis of factors influencing macro CO2 emission intensity, in addition to scientific and technological innovation, industrial structure and the foreign direct investment have a non-negligible effect on total factor productivity and CO2 emission. Therefore, we interpret the production technology level in Eq. 6 as the generalized productivity, including scientific and technological innovation, industrial structure, and the foreign direct investment. Among them, to distinguish the difference between the effect of green invention patents GINV and green utility model patents GUTY on CO2 emission intensity, both of them are included in the analysis framework at the same time, so the formula is
where A0 represents the initial value of the technology level, which is a constant. GINV is the green technology innovation level expressed by green invention patents. GUTY is the green technology innovation level expressed by green utility model patents. I.S. represents the industrial structure, and FDI represents the foreign direct investment. δ, τ, η, and λ is the impact coefficients, respectively. Combining Eqs 6, 7, the benchmark model used in the analysis of this paper can be determined as follows:
Empirical models
In order to test the long-term cointegration and short-term dynamic relationship between green invention patent GINV, green utility model patent GUTY, industrial structure I.S., foreign direct investment FDI, relative energy price R.P., energy consumption structure E.S., and CO2 emission intensity CI, this paper uses the ARDL model proposed by Charen and Deadman (1997) and developed by Pesaran and Pesaran, 1997; Pesaran and Shin, 1999, to analyze. The method does not require the variables to be homogeneous and single integers, and the analysis model can contain a single integer I (0) of order 0 or I (1) of order 1. This method can still obtain unbiased estimates for small samples or endogenous variables. Combined with the benchmark model Eq. 8, the ARDL (m0, m1, m2..., m6) model is as follows:
In the aforementioned equation, ωt is a deterministic variable including constant, time, and time trend. Furthermore, the lag order (m0, m1, m2, ..., m6) is obtained based on AIC, SIC, H.Q., and Adj-R2.
Based on Eq. 9, the conditional error correction model (conditional error correction model) is as follows:
Based on Eq. 10, two methods, the Wald test and the t-test, can be applied to examine the cointegration relationship between variables. Among them the Wald test is suitable to examine the joint significance level of each lagged variable with the original hypothesis
If the test results show a cointegration relationship, the corresponding long-run elasticity coefficients for each influencing factor can be available via Eq. 10:
This equation leads to the long-run cointegration equation between CO2 emission intensity and each explanatory variable:
Furthermore, a linear transformation of Eq. 9 yields the ARDL-ECM model for short-term effects estimation.
The coefficient θ error correction term ecmt−1 reflects the strength of the adjustment of CO2 emission intensity to its deviation from the long-term equilibrium.
Variables and data sources
In this paper, green invention patents (GINV), green utility model patents (GUTY), industrial structure (IS), foreign direct investment (FDI), relative energy price (RP), and energy consumption structure (ES) are selected as factors affecting CO2 emission intensity (EI). At the same time, the data source of this paper is the EPS data platform (http://www.epsnet.com.cn/). The time frame is 1993–2020. The specific treatment of indicators and variables in each year is as follows:
1) CO2 emission intensity (CI): CO2 emission intensity is equal to CO2 emissions divided by the gross domestic product (GDP). They considered the relatively small amount of CO2 emissions from agricultural activities and waste disposal due to statistical data. Our calculations take into account the CO2 emissions due to energy activities and industrial production activities.
The formula for calculating CO2 emissions from energy activities is:
2) Green invention patents (GINV) and green utility model patents (GUTY): China’s patents include three types of inventions, utility models, and designs. The environmental effects of green technological innovation are mainly transmitted by technology applications, while design patents are less innovative, so they are not included in the analysis. Patent data mainly includes the number of patent applications received and the number of patent applications granted, but not all patent applications are granted, and in comparison, the number of patent applications granted better reflects the results of technological innovation. In a word, the number of patent applications can better reflect the achievements of scientific and technological innovation, while the number of patent grants has more legal effect. Therefore, referring to the practice of Xu and Zhang. (2021), we select the number of patent grants to represent the level of technological innovation. Data on the number of patents granted comes from the State Intellectual Property Office. Then, drawing on the practice of Wang et al., 2020, this paper uses the Green List of International patent classification to search the relevant patent information practices of environment-friendly technologies and identifies the annual green invention patent GINV and green utility model patent GUTY.
3) Industrial structure (IS): The secondary industry share at each regional scale has a significant positive effect on carbon emissions and energy consumption (Li et al., 2018; Chen et al., 2019). However, the tertiary industry is relatively low in energy consumption and high in output compared to the secondary industry, so the “energy saving and consumption reduction” policy has become one of the main tools of local governments (Zhong, Weizhou, et al., 2015). Accordingly, this paper uses the ratio of the value added of the tertiary industry to the value added of the secondary industry to characterize the industrial structure of China, to examine the role of the “shrinking the secondary sector and developing the tertiary sector” policy in reducing CO2 emission intensity.
4) Foreign direct investment (FDI): With the further deepening of the reform and opening up policy, the scale of foreign direct investment shows a growing trend. Although foreign direct investment promotes our economic growth to a certain extent, it also brings about environmental and other problems, so the impact of our dependence on foreign direct investment on economic growth needs further study. Therefore, this paper selects FDI dependence as a proxy indicator, that is, the proportion of FDI flow to the year’s GDP; we convert FDI to RMB using the current year’s average exchange rate as a benchmark.
5) Relative energy price (R.P.): Regarding theory, energy prices in a market economy effectively optimize resource allocation and improve energy use efficiency (Li et al., 2020). However, there are some distortions in Chinese energy prices, and their role in reducing carbon emission intensity needs further empirical testing. In this paper, we use the relative energy price index to calculate the energy price index and social retail price ratio.
6) Energy Structure (E.S.): Since 2007, China has increased its investment in new energy sources, and the share of coal consumption in China’s overall energy structure has decreased from 72.5% in 2007 to 57.7% in 2019, while the share of clean energy consumption, such as hydropower, nuclear power, and wind power has increased from 7.5% to 15.3%. This paper selects the share of non-fossil energy to measure the energy structure.
Empirical results and analysis
Unit root test
Although the ARDL method does not require the variables to be of the same order, we can analyze either the zeroth order I(0) or the first order I(1). However, for series I(2) and above, the F-statistic and t-statistic of the boundary cointegration test may be deviated (Pesaran et al., 2001). Therefore, carrying out a unit root test for each variable is necessary before using the ARDL method for the cointegration test. Since the sample number of this paper is only 28 years, considering that the DF-GLS (GLS transformed Dickey–Fuller) unit root test method can overcome the defects of low efficacy of commonly used ADF(augmented Dickey–Fuller) unit root test method and P.P. (Phillips–Perron) unit root test method in the small sample unit root test. Therefore, the DF-GLS unit root test method is adopted, and the null hypothesis is that there is a unit root in the sequence. The results in Table 1 show that the lag order selection is based on SIC criterion (Schwarz Information Criterion) and AIC criterion (Akaike Information Criterion), and the maximum lag order is 5.
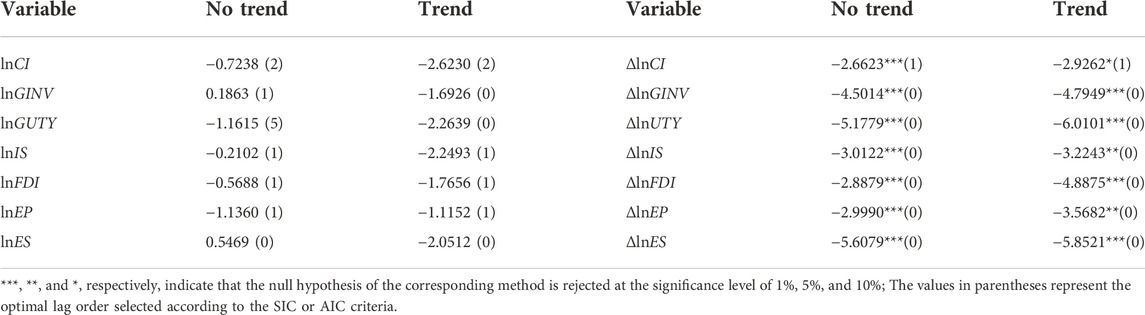
TABLE 1. Results of the serial unit root test of each variable based on the DF-GLS method.
As can be seen from Table 1, all variables adopted in this paper are first-order integrated I(1) processes, so the ARDL model can be further used to analyze whether there is a long-term cointegration relationship among variables.
ARDL model selection and boundary cointegration test
Before using Eq. 10 for the cointegration test, we should first calculate the optimal lag order of Eq. 9. We choose the maximum final order as 2, through the empirical sample size of this paper, and then according to AIC, SIC, and H.Q. criteria, the optimal ARDL models without and with trend terms are ARDL (2,2,2,2) and ARDL (2,2,2,1,1,1,2), respectively. Table 2 shows the corresponding estimation results.
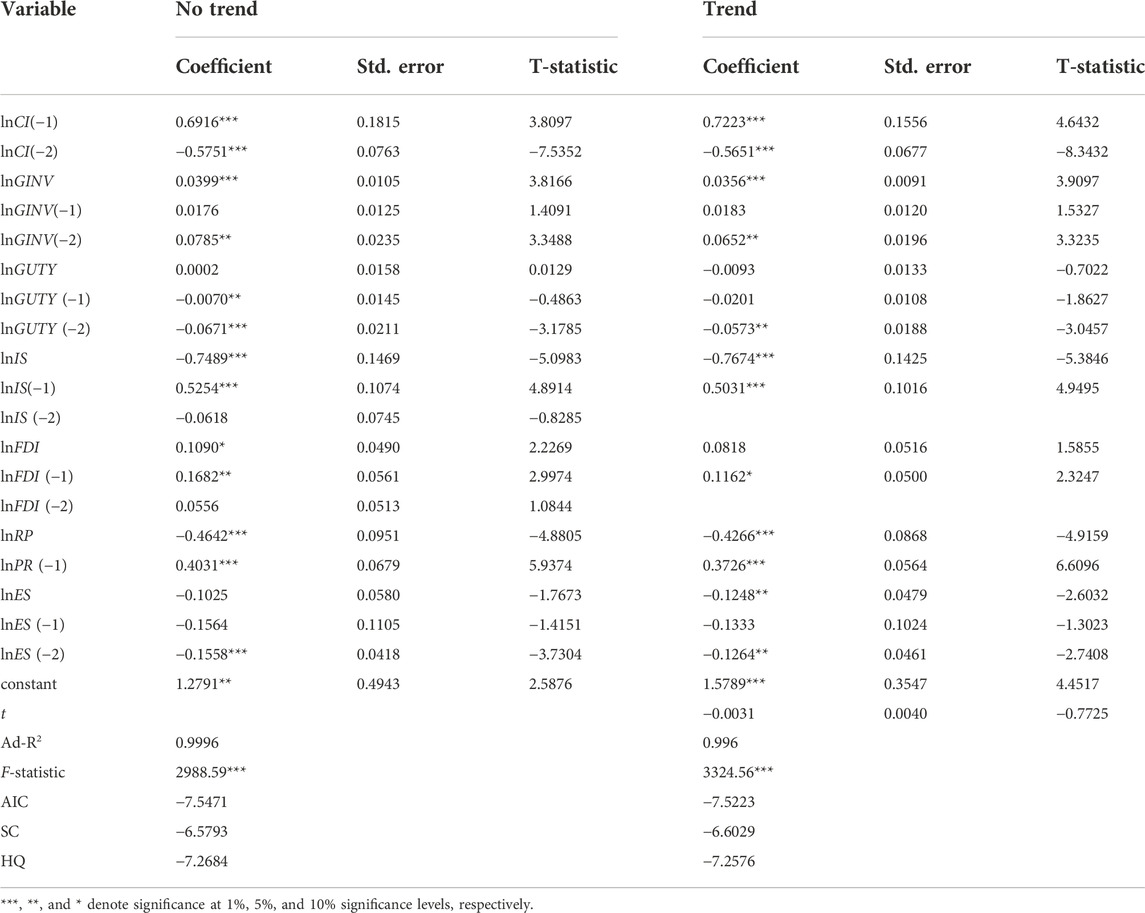
TABLE 2. ARDL model estimation results.
According to Table 2, the trend term of ARDL with trend term (2,2,2,1,1,1,2) is not significant. Meanwhile, based on statistical indicators such as AIC and H.Q., it is found that ARDL without a trend term (2,2,2,2,2) is better than the model with a trend term. Therefore, we analyzed the ARDL (2,2,2,2,2) model without trend term as the basis for analysis.
Table 3 shows the results of the ARDL (2,2,2,2,2) cointegration test without a trend term. Considering that the critical value of F-statistic provided by Pesaran et al. (2001) is calculated based on large samples, and the number of samples in this paper is only 28, the critical value obtained by random simulation of six explanatory variables and 30 samples in Narayan and Smyth, 2005 is adopted for F-statistic. The results show that the null hypothesis is rejected at a 1% significance level for both F- and t-statistics. Therefore, in the sample period, there is a long-term stable relationship between CO2 emission intensity (CI) and green invention patents (GINV), green utility model patents (GUTY), industrial structure (I.S.), foreign direct investment (FDI), relative energy price (R.P.), and energy consumption structure (E.S.).
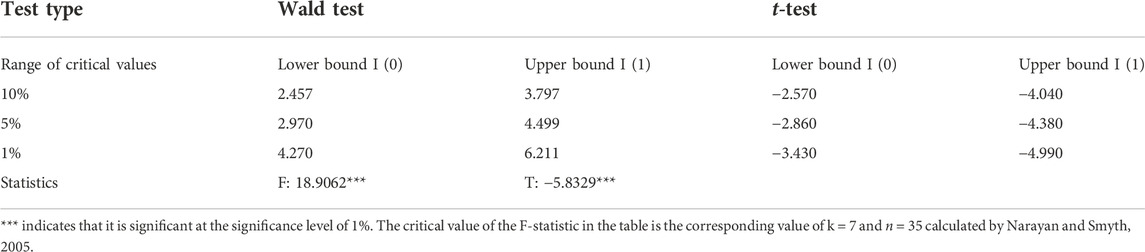
TABLE 3. Boundary cointegration test results.
Long-term relationship and short-term dynamic coefficient estimation
Based on the boundary cointegration test results, the long-term relationship coefficients between variables are estimated using Eq. 11 with electricity dependence as the explanatory variable. We estimate the short-term dynamic coefficients between variables using Eq. 13; Table 4 shows the results of the long-term and short-term coefficient estimates and diagnostic tests. The results show that the model residuals satisfy the normal distribution and eliminate the phenomena of serial autocorrelation and heteroskedasticity. In contrast, the results of the Ramsey RESET test for the model form misspecification show that the model is correctly set.

TABLE 4. Estimation results of a long-term relationship and short-term dynamic coefficients.
Table 4 shows that the error correction term ecm (−1) is significant at the 1% significance level with a negative sign. The larger the absolute value of this coefficient, the faster the system returns to equilibrium after a shock. The regression result of the error correction term is −0.8831, which indicates that China’s CO2 emission intensity deviates from the long-run equilibrium level; it is corrected by 88.31% in the following year.
For green invention patents (lnGINV), in the long and short terms, green invention patents increased by 1%, China’s CO2 emission intensity increased by 0.1541%, and decreased by 0.0385% [0.0400 + (−0.0785)] accordingly, and both are significant at the 1% level. It shows that the increase in the number of patents for green inventions, although contributing to the reduction of carbon emission intensity in the short term, inhibits the reduction of carbon emission intensity in the long term, and the long-term effect is stronger than the short-term one. The possible reason is that green invention patents reduce carbon emission intensity in the short term due to their high technology content. However, since the patents for high technology content inventions are usually in the hands of large and high technology enterprises, they may create higher barriers to market access in the long run and, eventually, have a dampening effect on improving carbon emission performance.
On the contrary, green utility model patents (lnGUTY) increased by 1%, leading to a 0.067% increase in China’s CO2 emission intensity in the short term but a 0.0837% decrease in the long term. The reason for this is that, compared with invention patents, utility model patents are lower in content, and there is a significant patent “bubble” phenomenon, which makes it difficult for them to play a positive role in the short term. Even the negative part is more significant than the positive one. However, due to the strong practicality and easy imitation of green utility model patents, they are conducive to promoting the diffusion and upgrading of green technologies in the long run, thus reducing carbon emission intensity.
The industrial structure (lnIS), measured by the ratio of tertiary to secondary industries, contributes to reducing carbon emission intensity in the short and long terms. However, its long-term effect (−0.3229) is weaker than the short-term effect (−0.7490 + 0.0623 = −0.6967), which indicates that to utilize better the positive effect of industrial restructuring in improving carbon emission performance, it is necessary to further optimize the internal structure of the tertiary industry while promoting the “retreat from two to three.” It indicates that while promoting “shrinking the secondary sector and developing the tertiary sector,” it is necessary to optimize the tertiary sector’s internal structure further to utilize better the positive effect of industrial restructuring in improving carbon emission performance. As the foreign direct investment (lnFDI), measured by FDI dependence, increases (1%), the CO2 emission intensity increases correspondingly by 0.0529% [0.1088+(−0.0559)] in the short term and by 0.3768% in the long term. It indicates that the larger the share of FDI flows in the GDP of the year, the less favorable it is to improve carbon emission performance. It also reminds us that when introducing foreign investment, the focus should be on setting up more long-term investment attraction programs. Full advantage of the technology spillover is taken from foreign investment introduction rather than just pursuing scale as the goal.
In the short term, as the relative price of energy (lnRP) increases (1%), there is a corresponding decrease in carbon emissions intensity of 0.4641%. In the long run, the strength of its effect is negative (−0.0692) but not significant. It suggests that while raising energy prices is an effective means of reducing carbon emissions, in the long run, there are still some distortions in China’s energy prices, resulting in an energy price mechanism that does not yet play an effective role in allocating resources in the long run. The energy mix measured by the share of non-fossil energy (lnES) fails to play a positive role in effectively reducing carbon emission intensity in the short term (its short-term impact is −0.1026 + 0.1560 = 0.0534), which may be related to China’s coal-dominated resource endowment. Although increasing the share of non-fossil energy helps reducing carbon emissions in the short term, the negative impact on economic development is relatively more significant. It may be related to China’s coal-based resource endowment. However, in the long run, as the share of non-fossil energy increases (1%), the corresponding reduction in carbon intensity −0.4693% plays the strongest role in reducing carbon intensity relative to the other effects examined in this paper. Therefore, increasing the share of non-fossil energy use is crucial for China to achieve the strategic goals of “peak carbon” and “carbon neutrality” in the long run.
Parameter stability test
When using time series data for cointegration estimation, generally assumed estimated parameters are time-invariant; therefore, further parameter stability tests are required to avoid breakpoints in the time series data and thus affect the stability of the parameters. To this end, this paper applies cumulative sum of recursive residuals (CUSUM) and cumulative sum of squares of recursive residuals (CUSUMQ) based on recursive residuals for parameter stability testing. Figure 1 shows the results. The figure’s upper and lower straight lines are the boundary intervals at a 5% significance level, and the test results indicate that the parameters in the model are stable.
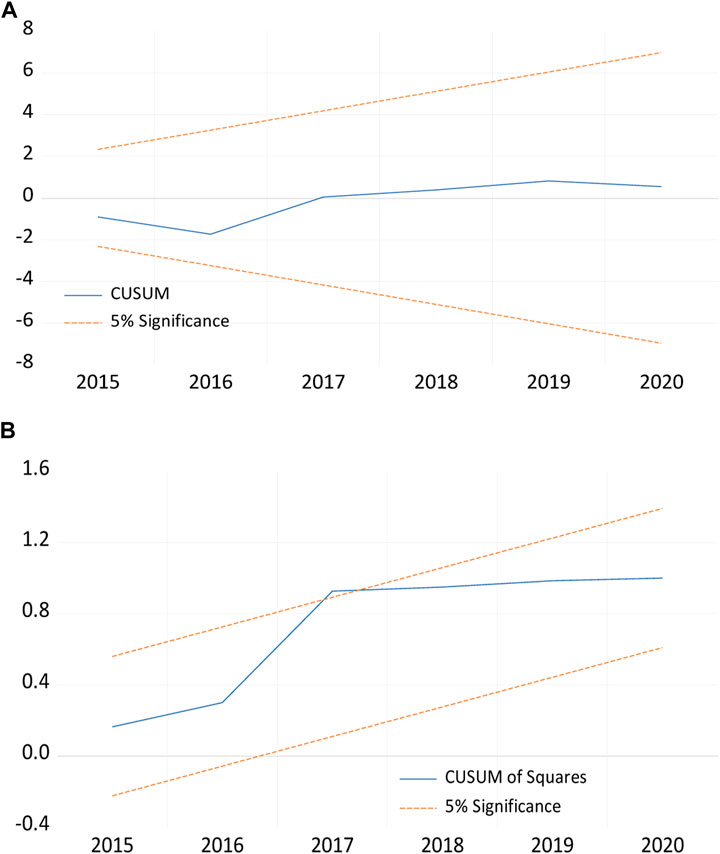
FIGURE 1. (A) Test result of CUSUM. (B) Test result of CUSUMQ.
Robustness test
We used FMOLS, DOLS, and CCR to test the robustness of the long-term relationship between variables, and the results are shown in Table 5.
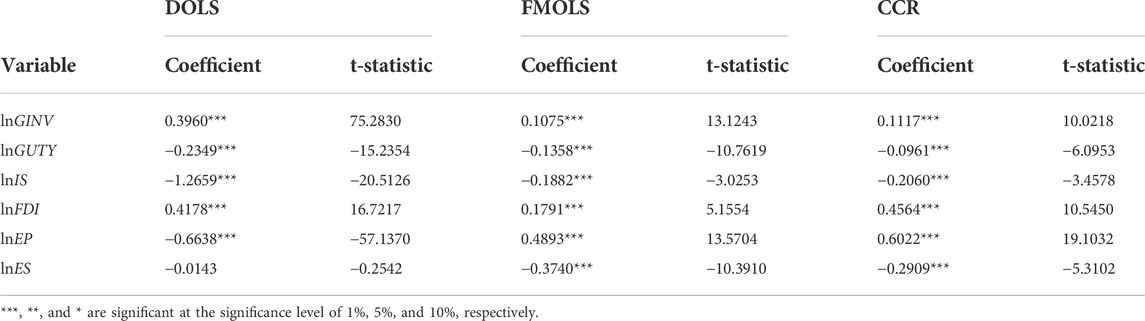
TABLE 5. Long-term estimates of FMOLS, DOLS, and CCR.
Similar to the long-term results of ARDL, DOLS, FMOLS, and CCR estimates give the same direction of changes in green invention patents, green utility model patents, industrial structure, foreign direct investment, and energy structure as ARDL. Therefore, the results of this study are robust.
Conclusion and policy implications
Based on the boundary cointegration test of the ARDL model, we examine the long- and short-term effects of green technology innovation, industrial structure, degree of foreign investment introduction, the relative price of energy, and energy consumption structure on CO2 emission intensity measured by the number of green invention patents granted and green utility model patents granted, using annual data of China from 1993 to 2020. The empirical results show that
1) The increase in the number of green invention patents granted can only help reduce carbon emission intensity in the short term but play an obstacle role in improving carbon emission performance over a long time. This conclusion indicates severe problems in the conversion efficiency and industrialization of China’s green patent inventions. Many innovative products become laboratory samples and exhibits, which are difficult to transform into real productivity. This seriously restricts the role of green invention patents in achieving a “carbon peak” and “carbon neutral.” Therefore, when formulating green technology innovation development strategies and related measures, special attention should be paid to the essential role of innovation networks in promoting the diffusion and upgrading of green invention technologies. We should strengthen the innovation cooperation between “ industry–university–research ” and pay close attention to the market demand for innovative results. While promoting the continued growth of the number of green invention patents and effectively transforming them into real productivity.
2) The increase in the number of green utility model patents granted inhibits carbon performance in the short term, but helps reduce carbon intensity in the long term. The technological content of utility model patents is relatively weaker than that of invention patents. But they are characterized by short application cycles, low application difficulty, high practicality, and easy imitation in the process of use. In the long run, it is conducive to promoting the proliferation and upgrading of green technology, thus helping to achieve “carbon peak” and “carbon neutrality.” Therefore, on the one hand, we should continue to support and encourage enterprises to invest in the R&D of green utility model patents. On the other hand, we should improve the evaluation system of innovation activities to avoid the “innovation illusion” and “patent bubble” in green utility model patents.
3) The policy of “retreating two into three” contributes significantly to the reduction of carbon emission intensity in both the short and long terms. But its long-term effect (−0.3229) is weaker than the short-term effect. In contrast, the degree of foreign investment introduction, measured by FDI dependence, has a significant inhibitory effect on reducing carbon emission intensity in the short and long terms. This finding suggests that the carbon emission reduction benefits achieved through the volume increase of the China’s tertiary sector, which accounts for more than half of GDP, are significant. Therefore, when formulating policies for attracting foreign investment, it is necessary to consider them in an integrated manner with the upgrading of the industrial structure. Regional or industry-specific preferential policies are used to attract relevant foreign investment into high value added and low-energy areas of the tertiary industry in a targeted manner to increase the upgrading of the industry.
4) Increasing the relative price of energy is beneficial to reduce carbon intensity in the short term, but the long-term effect is not significant. Increasing the share of non-fossil energy sources to reduce carbon emissions is not easy to achieve in the short term, but it is a crucial measure, that is, highly effective in the long term. This conclusion suggests that to achieve “peak carbon” and “carbon neutral,” we must continuously improve the energy price mechanism and establish a market-based energy pricing mechanism that reflects market supply and demand and environmental costs. We should make the most of environmental regulation, taxation, and price policies. The development of new energy industries increased, the proportion of non-fossil energy to meet the energy demand of economic development continuously increased, and carbon emission intensity simultaneously reduced.
In this paper, the green patent index represents the green technology innovation ability and analyzes the impact of green technology innovation on carbon emissions. However, the ARDL model can only analyze aspects of the symmetry effect, and we study from the angle of asymmetry using the NARDL model in the future. Meanwhile, the data at the national level cannot reflect regional and industrial differences, so we conduct subsequent research by region and industry. The relationship between green technology innovation and local carbon emissions and its influencing factors continues to be explored, combined with scenario prediction and other relevant methods, to provide an effective way for the green patent field to contribute to China’s environmental quality and economic growth.
Data availability statement
The datasets presented in this study can be found in online repositories. The names of the repository/repositories and accession number(s) can be found at: http://www.epsnet.com.cn/.
Author contributions
All authors contributed to the study conception and design. Material preparation, data collection, and analysis were performed by NW, HY, ZC, and TL. The first draft of the manuscript was written by YS, and all authors commented on previous versions of the manuscript. All authors read and approved the final manuscript.
Funding
This work was supported by a project grant from Science and Technology Project of State Grid Electric Power Economic and Technological Research Institute Corporation (Grant No.SGJY000KJJS2200444).
Conflict of interest
Authors NW, HY, ZC, and TL were employed by the company State Grid Economics and Technology Research Institute Co., Ltd.
The remaining authors declare that the research was conducted in the absence of any commercial or financial relationships that could be construed as a potential conflict of interest.
The authors declare that this study received funding from Science and Technology Project of State Grid Electric Power Economic and Technological Research Institute Corporation (Grant No.SGJY000KJJS2200444). The funder had the following involvement in the study: the study design, and interpretation of data.
Publisher’s note
All claims expressed in this article are solely those of the authors and do not necessarily represent those of their affiliated organizations, or those of the publisher, the editors, and the reviewers. Any product that may be evaluated in this article, or claim that may be made by its manufacturer, is not guaranteed or endorsed by the publisher.
References
Abbasi, K. R., and Adedoyin, F. F. (2021). Do energy use and economic policy uncertainty affect CO2 emissions in China? Empirical evidence from the dynamic ARDL simulation approach[J]. Environ. Sci. Pollut. Res. 28, 23323–23335. doi:10.1007/s11356-020-12217-6
Ahmad, N., and Du, L. (2017). Effects of energy production and CO 2 emissions on economic growth in Iran: ARDL approach. Energy 123 (MAR.15), 521–537. doi:10.1016/j.energy.2017.01.144
Ang, B. W., and Liu, F. L. (2001). A new energy decomposition method: Perfect in decomposition and consistent in aggregation. Energy (Oxford) 26 (6), 537–548. doi:10.1016/s0360-5442(01)00022-6
Cerqueira, E. D. V., Motte-Baumvol, B., Chevallier, L. B., and Bonin, O. (2020). Does working from home reduce CO2 emissions? An analysis of travel patterns as dictated by workplaces. Transp. Res. Part D Transp. Environ. 83, 102338. doi:10.1016/j.trd.2020.102338
Chang, M., Zheng, J., Inoue, Y., Tian, X., Chen, Q., and Gan, T. (2018). Comparative analysis on the socioeconomic drivers of industrial air-pollutant emissions between Japan and China: Insights for the further-abatement period based on the LMDI method. J. Clean. Prod. 189, 240–250. doi:10.1016/j.jclepro.2018.02.111
Charen, Z. W., and Deadman, D. F. (1997). New directions in econometric analysis. Oxford University Press.
Chen, J., Yuan, H., Tian, X., Zhang, Y., and Shi, F. (2019). What determines the diversity of CO2 emission patterns in the beijing-tianjin-hebei region of China? An analysis focusing on industrial structure change. J. Clean. Prod. 228, 1088–1098. doi:10.1016/j.jclepro.2019.04.267
Chong, C. H., Tan, W. X., Ting, Z. J., Liu, P., Ma, L., Li, Z., et al. (2019). The driving factors of energy-related CO2 emission growth in Malaysia: The LMDI decomposition method based on energy allocation analysis. Renew. Sustain. Energy Rev. 115, 109356. doi:10.1016/j.rser.2019.109356
Du, Kerui, Li, Pengzhen, and Yan, Zheming (2019). Do green technology innovations contribute to carbon dioxide emission reduction? Empirical evidence from patent data. Technol. Forecast. Soc. Change 146, 297–303. doi:10.1016/j.techfore.2019.06.010
Fisher-Vanden, K., Jefferson, G. H., Liu, H., and Tao, Q. (2004). What is driving China's decline in energy intensity? Resour. Energy Econ. 26, 77–97. doi:10.1016/j.reseneeco.2003.07.002
Hasan, M. M., and Chongbo, W. (2020). Estimating energy-related CO2 emission growth in Bangladesh: The LMDI decomposition method approach. Energy Strategy Rev. 32, 100565. doi:10.1016/j.esr.2020.100565
He, F., Chang, K. C., Li, M., Li, X., and Li, F. (2020). Bootstrap ARDL test on the relationship among trade, FDI, and CO2 emissions: Based on the experience of BRICS countries. Sustainability 12 (3), 1060. doi:10.3390/su12031060
Hu, C., Huang, X., Zhong, T., and Tan, D. (2008). Analysis of carbon emission characteristics and its dynamic evolution in China. China Popul. Resour. Environ., 38–42.
Kashif Raza, A., and Festus Fatai, A. (2021). How energy consumption, industrial growth, urbanization, and CO2 emissions affect economic growth in Pakistan? A novel dynamic ARDL simulations approach - ScienceDirect[J]. Energy.
Li, K., Fang, L., and He, L. (2020). The impact of energy price on CO2 emissions in China: A spatial econometric analysis. Sci. Total Environ. 706, 135942. doi:10.1016/j.scitotenv.2019.135942
Li, L., Lei, Y., Wu, S., He, C., Chen, J., and Yan, D. (2018). Impacts of city size change and industrial structure change on CO2 emissions in Chinese cities. J. Clean. Prod. 195, 831–838. doi:10.1016/j.jclepro.2018.05.208
Liu, S., Zhang, S., and Zhu, H. (2019). Study on the measuremnet and high-quality economy development effect of national innovation driving force. J. quantitative thecnical Econ. 4, 3–23.
Mehmood, U. (2021). Globalization-driven CO2 emissions in Singapore: An application of ARDL approach. Environ. Sci. Pollut. Res. 28 (9), 11317–11322. doi:10.1007/s11356-020-11368-w
Mousavi, B., Lopez, N. S. A., Biona, J. B. M., Chiu, A. S. F., and Blesl, M. (2017). Driving forces of Iran's CO2 emissions from energy consumption: An LMDI decomposition approach. Appl. Energy 206, 804–814. doi:10.1016/j.apenergy.2017.08.199
Munir, Q., Lean, H. H., and Smyth, R. (2020). CO2 emissions, energy consumption and economic growth in the ASEAN-5 countries: A cross-sectional dependence approach. Energy Econ. 85, 104571. doi:10.1016/j.eneco.2019.104571
Narayan, P. K., and Smyth, R. (2005). Electricity consumption, employment and real income in Australia evidence from multivariate granger causality tests. Energy Policy 33, 1109–1116. doi:10.1016/j.enpol.2003.11.010
Ouyang, X., Fang, X., Cao, Y., and Sun, C. (2020). Factors behind CO2 emission reduction in Chinese heavy industries: Do environmental regulations matter? Energy Policy 145, 111765. doi:10.1016/j.enpol.2020.111765
Pesaran, M. H., and Pesaran, B. (1997). Working with Microfit4.0: Interactive econometric analysis. Oxford University Press.
Pesaran, M. H., and Shin, Y. (1999). “An autoregressive distributed lag modeling approach to cointegration analysis,” in Econometrics and economic theory in the 20th century: The ragnar frisch centennial symposium. Editor S. Storm (Cambridge: Cambridge University Press). Chapter 11.
Pesaran, M. H., Shin, Y., and Smith, R. J. (2001). Bounds testing approaches to the analysis of level relationships. J. Appl. Econ. Chichester. Engl. 16, 289–326. doi:10.1002/jae.616
Quan, C., Cheng, X., Yu, S., and Ye, X. (2020). Analysis on the influencing factors of carbon emission in China's logistics industry based on LMDI method. Sci. Total Environ. 734, 138473. doi:10.1016/j.scitotenv.2020.138473
Song, Y., Zhang, M., and Shan, C. (2019). Research on the decoupling trend and mitigation potential of CO2 emissions from China's transport sector. ENERGY 183, 837–843. doi:10.1016/j.energy.2019.07.011
Su, H. N., and Moaniba, I. M. (2017). Does innovation respond to climate change? Empirical evidence from patents and greenhouse gas emissions. Technol. Forecast. Soc. Change 122, 49–62. doi:10.1016/j.techfore.2017.04.017
Wang, A, and Lin, B (2017). Assessing CO2 emissions in China's commercial sector: Determinants and reduction strategies. J. Clean. Prod. 164, 1542–1552. doi:10.1016/j.jclepro.2017.07.058
Wang, M., Lian, S., Li, H., and Yin, S. (2020). China's two-way FDI, intellectual property protection, and green patent output:an empirical analysis of provincial panel data. J. Syst. Manag. 29 (6), 1136–1149.
Wasti, S. K. A., and Zaidi, S. W. (2020). An empirical investigation between CO2 emission, energy consumption, trade liberalization and economic growth: A case of Kuwait. J. Build. Eng. 28, 101104. doi:10.1016/j.jobe.2019.101104
Weina, D., Gilli, M., Mazzanti, M., and Nicolli, F. (2016). Green inventions and greenhouse gas emission dynamics: A close examination of provincial Italian data. Environ. Econ. Policy Stud. 18, 247–263. doi:10.1007/s10018-015-0126-1
Xie, P., Gao, S., and Sun, F. (2019). An analysis of the decoupling relationship between CO2 emission in power industry and GDP in China based on LMDI method. J. Clean. Prod. 211, 598–606. doi:10.1016/j.jclepro.2018.11.212
Xie, P., Li, H., Sun, F., and Tian, H. (2021). Analysis of the dependence of economic growth on electric power input and its influencing factors in China. Energy Policy 158 (3), 112528. doi:10.1016/j.enpol.2021.112528
Xie, P, Liao, J, Pan, X, and Sun, F (2022). Will China's carbon intensity achieve its policy goals by 2030? Dynamic scenario analysis based on STIRPAT-PLS framework. Sci. Total Environ. 823, 155060. doi:10.1016/j.scitotenv.2022.155060
Xie, P., Yang, F., Mu, Z., and Gao, S. (2020). Influencing factors of the decoupling relationship between CO2 emission and economic development in China's power industry. ENERGY 209, 118341. doi:10.1016/j.energy.2020.118341
Xu, K., and Zhang, Y. (2021). Can greem technology innovation bring 'Iucid waters and Iush mountains. China Popul. Resour. Environ. 31 (5), 141–151.
Yao, X., and Yu, B. (2012). Technical progressstructure changeand carbon dioxide emissions of industry. Sci. Res. Manag. 33 (8), 35–40.
Zhong, W., Jiang, F., and Wan, X. (2015). An empirical study on the impact of industrial structure changes on carbon emission intensity in China. Audit Econ. Res. 30, 88–96.
Keywords: carbon emission intensity, green patents, ARDL model, technology innovation, empirical analysis
Citation: Wang N, Yu H, Shu Y, Chen Z and Li T (2022) Can green patents reduce carbon emission intensity?—An empirical analysis based on China’s experience. Front. Environ. Sci. 10:1084977. doi: 10.3389/fenvs.2022.1084977
Received: 31 October 2022; Accepted: 23 November 2022;
Published: 12 December 2022.
Edited by:
Hong-Dian Jiang, China University of Geosciences, ChinaReviewed by:
Zhang Jin Liang, North China Electric Power University, ChinaPin Li, Shanghai Jiao Tong University, China
Copyright © 2022 Wang, Yu, Shu, Chen and Li. This is an open-access article distributed under the terms of the Creative Commons Attribution License (CC BY). The use, distribution or reproduction in other forums is permitted, provided the original author(s) and the copyright owner(s) are credited and that the original publication in this journal is cited, in accordance with accepted academic practice. No use, distribution or reproduction is permitted which does not comply with these terms.
*Correspondence: Yalin Shu, c2h1eWFsaW42MjFAMTYzLmNvbQ==