 Danying Shan1,2†
 Zhenyu Du1,2*†
 Ting Zhang1,2Xiulan Zhang1,2Guan Cao1,2
 Zirui Liu3Zhixiao Yao1,2Ka Tang1,2Siyuan Liang4*
- 1National Research Center for Environmental Analysis and Measurement (CNEAC), Beijing, China
- 2Environmental Development Center of the Ministry of Ecology and Environment, Beijing, China
- 3State Key Laboratory of Atmospheric Boundary Layer Physics and Atmospheric Chemistry, Institute of Atmospheric Physics, Chinese Academy of Sciences, Beijing, China
- 4China National Environmental Monitoring Centre (CNEMC), Beijing, China
In recent years, ozone (O3) pollution has worsened in China and contributes frequently to air pollution problems. To support the implementation of coordinated control for ozone and fine particulate matter, it is essential to study the chemical compositions and sources of volatile organic compounds (VOCs), which are the crucial precursor of both ozone and fine particulate matter. In this study, 117 volatile organic compounds were monitored in 13 cities in Beijing-Tianjin-Hebei Urban Agglomeration and Fenwei plain. Concentrations of total volatile organic compounds ranged from 42 to 279 μg/m3 during the monitoring episode. In all 13 cities, alkanes, halogenated hydrocarbons, aromatics and oxygenated volatile organic compounds (OVOCs) were the dominant volatile organic compounds. Contributions of alkanes, halogenated hydrocarbons, aromatics and oxygenated volatile organic compounds to total ozone formation potential (OFP) were 21.7%–32.6%, 21.0%–27.9%, 24.3%–50.8% and 28.6%–52.3%, respectively. Furthermore, the results of source apportionment by positive matrix factorization (PMF) model indicated that solvent usage, gasoline evaporation, vehicle emissions, petrochemical industry and combustion were essential volatile organic compounds sources in 13 cities. Moreover, the sensitivity of ozone production was studied using an Empirical Kinetic Modeling Approach (EKMA) model, and it was found that ozone formation was volatile organic compounds limited in all 13 cities.
Highlights
• VOCs showed significant temporal and spatial variations in 13 cities.
• VOCs were mainly composed of alkanes, halogenated hydrocarbons, aromatics and OVOCs in all 13 cities.
• Aromatics and OVOCs contribute the most to the OFP.
• Solvent usage, gasoline evaporation, vehicle emissions, petrochemical industry and combustion were essential VOC sources in 13 cities.
• Ozone formation was VOCs-limited in all 13 cities.
1 Introduction
After the declaration of Ambient Air Quality Standards (Ministry of Environmental Protection of the People’s Republic of China, 2012) in 2012 and the implementation of the Air Pollution Prevention and Control Action Plan (https://www.mee.gov.cn/zcwj/gwywj/201811/t20181129_676555.shtml) in 2013, pollution of PM10 and PM2.5 have been efficiently controlled. The average annual concentrations in all regions of China demonstrated a significant downward trend (e.g., Ni and Zhu, 2021; Song et al., 2021; Fu et al., 2022; Yu et al., 2022). In contrast, in the last decades, ozone (O3) concentration keep up the upward trend, and ozone has become a priority pollutant, particularly in summer and autumn in China (e.g., Zhang et al., 2021; Jia et al., 2022; Lin and Guo, 2022). As essential precursors for both ozone and fine particulate matter, the increasing emission of Volatile Organic Compounds (VOCs) was inferred as one of the main causes of high ozone pollution in China (e.g., Yang et al., 2016). Therefore, studying the variations, concentrations, sources of VOCs, and their impact on ozone formation is of great importance.
In China, there are many researches on atmospheric volatile organic compounds in various urban areas. For example, Ding and Jing (2016) monitored 52 kinds of VOCs during summer and the main components of VOCs in Tangshan City were alkanes and aromatic hydrocarbons, alkenes were the most sensitive components of ozone formation potential (OFP) of VOCs. Xu et al. (2020) conducted online monitoring of VOCs in urban Chengdu from June to September 2019. The monitoring results showed that alkanes and halogenated hydrocarbons were the main components of VOCs. Aromatics contributed most to total OFP (42.7%), followed by alkenes (27.4%). Zhao et al. (2021) analyzed the pollution characteristics of atmospheric VOCs in summer and autumn in Liaocheng City. The component content was alkanes > alkynes > aromatics, and the influence of OFP was aromatics > alkynes > alkanes; In particular, toluene had the highest OFP contribution rate. In a similar research, conducted in 2019, Deng et al. (2021) carried out online monitoring of 56 kinds of VOCs in Shishan Town, Foshan City, and the main components of VOCs were alkanes (56.5%) and aromatics (30.1%), and O3 generation was in the VOCs control area. Aromatics contributed the most to the total OFP (54.6%). Qi et al. (2022) found that the atmospheric VOCs pollution in Zhengzhou during the summer of 2019 and 2020 was dominated by alkanes, aromatics and alkenes, and the total OFP of VOCs were 224.9 and 243.6 μg/m3, respectively. Another study by Su et al. (2022) assessed the characteristics, compositions, OFP, sources, and health risks of 57 kinds of VOCs during summer 2019 in Taizhou. The result showed that alkanes accounted for the largest proportion of VOCs, and the compound contributing largest (5.5 μg/m3) to total OFP was ethylene. In general, the composition of VOCs pollutants in China mainly comes from alkanes, aromatics and alkenes, and they are also the main OFP substances. However, most of the research focused on an individual city, while the studies of VOCs on city clusters were limited.
Due to the distribution of China’s industrial structure, the north is dominated by heavy industries, while the south is dominated by light industries. Northern China cities suffered from severe air pollution. The average annual mass concentrations of air pollutants were about 4.95%–32.74% higher than those in southern China (e.g., Dong et al., 2020). Particularly, the Beijing-Tianjin-Hebei area (BTH), one of the most air-polluted regions in China, has also been threatened by high ozone pollution in the summertime (e.g., Li, 2018; Lu et al., 2020; http://www.huanjing100.com/p-11368.html).
In order to study the VOCs pollution in Northern China, 13 urban points were set up in the BTH region and Fenwei Plain, including Baoding, Xingtai, Langfang, Tangshan, Anyang, Xinxiang, Jiaozuo, Luoyang, Hebi, Jincheng, Linfen, Yuncheng and Xi’an. The sites span four provinces and basically cover the key industrial cities in the BTH region and Fenwei Plain. We monitored atmospheric concentrations of 117 VOCs, including aldehydes and ketones, halogenated hydrocarbons, alkanes, aromatics, alkenes, OVOCs, alkyne and organic sulfur. Then, the variations, compositions, photochemical properties and sources of VOCs in 13 cities were analyzed. Moreover, the sensitivity of ozone production was analyzed using the EKMA model. This study comprehensively analyzed the characteristics of VOCs pollution in the BTH region, which is of great significance to the development of ozone pollution control strategies in China.
2 Experiments and methods
2.1 Sampling
Ambient air samples were collected in 13 cities from 1 April to 30 September 2020. The locations of 13 sites were illustrated in Figure 1.
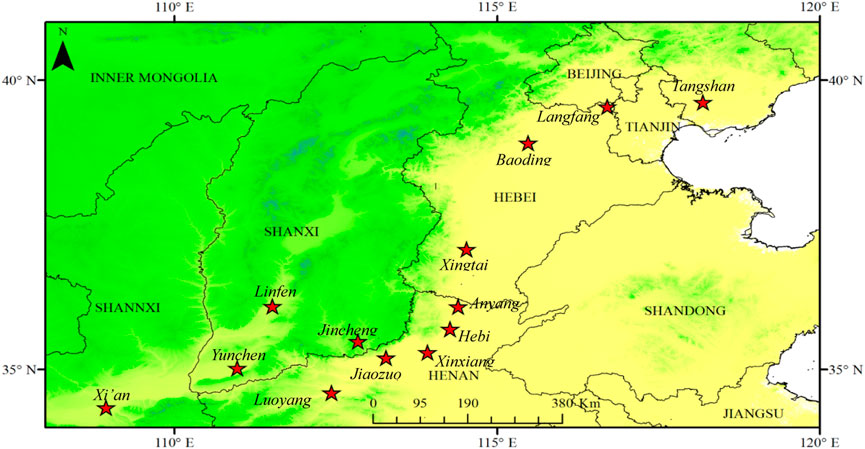
FIGURE 1. The locations of sampling sites in 13 cities.
117 kinds of VOCs collected were list in Supplementary Table S1. According to the standard method HJ 683-2014(Ministry of Environmental Protection of the People’s Republic of China, 2014), 13 aldehydes and ketones were collected with an air sampler (KC-6D, Qingdao Laoshan Electronic Instrument Factory Co. Ltd., China) through cartridges coated with acidified 2,4-Dinitrophenylhydrazine (DNPH) (TupLabs, China) at a flow rate of .5 L/min. A denuder filled with potassium iodide (KI) was connected to the upstream of the cartridge to eliminate ozone interference. The sampling was from 12:00 p.m. to 15:00 p.m.
The other 104 VOCs were collected for 24 h sample with 3.2 L stainless steel canisters (ENTECH, United States) by connecting to a 24 h constant flow controller, according to the standard method HJ 759-2015 (Ministry of Environmental Protection of the People’s Republic of China, 2015).
After sampling, cartridges and canisters were re-sealed and taken to the analysis laboratory. The cartridges were analyzed within 1 week, and the canisters were analyzed in 2 weeks.
2.2 Analysis
Cartridges were analyzed using high-performance liquid chromatography (HPLC) system according to the standard method (HJ 683-2014). 13 aldehydes and ketones were eluted from cartridges with acetonitrile, and analyzed using an HPLC system (Ultimate 3000, Thermo Fisher Scientific Inc., United States). An external standard method with correlation coefficient of calibration curve ≥.995 was used for quantitation. For each batch of samples 10% parallel samples were added and the relative deviation of ≤25% between samples and parallel samples was required.
Detailed analytical method for the other 104 VOCs are reported in the previous study (e.g., Zhang et al., 2019). Briefly, 104 VOCs collected in canisters were quantified by a double column multi dean switching QP2010 Ultra Gas chromatography-Mass spectrometry system (Shimadzu, Japan) coupled with sorbent assisted electronically controlled cryo-focusing unit (CIA-Kori-UNITY, MARKES, United Kingdom). Ethane, ethylene, acetylene, propane, and propylene were measured by flame ionization detector (FID) with external standard method. And mass spectrometry (MS) was used to quantify the other 99 VOCs with an internal standard method. The correlation coefficient of calibration curve ≥.990, and the peak area of internal standard varied below 40%. 10% replicates were added in each sample batch. The duplicate samples showed the bias was less than 30%.
Concentrations of trace gases (such as NOX, O3 and CO) were monitored by the national ambient air urban monitoring stations in 13 cities and could be obtained from the China National Environmental Monitoring Centre (http://www.cnemc.cn/). Meteorological data could be obtained from the China Meteorological Data Service Centre (http://data.cma.cn).
2.3 OFP calculation
OFP has been widely used to evaluate the relative ozone-forming capability of VOCs (e.g., Zou et al., 2017). OFP of each VOCs could be calculated using the following equation:
Where MIRi represents the maximum incremental reactivity (e.g., Cater, 2010), and [VOC]i is the mass concentration of the VOC species i. Halogenated hydrocarbons in the atmosphere have little effect on ozone formation, so they are usually neglected in the calculation of OFP.
2.4 Source apportionment
VOCs sources are critical to develop control measures for VOCs emission. Ratios of different species of VOCs have been applied to roughly identify sources of VOCs (e.g., Barletta B. et al., 2005; Zhang et al., 2013). However, ratios of different species could only be used to identify a few certain sources and could not provide quantitative contribution of different sources. In this case, receptor models have been applied to identify and quantify VOCs sources, such as principal component analysis (PCA) (e.g., Wang et al., 2019), chemical mass balance (CMB) model (e.g., Liu et al., 2008a) and PMF model (e.g., Zhang et al., 2013). Considering the usage of CMB requires well-known profiles of emission sources, which are hard to obtain in most cases, PMF model has been extensively applied for source apportionment of VOCs in different cities or regions of China, such as Shanghai (e.g., Lin et al., 2019), Guangzhou (e.g., Zhang et al., 2013), Chengdu (e.g., Xu et al., 2020), Zhengzhou (e.g., Qi et al., 2022), Nanjing (e.g., Fan et al., 2021), and Chongqing (e.g., Li et al., 2018). In most of the studies, 19–34 species were selected for PMF analysis, and solutions with 4–8 factors were recognized as the optimum results. Solvent usage, vehicle exhaust, petrochemical industry, LPG/LNG leakage, industrial processes and biogenic emission were frequently identified as main sources of VOCs, although the source profiles of these sources varied among different cities.
The PMF model developed by EPA was a powerful tool to resolve and quantify VOC emission sources. The detailed description of PMF model could be found elsewhere (e.g., Paatero and Tapper, 1994; Paatero, 1997). The study applied PMF 5.0 with a multiple linear engine version 2 (ME-2) to analyze the VOCs sources in 13 cities simultaneously. In order to minimize the uncertainty induced by chemical losses of various VOCs, species with high concentrations or long lifetime were selected preferentially as input for PMF analysis. However, tracers of emission sources were also served as PMF input in order to identify the resolved factor. Accordingly, 21 species (ethylene, acetylene, ethane, propylene, propane, isobutane, n-butane, cis-2-butene, trans-2-butene, isopentane, n-pentane, 2-methylpentane, 3-methylpentane, n-hexane, benzene, n-heptane, toluene, m/p-xylene, ethylbenzene, styrene and o-xylene) in 13 cities were input into the PMF model simultaneously. The PMF solutions were calculated with 3-6 factors, and a solution with five factors were recognized as the most optimum result.
2.5 EKMA model
In urban atmosphere, ozone is formed through photochemical reactions of VOCs and nitrogen oxides (NOx). In order to provide information for development of ozone control strategies, it is essential to study the sensitivity of ozone formation with VOCs and NOX. Several methods have been applied to investigate the ozone-VOCs-NOX sensitivity in different studies, such as VOCs/NOX (e.g., Sillman and He, 2001), HCNO/NO2 (e.g., Li et al., 2021), air quality model and observation-based model (OBM) (e.g., Lin et al., 2020; Fan et al., 2021). However, the methods such as VOCs/NOX and HCNO/NO2 highly simplified the relationship of ozone and its precursors and were only used to preliminarily estimate the ozone formation sensitivity. Ozone formation sensitivity analysis with air quality model requires emission inventories, which could induce large uncertainties and bias to the analysis result. In OBM, the relative incremental reactivity (RIR) could be calculated, which is useful and quantitative parameter to describe the influence of VOCs/NOx to ozone formation. Besides, an isopleth diagram for ozone net production potential could be plotted based on OBM, namely, Empirical Kinetic Modeling Approach (EKMA), which is intuitive to identity whether ozone formation is VOCs or NOX limited (e.g., Jiang et al., 2018; Fan et al., 2021).
Observation-based model (OBM) and Empirical Kinetic Modeling Approach (EKMA) is widely used to evaluate the relationship between ozone and its precursors by conducting a series of scene simulation experiments (e.g., Santos et al., 2021). Detailed introduction of OBM could be found elsewhere (e.g., Cardelino and Chameides, 1995). In this study, the EKMA isopleth diagrams were obtained with an OBM coupled with a Master Chemical Mechanism (MCMv3.3.1) (e.g., Sauders et al., 2003; Rickard et al., 2015). Decreased or increased concentrations of VOCs and NOx were applied as the model input. At the same time, the averaged photolysis frequencies, temperature, pressure, and the averaged daytime values of other trace gases (i.e., SO2, CO, and NOx) were used as constraints. The campaign averaged NOx, and VOCs speciation was selected as the base case. The ozone production rate was calculated along with scaling the concentration of NOx and VOCs from 10% to 300% compared with their base values. By interpolating the results, a smooth contour diagram was obtained, showing the relationship between the daily maximum ozone production rate and relative changes of in NOx and VOCs.
3 Results and discussion
3.1 Temporal and spatial variations of total VOCs
The total volatile organic compounds (TVOCs) were obtained by total concentrations of all 117 VOCs to characterize the pollution degree of VOCs in different cities. Figure 2 shows the variations of daily TVOCs in 13 cities during the whole sampling period.
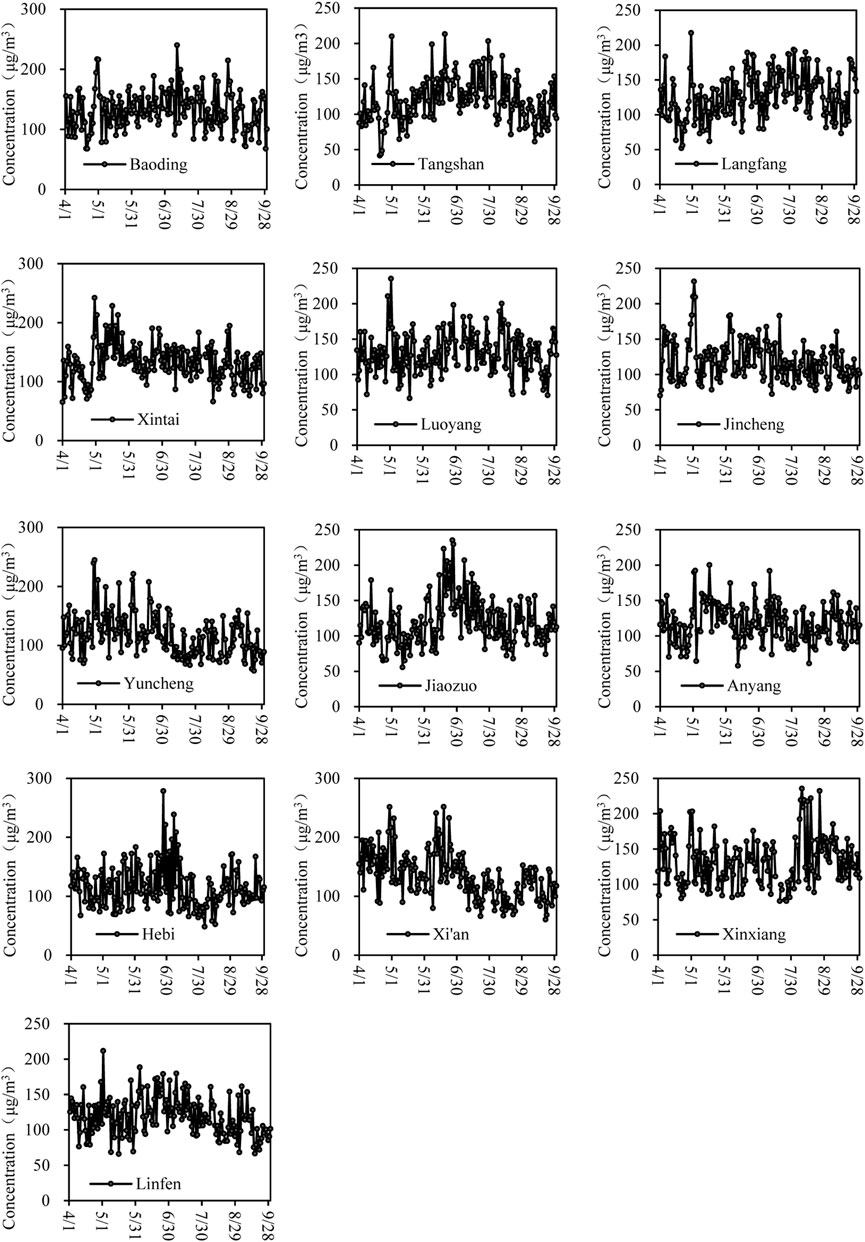
FIGURE 2. Daily variations of TVOC in 13 cities.
The result demonstrated the significant daily variation of TVOCs concentration in all 13 cities. The highest TVOCs concentration (279 μg/m3) was found on June 27 in Hebi city, while the lowest TVOCs concentration (42 μg/m3) was observed on 20 April in Tangshan city. Notably, higher spikes in TVOCs concentration (TVOCs>200 μg/m3) were occasionally found in each city. The TVOCs concentration approximately increased from April to June or July, then decreased. However, the temporal trend of TVOCs varied among different cities. The highest monthly average TVOCs concentration was possibly found in June and July, when the high temperature could bring high VOC emissions from certain sources, such as solvent usage. However, for Xingtai and Anyang, the monthly average TVOCs concentration was highest in May. In Langfang and Xinxiang, VOCs pollution was most severe in August. In Xi’an, the monthly average TVOCs concentration reached 166 μg/m3 in April, higher than any other month. In most cities, the lowest monthly average TVOCs concentration could be noticed in April, May, August, and September, except in Yuncheng, where the monthly average TVOCs concentration was lowest in July. The different pattern of VOC temporal variation can be partly attributed to geographical locations and meteorological factors. Except for Xi’an, Yuncheng, Jincheng and Linfen, the other nine cities are scattered in North China Plain, where air pollutants are easy to transport and become even among cities, but the four cities mentioned above are surrounded by mountains such as Taihang, Lvliang and Qinling Mountain, which is not good for atmospheric diffusion.
Xi’an suffered the most severe VOCs pollution during the whole sampling period compared to the other 12 cities. The average concentration of TVOCs over the entire sampling period was lowest in Hebi. From April to September, the most VOCs polluted city in each month was Xi’an, Xingtai, Baoding, Luoyang, Xinxiang, and Langfang. In contrast, the lowest monthly average concentration of TVOCs was found in Hebi, Anyang, Jiaozuo, Jincheng, Yuncheng, Linfen and Tangshan. The VOCs pollution level may correlate to the city’s size of economy or industrial emissions, among 13 cities Xi’an ranks 1 in terms of Gross Domestic Product (GDP) of RMB 1,069 billion, while Hebi ranks last with GDP of RMB 106.5 billion in 2021 (National Bureau of Statics, 2022, 2022-02).
The results showed that TVOCs showed significant temporal and spatial variations in 13 cities during the sampling period. The abundances of VOCs in atmosphere could be influenced by many crucial factors, such as temperature, wind speed, photochemical reaction, and differences in local emission sources. Thus, continuous monitoring is needed in each city to further study the reasons causing the temporal and spatial variations of VOCs.
3.2 Compositions of VOCs
Concentrations of different VOCs groups in each city are listed in Table 1. In this study, the monitored 117 VOCs in 13 cities in the BTH region were divided into alkanes, alkenes, alkynes, aromatics, OVOCs, halogenated hydrocarbons, and organic sulfur by species, Their concentrations in the 13 cities were 26.0 ± 10.1–41.3 ± 12.9, 3.33 ± 1.66–6.52 ± 2.26, .57 ± .36–1.29 ± .72, 17.8 ± 10.6–38.3 ± 15.9, 22.0 ± 7.75–36.2 ± 13.1, 25.0 ± 4.77–36.5 ± 8.21, and 1.40 ± 1.36–2.74 ± 2.43 μg/m3, respectively.

TABLE 1. Concentrations of different VOCs species in 13 cities and other cities of China (µg/m3).
Compared with the VOCs studies in other areas of China, most of which monitored about 50 species of VOCs, this study monitored more species simultaneously, and this could explain the higher TVOC in this study. Alkanes in 13 cities were lower than Handan, comparable to Chengdu, Zhengzhou, and higher Beijing and Tianjin. Alkanes, alkenes and alkynes in 13 cities were close to the other cities in China. However, it is worth noting that the total concentrations of aromatics in 13 cities were higher than most of the other studies. The 13 cities monitored in this study have developed industries and dense population, and the higher concentration of aromatics might be a result of larger local emission. Considering aromatics are toxic and harmful substances, more monitoring research focusing on aromatics should be carried out in the future.
Figure 3 shows the percentages of measured VOCs groups to the TVOCs. The results show that alkanes, halogenated hydrocarbons, aromatics and OVOCs were the main groups of VOCs. Alkanes contributed 21.7%–32.6% to the TVOCs, mainly including ethane, propane, isopentane, etc. During the entire sampling period, concentrations of alkanes were highest in Langfang, Tangshan, Xi’an and Yuncheng. Alkanes also exhibited the second-highest concentration in the other six cities. Halogenated hydrocarbons accounted for 21.0%–27.9% of TVOCs in 13 cities, mainly including chloromethane, dichloromethane, difluorodichloromethane, etc. They were the main VOCs in Baoding, Xingtai, Anyang, Jiaozuo, Hebi and Jincheng. Aromatics accounted for 13.5%–29.3% of TVOCs, mainly including toluene, m/p-xylene, etc., which was the largest group in Luoyang and Linfen. OVOCs, accounted for 18.1%–27.4% of TVOCs in 13 cities. The main components of OVOCs include formaldehyde, acetone, acetaldehyde, isopropyl alcohol, etc. OVOCs was the dominant group in Xinxiang and was the second highest group in Anyang.

FIGURE 3. Contributions of different VOCs groups to TVOC from April to September 2020.
The contributions of alkenes to TVOCs were much lower than OVOCs, alkanes, aromatics, and halogenated hydrocarbons, which could be attributed to their high reactivities in the atmosphere. During the whole sampling period, alkenes contributed less than 5.5% to TVOCs in all 13 cities. Alkyne accounted for less than 1.2% in 13 cities. Organic sulfur accounted for 2.3% of the TVOCs in Jiaozuo and Hebi. In other cities, contributions of organic sulfur to TVOCs were less than 2%.
The top 10 VOC species were listed in Supplementary Table S2, which accounted for over 50% of TVOC in all 13 cities. Ethane, isopentane, chloromethane, toluene, ethylbenzene, m/p-xylene, formaldehyde and acetone were most abundant in all 13 cities.
3.3 OFP of VOCs
During the entire sampling period, the total OFP of Luoyang, Baoding, Linfen, Xingtai, Xi’an, Anyang, Xinxiang, Tangshan, Yuncheng, Langfang, Jincheng, Hebi and Jiaozuo were 384, 346, 342, 340, 326, 319, 316, 315, 310, 299, 292, 277, and 269 μg/m3, arranged in descending order. The contributions of different VOCs groups to the total OFP in each city are listed in Table 2.
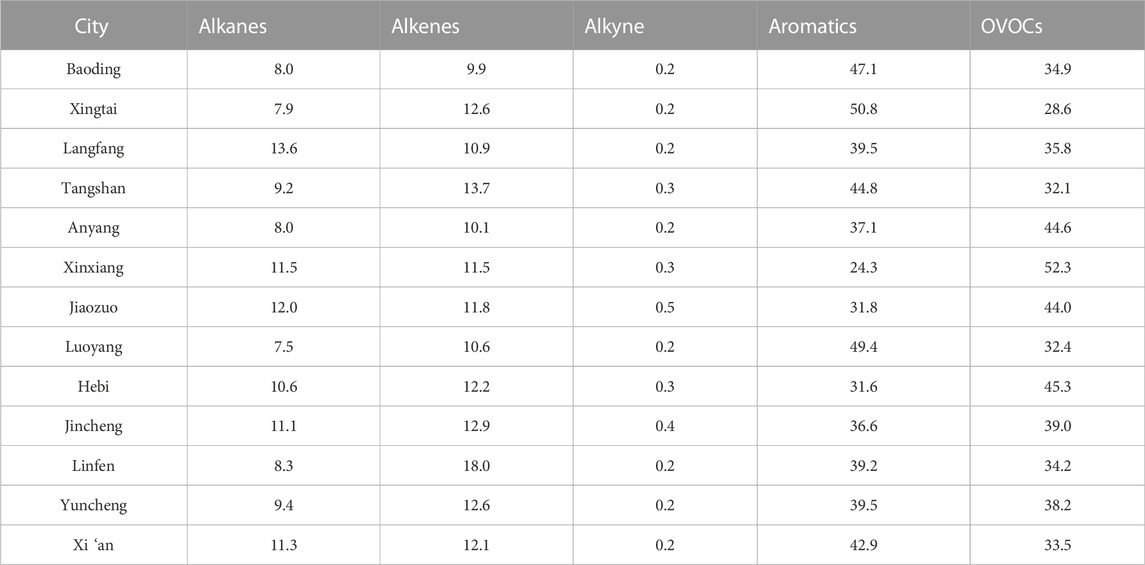
TABLE 2. Contributions of different VOCs groups to total OFP during the whole sampling period (%).
Aromatics and OVOCs contributed majorly to total OFP. Aromatics accounted for 24.3%–50.8% of total OFP in 13 cities. Aromatics contributed highest to total OFP in Baoding, Xingtai, Langfang, Tangshan, Luoyang, Linfen, Yuncheng, and Xi’an and demonstrated the second-highest contribution to total OFP in Anyang, Xinxiang, Jiaozuo, Hebi and Jincheng. OVOCs accounted for 28.6%–52.3% of the total OFP in 13 cities, and made largest contribution in Anyang, Xinxiang, Jiaozuo, Hebi and Jincheng . Alkenes, with relatively strong reactivities in the atmosphere, contributed 9.9%–18.0% to total OFP in 13 cities. A slightly lower contributions to total OFP was demonstrated by alkanes, which were 7.5%–13.6% in different cities. In most cities, the contribution of alkanes to total OFP was lower than aromatics, OVOCs and alkenes. Notably, alkyne contributed less than .5% to the total OFP in all 13 cities.
The top 10 species that contributed most to the total OFP in 13 cities are listed in Supplementary Table S3. Formaldehyde, acetaldehyde, m/p-xylene, o-xylene, and toluene were probably key species for ozone formation in all 13 cities. The top 10 species accounted for about 80% of the total OFP in all 13 cities, which should be given priority over all other VOCs in the control of VOC emissions and O3 pollution.
3.4 Source apportionment
The profiles of five resolved factors are shown in Figure 4.
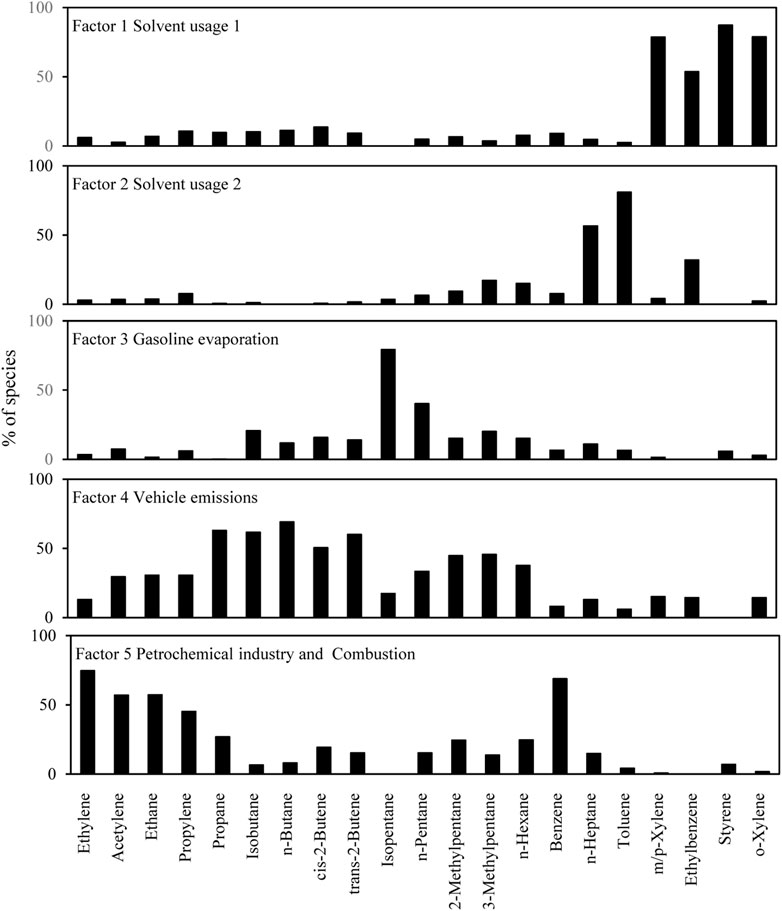
FIGURE 4. Profiles of factors resolved by PMF model for 13 cities.
Factor 1 was characterized by high levels of m/p-xylene, o-xylene, ethylbenzene and styrene, which are predominantly emitted from solvent usage (e.g., Liu et al., 2008b; Cai et al., 2010; Wang et al., 2013). Therefore factor 1 was assigned to solvent usage.
Factor 2 was distinguished by high loading of toluene, n-heptane, and moderate loading of ethylbenzene. Toluene and ethylbenzene are associated with several sources, such as vehicle emissions (e.g., Wang et al., 2018) and solvent usage (e.g., Wang et al., 2013). N-heptane is one of the main components of gasoline and widely used as solvent in industries (e.g., He et al., 2002; Chan et al., 2006). Considering the lack of markers of combustion (such as acetylene) (e.g., Barletta M. et al., 2005) and gasoline evaporation (isopentane and n-pentane) (e.g., Wang et al., 2013; Zheng et al., 2018) in this factor, factor 2 was more likely to be a profile for solvent usage in industries.
Factor 3 was rich in isopentane and n-pentane, which are markers of gasoline evaporation (e.g., Cai and Xie, 2009). 11.7%–20.6% of isobutane, n-butane, 2-methylpentane and 3-methylpentane were also found in factor 3, which were all associated with vehicle emission (e.g., Araizaga et al., 2013; Cheng et al., 2017). Therefore factor 3 was recognized as gasoline evaporation.
Factor 4 explained high abundances of vehicle emission markers, such as, cis-2-butene, trans-2-butene, 2-methylpentane and 3-methylpentane (e.g., Sigsby et al., 1987; Jorquera and Rappenglück, 2004; Araizaga et al., 2013). Meanwhile, factor 4 was also characterized by isobutane, n-butane, isopentane and n-pentane, which are main components of gasoline (e.g., Araizaga et al., 2013; Cheng et al., 2017). Consequently, we identified factor 4 as vehicle emissions.
High percentages of propylene, propane, and ethane were found in factor 5, which were the most abundant species in the petrochemical plant (e.g., Mo et al., 2015). Besides, 68.8% of benzene was also observed in factor 5, which was also an important specie emitted from petroleum refining (e.g., Rao et al., 2007). However, 57.1% of acetylene, a combustion marker, was also found in factor 5 (e.g., Barletta B. et al., 2005). Coal was one of the most common fuels used in China, especially in North China Plain, and it was suggested that coal burning was possibly the main combustion sources of VOCs. It was also found that acetylene, ethene were associated with biomass burning (e.g., Andreae and Merlet, 2001). Therefore factor 5 was recognized as a mixed source of petrochemical industry and combustion.
The relative contributions of each source to total selected VOCs as input of PMF analysis were listed in Table 3. For most cities solvent use (solvent use 1 and solvent use 2) accounted for the largest proportion of total selected VOCs. In Luoyang, one of the oldest industrial bases and new industrialized city of China, the contribution of solvent use to total selected VOCs exceed 50%. Sources related to traffic (gasoline evaporation and vehicle emissions) contributed 25.0%–56.2% to total selected VOCs, indicating the significant influence of traffic to urban atmosphere. In Langfang the contribution of vehicle emissions to total selected VOCs was higher than 50%. Samples of Langfang were collected in Hebei University of Technology, which was located next to a highway between Tianjin and Xiong’an, So the site was likely to be mainly influenced by the highway traffic. Petrochemical industry and combustion accounted for 11.7%–33.7% of total selected VOCs. Compared with other cities, contribution of petrochemical industry and combustion to total selected VOCs was highest in Linfen, which was a heavy industrial city based on coal resource. The PMF results provide preliminary analysis of VOCs sources in 13 cities. However, it should be noted that source profiles in reality might be varied among different cities, and uncertainties could be induced to the PMF result performed for 13 cities simultaneously.

TABLE 3. Contributions of different sources to total selected VOCs in 13 cities.
3.5 Analysis of VOCs/NOx limitation for ozone formation
The EKMA model has been widely used as a powerful tool to study ozone formation sensitivities to NOx and VOCs (e.g., Santos et al., 2021). Isopleth diagrams of ozone formation (EKMA curve) constructed by the OBM model for 13 cities are illustrated in Figure 5. The ridge line (black line) in each graph was given by OBM model and was calculated from the maxima of each isopleth line. The red dot represented the measured values of VOCs and NOX. With the ridge line each diagram is divided into two regions. In the top left region, the isopleths were oriented vertically, and ozone formation was relatively more sensitive to VOCs, meaning that a change in VOCs concentration could lead to a significant increase or decrease in ozone concentration. In contrast, ozone formation is NOx-limited in the lower right region. It was observed that for all 13 cities, the red dots were always located in the VOCs-limited region, indicating the reduction of VOCs in 13 cities was efficient to control ozone pollution. The VOCs/NOx ratio of the ridge line represents the optimal emission reduction ratio of VOCs and NOx to most efficiently control ozone pollution. The VOCs/NOx ratios of the ridge line were 9:1, 11:1, 5:1, 10:1, 8:1, 8:1, 8:1, 7:1, 10:1, 11:1, 7:1, 9:1 and 7:1 for Baoding, Langfang, Tangshan, Xingtai, Anyang, Hebi, Luoyang, Xinxiang, Jiaozuo, Jincheng, Linfen, Yuncheng and Xi’an, respectively. Cities with high ridge line VOCs/NOX ratios should take more strict control strategies of VOCs to improve ozone pollution.
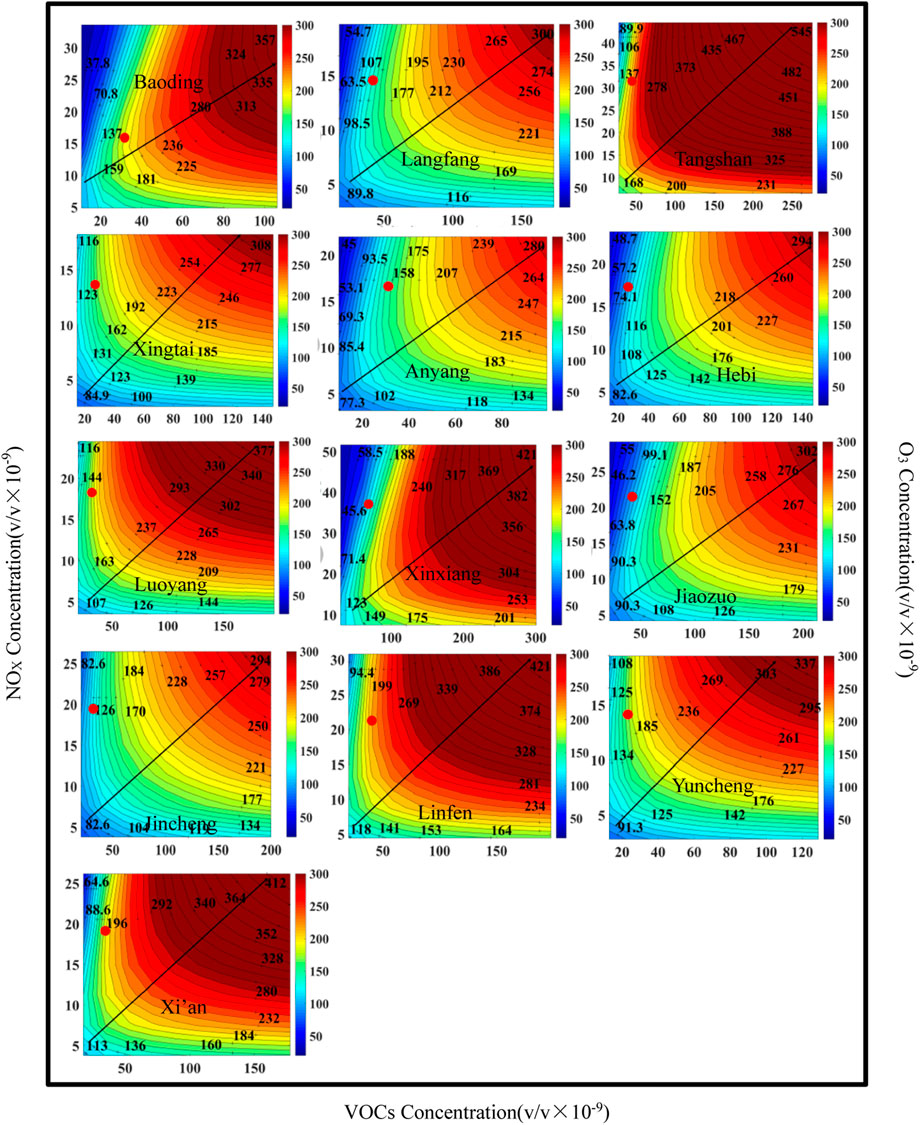
FIGURE 5. Isopleth diagram of ozone formation for 13 cities.
It was found that ozone formation in urban atmosphere was widely VOCs-limited in BTH regions, Yangtze River Delta (YRD), Pearl River Delta (PRD), and Sichuan Basin (SCB) (e.g., Jiang et al., 2018; Fan et al., 2021), which were consistent with 13 cities in this study. However, it was also found the sensitivity of ozone formation in urban atmosphere varied with time and might be NOX-limited in certain pollution episodes (e.g., Zheng et al., 2022). Ozone sensitivity analysis based on long-term and online measurement should be carried out to provide a scientific basis for developing refined ozone control policies.
4 Conclusion
Ambient air samples were collected in 13 cities from 1 April to 30 September 2020, and were analyzed for 117 kinds of VOCs. The concentrations of total VOCs in 13 cities showed significant temporal and spatial variations. In particular, alkanes, halogenated hydrocarbons, aromatics and OVOCs were the dominant groups of VOCs in 13 cities, which accounted for 21.7%–32.6%, 21.0%–27.9%, 13.5%–29.3% and 18.1%–27.4% of TVOCs, respectively. Aromatics, OVOCs, alkenes, alkanes, and alkyne contributed 24.3%–50.8%, 28.6%–52.3%, 9.9%–18.0%, 7.5%–13.6% and .2%–.5% to total OFP in 13 cities, respectively. Notably, formaldehyde, acetaldehyde, m/p-xylene, o-xylene, and toluene were the main ozone formation species. The results of the PMF model indicated that solvent usage, gasoline evaporation, vehicle emission, petrochemical industry and combustion were key sources of VOCs for 13 cities. Furthermore, ozone formation sensitivities to NOx and VOCs were studied using the EKMA model, which demonstrated that ozone formation in all 13 cities was limited by VOCs, indicating the importance of emission reduction of VOCs for ozone pollution control.
Data availability statement
The original contributions presented in the study are included in the article/Supplementary Material, further inquiries can be directed to the corresponding author.
Author contributions
DS and ZD contributed equally to this work and should be considered as co-first authors; SL is correspondence author. SL and TZ designed the research. GC and KT performed the sampling, DS, XZ and ZY performed the experiments. ZL contributes analysis on EKMA model. DS and ZD analyzed the VOCs result and wrote the manuscript. SL reviewed and edited the manuscript. All authors have read and agreed to the published version of the manuscript.
Funding
This work was supported by the National Key Research and Development Program of China (2018YFC1315104) and Science and Technology Development Fund of Sino-Japan Friendship Center for Environment Protection (ZRZXJJ-202110).
Conflict of interest
The authors declare that the research was conducted in the absence of any commercial or financial relationships that could be construed as a potential conflict of interest.
Publisher’s note
All claims expressed in this article are solely those of the authors and do not necessarily represent those of their affiliated organizations, or those of the publisher, the editors and the reviewers. Any product that may be evaluated in this article, or claim that may be made by its manufacturer, is not guaranteed or endorsed by the publisher.
Supplementary material
The Supplementary Material for this article can be found online at: https://www.frontiersin.org/articles/10.3389/fenvs.2022.1084592/full#supplementary-material
References
Andreae, M. O., and Merlet, P. (2001). Emission of trace gases and aerosols from biomass burning. Glob. Biogeochem. Cycles 15 (4), 955–966. doi:10.1029/2000GB001382
Araizaga, A. E., Mancilla, Y., and Mendoza, A. (2013). Volatile organic compound emissions from light-duty vehicles in monterrey, Mexico: A tunnel study. Int. J. Environ.Res. 7 (2), 277–292.
Barletta, B., Meinardi, S., Sherwood Rowland, F., Chan, C., Wang, X., Zou, S., et al. (2005). Volatile organic compounds in 43 Chinese cities. Atmos. Environ. 39, 5979–5990. doi:10.1016/j.atmosenv.2005.06.029
Barletta, M., Barletta-Bergan, A., Saint-Paul, U., and Hubold, G. (2005). The role of salinity in structuring the fish assemblages in a tropical estuary. J. Fish. Biol. 66 (1), 45–72. doi:10.1111/j.0022-1112.2005.00582.x
Cai, C. J., Geng, F. H., Tie, X. X., Yu, Q., and An, J. L. (2010). Characteristics and source apportionment of VOCs measured in Shanghai, China. China. Atmos. Environ. 44 (38), 5005–5014. doi:10.1016/j.atmosenv.2010.07.059
Cai, H., and Xie, S. D. (2009). Tempo-spatial variation of emission inventories of speciated volatile organic compounds from on-road vehicles in China. Atmos. Chem. Phys. 9 (18), 6983–7002. doi:10.5194/acp-9-6983-2009
Cardelino, C. A., and Chameides, W. L. (1995). An observation-based model for analyzing ozone precursor relationships in the urban atmosphere. J. Air Waste Manag. Assoc. 45 (3), 161–180. doi:10.1080/10473289.1995.10467356
Cater, W. P. L. (2010). Updated maximum incremental reactivity scale and hydrocarbon bin reactivities for regulatory applications. (Revised January 28, 2010).
Chan, L. Y., Chu, K. W., Zou, S. C., Chan, C. Y., Wang, X. M., Barletta, B., et al. (2006). Characteristics of nonmethane hydrocarbons (NMHCs) in industrial, industrial-urban, and industrial-suburban atmospheres of the Pearl River Delta (PRD) region of south China. J. Geophys. Res. Atmos. 111 (D11), D11304. doi:10.1029/2005JD006481
Chang, Y. X., Li, F. X., and Chen, X. (2022). Pollution characteristics and sources of aldehydes and ketones in winter and summer in taiyuan. Environ. Monit. China 38 (2), 37–45. doi:10.19316/j.issn.1002-6002.2022.02.05
Cheng, T. T., Chen, J., Wu, K., Liu, J. G., Lu, S. H., and Hu, S. C. (2017). Analysis and countermeasure of VOCs source in automobile production process in China. 11th Int. Sci. Pract. Conf. Environ. Technol. Resour. 3, 27–30. doi:10.17770/etr2017vol3.2602
Deng, S. X., Liu, Y. L., Situ, S. P., Jiao, L., Chang, M., Xie, M., et al. (2021). Characteristics s and source apportionment of volatile organic compounds in an industrial town of Pearl River Delta. China Environ. Sci. 41 (7), 2993–3003. doi:10.19674/j.cnki.issn1000-6923.20210326.007
Ding, J. R., and Jing, C. Y. (2016). Pollution characteristics and Ozone Formation potential of VOCs in summer in tangshan. Environ. Eng. 34 (06), 130–135. doi:10.13205/j.hjgc.201606027
Dong, J. D., Chen, X. L., Cai, X. B., Xu, Q. Q., Guan, Y. T., Li, T. H., et al. (2020). Analysis of the temporal and spatial variation of atmospheric quality from 2015 to 2019 based on China atmospheric environment monitoring station. J. Geo-information Sci. 22 (10), 1983–1995. doi:10.12082/dqxxkx.2020.200212
Fan, M. Y., Zhang, Y. L., Lin, Y. C., Li, L., Xie, F., Hu, J. L., et al. (2021). Source apportionments of atmospheric volatile organic compounds in Nanjing, China during high ozone pollution season. Chemos 263, 128025. doi:10.1016/j.chemosphere.2020.128025
Fu, C. B., Xu, W. S., Dan, L., and Tong, J. H. (2022). Characteristics of temporal and spatial distribution of atmospheric PM2.5 and PM10 in Hainan island, Hainan Province from 2015 to 2020. Environ. Chem. 42 (2), 1–10. doi:10.7524/j.issn.0254-6108.2021101901
He, J., Chen, H. X., Liu, X. X., Hu, J. H., Li, Q. L., and He, F. Q. (2002). The analysis of various volatile solvents used in different industries in Zhongshan (in Chinese). S. China J. Prev. Med. 28 (6), 26–27. doi:10.3969/j.issn.1671-5039.2002.06.009
Jia, Z. H., Gu, Y., Kong, C. L., Song, J. B., Meng, H., Shi, L. Y., et al. (2022). Chemical characteristics and source apportionment for VOCs during the ozone pollution episodes and non-ozone pollution periods in Qingdao. Environ. Sci., 1–15. doi:10.13227/j.hjkx.202205040
Jiang, M. Q., Lu, K. D., Su, R., Tan, Z. F., Wang, H. L., Li, L., et al. (2018). Ozone formation and key VOCs in typical Chinese city clusters. Chin. Sci. Bull. 63 (12), 1130–1141. doi:10.1360/N972017-01241
Jorquera, H., and Rappenglück, B. (2004). Receptor modeling of ambient VOC at Santiago, Chile. Atmos. Environ. 38 (25), 4243–4263. doi:10.1016/j.atmosenv.2004.04.030
Li, D. R., Wang, S. S., Xue, R. B., Zhu, J., Zhang, S. B., Sun, Z. B., et al. (2021). OMI-observed HCHO in Shanghai, China, during 2010-2019 and ozone sensitivity inferred by an improved HCHO/NO2 ratio. Atmos. Chem. Phys. 21 (20), 15447–15460. doi:10.5194/ACP-21-15447-2021
Li, J. L. (2018). Air pollution status and countermeasures in Beijing-Tianjin-Hebe. J. Handan Polytech. Coll. 31 (01), 54–56. doi:10.3969/j.issn.1009-5462.2018.01.015
Li, J., Zhai, C. Z., Yu, J. Y., Liu, R. L., Li, Y. Q., Zeng, L. M., et al. (2018). Spatiotemporal variations of ambient volatile organic compounds and their sources in Chongqing, a mountainous megacity in China. Sci. Total Environ. 627 (15), 1442–1452. doi:10.1016/j.scitotenv.2018.02.010
Lin, H. T., Wang, M., Duan, X. S., Fu, Q. Y., Hu, K., Cui, H., et al. (2020). O3 sensitivity and contributions of different NMHC sources in O3 formation at urban and suburban sites in Shanghai. Atmos 11 (3), 295. doi:10.3390/atmos11030295
Lin, W. P., and Guo, X. T. (2022). Spatial and temporal distribution characteristics of ozone in Urban agglomerations in China. China Environ. Sci. 42 (06), 2481–2494. doi:10.19674/j.cnki.issn1000-6923.20220207.002
Lin, Y. F., Duan, Y. S., Gao, Z. J., Lin, C. Q., Zhou, S. Y., Song, Z., et al. (2019). Typical ozone pollution process and source identification in Shanghai based on VOCs intense measuremen. Acta Sci. Circumstantia 39 (1), 126–133. doi:10.13671/j.hjkxxb.2018.0242
Liu, Y., Shao, M., Fu, L. L., Lu, S. H., Zeng, L. M., and Tang, D. G. (2008a). Source profiles of volatile organic compounds (VOCs) measured in China: Part I. Atmos. Environ. 42 (25), 6247–6260. doi:10.1016/j.atmosenv.2008.01.070
Liu, Y., Shao, M., Lu, S. H., Chang, C. C., Wang, J. L., and Fu, L. L. (2008b). Source apportionment of ambient volatile organic compounds in the Pearl River Delta, China: Part II. Atmos. Environ. 42 (25), 6261–6274. doi:10.1016/j.atmosenv.2008.02.027
Lu, X., Zhang, L., Wang, X. L., Gao, M., Li, K., Zhang, Y. Z., et al. (2020). Rapid increases in warm-season surface ozone and resulting health impact in China since 2013. Environ. Sci. Technol. Lett. 7 (4), 240–247. doi:10.1021/acs.estlett.0c00171
Ministry of Ecology and Environment of the People’s Republic of China (2020). 2019 report on the state of the ecology and environment in China. Article Number 106206. Available at: http://www.huanjing100.com/p-11368.html.
Ministry of Environmental Protection of the People’s Republic of China (2012). Ambient air quality standards (GB 3095-2012). Beijing: China Environmental Science Press.
Ministry of Environmental Protection of the People’s Republic of China (2014). Ambient air- Determination of aldehyde and ketone compounds-High performance liquid chromatography (HJ 683-2014). Beijing: China Environmental Science Press.
Ministry of Environmental Protection of the People’s Republic of China (2015). Ambient air- Determination of volatile organic compounds-collected by specially-prepared canistersand analyzed by gas chromatography/mass spectrometry (HJ 759-2015). Beijing: China Environmental Science Press.
Mo, Z. W., Shao, M., Lu, S. H., Qu, H., Zhou, M. Y., Sun, J., et al. (2015). Process-specific emission characteristics of volatile organic compounds (VOCs) from petrochemical facilities in the Yangtze River Delta, China. Sci. Total Environ. 533 (NOV.15), 422–431. doi:10.1016/j.scitotenv.2015.06.089
National Bureau of Statics (2022). China city statistical yearbook 2021. Beijing: China Statistics Press.
Ni, C. Q., and Zhu, H. Y. (2021). Analysis on the situation of air pollution of PM2.5 and PM10 in jinshan district, Shanghai from 2016 to 2020. Guangdong Chem. Ind. 48 (11), 131–132+136.
Paatero, P. (1997). Least squares formulation of robust non-negative factor analysis. Chemom. Intell. Lab. Syst. 37 (1), 23–35. doi:10.1016/S0169-7439(96)00044-5
Paatero, P., and Tapper, U. (1994). Positive matrix factorization: A non-negative factor model with optimal utilization of error estimates of data values. Environmetrics 5 (2), 111–126. doi:10.1002/env.3170050203
Qi, Y. J., Wang, L. L., Ni, J. W., He, H. Y., Zhao, D. X., and Gong, S. L. (2022). Characteristics and source apportionment of ambient summer volatile organic compounds in Zhengzhou, China. Environ. Sci. (08), 1–16. doi:10.13227/j.hjkx.202203084
Rao, P. S., Ansari, M. F., Gavane, A. G., Pandit, V. I., Nema, P., and Devotta, S. (2007). Seasonal variation of toxic benzene emissions in petroleum refinery. Environ. Monit. Assess. 128 (1-3), 323–328. doi:10.1007/S10661-006-9315-5
Rickard, A. R., Jenkin, M. E., and Young, J. C. (2015). The MCM v3.3.1 degradation scheme for isoprene. Atmos. Chem. Phys. 15 (20), 11433–11459. doi:10.5194/ACP-15-11433-2015
Santos, F. M., GómezLosada, Á., and Pires, J. C. M. (2021). Empirical ozone isopleths at urban and suburban sites through evolutionary procedure-based models. J. Hazard. Mat. 419, 126386. doi:10.1016/J.JHAZMAT.2021.126386
Sauders, S. M., Jenkin, M. E., Derwent, R. G., and Pilling, M. J. (2003). Protocol for the development of the master chemical mechanism, MCM v3 (Part A): Tropospheric degradation of non-aromatic volatile organic compounds. Atmos. Chem. Phys. 3 (1), 181–193. doi:10.5194/acpd-2-1847-2002
Sigsby, J. E., Tejada, S., Ray, W., Lang, J. M., and Duncan, J. W. (1987). Volatile organic compound emissions from 46 in-use passenger cars. Environ. Sci. Technol. 21 (5), 466–475. doi:10.1021/es00159a007
Sillman, S., and He, Y. D. (2001). Some theoretical results concerning O3-NOx-VOC chemistry and NOx-VOC indicators. J. Geophys. Res. Atmos. 107 (D22), 4659. doi:10.1029/2001JD001123
Song, M., Zhang, Z. J., Han, J., Zhang, Z. D., and He, R. R. (2021). Spatial and temporal distribution characteristics of PM2.5 and PM10 in Langfang, 2013-2019. Reg. Govenance (24), 33–34. doi:10.3969/j.issn.2096-4595.2021.24.014
State Council (2013). Air pollution prevention and control action plan. [2013] NO. 37 Available at: http://ishare.iask.sina.com.cn/f/61946883.html.
Su, W. P., Mao, H., Le, X. L., Zhang, Z. X., and Xu, L. (2022). Characteristics and health risk assessment of VOCs in summer in taizhou. Environ. Monit. Forewarning 14 (04), 78–83. doi:10.3969/j.issn.1674-6732.2022.04.014
Wang, H. L., Nie, L., Li, J., Wang, Y. F., Wang, G., Wang, J. H., et al. (2013). Characterization and assessment of volatile organic compounds (VOCs) emissions from typical industries. Chin. Sci. Bull. 58 (7), 724–730. doi:10.1007/s11434-012-5345-2
Wang, M., Xiang, P., Niu, Q. K., Pei, J. L., Liu, F. F., Yang, Y., et al. (2018). Characteristics and source apportionment of ambient VOCs during alternating period between winter and spring in Nanyang City, Henan Province. Acta Sci. Circumstantiae 38 (6), 2233–2241. doi:10.13671/j.hjkxxb.2018.0119
Wang, W. M., Gao, J. Y., Xiao, Z. M., Li, Y., Bi, W. K., Li, L. W., et al. (2021). Characteristics and sources of VOCs at different ozone concentration levels in Tianjin. Environ. Sci. 42 (8), 3585–3594. doi:10.13227/j.hjkx.202101129
Wang, Y., Wang, L. T., Yang, G., Lu, X. H., Ma, X., Wang, Q., et al. (2019). Characteristics of volatile organic compounds in autumn in handan city, China. Res Environ. Sci. 32 (7), 1134–1142. doi:10.13198/j.issn.1001-6929.2019.01.07
Xu, C. X., Chen, J. H., Jiang, T., Han, L., Wang, B., Li, Y. J., et al. (2020). Characteristics and sources of atmospheric volatile organic compounds pollution in summer in Chengdu. Environ. Sci. 41 (12), 5316–5324. doi:10.13227/j.hjkx.202006040
Yang, X. X., Tang, L. L., Zhang, Y. J., Mu, Y. F., Wang, M., Chen, W. T., et al. (2016). Correlation analysis between characteristics of VOCs and ozone formation potential in summer in Nanjing urban district. Environ. Sci. 37 (02), 443–451. doi:10.13227/j.hjkx.2016.02.006
Yu, Y. J., Dai, C., Wei, Y. G., Ren, H. M., and Zhou, J. W. (2022). Air pollution prevention and control action plan substantially reduced PM2.5 concentration in China. Energy Econ. 113, 106206. doi:10.1016/j.eneco.2022.106206
Zhang, L. H., Li, H., Wu, Z. H., Zhang, W. Q., Liu, K. K., Cheng, X., et al. (2020). Characteristics of atmospheric volatile organic compounds in urban area of Beijing: Variations, photochemical reactivity and source apportionment. J. Environ. Sci. 95 (9), 190–200. doi:10.1016/j.jes.2020.03.023
Zhang, T., Zhang, Y. X., Du, Z. Y., Dao, X., Zhang, X. L., Cao, G., et al. (2019). Determination of 104 volatile organic compounds in air by double column gas chromatography-mass spectrometry/flame ionization detector coupled with electronically controlled cryo-focusing unit. Chin. J. Chromatogr. 37 (4), 418–425. doi:10.3724/SP.J.1123.2018.12022
Zhang, Y., Wang, X., Barletta, B., Simpson, I. J., Blake, D. R., Fu, X., et al. (2013). Source attributions of hazardous aromatic hydrocarbons in urban, suburban and rural areas in the Pearl River Delta (PRD) region. J, Hazard. Mater. 250–251 (2), 403–411. doi:10.1016/j.jhazmat.2013.02.023
Zhang, Z. J., Han, J., Ren, L. Z., and Zhang, W. Q. (2021). Study on temporal and spatial distribution characteristics of gaseous pollutants in Langfang city from 2013 to 2019. Chem. Eng. Des. Commun. 47 (11), 166–167. doi:10.3969/j.issn.1003-6490.2021.11.083
Zhao, X. M., Wang, X., and Han, M. (2021). Characteristics and OFP analysis of atmospheric VOCs in summer and autumn in Liaocheng city. Environ. Prot. Circular Econ. 41 (12), 73–75+78. doi:10.3969/j.issn.1674-1021.2021.12.019
Zheng, B., Tong, D., Li, M., Liu, F., Hong, C. P., Geng, G. N., et al. (2018). Trends in China’s anthropogenic emissions since 2010 as the consequence of clean air actions. Atmos. Chem. Phys. 18, 14095–14111. doi:10.5194/acp-18-14095-2018
Zheng, X. M., Hu, K., Wang, M., Xie, F. J., and Wang, Y. (2022). Analysis of O3 pollution characteristics, formation sensitivity, and transport impact in southern nanjing. Environ. Sci. doi:10.13227/j.hjkx.202207171
Keywords: VOCs, Beijing-Tianjin-Hebei urban agglomeration, Fenwei plain, PMF, EKMA, OFP
Citation: Shan D, Du Z, Zhang T, Zhang X, Cao G, Liu Z, Yao Z, Tang K and Liang S (2023) Variations, sources, and effects on ozone formation of VOCs during ozone episodes in 13 cities in China. Front. Environ. Sci. 10:1084592. doi: 10.3389/fenvs.2022.1084592
Received: 30 October 2022; Accepted: 14 December 2022;
Published: 09 February 2023.
Edited by:
Jiandong Wang, Nanjing University of Information Science and Technology, ChinaReviewed by:
Momei Qin, Nanjing University of Information Science and Technology, ChinaZhiliang Yao, Beijing Technology and Business University, China
Wei Wei, Beijing University of Technology, China
Copyright © 2023 Shan, Du, Zhang, Zhang, Cao, Liu, Yao, Tang and Liang. This is an open-access article distributed under the terms of the Creative Commons Attribution License (CC BY). The use, distribution or reproduction in other forums is permitted, provided the original author(s) and the copyright owner(s) are credited and that the original publication in this journal is cited, in accordance with accepted academic practice. No use, distribution or reproduction is permitted which does not comply with these terms.
*Correspondence: Zhenyu Du, ZHV6eUBjbmVhYy5jb20=; Siyuan Liang, bGlhbmdzeUBjbmVtYy5jbg==
†These authors have contributed equally to this work and share first authorship