
95% of researchers rate our articles as excellent or good
Learn more about the work of our research integrity team to safeguard the quality of each article we publish.
Find out more
ORIGINAL RESEARCH article
Front. Environ. Sci. , 10 January 2023
Sec. Toxicology, Pollution and the Environment
Volume 10 - 2022 | https://doi.org/10.3389/fenvs.2022.1083011
This article is part of the Research Topic Legacy and Emerging Flame Retardants as Environmental Pollutants: Occurrence, Toxicity Mechanisms, and Control View all 6 articles
 Lovise P. Skogeng1,2*
 Helene Lunder Halvorsen1,3
 Knut Breivik1,3Sabine Eckhardt1
 Dorte Herzke1,2Claudia Moeckel1,4Ingjerd S. Krogseth1,2
The highly chlorinated chemical Dechlorane Plus (DP) was introduced as a replacement flame retardant for Mirex, which is banned through the Stockholm Convention (SC) for its toxicity (T), environmental persistence (P), potential for bioaccumulation (B) and long-range environmental transport potential (LRETP). Currently, Dechlorane Plus is under consideration for listing under the Stockholm Convention and by the European Chemical Agency as it is suspected to also have potential for P, B, T and LRET. Knowledge of atmospheric concentrations of chemicals in background regions is vital to understand their persistence and long-range atmospheric transport but such knowledge is still limited for Dechlorane Plus. Also, knowledge on environmental occurrence of the less described Dechlorane Related Compounds (DRCs), with similar properties and uses as Dechlorane Plus, is limited. Hence, the main objective of this study was to carry out a spatial mapping of atmospheric concentrations of Dechlorane Plus and Dechlorane Related Compounds at background sites in Europe. Polyurethane foam passive air samplers were deployed at 99 sites across 33 European countries for 3 months in summer 2016 and analyzed for dechloranes. The study showed that syn- and anti-DP are present across the European continent (<MDL-2.6 pg/m3 and <MDL-12.3 pg/m3, respectively), including parts of the Arctic. This supports that these compounds have potential for long-range atmospheric transport to remote regions. The highest concentrations of Dechlorane Plus were observed in central continental Europe, with anti-DP fractions close to the commercial mixture of Dechlorane Plus. The only detected Dechlorane Related Compounds was Dechlorane-602, which was found in 27% of the samples (<MDL-0.33 pg/m3). The measured concentrations and spatial patterns of Dechlorane Plus and Dechlorane-602 in air across Europe indicate the influence of primary sources of these compounds on background concentrations in European air. Future air monitoring efforts targeting dechloranes is needed in both background and source areas, including consistent temporal trends.
Dechlorane Plus (bis(hexachlorocyclopentadieno) cyclooctane, C18H12Cl12) (DP, sometimes referred to as DDC-CO (Bergman et al., 2012), Supporting Information (SI) Supplementary Table S1, S2) is a highly chlorinated flame retardant used in industrial polymers such as electrical coatings and building materials. It was first introduced in the mid-1960 s by OxyChem (United States) as a replacement product for the flame retardant and pesticide Mirex (Dechlorane, Supplementary Table S1, S2) (Hoh et al., 2006) and later for the flame retardant Decabromodiphenyl ether (Deca-BDE) (Sverko et al., 2011), which are both listed for elimination of production and use through the international Stockholm Convention (SC) under annex A (UNEP, 2020).
The production volume of DP is highly uncertain, with estimated global production volumes varying between 750 and 6000 tonnes annually in 2020, and Europe is predicted to be accountable for 24% of the global emissions of DP to the atmosphere (Hansen et al., 2020). ECHA (2021) reports that there is no production of DP in Europe, but between 90 and 230 tons of DP are estimated to be imported annually. The commercial mixture of DP consists of the stereoisomers syn- and anti-DP, with an approximate ratio of 1:3, i.e., anti-DP fraction (fanti = anti-DP/(syn-DP + anti-DP)) of 0.75, but usually between 0.59 and 0.80 (Wang et al., 2010). Some Dechlorane Related Compounds (DRCs, Supplementary Table S1, S2), i.e. Dechlorane-601 (Dec-601 or DDC-ID), Dechlorane-602 (Dec-602 or DDC-DBF), Dechlorane-603 (Dec-603 or DDC-Ant), and Dechlorane-604 (Dec-604 or HCTBPH), have also been used as replacements for Mirex and were introduced as flame retardants in polymers in the late 1960s (Shen et al., 2010). Production volumes for the DRCs are even less known than for DP.
DP remains unregulated at international level but has been proposed for listing under the SC since 2018 (UNEP, 2022). In January 2022, the Persistent Organic Pollutant Review Committee moved DP to the next review stage, which includes evaluating risk management and control measures. Parallel to this, DP is under review by the European Chemicals Agency (ECHA) for restrictions under the EU regulation Registration, Evaluation, Authorisation and restriction of Chemicals (REACH) (ECHA, 2021). The DRCs are expected to behave similarly to DP and Mirex in the environment (Shen et al., 2010), but to our knowledge, the DRCs are currently not under review for international restrictions.
DP was first detected in the environment in 2004, in air and sediments from the Great Lakes region (US/Canada), close to the local DP manufacturing plant (Hoh et al., 2006). DRCs are often detected together with DP in environmental samples (Wang et al., 2010; Moller et al., 2011; Moller et al., 2012). Dec-602, Dec-603 and Dec-604 were first detected in 2009 in biota, and also in sediment core samples dated back to the 1960s–70s (Shen et al., 2010), coinciding with the introduction of DP in the mid-1960s (Hoh et al., 2006). According to literature, Dec-602 is more ubiquitously detected than Dec-601, Dec-603 and Dec-604 (Wang et al., 2010; Moller et al., 2011; Moller et al., 2012; Yu et al., 2015; Bohlin-Nizzetto, 2020a; Nipen et al., 2021).
DP has also been measured in air close to point-sources of DP (e.g., landfills or urban regions), in e.g., China (Ren et al., 2008; Wang et al., 2010; Chen et al., 2011; Zhang et al., 2015), Tanzania (Nipen et al., 2021), and Norway (Morin et al., 2017). Many studies of DP in the atmosphere also report detectable concentrations of Dec-602 (Wang et al., 2010; Moller et al., 2011; Moller et al., 2012; Yu et al., 2015; Bohlin-Nizzetto et al., 2020b; Nipen et al., 2021). Though studies of both DP and DRCs in background regions exist (Moller et al., 2012; Bohlin-Nizzetto et al., 2020c; Schuster et al., 2021a), the knowledge of the spatial distribution of DP and DRCs in background regions in Europe is limited.
The main objective of this study was to carry out a spatial mapping of atmospheric concentrations of DP and DRCs at background sites in Europe to provide insight into 1) the spatial distribution of the dechlorane compounds across the European continent, 2) possible primary source regions and influence of local sources of dechlorane compounds on measured concentrations, 3) the long-range atmospheric transport potential (LRATP) of dechlorane compounds, and 4) knowledge of the background concentrations of these compounds prior to possible international restrictions. To achieve this, a passive air sampling (PAS) campaign at 99 sites across Europe was carried out in 2016. PAS was chosen as it allows for coordinated deployment of a high number of samples, without the need of electricity, and provides estimates of time-averaged concentrations suitable for evaluation of spatial trends (Shoeib and Harner, 2002; Jaward et al., 2004).
Between 95% (Zhang et al., 2015) and 99% (Sverko et al., 2011) of DP may be particle-bound in the atmosphere due to its high octanol-air partition coefficient (Supplementary Table S1). In this study, passive air samplers (PAS) of the MONET design (Shoeib and Harner, 2002; Kalina et al., 2017) were used for air sampling. This sampler tends to accumulate particles, but the sampling efficiency of particle-associated compounds has shown to be lower compared to gas-phase compounds (Bohlin et al., 2014; Markovic et al., 2015). The samplers consisted of a PUF disk (14 cm diameter × 1.4 cm thickness, 0.027 g/m3, Sunde Skumplast AS/Carpenter, Norway) as sampling medium, protected by a housing made from two stainless steel bowls (diameter 30 and 24 cm) and a metal rod and PUF disks (14 cm diameter × 1.4 cm thickness, 0.027 g/m3 Sunde Skumplast AS/Carpenter, Norway) as sampling media. All metal parts of the sampler were pre-cleaned with alkali soap and water, followed by rinsing with acetone and n-hexane. PUF disks were pre-cleaned with toluene, acetone, and n-hexane consecutively, dried under vacuum, wrapped in aluminium foil and stored cool in zip-lock bags until shipment. More details on the preparation of samplers are described elsewhere (Lunder Halvorsen et al., 2021).
The PAS were deployed by site keepers at 99 sampling locations across Europe (from 35°N to 82°N, and 52°W to 48°E) for approximately 3 months during summer 2016 (Lunder Halvorsen et al., in review). The locations were chosen based on the European Monitoring and Evaluation Programme (EMEP) sampling network (Tørseth et al., 2012). Details on sample locations and deployment periods can be found in Supplementary Table S3. After sampling, the PUF disks were wrapped in aluminium foil and zip-lock bags, and sent to the NILU laboratory in Kjeller, Norway, where they were stored at -20°C awaiting further processing.
The sample PUF disks were spiked with isotopic-labelled syn-DP (Cambridge Isotope Laboratories, Inc.) as internal standard, followed by 8 h Soxhlet extraction with 1:1 acetone/n-hexane. A multi-analyte clean-up method based on Röhler et al. (2021) was initially chosen in order to include acid-labile organic contaminants simultaneously with dechloranes. Therefore, 2 g of a mixture of Supel QuE Z-zep (SigmaAldrich) and Discovery DSC-18 (SigmaAldrich) in the bottom sorbent bed, and 2 g Supelclean LC-Florisil (Sigma Aldrich) in the top sorbent bed was used for solid phase extraction. Acetonitrile was used for elution, and the samples were further back-extracted to n-hexane and cleaned with concentrated sulfuric acid in order to sufficiently remove co-extracted sample matrix (Lunder Halvorsen et al., in review). Prior to instrumental analysis, the volume was reduced and 1,2,3,4-tetrachloronaphthalene (ULTRA scientific, now a part of Agilent) was added as an instrument performance standard.
The samples were analyzed for syn- and anti-DP, Dec-601, Dec-602, Dec-603 and Dec-604 using an Agilent 7890 gas chromatograph (GC) coupled to an Agilent 7200 high-resolution quadruple time-of-flight mass spectrometer (HRqToFMS) (details in SI section 1). The chromatograms were processed using MassHunter Quant version B.09.00, and integrated areas of target analytes and isotopic labelled syn-DP were used to quantify the concentration of dechloranes from the relative response factors of calibration standards (i.e., internal standard method).
Selected sampling locations (Finland/Pallas, Ukraine/Zmeiny Island, and United Kingdom/Yarner Wood, Supplementary Table S3) were supplied with field blanks (FB) (n = 3). These were pre-cleaned PUF-disks, transported together with the samples and exposed during mounting and dismantling of the samplers. This was done to account for possible contamination during deployment, handling in the field and transport of the samples. Additionally, laboratory blanks (LB) were included (n = 14) to account for potential contamination during the laboratory procedures. These blanks underwent the same laboratory procedures as the exposed samples. The DP concentrations in FB and LB were comparable (average syn-DP concentrations were 16 ± 7.8 pg/sample and 13 ± 5.2 pg/sample in LB and FB, respectively; and average anti-DP concentrations were 36 ± 22 pg/sample and 25 ± 12 pg/sample in LB and FB, respectively), indicating that the blank contribution from sampling and transport was minimal. The average syn- and anti-DP concentrations in blank samples (FB and LB) were 13% and 7.1% of the average concentrations in the samples, respectively. All samples were blank corrected for using all blanks (average of FB and LB). Similarly, all blanks were used to calculate the method detection limit (MDL, in pg), given as three times the standard deviation of DP concentration in blanks (normalized by the average sample volume 212 m3 to give the MDL in pg/m3). The MDLs of syn-DP and anti-DP were 22 pg/sample (0.11 pg/m3) and 64 pg/sample (0.30 pg/m3), respectively. In calculations of sum, median, average concentrations, standard deviations, and for the statistical analysis, samples below MDL were set to 1/2 of the respective MDL. None of the DRCs were detected in the blank samples. Thus, the instrumental detection limits were used for these compounds. The MDLs for Dec-601, Dec-602, Dec-603 and Dec-604 were 3.0 pg/sample (0.01 pg/m3), 2.2 pg/sample (0.01 pg/m3), 2.6 pg/sample (0.01 pg/m3) and 6.7 pg/sample (0.03 pg/m3), respectively.
The internal standard compensates for possible loss during sample preparation, and was quantified relative to the instrument performance standard to monitor recovery rates for the extraction and clean-up procedure. Recovery >130% may indicate possible matrix effects. The internal standard recoveries of both exposed and blank samples are listed in Supplementary Table S4.
To investigate the reproducibility of the PAS, 11 sampling locations were supplied with two parallel samples. These were treated and analysed in the same way, and the relative standard deviation (RSD) of the two samples for each location was calculated. The RSDs were 9–85% (n = 5), 3–52% (n = 5) and 3% (n = 1) for syn-DP, anti-DP and Dec-602, respectively, for samples where the compounds were detected in both parallels (Supplementary Table S5). Dec-601, Dec-603 and Dec-604 were not detected in any parallel samples. The RSDs of syn- and anti-DP at some sites (i.e. Czech Republic/Kosetice, Germany/Waldhof and Sweden/0052åö) are larger compared to the RSDs found for e.g. PCB-180 and p,p’-DDE at the same sites (<17%) in (Lunder Halvorsen et al., in review). The log Koa of DP is even higher than for these two POPs, and the larger RSDs found in our study may therefore imply that the uptake of particles are more variable than for more gaseous compounds. For further data analysis, the dechlorane concentrations from the sites supplied with parallel PAS were averaged.
Due to variability in the sampling period (81–125 days) (Supplementary Table S3), all measured concentrations (in pg/sample) were normalized to a sample period of 90 days. The concentrations per sample (pg/sample) were used when assessing the spatial patterns in our study.
To enable comparison with other studies, a conversion to volumetric air concentrations was done by using a generic sampling rate from the literature. The sampling rates for are typically in the range 4 ± 2 m3/day (Harner et al., 2014). However, the uptake efficiency for particles with the MONET sampler (54%) (Markovic et al., 2015) suggest a lower sampling rate for particle-bound compounds (Bohlin et al., 2014). Drage et al. (2016) collected both gaseous and particulate phases and derived a sampling rate of 2.3 m3/day for BDE-209 and DP. This sampling rate reflects the lower uptake efficiency of particles reported by Markovic et al. (2015). Even lower uptake efficiency (10%) and uptake rates (0.7 m3/day) of particle-bound PAHs with the MONET sampler have been reported by Klánová et al. (2008).
However, as both DP and Dec-602 are likely to predominantly sorb to atmospheric particles (similar to BDE-209), a sampling rate of 2.3 m3/day was chosen to derive concentrations in air (in pg/m3) for both DP and Dec-602 in our study, consistent with Drage et al. (2016). The selection of 2.3 m3/day contrary to 0.7 m3/day (Klanova et al., 2008), may be considered to pose the potential risk of underestimation rather than overestimation of air concentrations. This is a semiquantitative approach (Wania and Shunthirasingham, 2020).
Possible linear relationships between the concentration of ƩDP and latitude, longitude, wind speed, temperature, fanti, and Dec-602 concentrations were investigated by using the Pearson’s correlation coefficient (r). The concentrations of ƩDP and Dec-602, wind speed and temperature were log-transformed prior to the correlation test. The Wilcoxon signed-rank test was used for group comparison to investigate possible influence of elevated population density. All statistical analyses were performed by using R Studio with R 4.1.1 and a significance level of p < 0.05.
Detection frequency, MDL, range, median, average and standard deviation of the measured concentrations for the dechlorane compounds are listed in Table 1. Concentrations of the dechloranes in individual samples are listed in Supplementary Table S6.
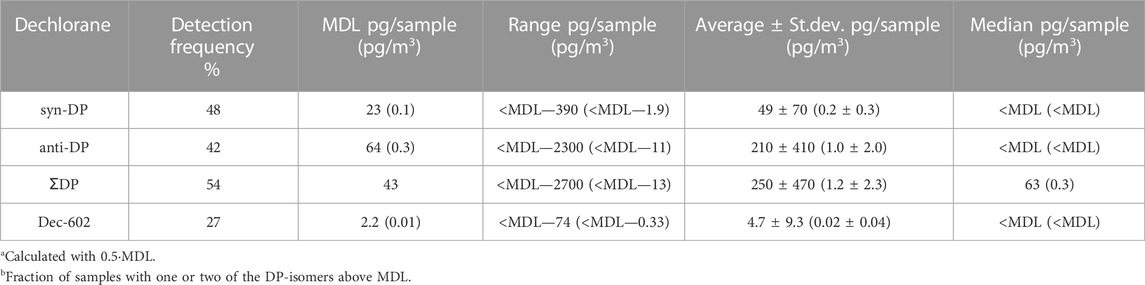
TABLE 1. Detection frequency (%), method detection limit (MDL), range, average ± standard deviations (St.dev.) and median for the atmospheric concentrations of Dechlorane Plus syn- and anti-isomers, ƩDP (the sum of syn-DP and anti-DP), and Dec-602, at 97 sites across Europe. The results are given in mass per sample (pg/sample) and in mass per volume (pg/m3) in brackets (derived from a sampling rate of 2.3 m3/day).
When evaluating all samples together, syn-DP and anti-DP were detected in 51% and 44% of the samples, respectively. The concentrations of ƩDP (syn-DP + anti-DP) ranged from <MDL to 31,000 pg/sample (median: 63 pg/sample) (n = 99). Generally, the highest number of sites with concentrations below MDL were found in northern Europe (e.g., Norway, Sweden, and Russia), and the highest concentrations were found in central continental Europe (e.g., northern France, Austria, Netherlands, and Germany). The highest concentration of ƩDP (31,000 pg/sample), measured in the sample from Hungary/Puszta, was 490 times higher than the median, and indicates possible local contribution at this site. The second highest concentration was measured in the sample from Greenland/Nuuk (3200 pg/sample), but this sampler was installed on a rooftop in the city of Nuuk and may thus be influenced by local sources. Hence, these outliers were excluded from the dataset. This provided a concentration range of ƩDP in the remaining samples of <MDL to 2700 pg/sample (n = 97) (Figure 1A, Table 1).
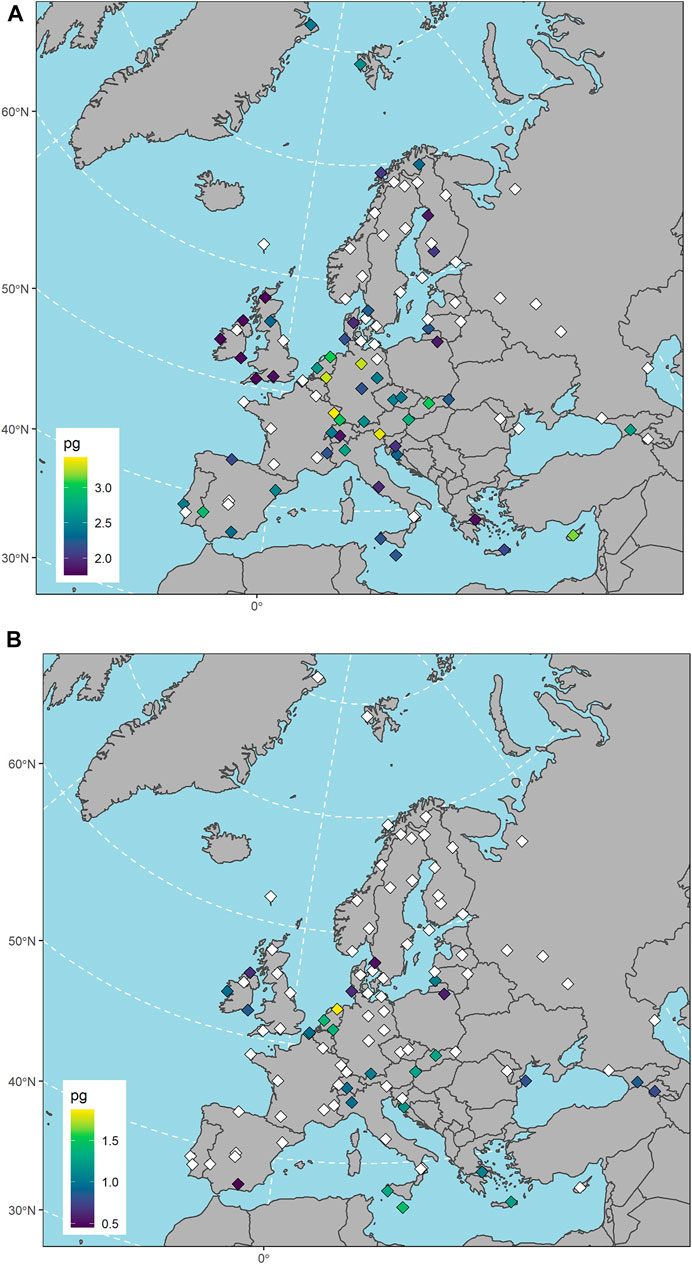
FIGURE 1. Spatial distribution of ƩDP (syn-DP + anti-DP) (A) and Dechlorane-602 (B). Concentrations are displayed as log pg/sample to allow for visual comparison between the sample locations. Note the different scales between the two maps. Locations with concentrations of both DPs/Dec-602 below MDL are shown as white points. Equivalent maps for syn- and anti-DP separately are given in Supplementary Figure S1.
Applying a sampling rate of 2.3 m3/day provided ƩDP concentrations ranging from <MDL to 13 pg/m3 (n = 97). Air concentrations of dechloranes from other studies are compiled in Supplementary Table S8 for comparison. The lowest concentrations of ƩDP above MDL in our study (0.12–0.13 pg/m3), found in Great Britain and Ireland, are 2–4 times lower than concentrations reported for two remote locations in North America using active air sampling (AAS) in the period 2005–2013 (0.26–0.43 pg/m3) (Liu et al., 2016). Low concentrations of ƩDPs (0.01–1.8 pg/m3) were also obtained with a flow-through sampler in a sub-Arctic region in Canada from 2011–2014 (Yu et al., 2015). The upper concentration range in our study (12–13 pg/m3), found in France and Austria, is within the range reported at a rural site in China in 2007–2008 using AAS (0.47–36 pg/m3) (Chen et al., 2011).
The concentration range in our study is also in line with Schuster et al. (2021b), reporting concentrations of ƩDP sampled with PAS in the Global Atmospheric Passive Sampling (GAPS) network in 2005–2006; <MDL to 9.9 pg/m3 and <MDL to 8.7 pg/m3 for 35 background and five polar sites, respectively. Five sampling sites were identical in our study and in Schuster et al., 2021a: Czech Republic/Kosetice, Finland/Pallas, Ireland/Malin Head, Spitsbergen/Zeppelin Mountain and Russia/Danki. The concentrations in 2005–2006 were lower compared to 2016 (our study) for four of the sites (ratio Schuster/Skogeng: 0.2–0.6) (Supplementary Table S7), indicating possible increased emission of DP. Increasing trends have also previously been suggested at three of five Great Lake sites from 2005 to 2013 (Liu et al., 2016), and in an urban area in China from 2008 to 2013 (Li et al., 2016). On the other hand, the sample from Spitsbergen/Zeppelin station had a ratio of 2.1. In Schuster et al., 2021a, elevated and varied concentrations of DP were observed at this site, which may explain the higher ratio. No conclusions of temporal trends in atmospheric concentrations of ƩDP can be made based on only two time-points. Furthermore, comparison between the two datasets may be hampered by differences in sampling methodology and analytical procedures; While the MONET sampler used in our study is placed in freely hanging position, the PAS used within GAPS (diameter 24.5 and 19.5 cm) is placed in a fixed position and has a PUF-disk with lower density (0.021 g/cm3) (Hoh et al., 2006). The GAPS sampler has been shown to have higher efficiency of particle collection than the MONET sampler (Chaemfa et al., 2009; Markovic et al., 2015). Such differences should though have been adjusted for by using a lower sampling rate for the MONET sampler. A generic sampling rate was used in our study, while Schuster et al., 2021a used site-specific sampling rates in the estimation of the sampling volumes. Additionally, Schuster et al. (2021b), sampled through all seasons in 2005–2006 (Schuster et al., 2021a), while our study was performed during summer only and seasonal variations in atmospheric concentrations of ƩDP may occur.
Spitsbergen/Zeppelin station is included in the Norwegian monitoring program for environmental contaminants in air and precipitation. The first AAS of dechloranes at Zeppelin were done in 2017. The syn-DP and anti-DP were detected in 35% and 30% of the active air samples collected on weekly basis in 2017 with concentrations of <0.02–0.16 pg/m3 and <0.05–0.21 pg/m3, respectively (Bohlin-Nizzetto et al., 2018). The measured concentrations at Zeppelin in our study (0.6 pg/m3 for syn-DP and 1.4 pg/m3 for anti-DP) were 30 times higher than the MDLs (i.e. medians) with AAS in 2017. This deviation is higher than observed for POPs at Zeppelin in the study of Lunder Halvorsen (SUBMITTED) and more than expected when considering the uncertainty of PAS and AAS in combination (Holt et al., 2017). Differences between the studies may be caused by different sampling techniques (AAS vs. PAS), different sampling periods (2016 vs. 2017) and different seasons (summer vs. annual). The uncertainty in the estimated sampling volumes is also higher when using a constant sampling rate of 2.3 m3/day as in this study, compared to using site-specific sampling rates as in Lunder Halvorsen (SUBMITTED). A constant sampling rate does not account for sampling conditions such as temperature and wind speed at the sampling sites. Hence, it is possible that the elevated concentrations at Zeppelin measured in this study are caused by an underestimated sampling rate. However, the predominantly particle-bound dechloranes (Hansen et al., 2020) are less affected by changes in temperature than more volatile compounds, as the uptake is still in the linear phase regardless of the temperature (Shoeib and Harner, 2002; Bohlin-Nizzetto et al., 2020b). Neither was an elevated average wind speed observed at the site (Supplementary Table S3).
Figure 1A illustrates that while DP was detected across the whole study area, the abundance of samples above MDL was highest in central continental Europe. This indicates higher emissions in this region. Furthermore, a significant (p = 0.04) linear correlation was observed when plotting the logarithmic concentrations of ƩDP against latitude (r = -0.21), which may reflect LRAT from areas of high use to more remote areas. A similar pattern was also predicted by Hansen et al. (2020), which further suggested that DP in the Arctic is transported directly from source areas and that secondary re-emissions to air from surface media is less likely. In our study, no significant correlation with longitude was found (r = -0.13, p = 0.22).
Corresponding to Lunder Halvorsen (SUBMITTED), the sample locations were categorized into the regions northern Europe (NE), central-eastern Europe (CEE), southern Europe (SE) and western Europe (WE), based on the EuroVoc system (Supplementary Figure S2, Retrieved from https://eur-lex.europa.eu/browse/eurovoc.html). The highest detection frequencies of ƩDP were observed in SE and WE (71% and 70%, respectively), compared to CEE and NE (47% and 30%, respectively). In SE, the concentrations of ƩDP ranged from <MDL to 1400 pg/sample (median 140 pg/sample), with the highest concentration measured in Cyprus/Ayia Marina. In WE, the concentrations of ƩDP ranged from <MDL to 2700 pg/sample (France/Donon) and a median of 72 pg/sample. The median values in CEE and NE were both < MDL. The higher atmospheric concentrations of ƩDP observed in SE and WE may be linked to higher population density in these areas, compared to CEE and NE (Supplementary Figure S3). In our study, seven “suburban” sites were identified to have elevated population within an area of 50 km radius, due to a nearby city (Supplementary Figure S3) (Lunder Halvorsen et al., in review). This questions whether these seven sites are representative background sites in the measurement of dechloranes. The observed median concentration of ∑DP for these sites were significantly (p = 0.002) higher (280 pg/sample) than the median concentration of ∑DP in the 90 remaining samples (50 pg/sample), substantiating that there is a correlation between population density and atmospheric concentrations of ∑DP.
Large variations in atmospheric contaminant concentrations across a region may be interpreted as a continuing influence of primary emissions on atmospheric levels (Jaward et al., 2004; Halse et al., 2011). The spatial variability of ΣDP, represented by the ratio between the maximum measured concentration (excluding outliers) and the minimum value (from MDLs), is 61. This is in the lower range of the variability found for POPs in European background air (max-min ratio <700) (Jaward et al., 2004; Halse et al., 2011). The max-min ratio is also lower than for the low-volatile POPs (e.g., >200 for sum of dichlorodiphenyldichloroethylenes (DDTs), outliers excluded) in the study of Lunder Halvorsen (SUBMITTED). This may be explained by higher and more variable contribution from blanks for ΣDP than for the legacy POPs, consequently resulting in higher MDLs and lower detection frequency. Still, compared to the even distribution of HCB (max-min ratio = 4) in Lunder Halvorsen (SUBMITTED), the spatial variability for ∑DP is higher. This may reflect the lower LRATP of less volatile compounds.
There is some uncertainty in the sampling methodology which may have affected the observed differences in measured concentrations between sites (Wania and Shunthirasingham, 2020). The uptake of contaminants to the PUF is influenced by the meteorological conditions at a given site. Though the PUF is sheltered with two surrounding steel bowls, it has been shown that wind generally has the strongest influence on the uptake rate (Schuster et al. (2021b),; Herkert et al., 2018). In our study, the sampling locations represented a broad range of elevations, ranging from sea level up to almost 4000 m (Supplementary Table S3), with variations in both temperature and wind speed. The average wind speeds (from European Centre for Medium-Range Weather Forecasts) for the sampling sites in the sampling period ranged from 2 to 7 m/s across the study region (Supplementary Table S3) (Lunder Halvorsen et al., in review). Similar to the study of Bohlin-Nizzetto et al. (2020a), no correlation with temperature was found. The concentrations of ∑DP (in pg/sample) were negatively correlated to wind speed (r = -0.24, p = 0.02), indicating that high concentrations are related to sites with low wind.
The detected syn-DP in our study ranged from <MDL to 390 pg/sample (1.9 pg/m3) with a median concentration <MDL, as more than half of samples were below MDL (Table 1). Anti-DP ranged from <MDL to 2300 pg/sample (11 pg/m3) with a median concentration <MDL (Table 1). Both syn- and anti-DP followed the same spatial pattern as for ƩDP, with the highest detection frequencies in SE and WE, compared to CEE and NE. Excluding the previously discussed outliers, the highest and second highest syn- and anti-DP concentrations were found in WE: 390 pg/sample syn-DP in Germany/Waldhof followed by 350 pg/sample syn-DP in France/Donon, and 2300 pg/sample anti-DP in France/Donon followed by 2000 pg/sample anti-DP in Austria/Vorhegg.
Anti-DP may be more prone to degradation in the environment than syn-DP, due to syn-DP being more sterically hampered (Olukunle et al., 2018). Hence, the isomer fraction fanti can indicate whether DP has been affected by degradation and suggest if the measured DP originate from on-going emissions or not. For the sites that had concentrations >MDL of both DP isomers (37%), fanti was calculated (range: 0.40–0.91, Supplementary Table S6). The spatial distribution of fanti is shown in Figure 2. The lowest fanti, found in Kosetice/Czech Republic, is well below the commercial mixture fanti range (Figure 3). This site was supplied with two parallel samples and had a high RSD for syn-DP measured in the two parallels (85% for syn-DP, but 5% for anti-DP) (Supplementary Table S5). One of the parallels had ten times higher concentration of syn-DP than the other (360 pg/sample vs. 31 pg/sample), providing fanti for each parallel separately of 0.28 and 0.81, respectively. Hence, large uncertainty is associated with the fanti for this site.

FIGURE 2. The fraction of the anti-DP isomer (fanti = anti-DP/(ƩDP)) in samples where both the anti- and the syn-DP isomers are present. Sample locations where one or both DP isomers were below MDL are shown as white points. The commercial mixtures of DP have a fanti between 0.59 and 0.80 (Wang et al., 2010).
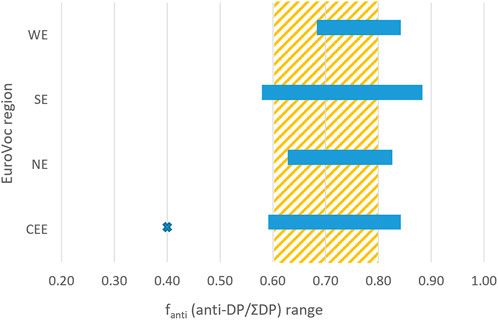
FIGURE 3. The range of the anti-DP fraction, fanti, for the four different regions Western Europe (WE) (n = 16), Southern Europe (SE) (n = 9), Northern Europe (NE) (n = 5) and Central-Eastern Europe (CEE) (n = 6). The range of fanti in commercial mixtures of DP is indicated as the orange shaded area. An outlier in the CEE region (Czech Republic/Kosetice) is seen as a blue cross at fanti 0.4 and is discussed in the text.
Disregarding fanti from Czech Republic/Kosetice, the observed range of fanti for the other sites (0.58–0.91) was close to the range for the commercial mixture of DP (0.59–0.80) (Wang et al., 2010). It is also in the same range as found for the background (0.63 ± 0.16) and polar (0.74 ± 0.15) sites in Schuster et al., 2021a. The overlapping fanti ranges for the EuroVoc regions SE, NE, WE, and CEE (Figure 3) show that there are no considerable differences in fanti between the four regions. The fanti was positively correlated with the measured concentration of ∑DP concentrations (r = 0.30, p = 0.004), indicating that fanti decreases with distance from source areas. This makes sense as it reflects a higher atmospheric degradation of anti-DP further from source areas where ∑DP concentrations are lower. Hence, there are many indications in this study of existing sources of ∑DP to the European atmosphere, which is expected considering that DP is an unregulated compound.
Of the DRCs, only Dec-602 was detected above MDL (<0.01–0.33 pg/m3). This indicates that the three other DRCs (Dec-601, -603, and -604) are not present or only present at low concentrations (MDLs: 2.6–6.7 pg/sample or 0.01–0.03 pg/m3) in the European background atmosphere. Higher detection frequency of Dec-602, compared to the other DRCs has also been reported in other studies (Supplementary Table S8). In the study of Yu et al. (2015) from Canada’s Western Sub-Arctic, Dec-602 was in the range <MDL-0.06 pg/m3 (n = 42) during 2011–2014, whereas Dec-604 was detected in 2014. In the marine atmosphere from East China Sea to the Arctic, Dec-602 (<MDL - 0.2 pg/m3), Dec-603 (<MDL—0.4 pg/m3) and Dec-604 (<MDL - 0.05 pg/m3) were all detected using AAS (Moller et al., 2011; Moller et al., 2012). Higher concentrations of Dec-602, than in our study, were observed in the vicinity of a Chinese manufacturing facility (4.1–5.1 pg/m3) (Wang et al., 2010), while Dec-603 and Dec-604 were not detected. Atmospheric concentrations of Dec-602 and Dec-603 using PAS were detected (<MDL—0.2 pg/m3) close to an urban region in Tanzania (Nipen et al., 2021).
The detection frequency of Dec-602 was 27% with concentrations ranging from <MDL to 74 pg/sample (Table 1), considerably lower than the concentrations of syn-DP and anti-DP. In samples where both Dec-602 and DP were detected (n = 23), Dec-602 was 1–18% of the concentration of ƩDP. This likely reflects lower primary emissions of Dec-602 than of DP in Europe.
The spatial distribution of Dec-602 is shown in Figure 1B. The highest concentration was measured in the Netherlands/Kollumerwaard (74 pg/sample, 0.33 pg/m3), followed by Malta/Giordan Lighthouse (27 pg/sample, 0.13 pg/m3) and the Netherlands/De Zilk (24 pg/sample, 0.11 pg/m3). Dec-602 has previously been measured in background atmospheric samples from Canada (0.004 pg/m3—0.06 pg/m3) (Yu et al., 2015); and in an Asian-Arctic marine transect (<0.003 pg/m3—0.02 pg/m3) (Moller et al., 2012). These concentrations are in the lower range of our measured Dec-602 concentrations. Since 2017, Dec-602 has been continuously screened for at the Zeppelin station, but not detected above MDLs (<0.025 pg/m3) (Bohlin-Nizzetto et al., 2020b). Dec-602 was not detected at Zeppelin in our study either (Supplementary Table S6).
A significant linear correlation was found between Dec-602 and ƩDP concentrations (r = 0.35, p < 0.001, n = 97) (Supplementary Figure S2A–C). This suggests that the sources and/or source regions of Dec-602 and DP are likely to be similar. For example, it cannot be excluded that Dec-602 may be an impurity in DP. As both Dec-602 and DP are likely to be predominantly sorbed to particles in the atmosphere, and have similar atmospheric half-lives (Zhang et al., 2016), their LRATP behaviour is also likely to be similar.
This study shows that syn- and anti-DP are present across the European continent, including parts of the Arctic. This supports that these compounds have potential for LRAT to remote regions. Concentrations of ∑DP correlated with latitude, with low detection of DP in northern Europe, and the highest concentrations observed in central continental Europe.
The individual isomers follow a similar spatial pattern. With fanti fractions close to that of the commercial mixture of DP, the concentrations of DP in Europe are expected to be influenced by primary emissions. The max-min ratio of ∑DP concentrations (61), when excluding outliers, give further indications of continuing influence of primary emissions in the study area. Elevated concentrations of ∑DP for seven “suburban” sites, may suggest that primary emissions of DP are related to population density. More atmospheric monitoring, including consistent time-trends, is needed to elucidate the temporal trend of dechloranes in the atmosphere.
Dec-602 was the only DRC detected in our study, but was detected at lower concentrations compared to syn-/anti-DP (i.e., 1-18% of ∑DP). The other analysed DRCs were not detected above MDL at any of the sites across Europe (<0.03 pg/m3). This suggests generally lower primary emissions of DRCs than DPs, and a significant correlation between Dec-602 and DP concentrations indicates similar sources and environmental behaviour of these compounds.
Our study shows that despite uncertainty related to the PAS methodology, it is suitable for assessing the spatial distribution of the dechloranes and estimate the background concentrations of the unregulated DP. However, the dominance of concentrations close to or below MDL indicates a need to reduce blank contamination or to consider measures increasing the sampling volume of DP and DRCs. This can be explored in future studies by deploying the PAS samplers for prolonged time periods, or by using sampling strategies targeting particle phase (e.g. AAS).
While ongoing air monitoring projects in Europe mainly focuses on POPs (Aas and Pernilla, 2018; Kalina et al., 2019; Schuster et al. (2021b)), our study shows that there is a need for future air monitoring efforts targeting dechloranes.
The original contributions presented in the study are included in the article/Supplementary Material, further inquiries can be directed to the corresponding author.
KB contributed with the conceptualization and funding acquisition for the study. ISK supplied the resources and supervision of the study. The investigation, methodology, validation and project administration was carried out by HLH and LPS. LPS, HLH, CM, DH and SE contributed with the data curation and formal analysis. LPS wrote the original draft of the manuscript and carried out the visualization. All authors contributed to the manuscript revision, editing and approval of the submitted version.
This study was financed through the Research Council of Norway (244298, 267574 and 287114) and the FRAM–High North Research Centre for Climate and the Environment flagship “Hazardous substances–effects on ecosystem and human health”.
The author would like to thank all EMEP personnel involved in sampling, and NILU personnel involved in the laboratory work: Especially Anders Røsrud Borgen for performing the instrumental analysis and quantification.
The authors declare that the research was conducted in the absence of any commercial or financial relationships that could be construed as a potential conflict of interest.
All claims expressed in this article are solely those of the authors and do not necessarily represent those of their affiliated organizations, or those of the publisher, the editors and the reviewers. Any product that may be evaluated in this article, or claim that may be made by its manufacturer, is not guaranteed or endorsed by the publisher.
The Supplementary Material for this article can be found online at: https://www.frontiersin.org/articles/10.3389/fenvs.2022.1083011/full#supplementary-material
Bergman, A., Ryden, A., Law, R. J., De Boer, J., Covaci, A., Alaee, M., et al. (2012). A novel abbreviation standard for organobromine, organochlorine and organophosphorus flame retardants and some characteristics of the chemicals. Environ. Int. 49, 57–82. doi:10.1016/j.envint.2012.08.003
Bohlin, P., Audy, O., Skrdlikova, L., Kukucka, P., Pribylova, P., Prokes, R., et al. (2014). Outdoor passive air monitoring of semi volatile organic compounds (SVOCs): A critical evaluation of performance and limitations of polyurethane foam (PUF) disks. Environ. Sci. Process Impacts 16, 433–444. doi:10.1039/c3em00644a
Bohlin-Nizzetto, P., Aas, W., Lunder Halvorsen, H., Nikiforov, V., and Pfaffhuber, K. A., (2020a). Monitoring of environmental contaminants in air and precipitation - annual report 2020. NILU report 12/2021.
Bohlin-nizzetto, P., Aas, W., and Nikiforov, V. (2020b). Monitoring of environmental contaminants in air and precipitation - annual report 2019. NILU report 06/2020.
Bohlin-nizzetto, P., Aas, W., and Warner, N. (2018). Monitoring of environmental contaminants in air and precipitation - annual report 2017. Report number: M-1062.
Bohlin-nizzetto, P., Melymuk, L., White, K. B., Kalina, J., Madadi, V. O., Adu-Kumi, S., et al. (2020c). Field- and model-based calibration of polyurethane foam passive air samplers in different climate regions highlights differences in sampler uptake performance. Atmos. Environ. 238, 117742. doi:10.1016/j.atmosenv.2020.117742
Chaemfa, C., Barber, J. L., Kim, K. S., Harner, T., and Jones, K. C. (2009). Further studies on the uptake of persistent organic pollutants (POPs) by polyurethane foam disk passive air samplers. Atmos. Environ. 43, 3843–3849. doi:10.1016/j.atmosenv.2009.05.020
Chen, S. J., Tian, M., Wang, J., Shi, T., Luo, Y., Luo, X. J., et al. (2011). Dechlorane Plus (DP) in air and plants at an electronic waste (e-waste) site in South China. Environ. Pollut. 159, 1290–1296. doi:10.1016/j.envpol.2011.01.026
Drage, D. S., Newton, S., De Wit, C. A., and Harrad, S. (2016). Concentrations of legacy and emerging flame retardants in air and soil on a transect in the UK West Midlands. Chemosphere 148, 195–203. doi:10.1016/j.chemosphere.2016.01.034
Halse, A. K., Schlabach, M., Eckhardt, S., Sweetman, A., Jones, K. C., and Breivik, K. (2011). Spatial variability of POPs in European background air. Atmos. Chem. Phys. 11, 1549–1564. doi:10.5194/acp-11-1549-2011
Hansen, K. M., Fauser, P., Vorkamp, K., and Christensen, J. H. (2020). Global emissions of dechlorane plus. Sci. Total Environ. 742, 140677. doi:10.1016/j.scitotenv.2020.140677
Herkert, J. K., Spak, S. N., Smith, A., Schuster, J. K., Harner, T., Martinez, A., et al. (2018). Calibration and evaluation of PUF-PAS sampling rates across the global atmospheric passive sampling (GAPS) network. Environ. Sci. Process. Impacts 20, 210–219. doi:10.1039/c7em00360a
Hoh, E., Zhu, L., and Hites, R. A. (2006). Dechlorane plus, a chlorinated flame retardant, in the Great Lakes. Environ. Sci. Technol. 40, 1184–1189. doi:10.1021/es051911h
Holt, E., Bohlin-Nizzetto, P., Boruvkova, J., Harner, T., Kalina, J., Melymuk, L., et al. (2017). Using long-term air monitoring of semi-volatile organic compounds to evaluate the uncertainty in polyurethane-disk passive sampler-derived air concentrations. Environ. Pollut. 220, 1100–1111. doi:10.1016/j.envpol.2016.11.030
Jaward, F. M., Farrar, N. J., Harner, T., Sweetman, A. J., and Jones, K. C. (2004). Passive air sampling of PCBs, PBDEs, and organochlorine pesticides across Europe. Environ. Sci. Technol. 38, 34–41. doi:10.1021/es034705n
Kalina, J., Scheringer, M., Boruvkova, J., Kukucka, P., Pribylova, P., Bohlin-Nizzetto, P., et al. (2017). Passive air samplers as a tool for assessing long-term trends in atmospheric concentrations of semivolatile organic compounds. Environ. Sci. Technol. 51, 7047–7054. doi:10.1021/acs.est.7b02319
Kalina, J., White, K. B., Scheringer, M., Pribylova, P., Kukucka, P., Audy, O., et al. (2019). Comparability of long-term temporal trends of POPs from co-located active and passive air monitoring networks in Europe. Environ. Sci. Process Impacts 21, 1132–1142. doi:10.1039/c9em00136k
Klanova, J., Eupr, P., Kohoutek, J., and Harner, T. (2008). Assessing the influence of meteorological parameters on the performance of polyurethane foam-based passive air samplers. Environ. Sci. Technol. 42, 550–555. doi:10.1021/es072098o
Li, W. L., Liu, L. Y., Song, W. W., Zhang, Z. F., Qiao, L. N., Ma, W. L., et al. (2016). Five-year trends of selected halogenated flame retardants in the atmosphere of Northeast China. Sci. Total Environ. 539, 286–293. doi:10.1016/j.scitotenv.2015.09.001
Liu, L. Y., Salamova, A., Venier, M., and Hites, R. A. (2016). Trends in the levels of halogenated flame retardants in the Great Lakes atmosphere over the period 2005-2013. Environ. Int. 92-93, 442–449. doi:10.1016/j.envint.2016.04.025
Lunder Halvorsen, H., Bohlin-Nizzetto, P., Eckhardt, S., Gusev, A., Krogseth, I. S., Moeckel, C., et al. (2021). Main sources controlling atmospheric burdens of persistent organic pollutants on a national scale. Ecotoxicol. Environ. Saf. 217, 112172. doi:10.1016/j.ecoenv.2021.112172
Lunder Halvorsen, H., Bohlin-Nizzetto, P., Eckhardt, S., Gusey, A., Möckel, C., Shatalov, V., et al. ((in review)). Spatial variability of POPs in background air across Europe - changes over a decade and source contributions.
Markovic, M. Z., Prokop, S., Staebler, R. M., Liggio, J., and Harner, T. (2015). Evaluation of the particle infiltration efficiency of three passive samplers and the PS-1 active air sampler. Atmos. Environ. 112, 289–293. doi:10.1016/j.atmosenv.2015.04.051
Möller, A., Xie, Z., Cai, M., Sturm, R., and Ebinghaus, R. (2012). Brominated flame retardants and dechlorane plus in the marine atmosphere from Southeast Asia toward Antarctica. Environ. Sci. Technol. 46, 3141–3148. doi:10.1021/es300138q
Moller, A., Xie, Z., Cai, M., Zhong, G., Huang, P., Cai, M., et al. (2011). Polybrominated diphenyl ethers vs alternate brominated flame retardants and Dechloranes from East Asia to the Arctic. Environ. Sci. Technol. 45, 6793–6799. doi:10.1021/es201850n
Morin, N. A. O., Andersson, P. L., Hale, S. E., and Arp, H. P. H. (2017). The presence and partitioning behavior of flame retardants in waste, leachate, and air particles from Norwegian waste-handling facilities. J. Environ. Sci. (China) 62, 115–132. doi:10.1016/j.jes.2017.09.005
Nipen, M., Vogt, R. D., Bohlin-Nizzetto, P., Borga, K., Mwakalapa, E. B., Borgen, A. R., et al. (2021). Spatial trends of chlorinated paraffins and dechloranes in air and soil in a tropical urban, suburban, and rural environment. Environ. Pollut. 292, 118298. doi:10.1016/j.envpol.2021.118298
Olukunle, O. I., Lehman, D. C., Salamova, A., Venier, M., and Hites, R. A. (2018). Temporal trends of dechlorane plus in air and precipitation around the North American Great Lakes. Sci. Total Environ. 642, 537–542. doi:10.1016/j.scitotenv.2018.05.268
Ren, N., Sverko, E., Li, Y. F., Zhang, Z., Harner, T., Wang, D., et al. (2008). Levels and isomer profiles of dechlorane plus in Chinese air. Environ. Sci. Technol. 42, 6476–6480. doi:10.1021/es800479c
Röhler, L., Bohlin-Nizzetto, P., Rostkowski, P., Kallenborn, R., and Schlabach, M. (2021). Non-target and suspect characterisation of organic contaminants in ambient air – Part 1: Combining a novel sample clean-up method with comprehensive two-dimensional gas chromatography. Atmos. Chem. Phys. 21, 1697–1716. doi:10.5194/acp-21-1697-2021
Schuster, J. K., Harner, T., Eng, A., Rauert, C., Su, K., Hornbuckle, K. C., et al. (2021b). Tracking POPs in global air from the first 10 Years of the GAPS network (2005 to 2014). Environ. Sci. Technol. 55, 9479–9488. doi:10.1021/acs.est.1c01705
Schuster, J. K., Harner, T., and Sverko, E. (2021a). Dechlorane plus in the global atmosphere. Environ. Sci. Technol. Lett. 8, 39–45. doi:10.1021/acs.estlett.0c00758
Shen, L., Reiner, E. J., Macpherson, K. A., Kolic, T. M., Sverko, E., Helm, P. A., et al. (2010). Identification and screening analysis of halogenated norbornene flame retardants in the Laurentian Great Lakes: Dechloranes 602, 603, and 604. Environ. Sci. Technol. 44, 760–766. doi:10.1021/es902482b
Shoeib, M., and Harner, T. (2002). Characterization and comparison of three passive air samplers for persistent organic pollutants. Environ. Sci. Technol. 36, 4142–4151. doi:10.1021/es020635t
Sverko, E., Tomy, G. T., Reiner, E. J., Li, Y. F., Mccarry, B. E., Arnot, J. A., et al. (2011). Dechlorane plus and related compounds in the environment: A review. Environ. Sci. Technol. 45, 5088–5098. doi:10.1021/es2003028
Tørseth, K., Aas, W., Breivik, K., Fjæraa, A. M., Fiebig, M., Hjellbrekke, A. G., et al. (2012). Introduction to the European Monitoring and Evaluation Programme (EMEP) and observed atmospheric composition change during 1972–2009. Atmos. Chem. Phys. 12, 5447–5481. doi:10.5194/acp-12-5447-2012
UNEP (2022). Report of the persistent organic pollutants review committee on the work of its seventeenth meeting: Risk profile for dechlorane plus.
UNEP (2020). Stockholm convention on persistent organic pollutants (POPs), in Texts and annexes. Revised in 2019. Châtelaine, Switzerland: Secretariat of the Stockholm Convention.
Wang, D. G., Yang, M., Qi, H., Sverko, E., Ma, W. L., Li, Y. F., et al. (2010). An Asia-specific source of dechlorane plus: Concentration, isomer profiles, and other related compounds. Environ. Sci. Technol. 44, 6608–6613. doi:10.1021/es101224y
Wania, F., and Shunthirasingham, C. (2020). Passive air sampling for semi-volatile organic chemicals. Environ. Sci. Process Impacts 22, 1925–2002. doi:10.1039/d0em00194e
Yu, Y., Hung, H., Alexandrou, N., Roach, P., and Nordin, K. (2015). Multiyear measurements of flame retardants and organochlorine pesticides in air in Canada's western sub-arctic. Environ. Sci. Technol. 49, 8623–8630. doi:10.1021/acs.est.5b01996
Zhang, Q. H., Zhu, C. F., Zhang, H. D., Wang, P., Li, Y. M., Ren, D. W., et al. (2015). Concentrations and distributions of Dechlorane Plus in environmental samples around a Dechlorane Plus manufacturing plant in East China. Science Bulletin 60, 792–797. doi:10.1007/s11434-015-0768-1
Keywords: passive air sampling (PAS), spatial distribution, flame retardant, background air, emerging contaminant
Citation: Skogeng LP, Lunder Halvorsen H, Breivik K, Eckhardt S, Herzke D, Moeckel C and Krogseth IS (2023) Spatial distribution of Dechlorane Plus and dechlorane related compounds in European background air. Front. Environ. Sci. 10:1083011. doi: 10.3389/fenvs.2022.1083011
Received: 28 October 2022; Accepted: 19 December 2022;
Published: 10 January 2023.
Edited by:
Ishwar Chandra Yadav, Tokyo University of Agriculture and Technology, JapanReviewed by:
Yan Wu, East China Normal University, ChinaCopyright © 2023 Skogeng, Lunder Halvorsen, Breivik, Eckhardt, Herzke, Moeckel and Krogseth. This is an open-access article distributed under the terms of the Creative Commons Attribution License (CC BY). The use, distribution or reproduction in other forums is permitted, provided the original author(s) and the copyright owner(s) are credited and that the original publication in this journal is cited, in accordance with accepted academic practice. No use, distribution or reproduction is permitted which does not comply with these terms.
*Correspondence: Lovise P. Skogeng, bG92aXNlc2tvZ2VuZ0BnbWFpbC5jb20=
Disclaimer: All claims expressed in this article are solely those of the authors and do not necessarily represent those of their affiliated organizations, or those of the publisher, the editors and the reviewers. Any product that may be evaluated in this article or claim that may be made by its manufacturer is not guaranteed or endorsed by the publisher.
Research integrity at Frontiers
Learn more about the work of our research integrity team to safeguard the quality of each article we publish.