- 1College of Geographic Science and Tourism, Xinjiang Normal University, Urumqi, China
- 2State Key Laboratory of Desert and Oasis Ecology, Xinjiang Institute of Ecology and Geography, Chinese Academy of Sciences, Urumqi, China
- 3Institute of Desert Meteorology, China Meteorological Administration, Urumqi, China
- 4Key Laboratory of Tree-ring Physical and Chemical Research, China Meteorological Administration, Urumqi, China
- 5National Observation and Research Station of Desert Meteorology, Taklimakan Desert of Xinjiang, Urumqi, China
- 6Xinjiang Key Laboratory of Desert Meteorology and Sandstorm, Urumqi, China
As one of the most vulnerable types of global ecosystems and water resource systems, arid regions are most sensitive to climate change. The Xinjiang (XJ) region is an important part of the arid region in Central Asia and is representative of global arid regions. The complex topography and underlying surface result in distinct climate change characteristics in XJ. In this study, XJ was divided into five sub-regions: the Irtysh River Basin (IRB), the economic belt on the northern slope of the Tianshan Mountains (NSTM), the Ili River Basin (ILRB), the Turpan-Hami Basin (THB), and the Tarim River Basin (TRB). The change in temperature and precipitation over XJ and its sub-regions were investigated from 1960 to 2019 using the Mann-Kendall method and cross-wavelet analysis. Moreover, the multi-timescale correlations between the variations in temperature and precipitation and the atmospheric circulation indices were explored. The results show significant warming and wetting trends in XJ from 1960 to 2019. The warming rate was 0.32°C/10 a (p < 0.01), with an abrupt change during the mid-1990s. The increasing rate of precipitation was 9.24 mm/10 a (p < 0.01), with an abrupt change during the middle to late 1990s. In terms of seasonal variation, the greatest warming rate was during winter (0.37°C/10 a), whereas the precipitation increase was concentrated in summer (3.48 mm/10 a). In terms of spatial variation, a significant warming trend was observed in THB, IRB, ILRB, and NSTM, and precipitation increased significantly in ILRB, NSTM, and the western TRB in southern XJ. The Hurst index analysis indicated that the warming and wetting trends in XJ will slow in the future. Climate change in XJ was closely related to atmospheric circulation at multiple timescales. The subtropical high, Northern-Hemisphere polar vortex activities and the Tibetan Plateau have a significant impact on climate change in XJ. The annual mean temperature in XJ was positively correlated with the area and intensity index of the subtropical high over North Africa, Atlantic, and North America, and negatively correlated with the area and intensity index of the Asia polar vortex. The XJ annual precipitation was positively correlated with the index of the Tibet Plateau Region one and negatively correlated with the intensity index of the Atlantic and European polar vortex, and the area and intensity index of the Northern Hemisphere polar vortex. The results of this study can provide some references for the scientific assessment and accurate prediction of climate change in XJ.
Introduction
The sixth assessment report of the Intergovernmental Panel on Climate Change (IPCC) suggested that the global average surface temperature during 2011–2020 had increased by 1.09°C from that in 1850–1900 (IPCC, 2022). Various hazards associated with global warming are increasing. Only when global warming is maintained within 1.5°C can the losses and damages to natural and human systems caused by the climate change can be reduced (Jiang et al., 2022). As the area with the most vulnerable ecosystem and water resource system, the arid region is the most sensitive area to global climate change.
The Xinjiang Uyghur Autonomous Region is located in the western arid region of Northwest China and the hinterland of the Eurasian continent. It is an essential part of the Central Asian arid region with little precipitation and a fragile ecological environment (Yao et al., 2020; Yao et al., 2022a). Its sensitivity to climate change increases with global warming (Chen et al., 2014; Yao et al., 2021), and it is a remarkable representative of the global arid region (Chen et al., 2015). Numerous studies have demonstrated “warming and wetting” trends during the past decades in Xinjiang (XJ) region (Yao et al., 2022b). A previous study found that both daytime and nocturnal precipitation increased in western China from 1990 to 2019 (Deng et al., 2022). Some studies have found a slightly decreasing trend in warming and wetting rates in XJ after 1997 (Yao et al., 2018). In combination with analysis of the standardized precipitation evapotranspiration index (SPEI), the transition from “warming and wetting” to “aridification” has been observed since 1997 (Yao et al., 2021). The interannual temperature and humidity configuration in XJ was mainly “warm-wet” and “warm-dry” during 1961–2019, but the “warm-dry” configuration will be more prominent in the future (Yao et al., 2022b). The climate in Central Asia tends to be wetter during the wet season and drier during the dry season (Ren et al., 2022). The trend of “warming and wetting” in XJ is projected to become more obvious in the future, but its arid and semi-arid characteristics will be maintained, and the frequency of hydrological droughts will relatively increase (Wang et al., 2021). Subtropical highs are also known as subtropical anticyclones (Li et al., 2012). The Northern Hemisphere subtropical high is usually divided into five parts: the Indian, Western Pacific, Eastern Pacific, and North African Atlantic Subtropical highs (Zhang et al., 2008). A polar vortex is a large vortex system located in the middle and upper polar troposphere and above the stratosphere. It can extend horizontally over middle and high latitudes (Liu L. et al., 2020). The high-latitude circulation system and atmospheric circulation in the Northern Hemisphere are strongly affected by changes in the polar vortex intensity and area (Li et al., 2017). The Tibetan Plateau is a large highland in the mid-latitude region of the Northern Hemisphere, which influences regional and global circulation and climate through mechanical and thermal effects (Duan et al., 2012; Liu Y. J. et al., 2020). The above studies mainly focused on the changes in temperature and precipitation over XJ, whereas information regarding atmospheric circulation indices affecting climate change remains scarce.
Based on the temperature and precipitation datasets of XJ from 1960 to 2019 and the atmospheric circulation indices, this study investigated the latest changes in temperature and precipitation in five sub-regions of XJ based on the expedition zones of the Third XJ Scientific Expedition and Research Program. The multi-timescale correlations between the temperature and precipitation, and the atmospheric circulation indices were also explored in this study. This study can provide some references for the construction of an ecological civilization in XJ and to improve its ability to deal with various climate hazards caused by future climate change.
The remainder of this paper is organized as follows: Section 2 introduces the data and methods. Section 3 shows the variation trends in temperature and precipitation in XJ over the past 60 years and predicts future trends. In addition, the correlations between climate change in XJ and atmospheric circulation factors are also analyzed in Section 3. Discussions are presented in Section 4, and the conclusions are presented in Section 5.
Data and methods
Study area
XJ is located in the arid region of Northwest China. The basins and mountains are distributed alternately in XJ, forming a unique and complex topographic structure. XJ has an arid climate with an average annual temperature of 10°C–15°C and an average annual precipitation of less than 150 mm (Li et al., 2011). It is highly sensitive to global warming and the ecological environment in this region is very fragile.
According to topography, XJ is divided by the Tianshan Mountains into northern and southern XJ, resulting in three major sub-regions: northern XJ, Tianshan Mountains, and southern XJ (Reziwanguli et al., 2016; Kang et al., 2018; Wu et al., 2020). Several studies have divided XJ into mountainous, oasis, and desert areas (Chen et al., 2005; Zhang et al., 2021), and obtained some beneficial conclusions about the climate of XJ. For extremely arid XJ, water is a fundamental natural and strategic economic resource, and it is also the lifeblood of XJ’s high-quality social and economic development. The watershed, as the main carrier of water resources in XJ, connects the natural elements in the watershed into a whole river. Human activities are primarily performed in watersheds. However, few studies have considered the watershed as a unit for conducting research on climate change in XJ. Based on the distribution of major watersheds and water systems in XJ, and also in terms of the expedition zones of the Third XJ Scientific Expedition and Research Program, we divided XJ into five sub-regions: the Irtysh River Basin (IRB), the economic belt on the northern slope of the Tianshan Mountains (NSTM), the Ili River Basin (ILRB), the Turpan-Hami Basin (THB), and the Tarim River Basin (TRB) (Figure 1). Within the IRB, the Irtysh River is the only river in China that flows into the Arctic Ocean. It originates from the southwestern slope of the Altai Mountains in China, and its water volume ranks second in XJ following the Ili River (Liu et al., 2017; Wang et al., 2022). The NSTM consists of small- and medium-sized rivers and is the most economically developed area in XJ, with the sharpest contradiction between the supply and demand of water resources (Sun et al., 2022). In the ILRB, the Ili River originates in the Tianshan Mountains and eventually joins Balkhash Lake, and is the river with the largest water volume in XJ (Liu et al., 2022). The THB is among the most arid basins in XJ and is rich in wind and solar energy but extremely limited in water resources (Fang et al., 2010). The TRB is located in southern XJ, between the Tianshan and Kunlun Mountains, and is the largest inland river basin in China (Xue et al., 2022).
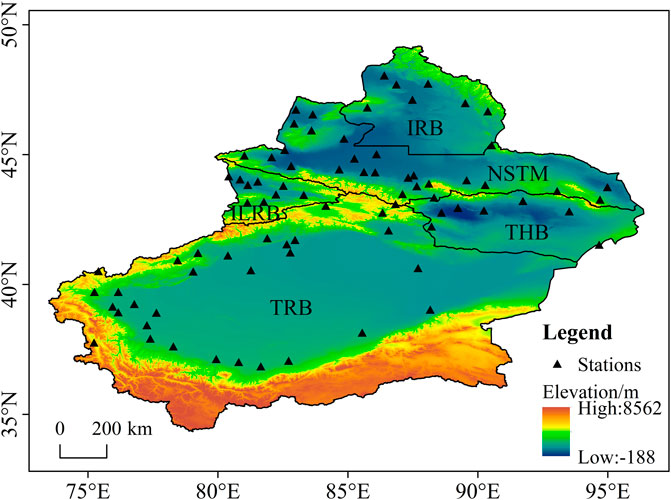
FIGURE 1. Study area and the distribution of meteorological stations. (The Irtysh River Basin, the economic belt on the northern slope of the Tianshan Mountains, the Ili River Basin, the Turpan-Hami Basin, and the Tarim River Basin are marked as IRB, NSTM, ILRB, THB, and TRB, respectively).
Data sources
The daily average temperature and precipitation data in XJ from 1960 to 2019 were provided by the China Meteorological Administration (CMA, http://data.cma.cn/en). To ensure the continuity of data, some meteorological stations with missing data on temperature and precipitation were excluded, and 80 meteorological stations were finally selected for the analysis in this study (Figure 1). Seventy-four atmospheric circulation indices were obtained from the National Climate Center of China Meteorological Administration (https://cmdp.ncc-cma.net/cn), with seven indices excluded from practical use due to missing data from June to September.
Methodology
In this study, the variation trends in temperature and precipitation in XJ and its subregions over the past 60 years were analyzed using the linear regression method. The Mann-Kendall method was used to detect abrupt change years and tendencies of climate sequences, and R/S analysis was applied to predict future variations in temperature and precipitation (Ding et al., 2018; Fang et al., 2022). The Pearson correlation analysis method was used to analyze the correlation between the atmospheric circulation index and climate factors in XJ, and the atmospheric circulation index with strong positive and negative correlations was selected. Cross-wavelet analysis was used to analyze the periodic characteristics of the climate factors and atmospheric circulation indices.
The cross wavelet transform (XWT) highlights the interrelationship among temperature, precipitation, and atmospheric circulation indices in high-energy regions (Grinsted et al., 2004; Hu et al., 2021). Wavelet transform coherence (WTC) shows this interrelationship in the low-energy region. The thin black arcs in XWT and WTC indicate the cone of influence of the wavelet boundary effect, and the thick black solid line indicates a significant correlation between the two, which passed the red noise test with a confidence level of 95%. The symbol “←” (“→”) indicates that the climate and atmospheric circulation factors are negatively (positively) correlated. The symbol “↓” (“↑”) denotes that the climate factor is 90° ahead of (behind) the variations in the atmospheric circulation factor (Liu et al., 2021).
Results
Trends of temperature and precipitation in XJ
The annual mean temperature in XJ during 1960–2019 showed a significant increasing trend with a warming rate of 0.32°C/10 a (p < 0.01), which is higher than the average in China (Zhao et al., 2020) (Figure 2A). The results of the Mann-Kendall test showed that the temperature changed abruptly in 1994 (Figure 2C). After the abrupt change, the multi-year average temperature increased by 1.08°C. The cumulative anomaly analysis showed that the annual mean temperature experienced a decreasing trend from 1960 to 1996 and an increasing trend from 1997 to 2019, with 1996 being the turning point (Figure 2E). Considering the results of the two methods, the annual mean temperature in XJ was concluded to have changed abruptly in the mid-1990s.
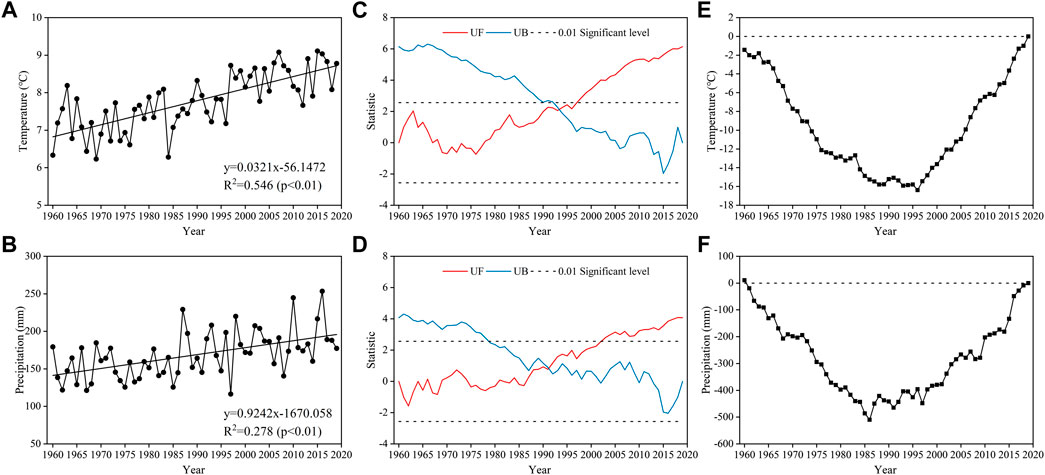
FIGURE 2. Variation trends in (A) annual mean temperature and (B) annual precipitation in XJ. The Mann-Kendall mutation detection on (C) annual mean temperature and (D) annual precipitation. The cumulative anomaly analysis of (E) annual mean temperature and (F) annual precipitation.
The annual precipitation in XJ shows a significant increasing trend from 1960 to 2019 with a wetting rate of 9.24 mm/10 a (p < 0.01), which is slightly lower than the average in China (Zhao et al., 2020) (Figure 2B). The results of Mann-Kendall showed that an abrupt change in precipitation occurred in 1991 (Figure 2D). After the sudden change, the multi-year average annual precipitation increased by 29.48 mm. The cumulative anomaly analysis showed that the annual precipitation in XJ experienced a decreasing trend from 1960 to 1986 and an increasing trend from 1987 to 2019, with 1986 being the turning point (Figure 2F). Considering the results of the two methods, the annual precipitation was concluded to have changed abruptly in the mid-late 1980s.
Temperature and precipitation in XJ showed significant increasing trends in all seasons. The warming rates for the four seasons were 0.36°C/10 a, 0.24°C/10 a, 0.32°C/10 a and 0.37°C/10 a, respectively, all of which have passed the significance test at the 99% significance level (Table 1). The most significant warming trend in XJ occurred in winter. Among the subregions, the most significant warming trend was observed in the THB. In spring, the most significant warming occurred in the IRB; in summer, it was in the ILRB and THB; in autumn, it was in the THB; and in winter, it was in the IRB. The wetting rates in XJ in the four seasons were 1.82, 3.48, 2.11, and 1.84 mm/10 a, respectively. The wetting trends of all seasons passed the significance test at the 99% significance level (Table 2). The maximum increase in precipitation in XJ occurred in the summer. The subregion with the most significant increasing trend in annual precipitation was IRB. The increasing trend of precipitation was remarkable in the NSTM during spring, TRB during summer, and IRB during autumn and winter.

TABLE 1. Variation trends of annual and seasonal temperature in XJ and its sub-regions (°C/10 a), and the results of significance tests.

TABLE 2. Variation trends of annual and seasonal precipitation in XJ and its sub-regions (mm/10 a), and the results of significance tests.
Spatial distributions of the variation trends in temperature and precipitation in XJ
More than 98% of the stations in XJ showed warming and wetting trends from 1960 to 2019. The subregions with significant warming were concentrated in IRB, NSTM, ILRB, and THB (Figure 3A). The warming trend was most pronounced at the Shisanjianfang station of the THB, with a warming rate of 0.82°C/10 a. The Kuqa and Aketao stations in the TRB showed a decreasing trend in temperature with variation rates of −0.09°C/10 a and −0.03°C/10 a, respectively. The increase in precipitation was more pronounced in the IRB, NSTM, ILRB, and western regions of the TRB (Figure 3B). The most significant precipitation increase was observed in Urumqi on the NSTM, with a wetting rate of 24.95 mm/10 a. The precipitation in Shisanjianfang and Turpan stations in THB showed a decreasing trend, with variation rates of −2.86 and −0.31 mm/10 a, respectively.
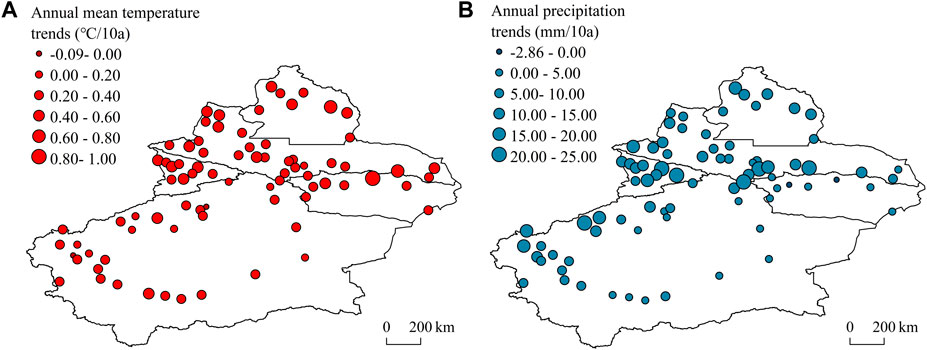
FIGURE 3. Spatial distributions of the variation trends in annual mean temperature (A) and precipitation (B) in XJ and its subregions.
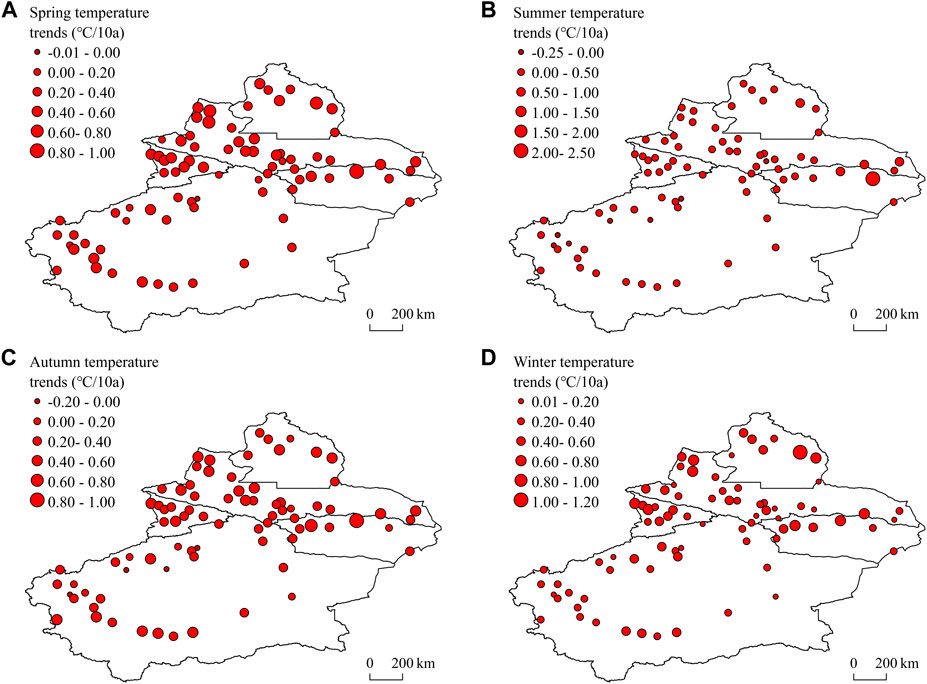
Obvious regional differences were observed in seasonal warming in the sub-regions of XJ. In spring, summer, and autumn, the warming rate was the highest in the IRB. In winter, the greatest warming occurred mainly in the ILRB and THB. In terms of spatial differences, the most significantly warmed areas were mainly in the THB. The greatest warming rates were recorded at Shisanjianfang station in the THB (0.84°C/10 a and 0.90°C/10 a, respectively) in spring and autumn (Figure 4A,C); Hami (2.26°C/10 a) in summer (Figure 4B); and Fuyun station in the IRB (1.11°C/10 a) in winter (Figure 4D).
Regional differences in precipitation were also noted among the sub-regions of XJ. In summer, autumn, and winter, the largest wetting rates were observed in the ILRB. In summer, the sub-regions with the greatest precipitation increase were mainly in the ILRB and western TRB. In terms of stations, the most significant precipitation increase was mainly in the NSTM. In summer (Figure 5B), the largest wetting rate was observed at Daxigou station (12.89 mm/10 a); in spring (Figure 5A), at Tianchi station (10.75 mm/10 a); in autumn (Figure 5C), at Aheqi station (7.16 mm/10 a) in the TRB; and in winter (Figure 5D), at Yining (6.84 mm/10 a) in the ILRB.
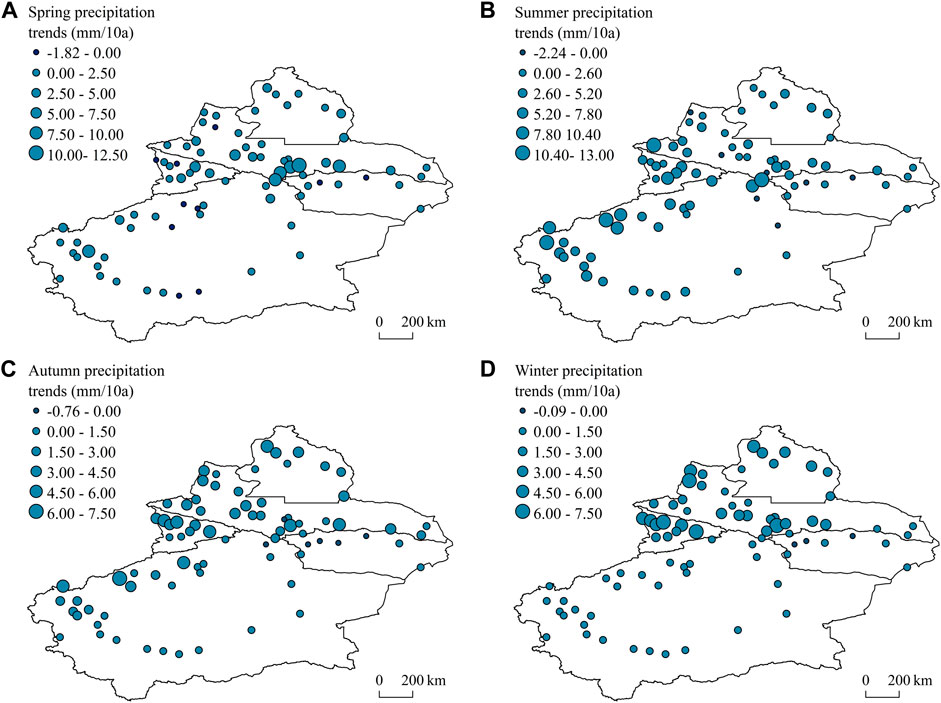
FIGURE 5. Variation trends in precipitation during different seasons (A–D) in XJ and its subregions.
Trend prediction of potential climate change in XJ
The aforementioned analysis shows significant increasing trends of both annual mean temperature and annual precipitation in XJ and its subregions over the last 60 years. The results of the R/S analysis indicate that the Hurst indices of the annual mean temperature and precipitation in XJ and the subregions are both <0.5, presenting a decreasing trend in the future (Table 3). In the five subregions of XJ, the most significant decrease in annual mean temperature is predicted in the TRB, and the most significant decrease in annual precipitation is predicted in the THB. Analysis of the Hurst index indicates that warming and wetting in XJ will slow down in the future.
Cross-wavelet analysis of the climate change and atmospheric circulation indices
The key atmospheric circulation indices affecting climate change in XJ were selected by analyzing the correlations of temperature and precipitation with the atmospheric circulation indices (Table 4). The results showed that the subtropical high, polar vortex, Tibetan Plateau index, and other related circulation indices had significant effects on climate change in XJ. The indices with the most significant correlation and physical significance were selected. Temperature showed a significant and positive correlation with the area index of the subtropical high over North Africa, Atlantic, and North America (AISHNA) and its intensity index (IISHNA) (Figure 6A), whereas it was significantly and negatively correlated with the area index of the Asia polar vortex (AIAPV) and its intensity index (IIAPV) (Figure 6B). The annual precipitation showed a significant and positive correlation with the index of the Tibetan Plateau Region 1 (ITPR 1) (Figure 6C), and a significant and negative correlation with the intensity index of the Atlantic-European Polar Vortex (IIAEPV), the area index of the Northern Hemisphere Polar Vortex (AINHPV) and its intensity index (IINHPV) (Figure 6D).
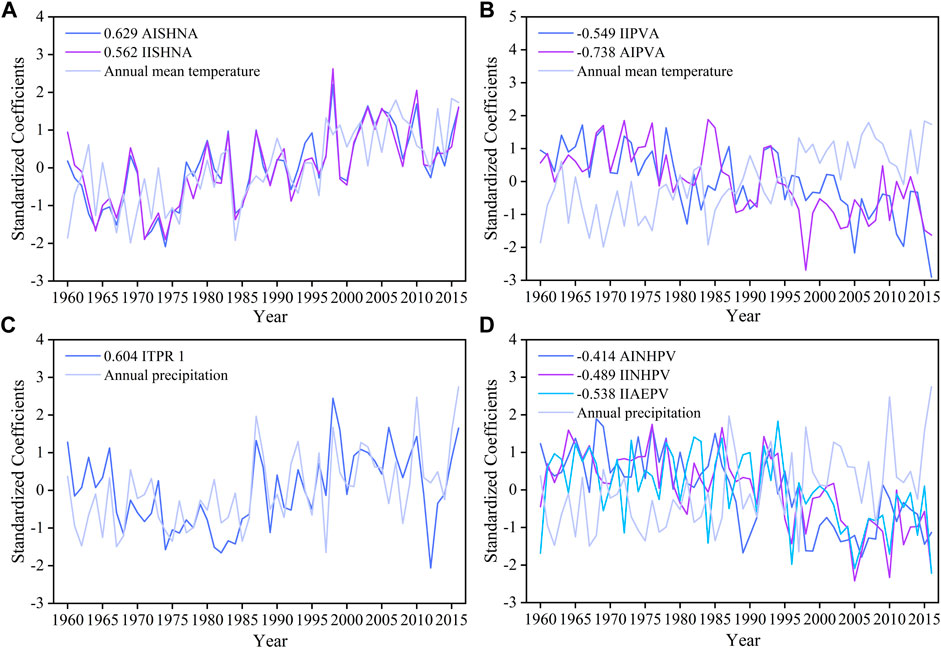
FIGURE 6. Time series of the key atmospheric circulation indices and annual mean temperature (A,B) and precipitation (C,D) in XJ.
Cross-wavelet analysis was performed to reveal the relationships between temperature/precipitation variations and key atmospheric circulation indices, such as subtropical high, polar vortex, and Tibet Plateau. Moreover, multi-timescale correlations between climate change and contemporaneous atmospheric circulation are discussed. The XWTs of temperature to AISHNA and IISHNA were consistent, both showing a significant resonance period at 1.5–4 a, which passed the significance test in 1980–1999 (Figures 7A, C). The WTC revealed that the significance of the two is greater in the low-energy region than in the high-energy region, and the coherence in 1981–2002 was extremely strong at the quasi-4a scale (Figures 7B, D). The XWT of temperature to IIPVA showed that they have a significant resonance period at the quasi-2a scale and have passed the significance test in 1964–1969 and 1981–1985 (Figure 7E). The XWT of temperature to AIPVA demonstrated a significant resonance period at 8–10 a scale, and they have a significant negative correlation. The WCT of the two showed extremely strong correlations at the 3–5 a scale for 1978–1988 and 1990–2001, and at the 6.5–14 a scale for 1978–2003 (Figures 7G, H).
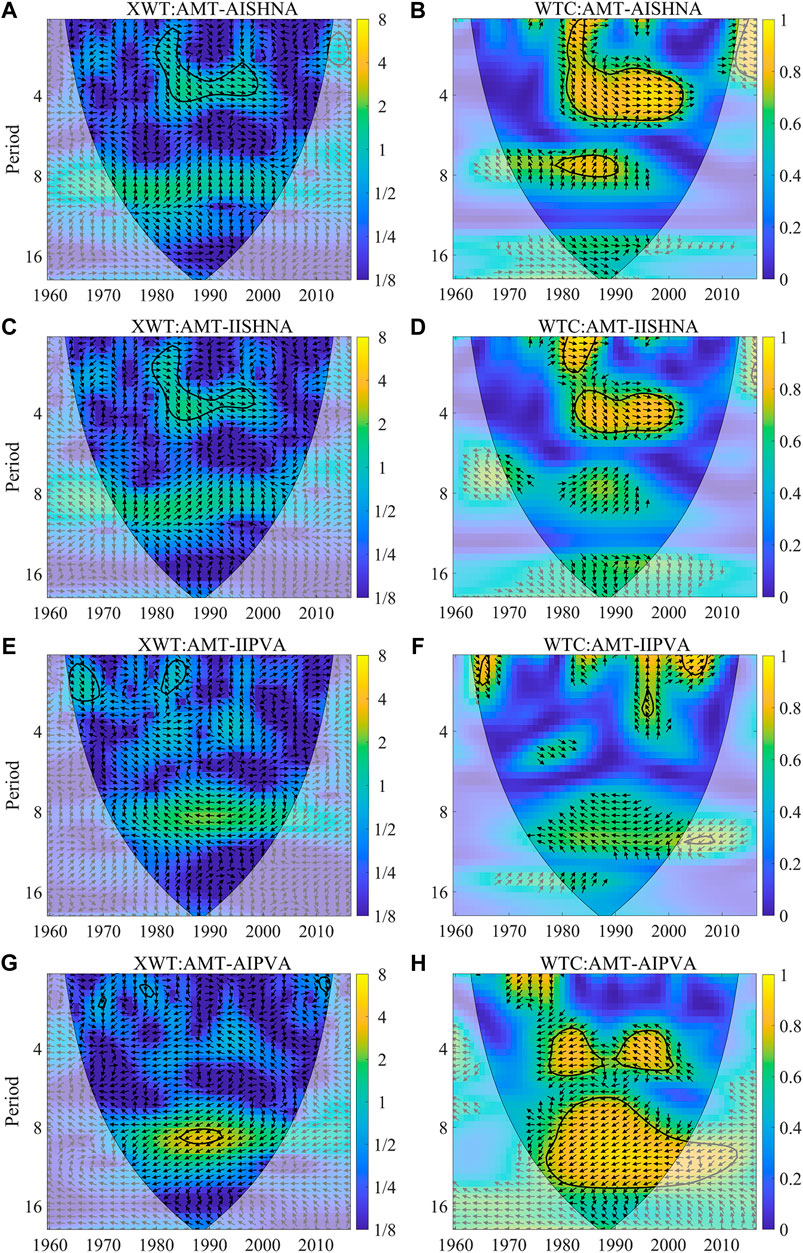
FIGURE 7. XWT and WCT of the annual mean temperature (A–H) in XJ to the area index of the subtropical high over North Africa, Atlantic, and North America (AISHNA), the intensity index of the subtropical high over North Africa, Atlantic, and North America (IISHNA), the intensity index of the polar vortex in Asia (IIPVA), and the index area of Asia polar vortex (AIPVA).
A positive-phase quasi-2a resonance period existed in the high-energy region of the XWT between the precipitation variations in the XJ and ITPR 1 (Figure 8A). The XWT of the precipitation variation in XJ to AINHPV had resonance periods of 2–3 and 1–2.5 a in the high-energy region (Figure 8C) and 1–3 and 6–7 a in the low-energy region (Figure 8D). In addition, the XWT of the precipitation variation in XJ to IIPVNH had negative-phase resonance periods at 2.5–4 and 1–3 a in the high-energy region (Figure 8E) and at 1–3 a resonance period in the low-energy region (Figure 8F). The XWT of the precipitation variation in XJ to IIAEPV had negative-phase resonance periods at 2–4 and 1–3 a (Figure 8G). The above analysis further confirmed that the variations in temperature and precipitation in XJ were closely related to the anomalies of key circulation indices such as the subtropical high, polar vortex, and Tibet Plateau. These results could provide an important reference for the prediction of climate change in XJ.
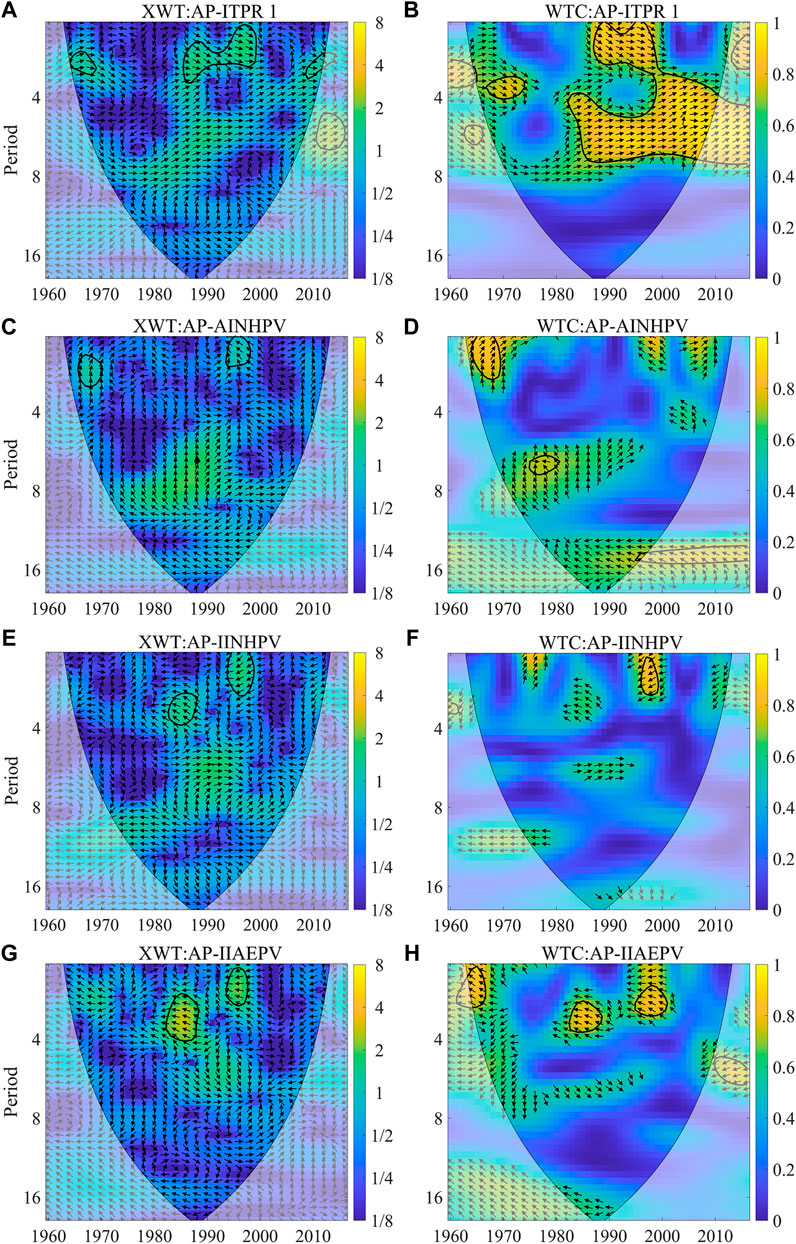
FIGURE 8. XWT and WCT of the annual precipitation (A–H) in XJ to the index of the Tibet Plateau Region 1 (ITPR 1), the area index of the Northern Hemisphere Polar Vortex (AINHPV), the intensity index of the Northern Hemisphere Polar Vortex (IINHPV), and the intensity index of the Atlantic-European PolarVortex (IIAEPV).
Discussions
This study further confirms the warming and wetting trends in XJ (Reziwanguli et al., 2016; Kang et al., 2018; Wu et al., 2020) and its subregions according to the watersheds. These subregions are consistent with the expedition zones of the Third XJ Scientific Expedition and Research Program implemented by the Ministry of Science and Technology of China in 2021. The climate change characteristics of each subregion are presented in detail in this study. The results revealed significant warming trends in the THB, IRB, ILRB, and NSTM, whereas the precipitation increased significantly in the ILRB, NSTM, and western TRB in southern XJ. The Hurst index analysis indicated that both temperature and precipitation will decrease in XJ in the future, and the decreasing rate of precipitation would be more pronounced. A warm-dry trend is speculated to appear in XJ in the future. It is consistent with the “wet–dry transition” of XJ proposed by Yao et al. (2018); Yao et al. (2022a), but not completely consistent with the results reported by Guan et al. (2022), which were projected using CMIP6. Their results suggested that the extreme climate change in the 21st century will continue the change trend from 1961 to 2014, that is, both extreme warm and precipitation events will increase (Guan et al., 2022). The uncertainty of future climate change remains owing to anomalous changes in future atmospheric circulation indices.
XJ is in the mid-latitude region of the Northern Hemisphere and is mainly influenced by changes in mid-high latitude atmospheric circulation systems (Yao et al., 2022a). The polar vortex is the main atmospheric circulation system that dominates the Northern Hemisphere in winter. In last 60 years, the interdecadal variation in the polar vortex has been evident, and it has significantly decreased in size and intensity since the 1980s. The area and intensity index of the Asia polar vortex are closely related to the temperature in Central Asia, and the weakening of the Asian polar vortex and the reduction in its area are among the reasons for the changes in temperature in Central Asia (Yao et al., 2014). The polar vortex in the Northern Hemisphere also has a strong correlation with winter temperature in XJ. The winter temperature is high when the polar vortex index is low (Shen et al., 2012; Zhang et al., 2020). The strong westerly winds in the Northern Hemisphere are accompanied by a decrease in the meridional degree of mid- and high-latitude circulations, which may lead to high average winter temperatures in XJ (Chen et al., 2019). The increase in winter temperature contributes to warming in XJ. The IRB is in a high-latitude area and is close to the influence area of polar vortex activity, which leads to fast winter warming in the IRB. The findings of this study further confirm the periodic correlation between the polar vortex and temperature in XJ at multiple timescales, which can provide a reference for temperature forecasting and prediction in XJ.
The atmospheric circulation indices affecting the precipitation change in XJ and the physical mechanisms involved are complex. The precipitation change in XJ is not only influenced by the polar vortex activities at high latitudes but is also related to the low latitude circulation and the thermal–dynamical effects of the Tibetan Plateau (Zhao et al., 2018). A significant negative correlation was found between the Atlantic–European polar vortex area and summer precipitation in the TRB. When the polar vortex is small, the westerly jet weakens in central and western Asia, and the TRB experiences more summer precipitation (Li et al., 2017). The West Asia westerly jet connects the high-, mid-, and low-latitude circulation systems. summer precipitation in XJ is influenced by the North Atlantic oscillation and Indian monsoons. When the West Asia westerly jet weakens, summer precipitation in XJ tends to increase (Yang et al., 2018). The TPI is large in May, and the low-latitude circulation configuration and water vapor transport favor precipitation in northern XJ (Zhou et al., 2018).
Based on an analysis of climate change characteristics and future trends in XJ, this study investigated the correlation between atmospheric circulation indices and climate factors. However, the multi-model ensembles in CMIP6 should be used in future studies to predict future climate change under the scenarios of human socio-economic changes and to analyze the hazard risks arising from future climate change. Atmospheric circulation indices have complex effects on climate change. Therefore, future climate change in XJ will have different responses to global warming. The formation and evolution mechanisms and degree of impact of extreme climate events caused by atmospheric circulation anomalies need to be further studied.
Conclusion
Based on the observation data from 80 meteorological stations in XJ, this study analyzed the climate change in XJ and its five subregions and explored the relationships between climate change in XJ and atmospheric circulation indices. The main results are as follows: The annual mean temperature in XJ showed an increasing trend from 1960 to 2019, with a warming rate of 0.32°C/10 a, and an abrupt change occurring in 1994–1996. The temperature also increased during all seasons, with the greatest warming occurring in winter. Significant warming trends were recorded in the THB, IRB, ILRB, and NSTM. The Hurst Index indicated that the annual mean temperature in XJ will show a weak decreasing trend in the future.
The precipitation in XJ showed an increasing trend from 1960 to 2019, with a wetting rate of 9.24 mm/10 a, and an abrupt change occurring in 1986–1991. The precipitation in XJ also showed an increasing trend in all four seasons, with the greatest increase in summer. Precipitation increased significantly in the ILRB, NSTM, and the western side of the TRB in southern XJ. Analysis of the Hurst Index indicated a strong decreasing trend in annual precipitation, with the greatest decrease in the THB.
The subtropical high, Northern Hemisphere polar vortex activities, and the Tibetan Plateau have a significant impact on climate change in XJ. The annual mean temperature in XJ was positively correlated with AISHNA and IISHNA, and negatively correlated with AIPVA and IIPVA. Moreover, their resonance periods were 1.5–4, 1.5–4, 1–2.5, and 8–10 a, respectively. The XJ annual precipitation was positively correlated with the ITPR 1, and negatively correlated with the IIAEPV, IINHPV, and AINHPV, with the resonance periods at 1–3.5, 1–2.5, 2.5–4, and 2–4 a, respectively.
Data availability statement
The original contributions presented in the study are included in the article/supplementary material, further inquiries can be directed to the corresponding authors.
Author contributions
GZ performed the analysis and wrote the manuscript. YC reviewed and edited the manuscript. JY contributed to the conception and design of the study, visualization and reviewed the manuscript.
Funding
This work was funded by the National Natural Science Foundation of China (U1903113, 42171038); and the Third Xinjiang Scientific Expedition Program (Grant No. 2022xjkk0101).
Conflict of interest
The authors declare that the research was conducted in the absence of any commercial or financial relationships that could be construed as a potential conflict of interest.
Publisher’s note
All claims expressed in this article are solely those of the authors and do not necessarily represent those of their affiliated organizations, or those of the publisher, the editors and the reviewers. Any product that may be evaluated in this article, or claim that may be made by its manufacturer, is not guaranteed or endorsed by the publisher.
References
Chen, X., Luo, G. P., Xia, J., Zhou, K. F., Lou, S. P., and Ye, M. Q. (2005). Ecological response to the climate change on the northern slope of the Tianshan Mountains in Xinjiang. Sci. China Ser. D-Earth Sci. 48, 765–777. doi:10.1360/04yd0050
Chen, Y., and Jiazila, B. (2019). Annual variation of winter temperature and its causes in Xinjiang. Arid. Land Geo 42 (2), 223–231. doi:10.12118/j.issn.1000-6060.2019.02.01
Chen, Y. N., Li, Z., Fan, Y. T., Wang, H. J., and Fang, G. H. (2014). Research progress on the impact of climate change on water resources in the arid region of Northwest China. Acta. Geogr. Sin. 69 (9), 1295–1304. doi:10.11821/dlxb201409005
Chen, Y. N., Li, Zhi., Fan, Y. T., Wang, H. J., and Deng, H. J. (2015). Progress and prospects of climate change impacts on hydrology in the arid region of northwest China. Environ. Res. 139, 11–19. doi:10.1016/j.envres.2014.12.029
Deng, H., Pepin, N. C., Chen, Y., Guo, B., Zhang, S., Zhang, Y., et al. (2022). Dynamics of diurnal precipitation differences and their spatial variations in China. J. Appl. Meteorol. Clim. 61 (8), 1015–1027. doi:10.1175/JAMC-D-21-0232.1
Ding, Z. Y., Lu, R. J., Liu, C., and Duan, C. X. (2018). Temporal change characteristics of climatic and its relationships with atmospheric circulation patterns in Qinghai Lake Basin. Adv. Earth Sci. 33 (3), 281–292. doi:10.11867/j.issn.1001-8166.2018.03.0281
Duan, A. M., Wu, G. X., Liu, Y. M., Ma, Y. M., and Zhao, P. (2012). Weather and climate effects of the Tibetan plateau. Adv. Atoms. Sci. 29 (5), 978–992. doi:10.1007/s00376-012-1220-y
Fang, S., Pei, H., Liu, Z. H., Keith, B., and Wei, Z. C. (2010). Water resources assessment and regional virtual water potential in the turpan basin, China. Water Resour. Manage 24, 3321–3332. doi:10.1007/s11269-010-9608-x
Fang, X., Liu, X. K., and Yue, D. P. (2022). Analysis of climate change characteristics and influencing factors in Mu Us sandy land from the 1960-2018. Res. Soil Water Conserv. 29 (2), 163–169.
Grinsted, A., Moore, J. C., and Jevrejeva, S. (2004). Application of the cross wavelet transform and wavelet coherence to geophysical time series. Nonlinear Proc. geoph. 11 (5/6), 561–566. doi:10.5194/npg-11-561-2004
Guan, J., Yao, J., Li, M., Li, D., and Zheng, J. (2022). Historical changes and projected trends of extreme climate events in Xinjiang, China. China. Clim. dynam. 59 (5-6), 1753–1774. doi:10.1007/s00382-021-06067-2
Hu, W., Yao, J., He, Q., and Chen, J. (2021). Changes in precipitation amounts and extremes across Xinjiang (northwest China) and their connection to climate indices. PeerJ 9, e10792. doi:10.7717/peerj.10792
IPCC (2022). Climate change 2022: Impacts, adaptation and vulnerability. Summary for policymakers. Cambridge, UK: Cambridge University Press.
Jiang, T., Zhai, J. Q., Luo, Y., Su, B. D., Chao, Q. C., Wang, Y. J., et al. (2022). Understandings of assessment reports on climate change impacts, adaptation and vulnerability: Progress from IPCC AR5 to IPCC AR6. Trans. Atmos. Sci. 45 (4), 502–511. doi:10.13878/j.cnki.dqkxxb.20220529013
Kang, L. J., Batur, B., Luo, N. N., Xue, Y. R., and Wang, M. H. (2018). Spatial-temporal variations of temperature and precipitation in Xinjiang from 1961 to 2013. Xinjiang Agric. Sci. 55 (1), 123–133. doi:10.6048/j.issn.1001-4330.2018.01.014
Li, H. J., and Ma, Y. F. (2017). Impacts of the regional north polar vortex anomalies on summer precipitation of the Tarim river basin. J. Appl. Meteor. Sci. 28 (05), 589–599. doi:10.11898/1001-7313.20170507
Li, Q. H., Chen Y, N., Shen, Y. J., Li, X. G., and Xu, J. H. (2011). Spatial and temporal trends of climate change in Xinjiang, China. J. Geogr. Sci. 21 (6), 1007–1018. doi:10.1007/s11442-011-0896-8
Li, W. H., Li, L. F., Ting, M. F., and Li, Y. M. (2012). Intensification of Northern Hemisphere subtropical highs in a warming climate. Nat. Geosci. 5, 830–834. doi:10.1038/ngeo1590
Liu, J. Q., and Wu, S. L. (2017). Variation characteristics of diurnal temperature and influence factor of Irtysh river in Xinjiang. J. Soil Water Conserv. 31 (4), 351–356. doi:10.13870/j.cnki.stbcxb.2017.04.055
Liu, L., Guan, J. Y., Mu, C., Han, W. Q., Qiao, X. L., and Zheng, J. H. (2022). Spatio-temporal characteristics of vegetation net primary productivity in the Ili River Basin from 2008 to 2018. Acta Ecol. Sin. 42 (12), 4861–4871. doi:10.5846/stxb202104251084
Liu, L., Zhang, W. J., Lu, Q. F., and Wang, G. X. (2020a). Variations in the sensible heating of Tibetan plateau and related effects on atmospheric circulation over south Asia. Asia-Pac. J. Atmos. Sci. 57 (3), 499–510. doi:10.1007/s13143-020-00207-0
Liu, Y. J., Wei, Z. G., Chen, G. Y., Liu, Y. J., Zhu, X., and Zheng, Z. Y. (2020b). Shift of the Arctic polar vortex in recent decades and its simulation by the NCEP CFSv2. Phys. Chem. Earth. 115, 102823. doi:10.1016/j.pce.2019.102823
Liu, Y. T., Xue, G. L., Yang, Z., Ren, X. Z., Yang, X. C., and Li, A. J. (2021). Variation of extreme temperature and its association with climate indices in Anhui province during the past 56 year. Res. Soil Water Conserv. 28 (2), 248–255. doi:10.13869/j.cnki.rswc.2021.02.035
Ren, Y., Yu, H., Liu, C., He, Y., Huang, J., Zhang, L., et al. (2022). Attribution of dry and wet climatic changes over central Asia. J. Clim. 35 (5), 1399–1421. doi:10.1175/JCLI-D-21-0329.1
Reziwanguli, M., Yang, J. J., Liu, Y. Q., Guo, Y. C., and He, X. M. (2016). Characteristics of changes in temperature and precipitation in Xinjiang in recent 54 years. Res. Soil Water Conserv. 23 (2), 128–133. doi:10.13869/j.cnki.rswc.2016.02.024
Shen, B. Z., Lian, Y., Zhang, S. X., and Li, S. F. (2012). Impacts of arctic oscillation and polar vortex anomalies on winter temperature over eurasian continent. Adv. Clim. Change Res. 8 (6), 434–439. doi:10.3969/j.issn.1673-1719.2012.06.007
Sun, G. L., Lu, H. Y., Yu, M. Z., Yan, X. R., Zhen, X., and Zhang, Y. M. (2022). Ecological vulnerability spatial-time distribution and driving forces analysis in the economic belt on the northern slope of Tianshan Mountains. Southwest China J. Agric. Sci. 1-12. [2022-10-20].
Wang, D., Zhang, S., Wang, G., Liu, Y., Wang, H., and Gu, J. (2022). Reservoir regulation for ecological protection and remediation: A case study of the Irtysh River Basin, China. Int. J. Environ. Res. Public Health. 19, 11582. doi:10.3390/ijerph191811582
Wang, Z. Q., Gao, X. J., Tong, Y., Han, Z. Y., and Xu, Y. (2021). Future climate change projection over Xinjiang based on an ensemble of regional climate model simulations. Chin. J. Atmos. Sci. 45 (2), 407–423. doi:10.3878/j.issn.1006-9895.2006.20108
Wu, X. L., Zhang, T. X., Wang, H., Yu, X. J., Zheng, X. N., and Li, H. Y. (2020). Characteristics of temperature and precipitation change in Xinjiang during 1961-2017. Desert Oasis Meteor 14 (4), 27–34. ( in Chinese). doi:10.12057/j.issn.1002-0799.2020.04.004
Xue, L. Q., Bai, Q. Y., and Lui, Y. H. (2022). Study on the Propagationof meteorological-hydrological drought in Tarim River Basin under the impact of human activities. Water Resour. Prot. 1-10. [2022-10-22].
Yang, L. M., Guan, X. F., and Zhang, Y. X. (2018). Atmospheric circulation characteristics of precipitation anomaly in arid regions in central Asia. Arid. Zone Res. 35 (2), 249–259. doi:10.13866/j.azr.2018.02.01
Yao, J. Q., Chen, Y. N., Guan, X. F., Zhao, Y., Chen, J., and Mao, W. Y. (2022a). Recent climate and hydrological changes in a mountain-basin system in Xinjiang, China. Earth-sci Rev. 226, 103957. doi:10.1016/j.earscirev.2022.103957
Yao, J. Q., Chen, Y. N., Zhao, Y., Guan, X. F., Mao, W. Y., and Yang, L. M. (2020). Climatic and associated atmospheric water cycle changes over the Xinjiang, China. J. Hydrol. 585, 124823. doi:10.1016/j.jhydrol.2020.124823
Yao, J. Q., Li, M. Y., Tuoliewubieke, D., Chen, J., and Mao, W. Y. (2022b). The assessment on "warming-wetting" trend in Xinjiang at multi-scale during 1961-2019. Arid. Zone Res. 39 (2), 333–346. doi:10.13866/j.azr.2022.02.01
Yao, J. Q., Liu, Z. H., Yang, Q., Liu, Y., Li, C. Z., and Hu, W. F. (2014). Temperature variability and its possible causes in the typical basins of the arid Central Asia in recent 130 years. Acta. Geogr. Sin. 69 (3), 291–302. doi:10.11821/dlxb201403001
Yao, J. Q., Mao, W. Y., Chen, J., and Tuoliewubieke, D. (2021). Signal and impact of wet-to-dry shift over Xinjiang, China. Acta. Geogr. Sin. 76 (1), 57–72. doi:10.11821/dlxb202101005
Yao, J., Zhao, Y., Chen, Y., Yu, X., and Zhang, R. (2018). Multi-scale assessments of droughts: A case study in Xinjiang, China. Sci. Total Environ. 630, 444–452. doi:10.1016/j.scitotenv.2018.02.200
Zhang, H. D., Jin, R. H., and Zhang, Y. S. (2008). Relationships between summer northern polar vortex with sub-tropical high and their influence on precipitation in north China. J. Trop. Meteorol. 4, 417–422.
Zhang, T. X., Jiang, Y. A., Fan, J., Liu, J., and Yu, X. J. (2020). Analysis of cold air process activity in northern Xinjiang during 1961-2016 and the atmospheric circulation index. Desert Oasis Meteor 14 (5), 107–114. doi:10.12057/j.issn.1002-0799.2020.05.014
Zhang, Y., An, C. B., Liu, L. Y., Zhang, Y. Z., Lu, C., and Zhang, W. S. (2021). High mountains becoming wetter while deserts getting drier in Xinjiang, China since the 1980s. Land 10 (11), 1131. doi:10.3390/land10111131
Zhao, D. S., Gao, X., Wu, S. H., and Zheng, D. (2020). Trend of climate variation in China from 1960 to 2018 based on natural regionalization. Adv. Earth Sci. 35 (7), 750–760. doi:10.11867/j.issn.1001-8166.2020.056
Zhao, Y., Wang, Q., and Huang, A. N. (2018). Relationship between Iran high pattern of south Asia high and summer precipitation in Xinjiang. Plateau Meteor 37 (3), 651–661. doi:10.7522/j.issn.1000-0534.2017.00049
Keywords: temperature, Xinjiang, atmospheric circulation indices, cross-wavelet analysis, precipitation
Citation: Zhou G, Chen Y and Yao J (2023) Variations in precipitation and temperature in Xinjiang (Northwest China) and their connection to atmospheric circulation. Front. Environ. Sci. 10:1082713. doi: 10.3389/fenvs.2022.1082713
Received: 28 October 2022; Accepted: 08 December 2022;
Published: 04 January 2023.
Edited by:
Wei Shui, Fuzhou University, ChinaCopyright © 2023 Zhou, Chen and Yao. This is an open-access article distributed under the terms of the Creative Commons Attribution License (CC BY). The use, distribution or reproduction in other forums is permitted, provided the original author(s) and the copyright owner(s) are credited and that the original publication in this journal is cited, in accordance with accepted academic practice. No use, distribution or reproduction is permitted which does not comply with these terms.
*Correspondence: Yaning Chen, Y2hlbnluQG1zLnhqYi5hYy5jbg==; Junqiang Yao, eWFvanExOTg3QDEyNi5jb20=
 Guixiang Zhou1,2,3
 Yaning Chen
 Junqiang Yao