 Keke Hu
 Jiancun He4
94% of researchers rate our articles as excellent or good
Learn more about the work of our research integrity team to safeguard the quality of each article we publish.
Find out more
ORIGINAL RESEARCH article
Front. Environ. Sci., 04 January 2023
Sec. Atmosphere and Climate
Volume 10 - 2022 | https://doi.org/10.3389/fenvs.2022.1080810
This article is part of the Research TopicImpact of Climate Change on the Human Living EnvironmentView all 24 articles
River ecological baseflow is key to river ecosystem health and stability and has become particularly important with global climate change aggravation. By considering the Niya River Basin in Xinjiang, based on meteorological data from 1958 to 2021 and hydrological data from 1978 to 2018, the Tennant method was determined to be the best basin ecological baseflow calculation method, the M–K test was used to analyze the abrupt ecological baseflow and climate change characteristics, and the ecological baseflow regression response and sensitivity coefficient models concerning climate change were established. The results showed that 75% of the ecological baseflow in the Niya River Basin ranged from 15 to 31 m3•s−1 in 1978–2018, the average annual temperature increased by 1.6°C at a 0.22°C•(10a)−1 rate, and the annual precipitation increased by 6.3 mm at a 0.98 mm•(10a)−1 rate. The prediction accuracy of the regression model was good, R2 exceeded 0.7, the ecological baseflow response to climate change lagged, and precipitation greatly impacted ecological baseflow. The basin sensitivity coefficient showed a decreasing trend from upstream to downstream, with the annual maximum value in 2010, the minimum value in 1984, the monthly maximum value in April and the monthly minimum value in November. Based on the climate change trend and the social water use of the basin, the ecological baseflow protection targets and measures were proposed according to the season and the hydrological period for actual water resource management and scheduling of the river in this and similar regions.
Global climate change, which is characterized by temperature rise and precipitation change, is increasingly apparent and exhibits a continuous impact on the changes in the Earth’s system (Bates et al., 2008; IPCC, 2022). Arid and semiarid regions have fragile and sensitive climate environments, which are more responsive to global climate change (Huang et al., 2016; Zhou et al., 2022). The Sixth IPCC report (AR6) points out that in 2020, the global land and ocean surfaces warmed by 1.59°C and 0.88°C, respectively (IPCC, 2021). Under the influences of various temperatures, precipitation fluctuates to different degrees (Hu et al., 2018; Liu et al., 2020). For every decade since the 1970s, global river and lake temperatures have increased by an average of 1°C and 0.45°C, respectively. Therefore, river and lake ecosystems have become direct and obvious areas affected by global climate change. Methods to deal with climate change have become common and crucial areas in river and lake research (Yang et al., 2020; Hu et al., 2022).
Under the influence of climate change, the contradiction between the supply and demand of river water resources has become increasingly prominent, especially in the area of ecological environment water demand (Xin et al., 2008; Chen et al., 2014). To ease the contradiction between human and ecological environment water use and to achieve a balance between water supply and demand, the concept of ecological baseflow has risen at this historic moment (Yan et al., 2007). Ecological baseflow refers to the requirement that the minimum flow of a river should meet under the condition that the basic structure and function of the river system are stable, by taking the health of the water ecosystem as the highest goal of river health (Xu et al., 2016). If the river discharge is lower than this value, the discharge has serious and irreversible short-term impacts on the health and stability of the river ecosystem (Ji et al., 2021). Therefore, it is very important to conduct relevant research on river ecological baseflow.
Xinjiang is located in the middle of the Eurasian continent, which is a typical arid region with scarce precipitation and uneven spatial and temporal distributions of water resources; ecological environment is very fragile and the problem of river ecological water use is serious (Hu et al., 2021; Zuo et al., 2021). The Niya River Basin is located in southern Xinjiang. The northern part is affected by the Karakoram Mountains, and the southern part is affected by the Taklimakan Desert. The water resources in the basin are extremely scarce. The annual precipitation is under 50 mm, and it is difficult to guarantee river ecological water (Hu et al., 2022). Previous studies on water resources in arid areas have rarely explored the relationship between river ecological baseflow and climate change (Li et al., 2019; Ostad et al., 2021). To date, no study has clearly revealed the change process and sensitivity of river ecological baseflow under the influence of climate change. Therefore, it is necessary to study the sensitivity of river ecological baseflow to climate change in arid areas.
In this study, we analyze the characteristics of ecological baseflow and climate change in the Niya River Basin; additionally, we discuss the sensitivity of ecological baseflow to climate change by using the measured hydrological data from 1978 to 2018 and meteorological data from 1958 to 2021 from four hydrological monitoring sections in the Niya River Basin, including the Niya Reservoir, 818 Canal, Niya Station and Niya Canal. This study is expected to provide a reference for river ecological water use scheduling and ecological restoration under the conditions of climate change.
The Niya River Basin is located in the central and western parts of Minfeng County (82°36' ∼ 82°50′E, 36°32' ∼ 37°48′N), Hotan Region, Xinjiang Uygur Autonomous Region, China (Figure 1). This basin begins at the Lushtagh Peak at the northern foot of the Kunlun Mountains. The basin is adjacent to Qiemo County, with Bazhou to the east, Yutian County to the west, the Taklamakan Desert to the north, and the Kunlun Mountains as a barrier to the south. The basin is 210 km long from north to south and 40–90 km wide from east to west, with a total area of 10,160.96 km2.
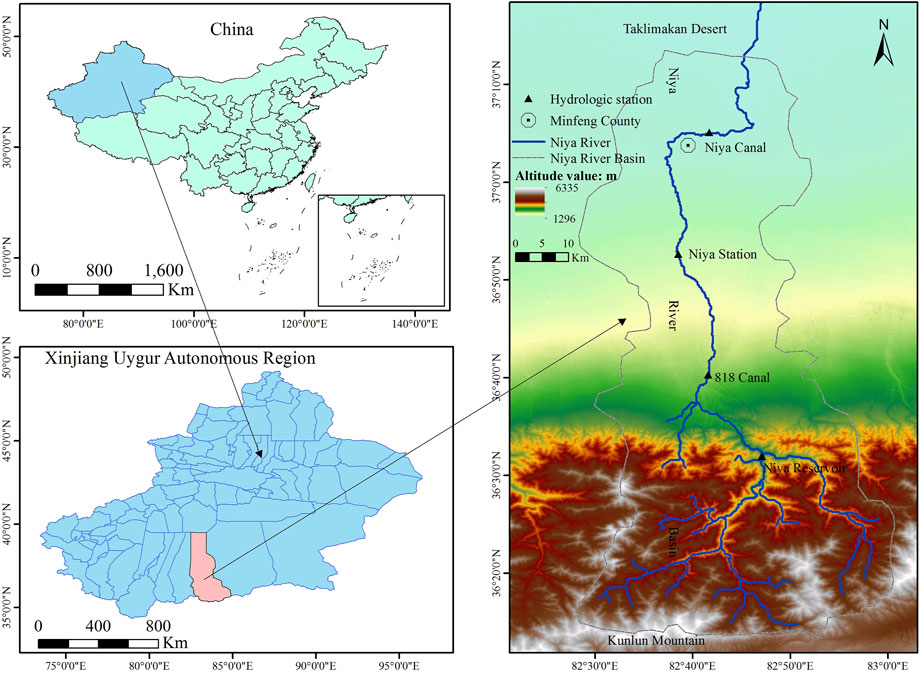
FIGURE 1. Geographical location of the study area.
The terrain of the Nya River Basin is high in the south and low in the north, which is roughly divided into three parts: mountain area, plain area and desert. The south is a mountainous area with an altitude of 5,600–1,500 m. The mountainous area is 5,764.33 km2, accounting for 56.73% of the total area, including a glacial area of 73.06 km2 and an ice reserve volume of 4.224 billion m3. The middle part of the basin is the plain area, with an altitude of 1,500–1,300 m and an area of 3,894.96 km2, accounting for 38.34% of the total area. The terrain slopes from south to north; there are natural eupopulus forests, shrubs and lowland meadows, forming oases of different sizes and forming the oasis agricultural area of Minfeng County. The north is desert with an altitude below 1,300 m and an area of 500.67 km2, accounting for 4.93% of the total area. Sparse vegetation is distributed among compound dunes.
The Niya River is fed by melting water, seasonal snowmelt and rainfall. In the dry season, the river seeps along the channel from the mountain pass and almost stops flowing at the Niya station. The flood season water flows to the desert edge downstream of the irrigation area, with an average annual runoff of 239.5 million m3. The headwaters of the river are dendritic, with Qiakeda tributaries flowing into it approximately 42 km from the upper end and no tributaries flowing into it at the lower end. Along the river from the mountain pass to the end of the river, there are four hydrological monitoring sections—the Niya Reservoir, 818 Canal, Niya Station and Niya Canal—which are used to monitor the flow changes in the river out of the mountain pass, upstream, midstream and downstream.
The hydrological data of the four hydrological monitoring sections of the Niya Reservoir, 818 Canal, Niya Station, and Niya Canal from 1978 to 2018 are selected to explore the change characteristics in the ecological baseflow of the basin. The specific data, including daily, monthly, and annual average flows and runoffs, are derived from the hydrological data of the Tarim River Basin in the hydrological yearbook of the People’s Republic of China.
The measured meteorological data of the Minfeng Meteorological Station from 1958 to 2021, which is the only station with long time series meteorological data in the Niya River Basin, are selected to analyze the climate change in the basin. The data include daily, monthly and yearly average temperature and precipitation data, which are all from the China Meteorological Data Network (http://data.cma.cn/). The temperature is automatically monitored and recorded through standard thermometers, and the precipitation is recorded manually with a 20-cm standard rain gauge.
There are many methods to calculate the ecological baseflow. This study considers the method that is easy to operate and obtain data in practice, and refers to the relevant requirements in the Supplementary Technical Rules for Investigation and Evaluation of Ecological Water Quantity of National Water Resources Investigation and Evaluation of the People’s Republic of China. (Trial) (April 2018). So, we finally selected the methods of calculating the ecological baseflow as follows:
The Tennant method, also called the Montana method, was proposed by Tennant, 1976. The method requires taking 10%–30% of the average annual flow of the river as the ecological baseflow, which is suitable for rivers with long hydrological data series; it is the most commonly used method to estimate the river ecological baseflow to date (Huang et al., 2019). As the Niya River is a typical seasonal river, the Tennant method is appropriately improved in this study by changing the flood season to April to October and the dry season to November to March of the following year to obtain the ecological baseflow standard of the river (Table 1).
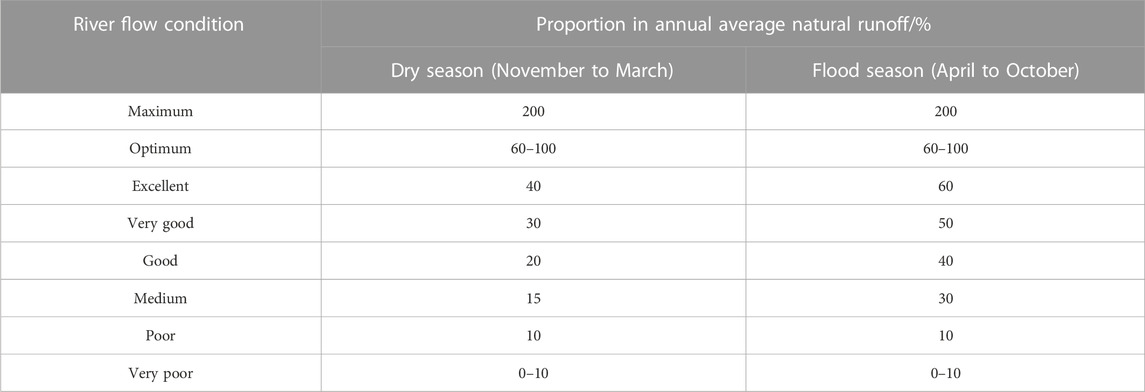
TABLE 1. Ecological baseflow criteria recommended by the Tennant method.
The calculation formula is as follows:
where Qi is the ecological baseflow (m3•s-1) in month i, Mi is the mean runoff of month i (m3•s-1), and Ni is the percentage of the corresponding ecological baseflow in month i.
The DM method is the multiyear average of the driest monthly average flow. The average flow of the driest month in the past 10 years is used as the ecological baseflow. Although the hydrological observation data series required by this method is short, 41 years of hydrological data from 1978 to 2018 are selected in this study to ensure consistency with the time scale of other calculation methods (Su et al., 2022). The calculation formula is as follows:
where Qi is the ecological baseflow of month i (m3•s-1) and Mij is the average flow of day j of month i (m3•s-1).
This method is improved by the American 7Q10 method for water pollution monitoring and ecological baseflow calculations in China (Stanlnaker, 1994). According to the natural monthly average flow frequency of the driest month, the actual situation of the river and the existing hydrological data, the hydrological frequency curve is constructed, and the monthly average flow of a specific frequency is taken as the ecological baseflow. The calculation formula is as follows:
where Qi is the ecological baseflow (m3•s-1) at frequency i, f represents the frequency curve function, q is the monthly average flow (m3•s-1), and qi is equal to the frequency i. According to the Code for Calculation of Water Demand for Rivers and Lakes Ecological Environment (Ministry of Water Resources of the People’s Republic of China, 2015), frequency i is set as 95% in this study.
By calculating the monthly flow frequency, the specific percentage of the monthly average flow corresponding to a 50% guarantee rate is taken as the ecological baseflow (Gippel and Stewardson et al., 1998). We referred to the research results of other relevant scholars in China (Wu et al., 2011; Gao et al., 2021). In this study, 20% of the corresponding monthly average flow with a design assurance rate of 50% is selected as the ecological baseflow value.
The main statistical methods used in this paper are the F test, trend analysis, correlation analysis and regression analysis, among which regression analysis is used to determine the specific response relationship between climate change and ecological baseflow change. We consider the hysteresis of the impact of climate change on the ecological baseflow, the average temperature and precipitation values of the last month are added for multivariate fitting to improve the accuracy of the regression model. The establishment of a multiple linear regression model is as follows:
where Qi is the ecological baseflow in month i (m3•s-1), T is temperature (°C), P is precipitation (mm), i is the average temperature and precipitation of the month, i-1 is the average temperature and precipitation of the previous month, α and β are the coefficients of temperature and precipitation, respectively, and ε is a constant.
The Mann–Kendall (M–K) method was used for the mutation test, which was originally proposed by Mann and Kendall (Mann, 1945; Kendall, 1990). This method was implemented based on MATLAB and has been widely used for analyzing climate and hydrological series, and it has been constantly improved. Referring to the latest research (Salehie et al., 2022), the principle of this analysis technique is to construct a rank sequence Sk for time series X to reflect the cumulative number of values at time i greater than those at time j. Its expression is as follows:
where UFk is the statistic of the time series in the M–K test, UF1 = 0, E(Sk) and Var(Sk) are the mean and variance of Sk, respectively, and UBk = -UFK. When the UF or UB value exceeds zero, the series shows an upward trend. Otherwise, it shows a downward trend. If UF and UB exceed the significance interval (the significant level is 0.05 and the critical value is ± 1.96), the upward or downward trend is significant. If the two curves UF and UB intersect and the intersection is within the significant interval, it is the mutation point.
According to the Intergovernmental Panel on Climate Change (IPCC), sensitivity is defined as the degree to which a system is affected by climate change-related stimuli, both adverse and beneficial (IPCC, 2007). In this study, the sensitivity of ecological baseflow to climate change refers to the response of the minimum water demand of watershed ecosystems to known or assumed climate change scenarios. Based on the above definition, the sensitivity model of river ecological baseflow to climate change is established as follows:
where S is the sensitivity coefficient (%) of river ecological baseflow to climate change, QT,P is the ecological baseflow value (m3•s-1) under the present temperature and precipitation conditions, and QT+ΔT,P+ΔP is the ecological baseflow value (m3•s-1) when temperature changes ΔT and precipitation changes ΔP. When S > 0, climate change promotes ecological baseflow. Otherwise, it plays an inhibitory role. The greater│S│is, the greater the promotion or inhibition of ecological baseflow by climate change.
Four hydrological methods are used to calculate the annual average monthly ecological baseflow values of four hydrological monitoring sections in the Niya River Basin (Figure 2).
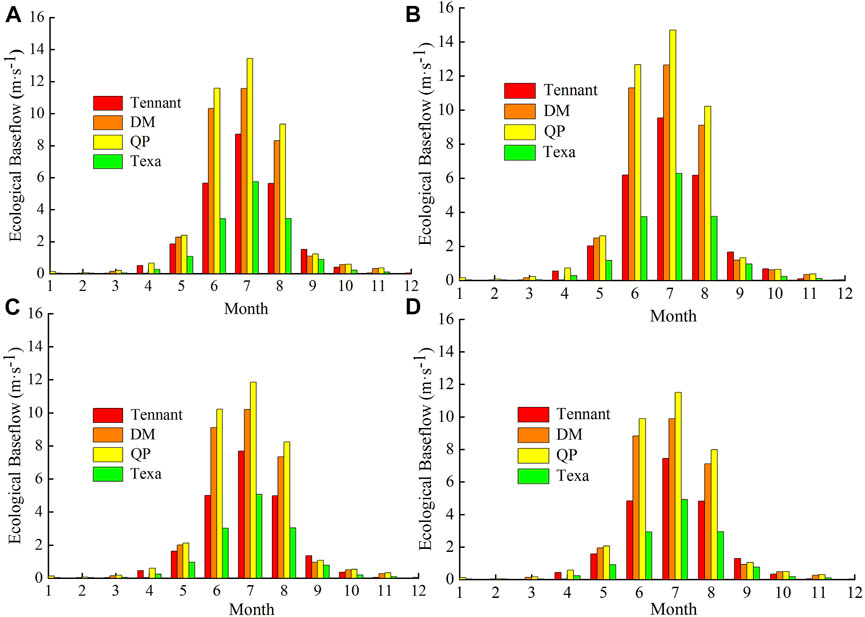
FIGURE 2. Four methods are used to calculate the multiyear average monthly ecological baseflow of the four sections. (A) Niya Reservoir. (B) 818 Canal. (C) Niya Station. (D) Niya Canal.
The results show that the annual average monthly ecological baseflow values of the four sections calculated by the four methods are as follows: the QP method has the highest calculation result, followed by the DM method, the Tennant method and the Texa method. According to the actual river ecosystem composition and the temperature and precipitation of the Niya River Basin, we referred to the ecological baseflow of the same type of watershed in the arid area (Yang et al., 2014; Cheng et al., 2021). By comprehensively comparing the calculation results of the above four methods, we find that the calculation results of the QP and DM methods are too large, and it is difficult to meet the actual ecological baseflow in arid areas. Although the calculation result of the Texas method is the lowest and can be guaranteed, it can only temporarily meet the basic needs of various components of the river ecosystem in this case, and it cannot develop stably for a long time due to poor resilience. The calculation result of the Tennant method is between the above three, meaning it can guarantee the basic development demand of river ecosystems and enable their long-term development, which is in agreement with the ecological and hydrological characteristics of the Niya River as an inland river in an arid area. Therefore, by comprehensively comparing the above calculation and analysis results, the Tennant method is finally selected as the most suitable calculation method for ecological baseflow in the Niya River Basin.
According to the monthly ecological baseflow values of the annual average, the Tennant method was used to calculate the annual ecological baseflow values and analyze the annual ecological baseflow characteristics of the four sections (Figure 3).
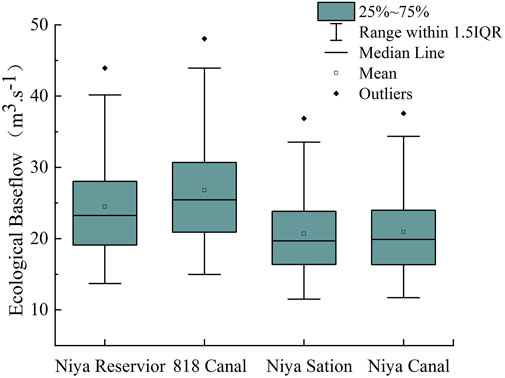
FIGURE 3. Distribution characteristics of the annual ecological baseflows of the four sections.
In the Niya River Basin, 75% of the ecological baseflow values of the four sections from 1978 to 2018 ranged from 15 to 31 m3•s-1. The annual ecological baseflow values of the Niya Reservoir ranged from 18 to 28 m3•s-1, those of the 818 Canal ranged from 22 to 31 m3•s-1, and those of the Niya station and Niya Canal ranged from 16 to 23 m3•s-1 and 15–23 m3•s-1, respectively. The maximum value of the annual ecological baseflow occurred at the 818 Canal, which was 48.26 m3•s-1. The minimum value occurred at the Niya hydrological station, which was 12.56 m3•s-1. The overall trend of the basin was stable, and the value of ecological baseflow was relatively low, but there were abrupt changes across different years.
We further analyzed the mutation characteristics for the ecological baseflow of the Niya River Basin and used the M–K test to explore the mutation results of the four sections (Figure 4).
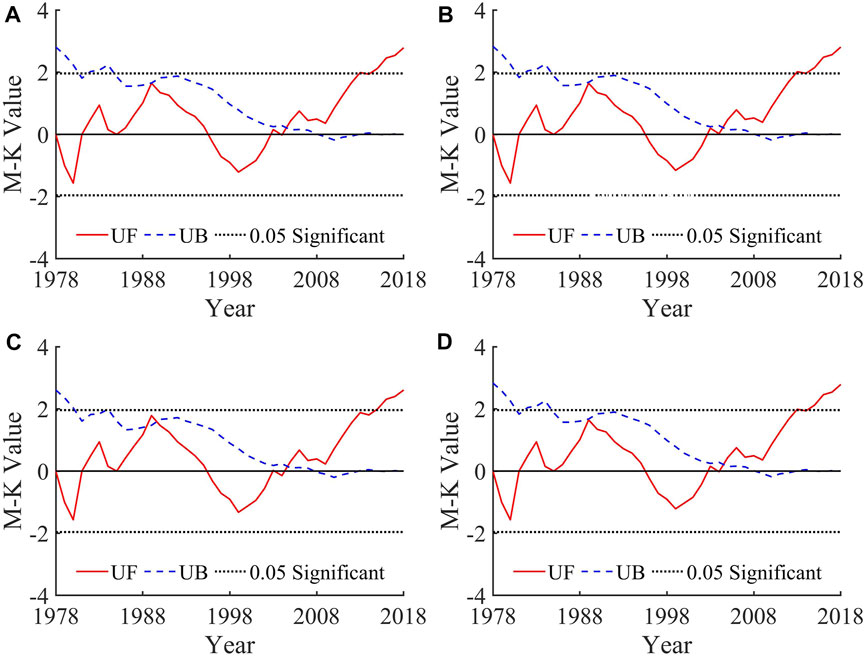
FIGURE 4. Abrupt change test results of the ecological baseflow of the four sections. (A) Niya Reservoir. (B) 818 Canal. (C) Niya Station. (D) Niya Canal.
The UF and UB curves of the Niya Reservoir, 818 Canal and Niya Canal sections all had two intersecting points within the 0.05 confidence interval, which appeared in 1989 and 2005. This phenomenon indicated that the mutation points appeared in 1989 and 2005. The UF and UB curves of Niya Station had three intersecting points that appeared in 1988, 1990 and 2005, indicating that mutations occurred in 1988, 1990 and 2005. In addition, although the variation trends of the ecological baseflow in the four sections were complex, they all showed the following characteristics. From 1978 to 1980, the UF curve was < 0, indicating that the ecological baseflow values in the Niya River Basin exhibited a downward trend. The UF curve was > 0 from 1981 to 1995, indicating that the value of the ecological baseflow showed an upward trend during this period. From 1996 to 2004, the UF curve was < 0, indicating that the ecological baseflow of the watershed exhibited a downward trend. The UF curve from 2005 to 2018 was > 0, indicating an upward trend that began in 2005.
The Niya River Basin is located in the hinterland of the Eurasian continent; due to its distance from the ocean and the back of the Taklimakan Desert, precipitation is rare, and the climate is extremely dry. According to the measured average annual temperature and precipitation data from meteorological stations in the basin from 1958 to 2021, an M–K test was conducted on climate change in the Niya River Basin, the results are shown in Figure 5.
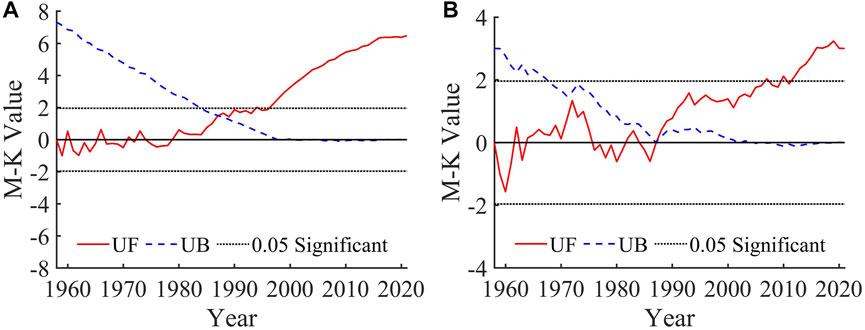
FIGURE 5. Analysis results of the abrupt changes in the temperature and precipitation in the basin. (A) Temperature. (B) Precipitation.
The results show that there is only one intersecting point in the UF and UB curves of the annual average temperature of the basin from 1958 to 2021, which occurs in 1987. This finding suggests that the annual average temperature of the Niya River Basin suddenly changed in 1987. The UF curve fluctuates significantly from 1958 to 1978 without a fixed trend. Since 1980, the UF curve has been > 0, indicating an upward trend. The UF and UB curves of annual precipitation in the basin from 1958 to 2021 have only one intersecting point in 1987, indicating that the temperature and precipitation changes synchronized. The UF curve fluctuates greatly from 1958 to 1987, and it has exceeded zero since 1988 and continued to increase, indicating that the precipitation begins to rise after 1987.
We analyzed the interannual variation characteristics of temperature and precipitation in the basin and used 1987 as a dividing line to conduct subsection fitting to obtain the annual variation characteristics and growth trends of the annual average temperature and precipitation in the Niya River Basin (Figure 6).
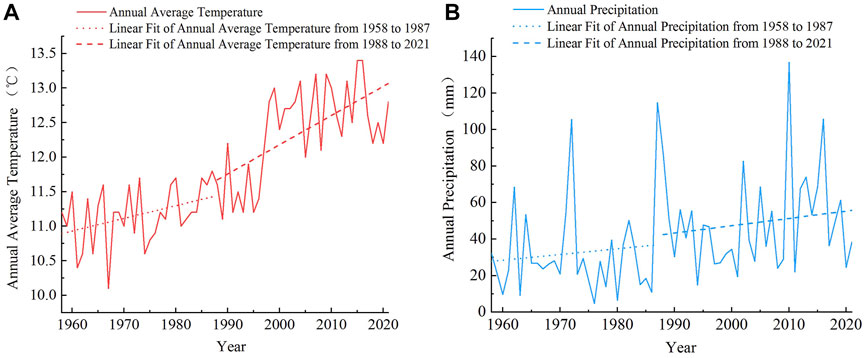
FIGURE 6. Annual variation characteristics and piecewise fittings of the temperature and precipitation in the basin. (A) Temperature. (B) Precipitation.
From 1958 to 2021, the average annual temperature in the basin generally fluctuated and increased by 1.6°C at a rate of 0.22°C•(10a)-1. Among this data, 1958–1987 exhibited a slow growth stage of 0.6°C at a rate of 0.20°C•(10a)-1.1988–2021 exhibited a rapid growth stage, with a growth rate of °C•(10a)-1, there was a total increase of 1°C. The maximum annual average temperature in 2016 was 13.41°C, and the minimum in 1967 was 10.1°C. During the study period, the annual precipitation in the basin showed an increasing trend in fluctuation, but the fluctuation range was larger and the increasing trend was smaller than those of the annual temperature in the basin. From 1958 to 2021, the annual precipitation of the basin increased by 6.3 mm at a speed of 0.98 mm•(10a)-1. The period from 1958 to 1987 was a rapid increase stage, with an increase of 82.6 mm at a speed of 27.53 mm•(10a)-1.1988–2021 was a decline stage, with a decrease of 48.4 mm at a rate of 14.24 mm•(10a)-1. The maximum annual precipitation was 136.9 mm in 2010, and the minimum was 4.7 mm in 1976. The general increasing trends of temperature and precipitation in the Niya River Basin were related to the gradual warming and humidification of the climate in Xinjiang, causing this phenomenon locally and affecting the ecological baseflow of the river.
To explore the specific response relationship of ecological baseflow to climate change and understand the change relationships among ecological baseflow, temperature and precipitation, the regression model of the ecological baseflow response to temperature and precipitation established in Eq. 5 was used. The Niya River Basin was considered for verification and analysis. The multiple linear regression equations of ecological baseflow for the average monthly temperature and precipitation in four sections of the Niya River Basin were obtained (Table 2).
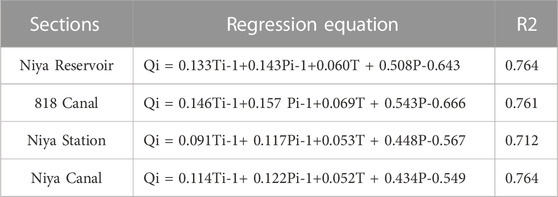
TABLE 2. Regression equation of the ecological baseflow on the temperature and precipitation of the four sections.
Through the regression model, the responses of the ecological baseflow of the four sections in the Niya River Basin to climate change were clarified, and they showed obvious positive correlations. With increasing temperature and precipitation, the ecological baseflow exhibited a synchronous response change. The R2 of each equation exceeded 0.7. Referring to the latest model evaluation system DISO (Hu et al., 2022), R2 is only a one-dimensional special case (Zhou et al., 2021). The closer its value is to 1, the more reliable the evaluation result is (Hu et al., 2019). So, the regression model in this study has relatively good accuracy. In terms of time, it could be seen from the regression equation that the influences of temperature and precipitation in the last month on ecological baseflow were greater than those in the recent month, and there was a certain lag in the influence of climate change on ecological baseflow. In terms of proportion, precipitation had a greater impact on the ecological baseflow, and the ecological baseflow had a more significant response to changes in precipitation.
To further explore the specific degree of the response relationship between ecological baseflow and climate change to analyze the sensitivity of ecological baseflow to climate change, the model established by Eq. 6 was used for calculating the annual sensitivity coefficient of the ecological baseflow in the Niya River Basin to climate change, and the results are shown in Figure 7.
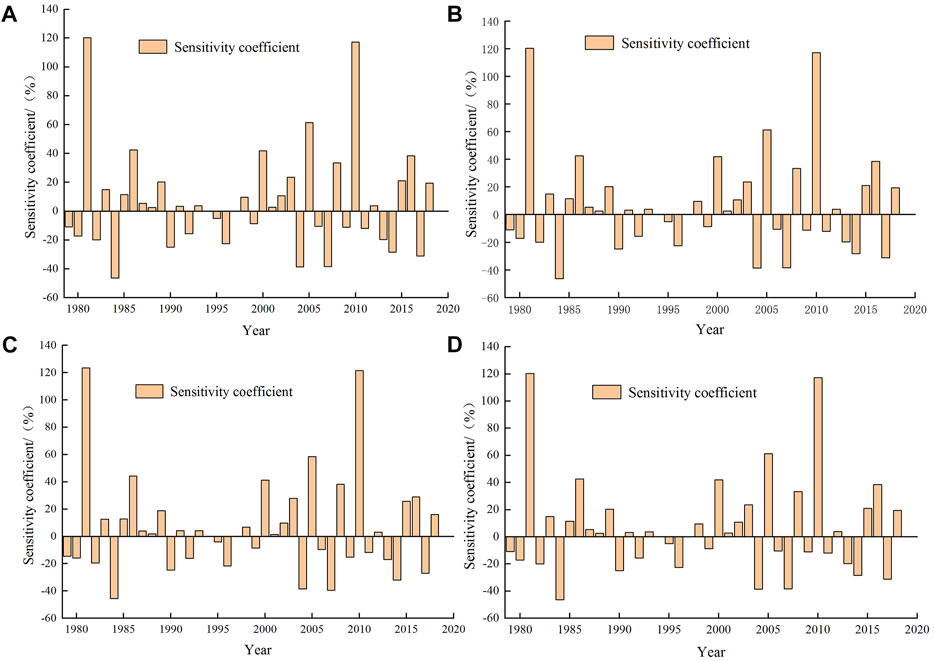
FIGURE 7. Annual variation characteristics of the sensitivity coefficients of the four sections. (A) Niya Reservoir. (B) 818 Canal. (C) Niya Station. (D) Niya Canal.
The sensitivity degree of the ecological baseflow to the temperature and precipitation characteristics in the four sections in the Niya River Basin fluctuated greatly, and the variation amplitude and trend of each section were roughly the same. The positive and negative changes in the sensitivity coefficients were obvious, indicating that climate change did not change the positive and negative effects on the ecological baseflow in the basin. When the sensitivity coefficient was positive, climate change had a promoting effect on ecological baseflow. In contrast, when the sensitivity coefficient was negative climate change had an inhibitory effect on ecological baseflow. Specifically, in terms of time, the highest sensitivity coefficient occurred in 2010 (117.20%), and the lowest sensitivity coefficient occurred in 1984 (−46.22%). The increasing and decreasing trends for the sensitivity coefficients of different sections were consistent with the trends of temperature and precipitation, and the interannual variations in the same sections were quite different. In terms of space, the sensitivity coefficients of the four sections were related to the overall climate environment of the basin rather than the location of the river; the sensitivity coefficients generally showed decreasing trends from upstream to downstream, especially during the wet years. From 1979 to 2018, the sensitivity coefficient of the ecological baseflow of all hydrological sections in the Niya River Basin to climate change increased from −10.89% to 19.44%, indicating that climate change played an overall role in promoting ecological baseflow.
The above analysis results show that the ecological baseflow in the Niya River Basin is sensitive to climate change, and the interannual variation fluctuates significantly. To ensure the stability of the river ecosystem, the reasonable management and scheduling of river discharge should be conducted. Therefore, we further discuss the sensitivity of monthly ecological baseflow to climate change, and we determine the response of ecological baseflow to temperature and precipitation in each month by using the monthly sensitivity coefficient and taking the maximum value of each month as the trendline (Figure 8).
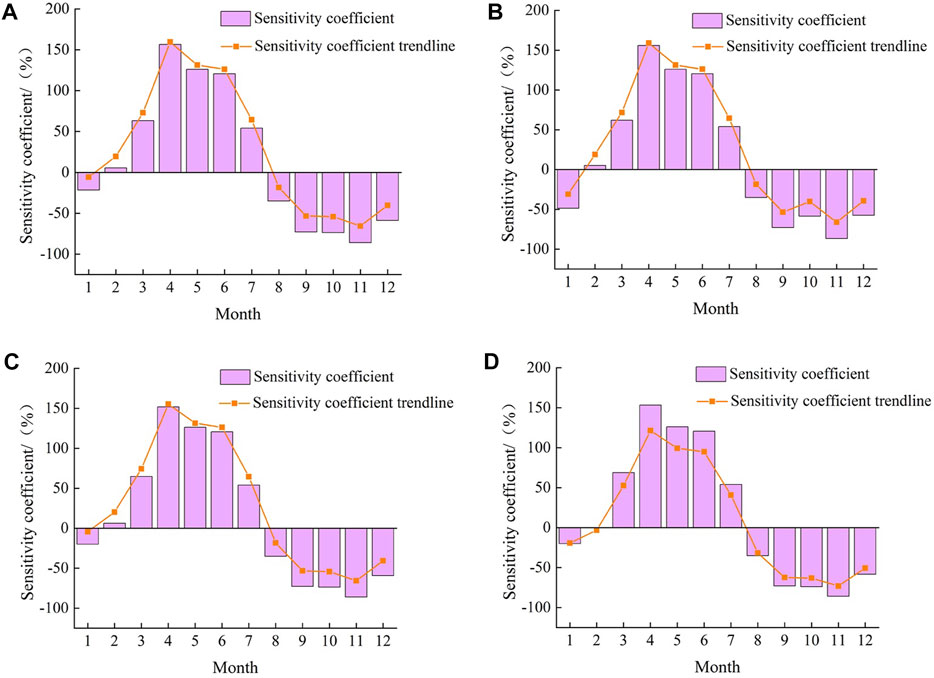
FIGURE 8. Monthly variation characteristics of the sensitivity coefficients of the four sections. (A) Niya Reservoir. (B) 818 Canal. (C) Niya Station. (D) Niya Canal.
The variation trends of the sensitivity coefficients of the monthly ecological baseflows to the temperature and precipitation characteristics of the four sections in the Niya River Basin are roughly the same, with the maximum values occurring in April. This phenomenon is related to the fact that the Niya River is seasonal and the recharge source is mainly snow and ice melt water. The sensitivity coefficients are all negative from August to January of the following year, and the change in the temperature and precipitation inhibits the development of ecological baseflow during this period. The minimum value appears in November because the inhibitory effects of temperature and precipitation on the ecological baseflow peak in November; in the dry season, its effect was small. The ecological baseflow shows a downward trend from May to November and an upward trend from November to April of the following year. Therefore, the key to ecological baseflow control is to ensure that the ecological baseflow is satisfied in the dry season; reasonable scheduling in the flood season allows the river ecosystem to constantly develop and enrich to maintain stability.
Through the above analysis and discussion, the change characteristics of ecological baseflow, temperature and precipitation in the Niya River Basin were understood. The response relationship and sensitivity degree of ecological baseflow in the Niya River Basin to climate change were further determined. On this basis, combined with the relevant data of social water use in the basin (In supplementary material), ecological baseflow guarantee targets were proposed for different seasons and hydrological periods (Table 3).
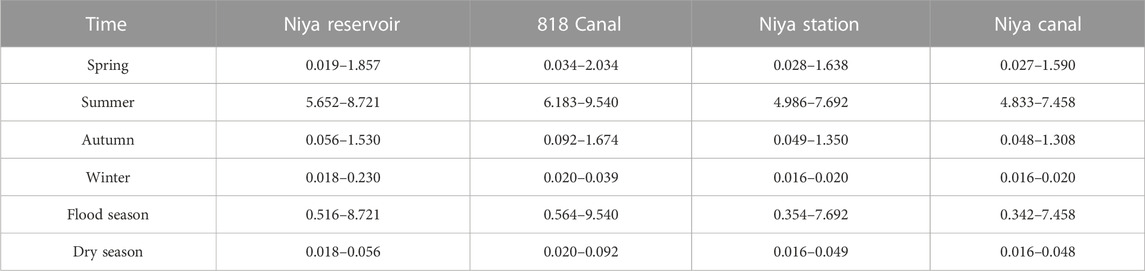
TABLE 3. Ecological baseflow guarantee objectives of 4 sections. Unit: m3·s−1.
Each section shows that in different seasons, winter has the smallest values, followed by spring, autumn and summer, which is consistent with the changes in temperature and precipitation characteristics for facilitating the timeliness of river flow control. In the flood season, the range of the ecological baseflow support target fluctuates greatly. This phenomenon does not occur in the dry season to conform to the change trend of actual runoff volume and to achieve the rationality of ecological baseflow control. In the same season or period, the guarantee targets all show the phenomenon of 818 Canal > Niya Reservoir > Niya Station > Niya Canal, which is consistent with the change characteristics of the actual size of the ecological baseflow at each section of the Niya River.
In order to ensure that the management and control objectives of the watershed ecological baseflow can be achieved, specific safeguard measures are proposed according to the actual situation as follows. Firstly, strengthen the unified management and scientific regulation of regional water resources, comprehensively consider the characteristics of different sections, and take into account the common ground of the Niya River ecological restoration and environmental protection. Secondly, strictly supervise and control, establish a legal system for water ecology, and regularly supervise and inspect river leaders at all levels and relevant departments to complete Niya River ecological protection tasks. Last, increase technical research, conduct comprehensive research on hydrological, chemical and biological processes of the Niya River, and strengthen the use of ecological monitoring technologies.
With the intensification of global climate change, the stabilities of river ecosystems are increasingly threatened, especially in inland arid areas. Ensuring that river ecological baseflow is satisfied is a key to maintaining the health and stability of river ecosystems. Based on the measured temperature, precipitation and runoff data in the Niya River Basin, Xinjiang, we analyzed the response relationship and specific sensitivity of the ecological baseflow to climate change. The main conclusions were as follows:
By comparing four methods based on the hydrological data from 1978 to 2018, the Tennant method was determined to be the most suitable for this study area. The variation trends of the ecological baseflows in the four sections of the basin were consistent, with 75% of them concentrated in the range of 15–3 31 m3•s−1, and abrupt changes occurred in 1989 and 2005. Based on meteorological data from 1958 to 2021, the trend analysis showed that the annual average temperature in the basin increased by 1.6°C at a rate of 0.22°C•(10a)−1, the annual precipitation increased by 6.3 mm at a rate of 0.98 mm•(10a)−1, and abrupt changes all occurred in 1987.
The regression model of the response of the ecological baseflow to the temperature and precipitation characteristics were established and verified by taking the Niya River Basin as an example. The R2 values all exceeded 0.7, indicating that we obtained the response relationship of the ecological baseflow to climate change and further established the sensitivity model of ecological baseflow to climate change. In the study period, the sensitivity coefficient of each section of the basin showed a decreasing trend from upstream to downstream; the largest trend was 117.20% in 2010, and the smallest trend was −46.22% in 1984.
The variation trends of the monthly sensitivity coefficient of the ecological baseflow to the temperature and precipitation characteristics in the four sections were approximately the same; the maximum value occurred in April, and the minimum value occurred in November. In the future, with the continuous development of the trends of warming and humidification in Xinjiang, the ecological baseflow of the Niya River Basin would respond to changes. On this basis, ecological baseflow guarantee targets and measures were proposed according to the seasons and hydrological periods by comprehensively considering the social water use in the basin.
The data analyzed in this study is subject to the following licenses/restrictions: The meteorological data used in this study came from China Meteorological Data Network (http://data.cma.cn/), and the hydrological data was provided by Agriculture and Water Resources Bureau of Minfeng County. Due to data licensing restrictions, it is not available for publication at the moment, further inquiries can be directed to the corresponding authors. Requests to access these datasets should be directed to http://data.cma.cn/.
KH, SD, JH and YT completed the collection and processing of data related to the study, KH completed the analysis and conclusion of the paper, SD revised the paper, JH and YT checked and approved.
This study was supported by the Xinjiang Water Science and Technology Special Project (XSKJ-2022-21), the National Natural Science Foundation of China (41961002).
The authors declare that the research was conducted in the absence of any commercial or financial relationships that could be construed as a potential conflict of interest.
All claims expressed in this article are solely those of the authors and do not necessarily represent those of their affiliated organizations, or those of the publisher, the editors and the reviewers. Any product that may be evaluated in this article, or claim that may be made by its manufacturer, is not guaranteed or endorsed by the publisher.
The Supplementary Material for this article can be found online at: https://www.frontiersin.org/articles/10.3389/fenvs.2022.1080810/full#supplementary-material
Bates, B. C., Kundzewicz, Z. W., Wu, S., and Palutikof, J. P. (2008). Climate change and water. Geneva: IPCC Secretariat\. Technical Paper of the Intergovernmental Panel on Climate Change.
Chen, Y. N., Li, Z., Fan, Y., Wang, H. J., and Fang, G. H. (2014). Research progress on the impact of climate change on water resources in the arid region of Northwest China. Acta Geogr. Sin. 69, 1295–1304. doi:10.11821/dlxb201409005
Cheng, B., and Li, H. E. (2021). Improving water saving measures is the necessary way to protect the ecological baseflow of rivers in water shortage areas of Northwest China. EcolInd 123, 107347. doi:10.1016/j.ecolind.2021.107347
Gao, Y. Q., Liu, Y., Zhao, C. C., and Wu, D. D. (2021). Improvement on monthly guarantee rate setting method for seasonal water shortage rivers in South China. Water Resour. Prot. 37, 95–101. doi:10.3880/j.issn.1004-933.2021.02.015
Gippel, C. J., and Stewardson, M. J. (1998). Use of wetted perimeter in defining minimum environmental flows. Regulated Rivers: Research and Management, 14, 53–67. doi:10.1002/(sici)1099-1646(199801/02)14:13.0.co;2-z
Hu, K. K., He, J. C., Zhao, J., Sulitan, , and Zhang, Y. (2022a). Ecological baseflow in Niya River Basin under climate change. Arid. Land Geogr. 45, 1472–1480. doi:10.12118/j.issn.1000-6060.2022.476
Hu, Z., Chen, D., Chen, X., Zhou, Q., Peng, Y., Li, J., et al. (2022b). CCHZ-DISO: A timely new assessment system for data quality or model performance from da dao zhi jian. Geophys. Res. Lett. 49. doi:10.1029/2022GL100681
Hu, Z., Chen, X., Zhou, Q., Chen, D., and Li, J. (2019). Diso: A rethink of taylor diagram. Int. J. Climatol. 39, 2825–2832. doi:10.1002/joc.5972
Hu, Z., Chen, X., Zhou, Q., Yin, G., and Liu, J. (2022c). Dynamical variations of the terrestrial water cycle components and the influences of the climate factors over the Aral Sea Basin through multiple datasets. J. Hydrology 604, 127270. doi:10.1016/j.jhydrol.2021.127270
Hu, Z., Zhang, Z., Sang, Y., Qian, J., Feng, W., Chen, X., et al. (2021). Temporal and spatial variations in the terrestrial water storage across Central Asia based on multiple satellite datasets and global hydrological models. J. Hydrology 596, 126013. doi:10.1016/j.jhydrol.2021.126013
Hu, Z., Zhou, Q., Chen, X., Li, J., Li, Q., Chen, D., et al. (2018). Evaluation of three global gridded precipitation data sets in central Asia based on rain gauge observations. Int. J. Climatol. 9, 3475–3493. doi:10.1002/joc.5510
Huang, J. P., Ji, M. X., Xie, Y. K., Wang, S., He, Y., and Ran, J. (2016). Global semi-arid climate change over last 60 years. Clim. Dyn. 46, 1131–1150. doi:10.1007/s00382-015-2636-8
Huang, K., Li, H., Cheng, B., and Tian, R. G. (2019). Application status and improvement ideas of river ecological baseflow based on Tennant method. J. Water Resour. Water Eng. 30, 103–110. doi:10.11705/j.issn.1672.643X.2019.05.16
Ipcc, (2007). Climate change 2007: The physical science basis. Contribution of working group I to the fourth assessment report of the intergovernmental Panel on climate change. New York: Cambridge University Press.
Ipcc, (2022). Climate change 2022: Impacts, adaptation, and vulnerability. CambridgeBeijing China: Cambridge University Press, 103–339.
Ipcc, (2021). “Summary for policymakers,” in Climate change 2021: the physical science basis (Cambridge, United Kingdom and New York: Cambridge University Press).
Ji, C. M., Cao, C. L., and Wang, Y. (2021). Analysis on ecological water demand and supply of Kaidu River based on water system connection.Chinese. J. Ecol. 40, 835–843. doi:10.13292/j.1000-4890.202103.026
Kendall, M. G. (1990). Rank correlation methods. Br. J. Psychol. 25, 86–91. doi:10.1111/j.2044-8295.1934.tb00727.x
Li, L. Q., Wang, Z. Z., He, H. X., Ma, Z. Z., Xie, X. M., and Wei, C. J. (2019). Research of water resources multi-dimensional equilibrium allocation based on eco-hydrological threshold regulation in inland arid region[J]. J. Hydraulic Eng. 50, 377–387. doi:10.13243/j.slxb.20180855
Liu, K., Nie, G. G., and Zhang, S. (2020). Study on the spatiotemporal evolution of temperature and precipitation in China from 1951 to 2018. Adv. Earth Sci. 35, 1113–1126. doi:10.11867/j.issn.1001-8166.2020.102
Mann, H. B. (1945). Nonparametric tests against trend. Econometrica 13, 245–259. doi:10.2307/1907187
Ministry of Water Resources of the People’s Republic of China, (2015). Specification of calculation of environmental flow in rivers and lakes: SL/Z 712-2014. Beijing: China Water & Power Press.
Ostad, A. K., and Sha, M. (2021). Quantity and quality modelling of groundwater to manage water resources in Isfahan-Borkhar Aquifer. Environ. Dev. Sustain. 23, 15943–15959. doi:10.1007/s10668-021-01323-1
Salehie, O., Ismail, T. B., Shahid, S., Hamed, M. M., Chinnasamy, P., and Wang, X. (2022). Assessment of water resources availability in amu darya River Basin using GRACE data. Water 14, 533. doi:10.3390/w14040533
Stanlnaker, C. B. (1994). The instream flow incremental methodology: A primer for IFIM. Colorado: National Ecology Research CenterInternational Press.
Su, H., Xu, Z. X., Li, P., Ye, C. L., and Wang, J. J. (2022). Estimation of ecological baseflow with several hydrological methods at the Dahuangjiangkou reach of the Xijiang River. Journal of Beijing Normal University(Natural Science) 58, 269–276. doi:10.12202/j.0476-0301.2021229
Tennant, D. L. (1976). Instream flow regimens for fish, wildlife, recreation and related environmental resources. Fisheries 1, 6–10. doi:10.1577/1548-8446(1976)001<0006:ifrffw>2.0.co;2
Wu, X. J., Li, H. E., Dong, Y., and Lin, Q. C. (2011). Calculation of ecological basic flow Weihe River based on basic flow ratio method. Trans. Case 27, 154–159. doi:10.3969/j.issn.1002-6819.2011.10.027
Xin, H., and Stone, R. (2008). Chinese probe unmasks high-tech adulteration with melamine. Science 322, 1310–1311. doi:10.1126/science.322.5906.1310
Xu, Z. X., Wu, W., and Yu, S. Y. (2016). Ecological baseflow: Progress and challenge. J. Hydroelectr. Eng. 35, 1–11. doi:10.11660/slfdxb.20160401
Yan, D. H., Wang, H., Wang, F., and Tang, W. (2007). Hydraulic resistance characteristics of riparian reed zone in river. J. Hydraulic Eng. 3, 267–272. doi:10.1061/(asce)1084-0699(2007)12:3(267)
Yang, X., Pavelsky, T. M., and Allen, G. H. (2020). The past and future of global river ice. Nature 577, 69–73. doi:10.1038/s41586-019-1848-1
Yang, Z., and Na, D. (2014). The study on ecological basic flow in baoji section of wei river. Adv. Mater. Res. 31, 1487–1491. doi:10.4028/www.scientific.net/AMR.998-999.1487
Zhou, Q., Chen, D., Hu, Z., and Chen, X. (2021). Decompositions of Taylor diagram and DISO performance criteria. Int. J. Climatol. 41, 5726–5732. doi:10.1002/joc.7149
Zhou, Q., Huang, J., Hu, Z., and Yin, G. (2022). Spatial-temporal changes to GRACE-derived terrestrial water storage in response to climate change in arid northwest China. Hydrological Sci. J. 67, 535–549. doi:10.1080/02626667.2022.2030060
Keywords: arid area, Niya River Basin, ecological baseflow, climate change, sensitivity 2
Citation: Hu K, He J, Danierhan S and Tuerxun Y (2023) Sensitivity of river ecological baseflow to climate change in arid areas. Front. Environ. Sci. 10:1080810. doi: 10.3389/fenvs.2022.1080810
Received: 26 October 2022; Accepted: 16 December 2022;
Published: 04 January 2023.
Edited by:
Zengyun Hu, Chinese Academy of Sciences (CAS), ChinaReviewed by:
Mohammed Magdy Hamed, Arab Academy for Science, Technology and Maritime Transport (AASTMT), EgyptCopyright © 2023 Hu, He, Danierhan and Tuerxun. This is an open-access article distributed under the terms of the Creative Commons Attribution License (CC BY). The use, distribution or reproduction in other forums is permitted, provided the original author(s) and the copyright owner(s) are credited and that the original publication in this journal is cited, in accordance with accepted academic practice. No use, distribution or reproduction is permitted which does not comply with these terms.
*Correspondence: Sulitan Danierhan, c3VsaXRhbkBtcy54amIuYWMuY24=
Disclaimer: All claims expressed in this article are solely those of the authors and do not necessarily represent those of their affiliated organizations, or those of the publisher, the editors and the reviewers. Any product that may be evaluated in this article or claim that may be made by its manufacturer is not guaranteed or endorsed by the publisher.
Research integrity at Frontiers
Learn more about the work of our research integrity team to safeguard the quality of each article we publish.