 Chuanhua Zhang1,2
- 1School of Management, Chongqing University of Technology, Chongqing, China
- 2Rural Revitalization and Regional High-quality Development Research Center, Chongqing University of Technology, Chongqing, China
- 3Chongqing Institute of Geology & Mineral Resources, Chongqing, China
Exploring the sensitivity of ecosystem service value (ESV) under land use transformation (LUT) is helpful to promote the rational use of regional land, improve the regional ecological environment carrying capacity, and realize the sustainable development of human beings. Using land use data of Jiangjin Chongqing from 2009 to 2019, this study measured the effect of ecological service value under land use transition in Jiangjin, and analyzed the spatiotemporal evolution characteristics of ecosystem service value based on the land use transfer matrix, change contribution rate (ESVab) and Coefficient of improved cross-sensitivity (CICS). The results showed that 1) the total ESV increased year by year, the ESV change of woodland was the largest, followed by water bodies and cultivated land from 2009 to 2019 in Jiangjin; 2) taking the Yangtze River as the boundary, the ESV in the south was higher than that in the north, but the ESV in the north and south of the Yangtze River increased to different degrees; 3) the contribution rate of forest land was the largest, the contribution rate of cultivated land and woodland was highly correlated with topography and slope, and the contribution rate of water bodies had no obvious spatial distribution characteristics from 2009 to 2019; 4) the CICS between cultivated land, woodland and other land types was higher, and mainly in the medium-high ecological sensitive areas, while the conversion between water bodies, built-up land and other land types was mainly in the medium-low ecological sensitive areas; and 5) the ecologically sensitive areas of the conversion between grassland, unused land and other land types were scattered, and the highly ecologically sensitive areas of the conversion between unused land and other land types were mainly distributed in the southern mountainous area of Jiangjin. It aims to provide important guidance for solving the contradiction between humanity and land and regional environmental problems, so as to realize the sustainable development of the region and environment.
1 Introduction
Sustainable development is the common goal of mankind and has attracted wide attention from all over the world. Sustainable development mainly includes social sustainable development, ecological sustainable development and economic sustainable development, the purpose of which is not only to relatively meet the needs of the present people, but also not to cause harm to the development of future generations (UN, 1992; UN, 2015; Bogers et al., 2022). Sustainable development emphasizes the interlinkages between social, economic and ecological dimensions (Bhaduri et al., 2016; Kumar and Banerji, 2022). Maintaining ecological sustainable development is a necessary condition for realizing sustainable development (Simpson and Jewitt, 2019). However, over the past 50 years, with rapid economic and population development, ecosystems have experienced degradation due to human-induced land-use changes, resulting in a significant reduction in environmental sensitivity and loss of biodiversity (Assessment, 2005; Singh et al., 2016). Therefore, to alleviate the relationship between economic development and ecological protection has become an important issue of great concern to researchers and policy makers.
Ecosystem services (ES) refer to the benefits that humans derive from ecosystems, which are closely related to humanity well-being and sustainable development (Costanza et al., 1997). Assessing the ESV can improve people’s awareness of ecological protection, highlight the importance of natural capital, and promote the coordination of man-land relationship (Small et al., 2017). In addition, it can assess the effectiveness of ecological restoration programs and help optimize land use (Reed et al., 2017). With the rapid development and transformation of urban and rural areas in China, land use also shows a relatively strong transformation. LUT was first proposed by Grainger (1995), a scholar from the University of Leeds in the United Kingdom. As a new approach to study land use/cover change (LUCC), including the transformation of explicit and implicit land forms, affects and changes the structure and service functions of ecosystems at different scales. However, due to the one-sided pursuit of direct economic value in the past, human beings have excessively consumed natural resources in order to maximize their interests, which has caused serious damage to the ecological environment (Smith et al., 2021). Therefore, for the sake of economic benefits, LUT that is not conducive to sustainable development is common. Meanwhile, the impact of LUT on regional ecological environment will further lead to the change of ecosystem service value, and its value can quantitatively reflect the development and impact of humanity on the ecological environment in the process of economic development (Liu et al., 2022). Therefore, exploring the ESV under the transformation of land use is helpful to promote the rational use of regional land and realize the sustainable development of humanity.
Land is an important part of the earth and plays a carrier role in humanity social and economic activities (Jin et al., 2017). However, some regions ignore the non-renewable and regional differences of land resources while pursuing the improvement of economic and social benefits, which leads to the occurrence of resource and environmental problems such as rapid non-agriculture, cultivated land degradation and soil pollution, which limits the development of social economy to a certain extent (Baveye et al., 2016; Lu et al., 2021; Prabhakar, 2021). In order to solve such problems, LUT is introduced to give full play to the advantages of land resources and break the natural “dilemma” between social and economic development and land use. Therefore, land use transformation reflects the process of natural environment change and social and economic development (Long and Qu, 2018). At present, the academic research results on LUT are quite abundant, the research elements are also increasingly comprehensive, and many regular and enlightening conclusions have been produced. Lambin and Meyfroidt (2010) discussed whether the root cause of LUT was endogenous social ecological forces or exogenous social and economic factors. Quintero-Angel et al. (2021) explored LUT and landscape occupation in three historical periods in the South Pacific region of Colombia. Most of the existing researches on land use transition are carried out from the perspectives of socio-economic effect (Long and Qu, 2018), ecological effect (Asadolahi et al., 2018) and environmental effect (Asabere et al., 2020; Faiz et al., 2020). Therefore, in the global context of realizing the sustainable development goals related to land, understanding the process of regional LUT and its impact on ecological environment not only provides important guidance for solving the contradiction between man and land and regional environmental problems, but also contributes to realizing regional sustainable development.
In addition, LUT also affects ES. As a bridge between human society and ecosystem, ecosystem has become an important issue in many research fields, including ecological and environmental economics (Jiang et al., 2021). Ecosystems provide ecosystem services, tangible or intangible natural products, environmental resources, and ecological gains and losses for human beings, which can maintain human survival and promote social sustainable development (Klain et al., 2014; Li et al., 2014). Quantifying ecosystem services and analyzing their value changes is an important decision support tool for sustainable land use (de Groot et al., 2010). Therefore, the valuation of ES has become an important approach to address the global sustainability challenge. At present, the evaluation methods of ES mainly include ecological model method and benefit transfer method. Ecological modeling methods based on raw data usually require many input parameters and contain complex calculations, which are usually applied to a single service of a single ecosystem, and can only simulate the value of one or several ES, but cannot fully simulate the total ESV of an area (Notte et al., 2017). Therefore, it is only suitable for small spatial scale analysis (Remme et al., 2014). However, benefit transfer method can comprehensively assess the value of various ES in a region only based on land use data, which is suitable for ecosystem value assessment at large spatial scales (Anderson et al., 2017; Gashaw et al., 2018). Therefore, this method is widely used in the world. Using the benefit transfer method, Arowolo et al. (2018) assessed changes in the value of ecosystem services in response to land use/land cover dynamics in Nigeria. Wang et al. (2022) adopted the benefit transfer method to quantitatively assess the contribution of different LUT to ESV changes in Guizhou Province, providing valuable reference for the formulation and implementation of ecological restoration plans (ERP) and land use policies. Therefore, exploring land use change plays an important role in studying the value of regional ecological services.
Existing studies are mainly based on the perspectives of land use change (Vu et al., 2022; Xiao et al., 2022), landscape pattern (Hurskainen et al., 2019), and optimized land use structure (Gabriels et al., 2021; Ma and Wen, 2021), analyzed and discussed the relationship between different subjects and ESV from different perspectives such as county, province, city, and watershed. Wang et al. (2022) and Hoque et al. (2022) made appropriate corrections based on the previously given equivalent factor table, calculated and analyzed the characteristics of ESV combined with land use data. The research methods are relatively simple, and the results are limited to the quantitative, temporal and spatial distribution characteristics of regional ESV, and the deeper relationship analysis is shallow, which cannot reflect the comprehensive response of regional ecosystem to land use change. However, in the process of land use type transformation, the transformation of land use type will affect the structure and function of the ecosystem, thus changing the types and sizes of services provided by the ecosystem, which is one of the important factors affecting the sensitivity of the ecosystem. Therefore, LUT not only changes the structure, function and landscape pattern of land use, but also is closely related to ES, and is an important factor affecting the sensitivity of ES (Polasky et al., 2011; Dadashpoor et al., 2019; Qiu et al., 2021).
Ecological sensitivity refers to the sensitivity of the ecosystem to various natural and human activities, which can effectively reflect the possibility of ecological environmental problems when the regional ecosystem encounters disturbance (Ruhl et al., 2013). It is also an important means to study regional LUT and ES. Therefore, it is often used to measure the ecological and environmental effects of land use change (Sun et al., 2019). However, existing studies on ecological sensitivity mainly focus on the unidirectional transfer of land quantity, and less attention is paid to the bidirectional effect under LUT. Pan et al. (2012) analyzed the spatial characteristics of the sensitivity of single factor ecological problems and comprehensive ecological sensitivity, so as to provide guidance for future urban planning and development, ecological environment protection and harmonious development of society, economy and ecology. Therefore, the study of ecosystem service sensitivity is the key to the sustainable development of regional ecosystem and the comprehensive improvement of ecological environment. However, in the studies on sensitivity analysis of ecosystem services, scholars mainly used the traditional sensitivity coefficient analysis method proposed by Kreuter et al. (2001). It neglects that land use types are pluralistic. Then, some scholars tried to use land use intensity to analyze the sensitivity of ecological service value, so as to reflect the total response of ecological service value under land use change (Sannigrahi et al., 2018). However, it cannot reflect the response degree of ecological service value to each process of land use change, so it loses important information needed for land management. It can be seen that traditional sensitivity analysis methods cannot reflect the response degree of ESV to the inter-conversion process of each land use type, which has certain limitations (Liu et al., 2018). But in fact, land use transformation is a two-way street. However, in fact, LUT is bidirectional, that is, when one place is transformed into another, reverse transformation also exists (Haines-Young, 2009). However, CICS considers the net transformation between land use types, which can truly and effectively reflect the response degree of ecosystem service value to each process of land use change, and can also represent the sensitive direction, making it more practical in regional ecosystem research (Wei et al., 2022). It has been proved that the rational zoning of ecological space based on the evaluation of ecological CICS and ESV is of great significance for improving the regional ecological environment carrying capacity and promoting the harmony between man and nature. Based on this, we constructed the change contribution rate model of ESV and the CICS index, tried to explore the ESV under the background of LUT, and analyzed the sensitivity degree of ESV to LUT.
In general, this paper comprehensively reviewed the literature on ESV, in order to better clarify the innovation of this study in exploring the cross-sensitivity of ESV under LUT, and reviewed the current research progress in the field of ESV. The current research has achieved a lot of achievements, which has laid a solid foundation for this research, but there are still many subtle problems to be expanded. First of all, few scholars have conducted sensitivity measurement from the perspective of changes in ESV caused by pairwise changes in land use types, ignoring the essence of the change of ESV. Therefore, this study adopted CICS to explore the cross-sensitivity of ESV from the perspective of two-way LUT, and carried out sensitivity zoning in order to promote sustainable land use in each region. Secondly, existing studies mainly focused on the total and spatial changes of ESV caused by LUT, and paid little attention to the spatial differences in the contribution rates of change. Therefore, in order to fill the research gap on the spatial difference of contribution rate of ESV change, this study introduced the change contribution rate model to explore the spatial evolution characteristics and differences of the contribution rate of ESV change. Therefore, this study selected Jiangjin in Chongqing, where the urbanization level is rapidly increasing, as a case study. Using the data of land use transition in 2009, 2014 and 2019, we constructed the contribution rate model of ESV change and the CICS index. Then we analyzed the ESV effect of LUT in Jiangjin in recent 10 years, and pointed out the impact of LUT on the ecological value of this area. Based on the calculation results of CICS index, sensitivity zoning was carried out. It is expected to provide reference for the rapid development of urbanization, the rational use of regional land, the optimal allocation of resources, and the maximization of the value of ecosystem services in the process of conservation. Through in-depth analysis and evaluation of regional ecological sensitivity, spatial distribution can be found, which provides scientific basis for regional policies to prevent and control ecological environmental problems, which is a key link and an important way to achieve regional healthy development. In addition, we used the very helpful ArcGIS spatial analysis tool (designed to capture, analyze and represent spatial data) to analyze the spatial and temporal distribution characteristics of ESV and its cross-sensitivity. The tool can visually express the ESV and its evolution in each region, thus enabling decision makers to curb the trend towards unsustainable development in the context of land use and resource management. It can also help policy makers and authorities to better manage the region, so that cities can be optimized to promote sustainable land development in each region.
2 Research context and method
2.1 Theoretical analysis framework
The Pressure-State-Response model was developed in the late 1980s by the Organisation for Economic Co-operation and Development (OECD) and the United Nations Environment Programme (UNEP). After that, it has been widely used in the fields of resource and environment protection, land intensive use evaluation, sustainable development evaluation and so on. On the basis of PSR model, this paper added Effect research to analyze the mechanism of land use transformation (Figure 1). Population growth, urbanization and industrialization, rapid development of regional economy, adjustment of agricultural structure, environmental deterioration, market and globalization and other pressure factors form a tense man-land contradiction relationship with limited land resources, which affects the balance of land supply and demand. Under the pressure of the imbalance of supply and demand, the intensity of land use is increasing. In order to realize the protection of cultivated land and food security, the protection of built-up land and ecological protection and ecological security, it must be guided by relevant government policies. The result is the change of social production and life style, which leads to the change of land supply and demand, and then leads to the continuous reconstruction of different land use types in the region from conflict to coordination in quantity structure and spatial distribution (Zhou et al., 2022).
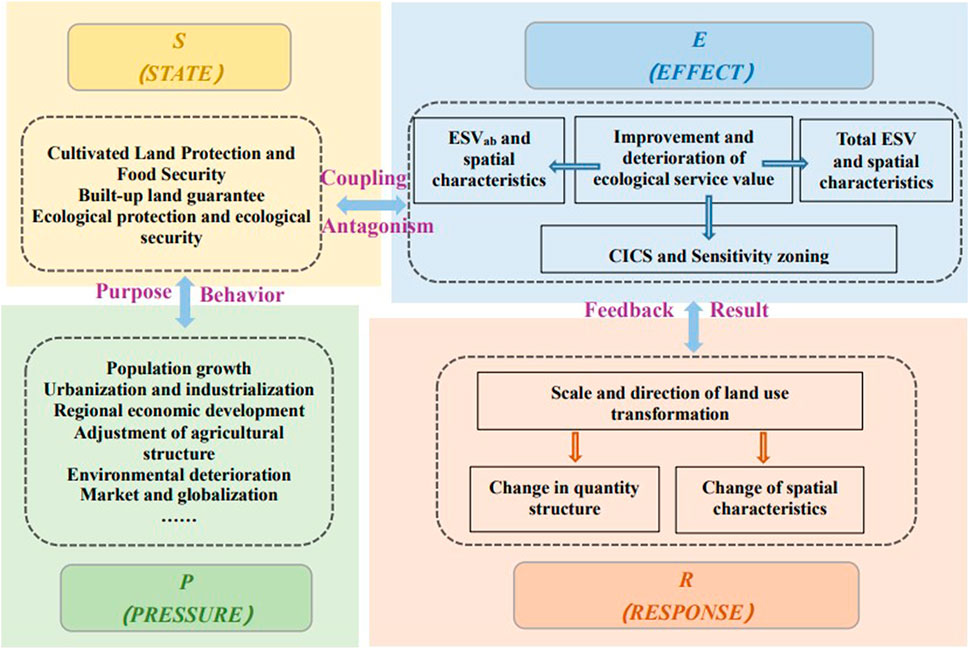
FIGURE 1. Framework diagram of land use transition mechanism based on “Pressure-State-Effect-Response” model.
Based on the above analysis, the hypothesis put forward in this paper is that the direct result of LUT is the improvement and deterioration of ESV, and the change of ESV will guide the change of land use mode and land use intensity. In this paper, the total value of ecosystem services, ESVab and CICS were introduced to analyze from two dimensions of quantitative and spatial distribution characteristics. The results can be used to formulate government policies and guide more rational land use transformation.
2.2 Research methods
2.2.1 Ecosystem service value
In this paper, based on the land use status and the research methods of Costanza et al. (1997) and Xie et al. (2015), the coefficient of ESV was determined, and the relevant research results of equivalent ecological service value per unit area were referred. According to the actual situation of Jiangjin, the ESV scale per unit area of Jiangjin (Table 1) was finally determined. The evaluation method of ESV adopted the equivalent per unit area method, and the calculation formula is as follows:
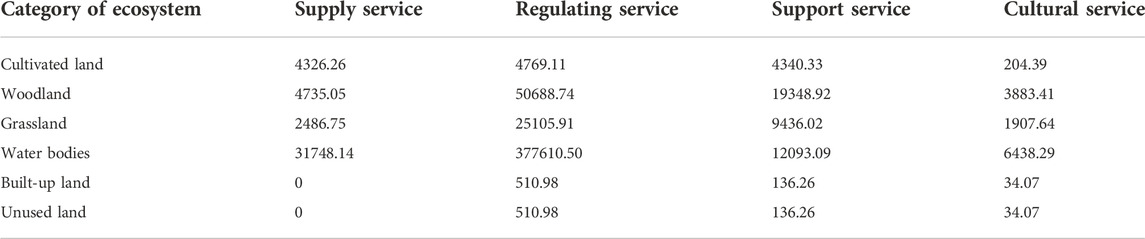
TABLE 1. Value of ecosystem services per unit area in Jiangjin (RMB/hm2/year).
In the formula:
2.2.2 Contribution rate of ecosystem service value change
Change contribution rate can represent the influence degree of total ESV change in a period of time by different land use types of ESV change, so as to reveal the main contributing factors affecting regional ecosystem service value (Hu et al., 2020). Therefore, based on the classification of ecosystem (Table 1), we introduced change contribution rate to analyze it.
In the formula:
2.2.3 Coefficient of improved cross-sensitivity
Coefficient of cross-sensitivity (CCS) refers to the impact of the area change of one land use type to another on the change of ESV, which is an index to characterize the response degree of ESV to the land use transformation per unit area, so as to quantify the response degree. However, since the change of land use type is often bidirectional, the essence of ESV change is the comprehensive reflection caused by the change of one land type area and the resulting change of another land type area. Although CCS meets the sensitive form, due to certain bias in the selection of the base period of the land area conversion ratio, it can only be concluded that “the ratio of the net land transfer area to the average area of the initial two classes increases by 1%, resulting in a change of ecosystem service value of several percent”. The calculated results are difficult to express the practical significance of the elasticity coefficient. Therefore, the CICS model is adopted in this paper. CICS refers to the extent to which a net transition between two different land use types contributes to or suppresses changes in the value of ecosystem services. It can well reflect the degree of impact of net transformation between different land classes on the change of ecosystem service value.
Based on the essence of ESV change and referring to existing related achievements (Hu et al., 2020; Wei et al., 2022), we constructed a Coefficient of improved cross-sensitivity to investigate the impact of pairwise conversion among different land use types on ecosystem service value change in Jiangjin. When the Coefficient of improved cross-sensitivity (CICS) is greater than 0, it means that the net transformation of the two types of land classes will promote the ecosystem service functions; otherwise, it will inhibit the ecosystem service functions. As the analysis object of sensitivity, the larger the absolute value of CICS is, the more sensitive ecosystem services are to the land use types of the two transitions, and the less sensitive otherwise. The CICS is as follows:
In the formula:
3 Study area and data sources
3.1 Study area
Jiangjin is located in the southwest of Chongqing, between 105°49′ E and 106°38′ E, and 28°28′ N and 29°28′ N (Figure 2). The landform in the area is mainly hilly and low mountains. It has prominent geographical advantages and is located in the modern metropolitan circle of Chongqing, with a rapid development momentum. By the end of 2019, the GDP of the whole region was 103.67 billion RMB, up by 8.6% year on year; Per capita GDP reached 74452 RMB, up 7.7 percent year on year. At the end of the year, the permanent resident population was 1.398 million, accounting for 69.76% of the urbanization rate. Jiangjin is located at the end of the Chongqing section of the Three Gorges Reservoir Area, and the main stream of the Yangtze River runs through the whole area from southwest to northeast. It is an important ecological barrier of Chongqing and even the whole Three Gorges Reservoir area. Due to the rich mountains and rivers resources and the large relief of the terrain, the region has created a unique “mountain-riverside” three-dimensional resource landscape, the area’s mountains, forests, fields, lakes and grass ecological elements crisscross, integrated. However, with the continuous improvement of the level of economic development and the interaction between cities and cities is increasingly frequent. Especially with the continuous intervention of the follow-up project of the Three Gorges and the construction of industrial parks in recent years, the ecological environment pattern in the area has changed greatly. It is manifested in the continuous compression of ecological space, aggravated soil and water loss, increasingly serious water pollution and soil non-point source pollution, sharp reduction of biodiversity, and homogenization of ecological landscape, which seriously restrict the sustainable development of regional social economy. To deal with the contradiction between protection and development, ecology and economy has become the key problem to be solved in the future development of Jiangjin.
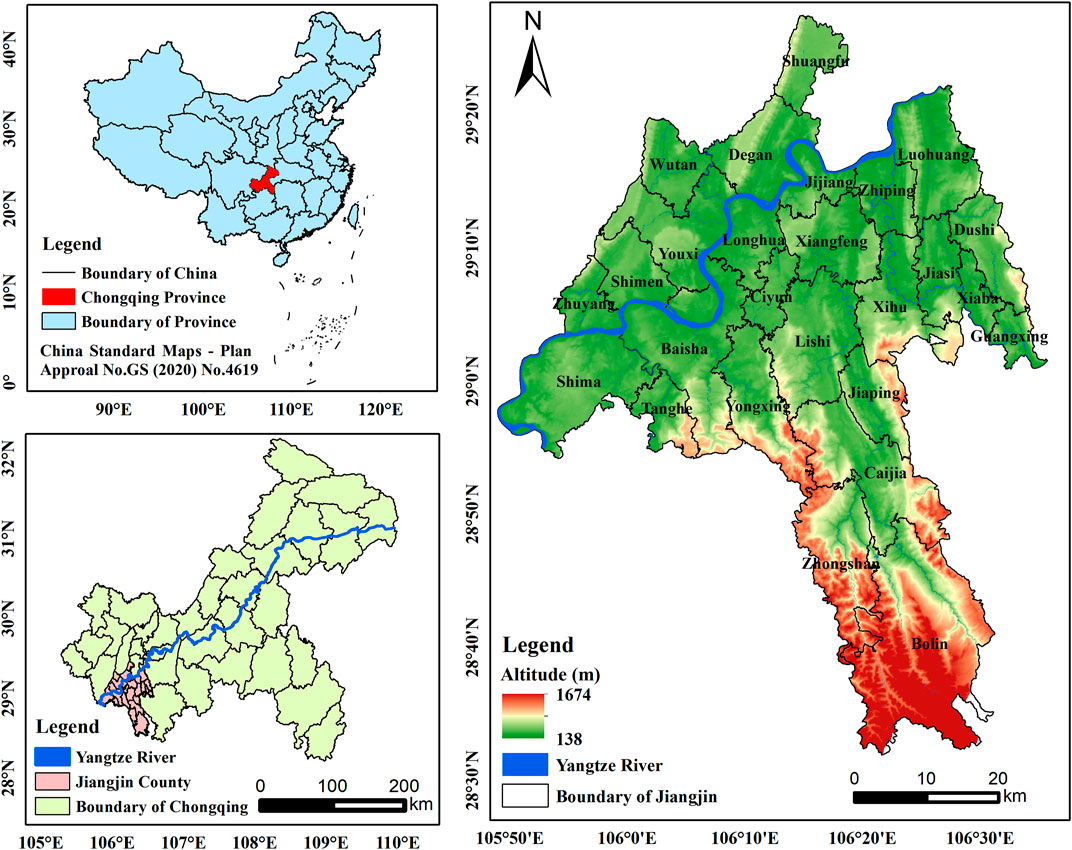
FIGURE 2. Location of study area.
3.2 Data sources
The data used in this study mainly include: 1) land use types of 2009, 2014 and 2019 were interpreted based on Landsat OLI/ETM image (http://www.gscloud.cn) and Google Earth image data (https://earth.google.com). Through field investigation and careful comparison with the interpretation results of land type, the interpretation accuracy is higher than 96.3%. 2) The socio-economic data were obtained from the Statistical Yearbook and the Statistical Bulletin of Jiangjin District.
4 Result
4.1 Spatial-temporal pattern analysis of land use change
Among the land use types in Jiangjin, the cultivated land and woodland are the most widely distributed, with the cultivated land mainly distributed in the middle and the woodland mainly distributed in the southern Simian Mountain (Figure 3). In 2019, the area of cultivated land and woodland in Jiangjin was 99178 square hectometer (hm2) and 172865 hm2, accounting for 31.01% and 54.05% of the total area, respectively. In the same period, the proportion of grassland and water bodies is relatively small. The area of unused land is 488 hm2, which is concentrated in Simian Mountain, accounting for only 0.15% of the total land area of Jiangjin, indicating that the land development and utilization degree of Jiangjin is relatively high, and the land reserve resources are insufficient. Affected by topography and landform, rural built-up land is scattered throughout the whole area in a star-like manner, while urban built-up land is mainly distributed in towns such as Degan, Shuangfu, Shengquan, Dingshan, Jijiang and Zhiping in the north of Jiangjin.
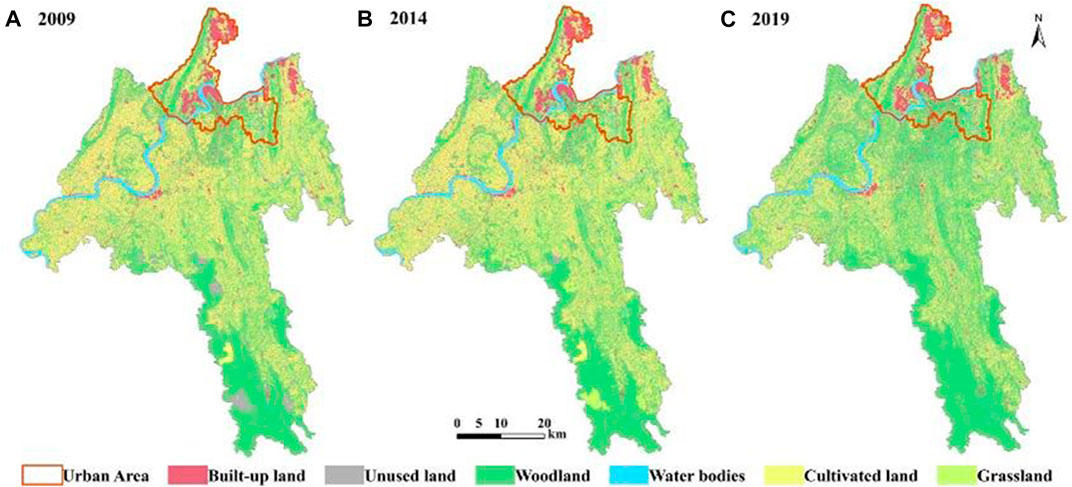
FIGURE 3. Land use of Jiangjin in 2009, 2014, and 2019. (A): Distribution of land use types in Jiangjin in 2009; (B): Distribution of land use types in Jiangjin in 2014; (C): Distribution of land use types in Jiangjin in 2019.
In order to explore the internal transformation of different regions, the spatial analysis function of ArcGIS was used to superposition the land use data of 2009, 2014 and 2019 (Figure 4 and Figure 5). According to the net area of pair conversion of land use types, it was divided into four grades: I, II, III and IV, which represented “basically no change” (0–100 hm2), “little change” (101–200 hm2), “great change” (201–700 hm2) and “greatest change” (>700 hm2), respectively. From 2009 to 2014, there were five types of grade I, which were cultivated land-woodland, cultivated land-built-up land, grassland-water bodies, water bodies-built-up land, and water bodies-unused land; there are five types in grade II, which were cultivated land-water bodies, woodland-water bodies, woodland-built-up land, grassland-built-up land, and built-up land-unused land; there were five types of grade IV, which were cultivated land-grassland, cultivated land-unused land, woodland-grassland, woodland-unused land, and grassland-unused land. The result of conversion was an increase of 252 hm2 in cultivated land area, 222 hm2 in woodland area, 5747 hm2 in grassland area, 281 hm2 in water bodies, 245 hm2 in built-up land area and 5695 hm2 in unused land. From 2014 to 2019, there were five types of class I, which were grassland-water bodies, grassland-built-up land, grassland-unused land, water bodies-unused land, and built-up land-unused land; in level II, there was only cultivated land-unused land; there were four types of grade III, which were cultivated land-grassland, cultivated land-built-up land, woodland-water bodies, and water bodies-built-up land; there were five types of grade IV, which were cultivated land-woodland, cultivated land-water bodies, woodland-grassland, woodland-built-up land, and woodland-unused land. The conversion results in a decrease of 39049 hm2 of cultivated land, an increase of 46661 hm2 of woodland, a decrease of 5582 hm2 of grassland, an increase of 4369 hm2 of water bodies, a decrease of 5089 hm2 of built-up land, and a decrease of 1310 hm2 of unused land.
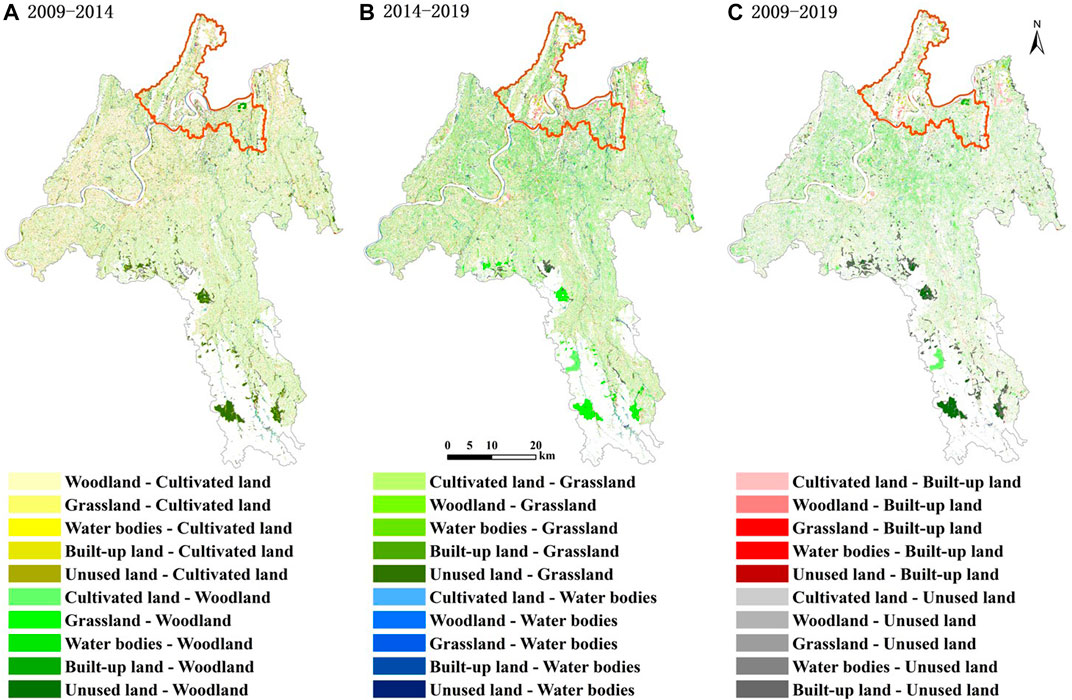
FIGURE 4. Land use changes in Jiangjin during 2009–2019. (A): land use changes in Jiangjin from 2009 to 2014; (B): land use changes in Jiangjin from 2014 to 2019; (C): land use changes in Jiangjin from 2009 to 2019.
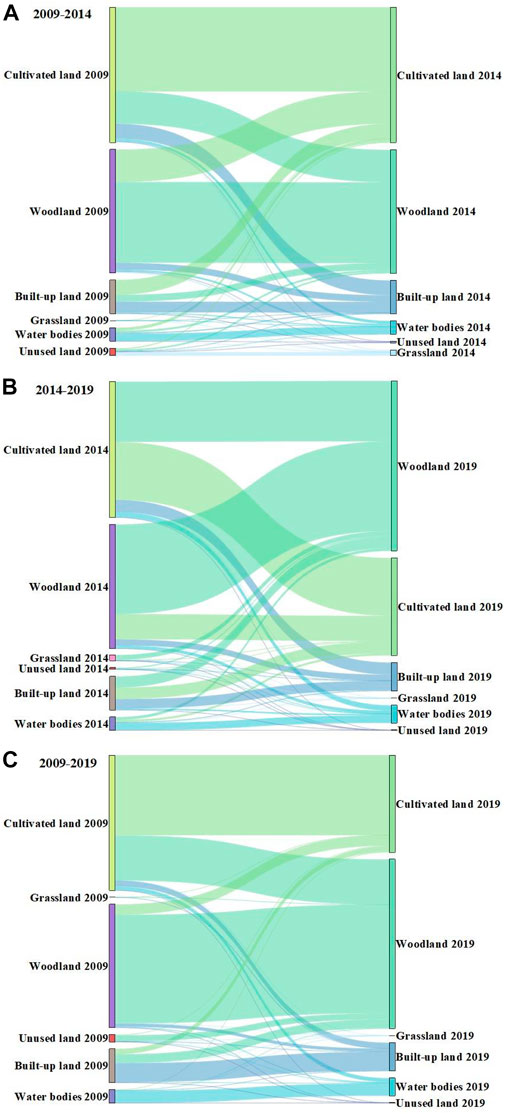
FIGURE 5. Mulberry map of land use change in Jiangjin during 2009–2019. (A): the area of land use change in Jiangjin from 2009 to 2014; (B): the area of land use change in Jiangjin from 2014 to 2019; (C): the area of land use change in Jiangjin from 2009 to 2019.
From 2009 to 2019, the magnitude and grade of changes in the 2009–2014 were smaller than those in the 2014–2019. Superposition the changes of the two periods showed that there were 7 types of I, which were cultivated land-grassland, woodland-grassland, grassland-water bodies, grassland-built-up land, grassland-unused land, water bodies-built-up land, and water bodies-unused land; in II, there was only one type, built-up land-unused land; there were three types of level III, which were cultivated land-built-up land, cultivated land-unused land, and woodland-water bodies; there were four types of IV, which were cultivated land-woodland, cultivated land-water bodies, woodland-built-up land, and woodland-unused land. As a result of the conversion, the cultivated land area decreased by 38797 hm2 in 2019 compared with 2009, which was mainly converted to woodland, built-up land and water bodies; the area of built-up land decreased by 5334 hm2, which was mainly converted to woodland and cultivated land; the unused land area decreased by 7006 hm2, which was mainly converted to woodland and cultivated land; the woodland area increased by 46883 hm2, the main types converted to woodland were built-up land, unused land and cultivated land; the area of water bodies increased by 4088 hm2, the main types converted to water bodies were cultivated land and woodland; grassland increased significantly from 2009 to 2014, and then decreased significantly from 2014 to 2019, with little change in total. It showed that the development of rural tourism, the adjustment of agricultural industrial structure, the policy of returning farmland to forest and grassland, and the implementation of land development and consolidation have greatly changed the land use types in Jiangjin. However, due to the influence of natural conditions, infrastructure, social and economic development level and policy system in each region, the change degree of land use types in different regions was different.
4.2 Spatial and temporal variation analysis of ESV
4.2.1 Analysis of changes in total value of ecosystem services
According to Eq. 1, the total ESV of Jiangjin and villages in 2009, 2014 and 2019 were calculated (Table 2 and Figure 6). The value of ES in Jiangjin in 2009, 2014 and 2019 was 17.796 billion RMB, 17.916 billion RMB and 22.702 billion RMB respectively, showing an increasing trend year by year. Based on the research of Li and Chen (2021), we used the natural break point method in ArcGIS software to divide the total ESV of each village into four grades: Ⅰ, Ⅱ, Ⅲ and Ⅳ, respectively representing the system development states of “bad”, “poor”, “fair” and “good” (Figure 6), and counted the occurrence frequency of villages of different grades. From 2009 to 2014, there were 215 ESV grades that did not change, 5 of them increased, and only 2 of them decreased. From 2014 to 2019, there were 170 ESV grades that did not change, 49 of them increased, and 3 of them decreased. In general, the number of villages with good ESV did not increase significantly, only 3 in 2009 increased to 5 in 2019, but the number of villages with poor ESV decreased rapidly, from 145 in 2009 to 104 in 2019, a decrease of nearly 30%. The value of ecosystem services in Jiangjin showed a good trend, with an increase in high grade villages and a significant decrease in low grade villages.
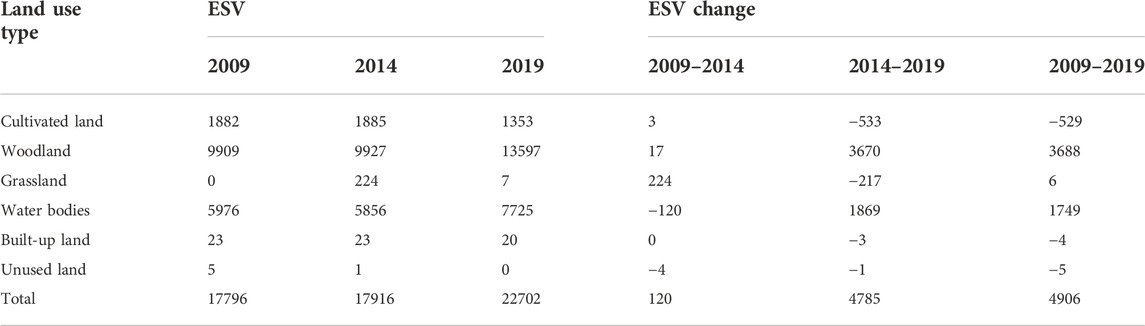
TABLE 2. Changes of ESV in Jiangjin during 2009–2019 (million RMB/hm2/year).
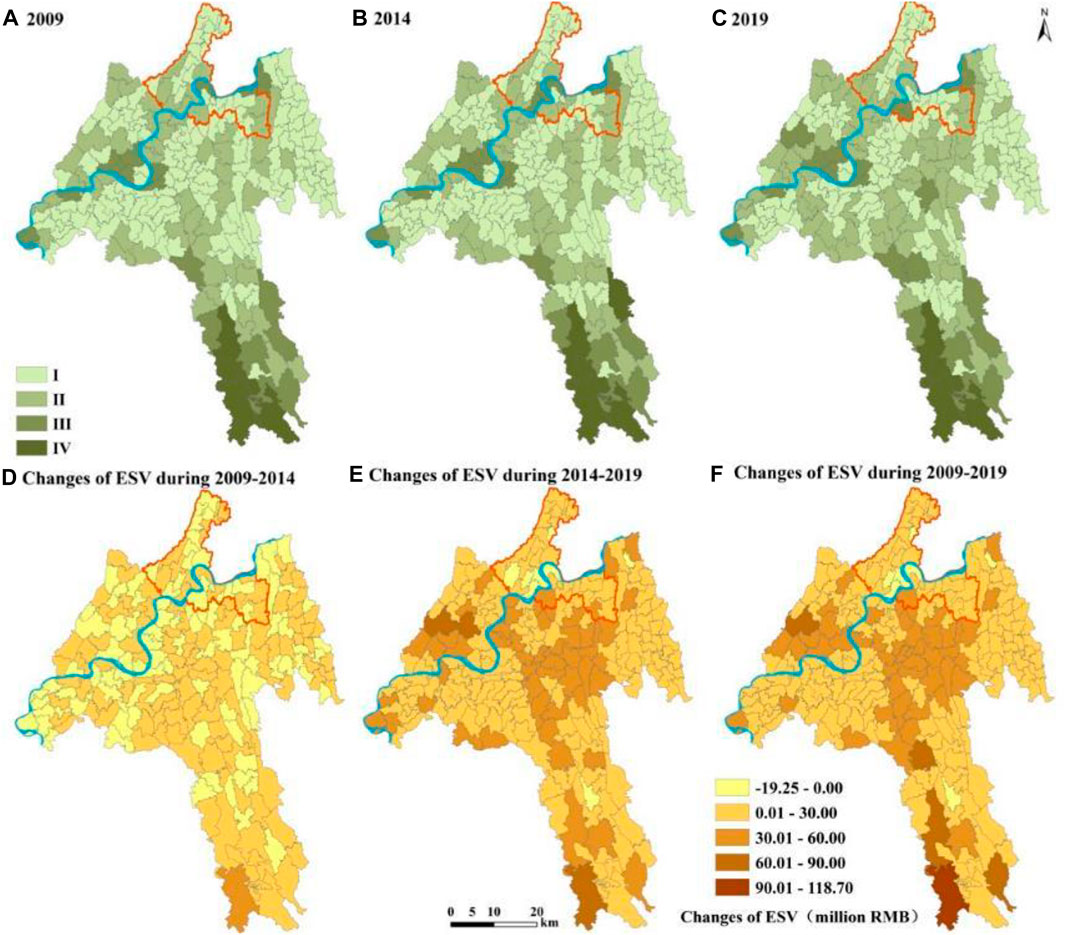
FIGURE 6. Spatial and temporal changes of ecosystem service in jiangjin from 2009 to 2019. (A–C) represent the grades of ecosystem service value in Jiangjin in 2009, 2014 and 2019, respectively; (D): change of ecosystem service value in Jiangjin from 2009 to 2014; (E): change of ecosystem service value in Jiangjin from 2014 to 2019; (F): change of ecosystem service value in Jiangjin from 2009 to 2019.
From the perspective of spatial distribution, the areas with good ESV were mainly concentrated in the southern Simian Mountain and the central agricultural concentration areas. Taking the Yangtze River as the boundary, the ESV of the southern part of the Yangtze River was better than that of the northern part, but the ESV of the northern and southern parts of the Yangtze River increased to different degrees. The central and southern regions have relatively high terrain, which is due to the implementation of the policy of returning farmland to forest or grassland and land development and consolidation. A large area of unused land, grassland and cultivated land was transformed into woodland, and the value of ES increased greatly. The east and west sides of the central part of the relatively flat terrain, cultivated land concentration, Jiangjin is the traditional main grain production areas. However, due to the adjustment of agricultural industry structure and the development of rural tourism, part of cultivated land was transformed into woodland, so the ESV increased slightly. Jiangjin urban built-up area is distributed in the north, which is also the main expansion area of Jiangjin town. Land use was transformed to built-up land, and the landscape pattern of land use gradually tended to be homogenized. The value of ecosystem services did not change much, and some villages showed a decline. In general, the ESV of Jiangjin did not show obvious urban-rural division, and the ESV of Jiangjin showed great spatial differences in the urban area, the urban-rural fringe and the rural area.
4.2.2 Analysis of contribution rate of ESV change
From 2009 to 2019, the woodland area in Jiangjin increased by 46882 hm2, the water bodies increased by 4088 hm2, the cultivated land area decreased by 38798 hm2, the built-up land area decreased by 5334 hm2, the unused land area decreased by 7006 hm2, and the grassland area did not change much (Figure 7). From 2009 to 2019, the largest increase of ecological service value in Jiangjin was woodland, which was 3.688 billion RMB; the second was water bodies, with an increase of 1.749 billion RMB; cultivated land was reduced by 529 million RMB; there was little change in built-up land, unused land and grassland (Table 2).
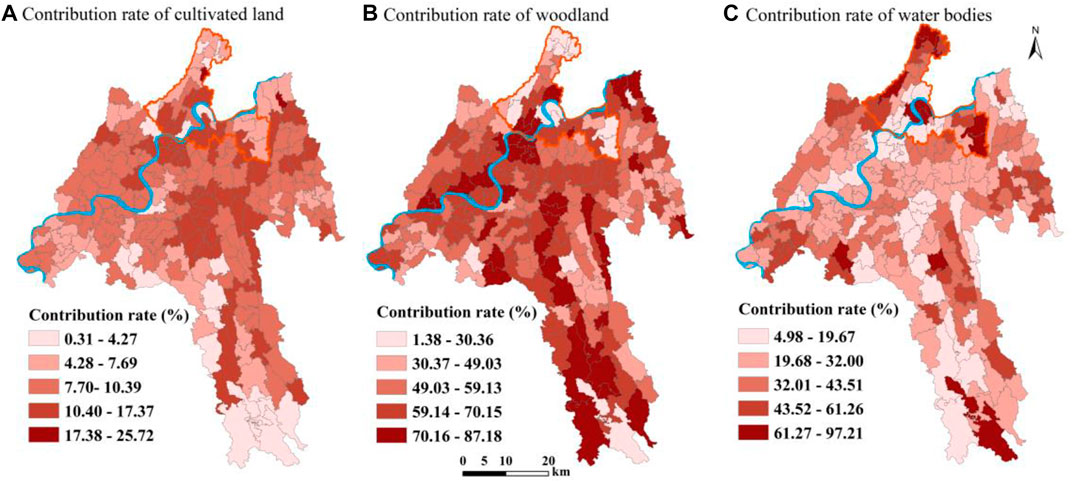
FIGURE 7. Contribution rate of land use ecosystem service value change in Jiangjin from 2009 to 2019. (A): contribution rate of cultivated land from 2009 to 2019; (B): contribution rate of woodland from 2009 to 2019; (C): contribution rate of water bodies from 2009 to 2019.
The contribution rate of the change of ESV (hereinafter referred to as “contribution rate”) of each land use type from 2009 to 2019 was calculated, it was found that the contribution rate of woodland was the largest, accounting for 61.66%; the second was water bodies, the contribution rate was 29.25%; The third is cultivated land, the contribution rate was 8.85%; finally, the contribution rate of built-up land, unused land and grassland was slight. Woodland, water bodies and cultivated land were the main contributing factors of ESV change in Jiangjin. The data showed that the ESV per unit area of built-up land and unused land was not high, and the change of grassland transformation was not large, resulting in large changes in the area of these three land categories but little change in the value of ecological services. The overall change trend of contribution rate is similar to the change quantity, and the change of each area is the fundamental reason for the change of ESV in Jiangjin.
The contribution rate of ESV of different types of land use is also different in spatial distribution. The contribution rate of cultivated land was 0.31%–25.72%, the contribution rate of woodland was 1.38%–87.18%, and the contribution rate of water bodies was 4.98%–97.21%. The contribution rate of cultivated land and woodland was highly correlated with topography and slope; the contribution rate of cultivated land was higher in villages with lower topography and smaller slope; the contribution rate of woodland was higher in villages with higher topography and higher slope; the contribution rate of water bodies has no obvious spatial distribution.
4.3 Cross-sensitivity analysis of ESV
Cross-sensitivity considers the net conversion between different land types and assumes that when one land type changes to other land types, the remaining land types remain unchanged. Therefore, in a certain period of time, the difference of area change between each two types of land will lead to the difference of the change rate of ecosystem service value. In addition, because the net conversion between different classes is also different, the cross-sensitivity results of different conversion types show different characteristics. Based on the calculation results of CICS, the analysis was carried out from quantitative characteristics and spatial characteristics.
4.3.1 Quantitative analysis of cross sensitivity of ESV
In order to further explore the ESV of Jiangjin, we calculated the corresponding CICS for 15 pairwise conversion types of 6 land types in three periods of 2009–2014, 2014–2019 and 2009–2019 (Figure 8).
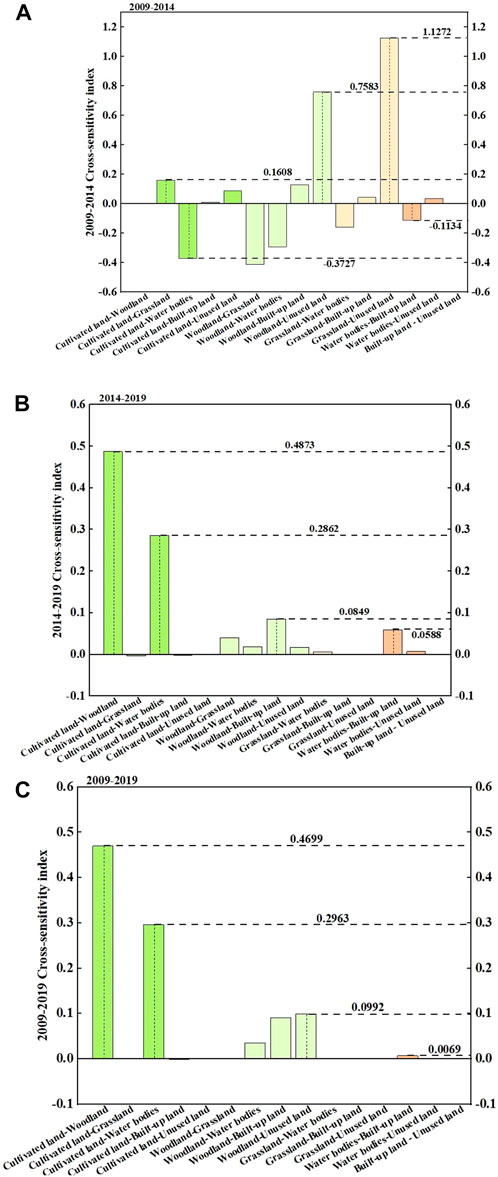
FIGURE 8. Cross-sensitivity index of ecosystem service value in Jiangjin during 2009–2019. (A): cross-sensitivity of ecosystem service value from 2009 to 2014; (B): cross-sensitivity of ecosystem service value from 2014 to 2019; (C): cross-sensitivity of ecosystem service value from 2009 to 2019.
Cross-sensitivity between cultivated land and other land types. At the beginning of the study, the conversion of cultivated land to grassland and woodland was net transfer out, and the conversion of built-up land and unused land to cultivated land was net transfer in, which increased the ESV, the CICS were 0.1608, 0.0028, 0.0095 and 0.0889, respectively, indicating that the transformation of land type promoted the change of ESV. In the later stage of the study, the conversion of cultivated land to woodland and water bodies was net transfer out, the conversion of unused land to cultivated land was net transfer, which increased the ESV and CICS were 0.4873, 0.2862 and 0.0004, respectively; also, a certain amount of cultivated land was converted to built-up land and grassland to cultivated land, which reduced ESV, and CICS were −0.0018 and −0.0033, respectively, indicating that the transformation of land type promoted the change of ESV much more than inhibited it.
Cross-sensitivity between woodland and other land types. At the beginning of the study, the conversion from woodland to grassland was net transfer out, the conversion from water bodies to woodland was net transfer in, which reduced ESV, with CICS values of -0.4136 and -0.2933, respectively, indicating that the transformation of land type inhibited the change of ESV; however, the conversion of built-up land and unused land to woodland was a net transfer, which increased the ESV, and the CICS were 0.1288 and 0.7583, respectively, indicating that the conversion of land type promoted the change of ESV. In the later period of the study, a large amount of grassland, built-up land and unused land converted to woodland into net transfer, and a small amount of woodland converted to water bodies into net transfer, which increased the ESV, and the CICS were 0.0397, 0.0849, 0.0171 and 0.0185, respectively, indicating that the transformation of land class promoted the change of ESV.
Cross-sensitivity between grassland and other land types. At the beginning of the study, the conversion of woodland and water bodies to grassland was net transfer, which reduced ESV with CICS of -0.4136 and -0.1601, respectively; however, in the later period of the study, the conversion of grassland to woodland and water bodies was a net outflow, which increased the ESV and CICS to 0.0397 and 0.0061, respectively; the results showed that the transformation of land type inhibited ESV in the early stage and promoted ESV in the later stage, and the two were basically neutralized. At the beginning of the study, the conversion of cultivated land, built-up land and unused land to grassland was net transfer, which increased the ESV with CICS of 0.1608, 0.0428 and 1.1272, respectively; In the later period of the study, the conversion of grassland to cultivated land and built-up land was a net outflow, which reduced the ESV and CICS to -0.0033 and -0.0007, respectively; This indicated that the terrestrial transition promoted ESV changes in the early stage and inhibited them in the later stage, and they were basically neutralized.
Cross-sensitivity between water bodies and other land types. At the beginning of the study, except that the conversion from unused land to water bodies was net transfer (0.0355); the conversion of water bodies to other land types was net transfer out, which reduced ESV, with the CICS were cultivated land (−0.3727), woodland (−0.2933), grassland (−0.1601) and built-up land (−0.1134). In the later period of the study, the conversion of water bodies to unused land and built-up land was net transfer (0.0068, 0.0588); the conversion of other land types to water bodies was also a net transfer, which increased ESV, with the CICS ranked as cultivated land (0.2862), woodland (0.0185), and grassland (0.0061).
Cross-sensitivity between built-up land and other land types. There was no sensitivity for built-up land and unused land. At the beginning of the study, except for a small number of water bodies, the conversion to built-up land was net transfer (−0.1134); the conversion of built-up land to other land types was a net transfer, resulting in an increase in ESV, and the CICS were woodland (0.1288), grassland (0.0428) and cultivated land (0.0095). In the later period of the study, the conversion of cultivated land and grassland to built-up land was a net transfer, which reduced the ESV slightly, and the CICS were −0.0018 and −0.0007 respectively; however, the conversion of built-up land to woodland and water bodies was a net transfer out, which greatly increased the ESV, and CICS were 0.0849 and 0.0588, respectively.
Cross-sensitivity between unused land and other land types. During the whole study period, the conversion of unused land to other land types was net transfer out, which increased ESV. At the beginning of the study, the CICS were grassland (1.1272), woodland (0.7583), cultivated land (0.0889), and water bodies (0.0355). In the later period of the study, the sensitivity of unused land-woodland (0.0171) was high, while the sensitivity of unused land-water bodies (0.0068) was low. The sensitivity of unused land-water bodies and unused land-grassland was lack.
Throughout the whole study period from 2009 to 2019, the transition highly sensitive to ESV change was ranked as cultivated land-woodland (0.4699) and cultivated land-water bodies (0.2963) according to the size of CICS. The transitions that were moderately sensitive to ESV changes were woodland-unused land (0.0992), woodland-built-up land (0.0911), woodland-water bodies (0.0353). The transitions with low sensitivity to ESV changes were water bodies-built-up land (0.0069), cultivated land-unused land (0.0016), cultivated land-built-up land (−0.0011). The transitions that were not sensitive to ESV changes included water bodies-unused land, transformation of grassland and other land types, and built-up land-unused land.
4.3.2 Cross-sensitivity partitioning of ESV
According to the cross-sensitivity response results of ESV under LUT in Jiangjin. ArcGIS natural break point method was used for grade division, we obtained the cross-sensitivity partition from 2009 to 2019 (Figure 9), analyzed the spatial distribution characteristics of the cross-sensitivity of ESV value in Jiangjin.
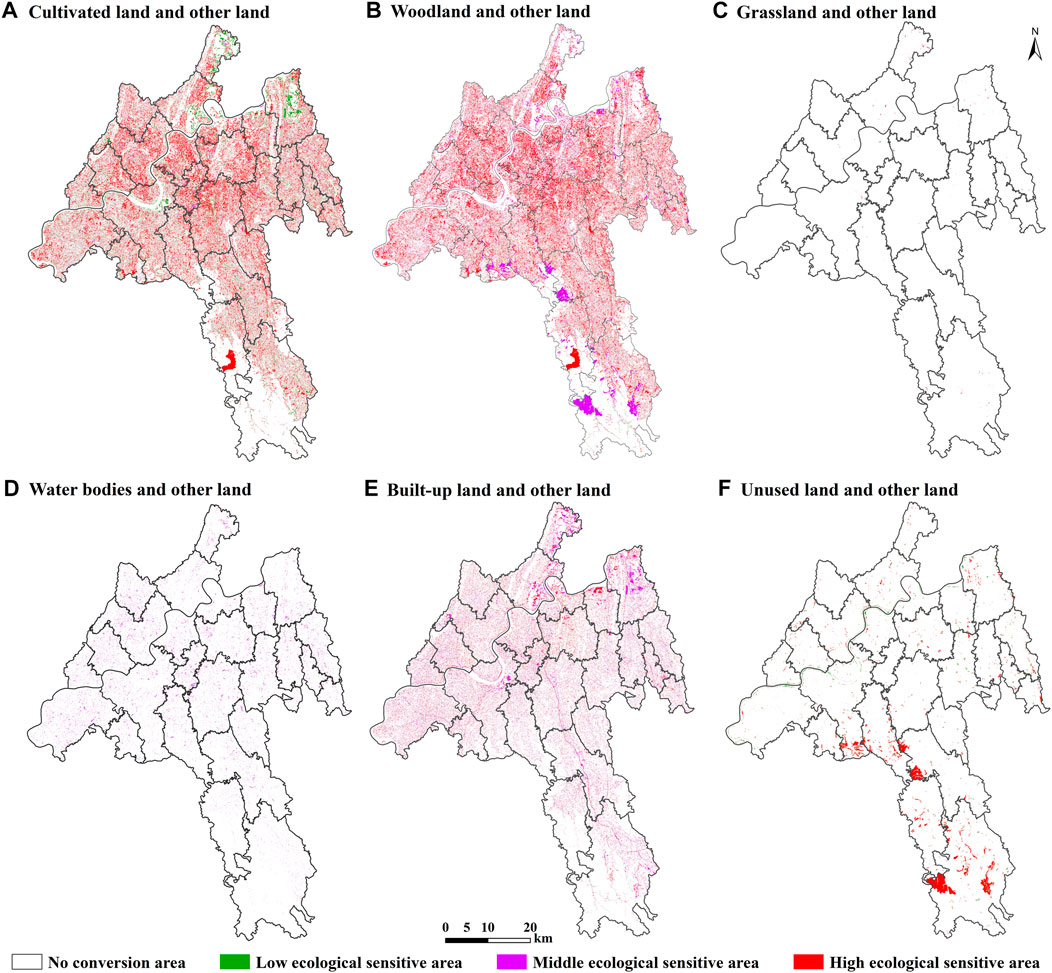
FIGURE 9. Cross-sensitivity zoning of ecosystem service value in Jiangjin from 2009–2019. (A–F) represent the cross-sensitivity zoning of cultivated land and other land, woodland and other land, grassland and other land, water bodies and other land, built-up land and other land, unused land and other land, respectively.
From 2009 to 2019, the cross-sensitivity of conversion between cultivated land and other land types in Jiangjin was at a medium-low level on the whole, and the low ecological sensitive areas were mainly distributed in the west of Jiangjin. The cross sensitivity between woodland and other land types was at a medium level, and the low ecological sensitive areas were mainly distributed in the northern and southern mountains of Jiangjin. There were few net conversions between grassland and other land types, so the cross-sensitivity zones of these conversion types were scattered, and most of them were no net conversions. The low ecologically sensitive areas were mainly distributed in the south and north, the high ecologically sensitive areas were mainly concentrated in the east, and there were almost no ecologically sensitive areas in the west.
The cross sensitivity of the conversion between water bodies and other land types was high. These high ecologically sensitive areas were dominant in Jiangjin, but there were also many areas in the north and south of Jiangjin that belong to the low ecologically sensitive areas. The low ecological sensitive areas in the south were mainly distributed in the Simian Mountain, and the low ecological sensitive areas in the north were distributed along the Yangtze River. The conversion between built-up land and other land types was mostly middle and high ecological sensitive area. The low ecological sensitive areas were mainly distributed in the south of Jiangjin, the middle ecological sensitive areas were mainly in the west, and the high ecological sensitive areas near the main city area in the north were relatively more concentrated. The net conversion between the unused land and other land types was less, and the ecologically sensitive areas also showed sporadic distribution. However, these conversion types were more ecologically sensitive areas than grassland and other land types, mainly showing high ecologically sensitive areas, and concentrated in the south and north of Jiangjin along the Yangtze River.
5 Conclusion and discussion
5.1 Conclusion
In this study, three phases of Jiangjin land use data from Landsat OLI/ETM image data and Google Earth image data were selected. We combined the spatial analysis method of ArcGIS software to analyze the spatial and temporal changes of ESV, the contribution rate of LUT to the change of ESV, and the impact of cross-sensitivity in the region. In addition, partition was conducted according to the cross-sensitivity measurement results, and the following results were obtained:
1) In terms of land use transformation, cultivated land, built-up land and unused land decreased significantly, while woodland and water bodies increased significantly from 2009 to 2019 in Jiangjin. The area of grassland increased first and then decreased, with a significant increase from 2009 to 2014 and a significant decrease from 2014 to 2019, with little change in total.
2) In terms of the spatial and temporal changes of ESV, the total amount of ESV in Jiangjin from 2009 to 2019 was 17.796 billion RMB, 17.916 billion RMB and 22.702 billion RMB, respectively, showing an increasing trend year by year. Among the ESV types, woodland > water bodies > cultivated land > built-up land > grassland. From the perspective of time series, the ESV of woodland changed the most from 2009 to 2019, which increased by 3.688 billion RMB; secondly, water bodies and cultivated land increased by 1.749 billion RMB and decreased by 529 million RMB respectively; finally, there was little change in built-up land, unused land and grassland. From the perspective of spatial distribution, the areas with good ESV in Jiangjin were mainly concentrated in the southern Simian Mountain and the central agricultural concentration area. The ESV in the southern part of the Yangtze River was better than that in the northern part of the Yangtze River. In addition, the ESV of Jiangjin did not show obvious urban-rural division, and the ESV of Jiangjin showed great spatial differences in the urban area, the urban-rural fringe and the rural area.
3) The contribution rate of woodland change from 2009 to 2019 was the largest in Jiangjin, reaching 61.66%; secondly, the contribution rate of water bodies and cultivated land was 29.25% and 8.85%, respectively; the contribution rate of cultivated land and woodland is highly correlated with topography and slope, while the contribution rate of water bodies has no obvious spatial distribution characteristics.
4) In terms of cross-sensitivity of ESV, among the 15 conversion types of 6 land types in Jiangjin, the CICS between cultivated land, woodland and other land types was higher, and the response degree of ESV to these conversion types was more obvious. The conversion between built-up land and unused land has almost no effect on the change of ESV. Because the net conversion between grassland and unused land and other land types is less, the ecologically sensitive areas of these conversion types are mostly scattered, and it is difficult to form a large area of concentrated ecologically sensitive areas.
5.2 Discussion
The research on ESV based on LUT has been extensive, but there is still a need for innovation in methods. In order to expand the research perspective and ideas and deepen the research results of this paper, the adoption of research methods and main conclusions in this paper were further discussed.
In this paper, change contribution rate and CICS were introduced to comprehensively analyze the effects of ESV under LUT, which enriches the research methods. In order to reveal the ecosystem effect caused by regional land use change. Wang and Cao (2021), Wang et al. (2020) and Yi et al. (2016) constructed the contribution rate model. However, only quantitative characteristics of contribution rate were measured and analyzed. In order to further investigate the spatial distribution differences of contribution rate, this paper also analyzed the impact of topography and slope on contribution rate.
The CICS used in this paper made the results more realistic. Wang et al. (2020) analyzed the sensitivity of ESV to coefficient changes by constructing sensitivity index. However, the impact of the transformation between different land use types on the value of ecosystem services was not considered. Because the change of land use type is always bidirectional, the essence of the change of ESV is the comprehensive reflection caused by the change of one type of land area and the resulting change of another type of land area. Therefore, this paper adopted CICS to explore the cross-sensitivity of ESV from the perspective of two-way LUT, and conducted sensitivity zoning in order to promote sustainable land use in each region. It can not only reflect the influence degree of net conversion between different land types on the change of ESV, but also provide a more intuitive scientific basis for optimizing the regional land use pattern and regulating the LUT. This brings a new perspective for the study of ESV.
According to the empirical results of this paper, the ESV of Jiangjin increased year by year. This is consistent with the study of Zhou et al. (2022). Since 2000, when the Three Gorges Dam was continuously closed for water storage, the national and local governments have adopted and implemented a series of policies, plans and ecological projects to protect the ecological environment in the region. As Chongqing accelerated the construction of the ecological barrier of the Three Gorges Reservoir, one of the main reasons for the significant increase of the ESV in Jiangjin was the effective implementation of the policy of returning farmland to forest and land development and consolidation. The large increase of woodland area increased the total ESV in this area. The value of ecosystem services per unit area of water bodies was the largest, and a large area of cultivated land and woodland were converted to water bodies, which increased the value of ecosystem services, and the value of ecological services was sensitive to these conversion types. On the basis of the research conclusions of Zhao et al. (2022), it is proved that the conversion from land types with lower ecological value equivalent factors to land types with higher ecological value equivalent factors would affect the regional ecological environment quality, but such conversion showed positive effects.
Data availability statement
Publicly available datasets were analyzed in this study. This data can be found here: The data used in this study mainly include: 1) land use types of 2009, 2014 and 2019 were interpreted based on Landsat OLI/ETM image (http://www.gscloud.cn) and Google Earth image data (https://earth.google.com). 2) The socio-economic data were obtained from the Statistical Yearbook and the Statistical Bulletin of Jiangjin District.
Author contributions
CZ: Writing- Reviewing and Editing. HT: Writing-Reviewing and Editing. MZ: Supervision and Data collection. ZW: Methodology.
Funding
This work was supported by the general project of Chongqing Social Science Planning “Research on Sustainable Development of Livelihood of Poverty-alleviation Households Driven by New Rural Communities and Rural Tourism” (Grant No. 2022NDYB80).
Conflict of interest
The authors declare that the research was conducted in the absence of any commercial or financial relationships that could be construed as a potential conflict of interest.
Publisher’s note
All claims expressed in this article are solely those of the authors and do not necessarily represent those of their affiliated organizations, or those of the publisher, the editors and the reviewers. Any product that may be evaluated in this article, or claim that may be made by its manufacturer, is not guaranteed or endorsed by the publisher.
References
Anderson, S. J., Ankor, B. L., and Sutton, P. C. (2017). Ecosystem service valuations of South Africa using a variety of land cover data sources and resolutions. Ecosyst. Serv. 27, 173–178. doi:10.1016/j.ecoser.2017.06.001
Arowolo, A. O., Deng, X., Olatunji, O. A., and Obayelu, A. E. (2018). Assessing changes in the value of ecosystem services in response to land-use/land-cover dynamics in Nigeria. Sci. Total Environ. 636, 597–609. doi:10.1016/j.scitotenv.2018.04.277
Asabere, S. B., Acheampong, R. A., Ashiagbor, G., Beckers, S. C., Keck, M., Erasmi, S., et al. (2020). Urbanization, land use transformation and spatio-environmental impacts: Analyses of trends and implications in major metropolitan regions of Ghana. Land Use Policy 96, 104707. doi:10.1016/j.landusepol.2020.104707
Asadolahi, Z., Salmanmahiny, A., Sakieh, Y., Mirkarimi, S. H., Baral, H., and Azimi, M. (2018). Dynamic trade-off analysis of multiple ecosystem services under land use change scenarios: Towards putting ecosystem services into planning in Iran. Ecol. Complex. 36, 250–260. doi:10.1016/j.ecocom.2018.09.003
Baveye, P. C., Baveye, J., and Gowdy, J. (2016). Soil "ecosystem" services and natural capital: Critical appraisal of research on uncertain ground. Front. Environ. Sci. 4, 1–49. doi:10.3389/fenvs.2016.00041
Bhaduri, A., Bogardi, J., Siddiqi, A., Voigt, H., Vörösmarty, C., Pahl-Wostl, C., et al. (2016). Achieving sustainable development goals from a water perspective. Front. Environ. Sci. 4, 64. doi:10.3389/fenvs.2016.00064
Bogers, M., Biermann, F., Kalfagianni, A., Kim, R. E., Treep, J., and de Vos, M. G. (2022). The impact of the Sustainable Development Goals on a network of 276 international organizations. Glob. Environ. Change 76, 102567. doi:10.1016/j.gloenvcha.2022.102567
Costanza, R., d'Arge, R., de Groot, R., Farber, S., Grasso, M., Hannon, B., et al. (1997). The value of the world's ecosystem services and natural capital. Nature 387, 253–260. doi:10.1038/387253a0
Dadashpoor, H., Azizi, P., and Moghadasi, M. (2019). Land use change, urbanization, and change in landscape pattern in a metropolitan area. Sci. Total Environ. 655, 707–719. doi:10.1016/j.scitotenv.2018.11.267
de Groot, R. S., Alkemade, R., Braat, L., Hein, L., and Willemen, L. (2010). Challenges in integrating the concept of ecosystem services and values in landscape planning, management and decision making. Ecol. Complex. 7, 260–272. doi:10.1016/j.ecocom.2009.10.006
Faiz, M. A., Liu, D., Fu, Q., Naz, F., Hristova, N., Li, T., et al. (2020). Assessment of dryness conditions according to transitional ecosystem patterns in an extremely cold region of China. J. Clean. Prod. 255, 120348. doi:10.1016/j.jclepro.2020.120348
Gabriels, K., Willems, P., and Orshoven, J. V. (2021). Performance evaluation of spatially distributed, CN-based rainfall-runoff model configurations for implementation in spatial land use optimization analyses. J. Hydrology 602, 126872. doi:10.1016/j.jhydrol.2021.126872
Gashaw, T., Tulu, T., Argaw, M., Worqlul, A. W., Tolessa, T., and Kindu, M. (2018). Estimating the impacts of land use/land cover changes on Ecosystem Service Values: The case of the Andassa watershed in the Upper Blue Nile basin of Ethiopia. Ecosyst. Serv. 31, 219–228. doi:10.1016/j.ecoser.2018.05.001
Grainger, A. (1995). National land use morphology: Patterns and possibilities. Geography 80 (3), 235–245.
Haines-Young, R. (2009). Land use and biodiversity relationships. Land Use Policy 26, S178–S186. doi:10.1016/j.landusepol.2009.08.009
Hoque, M. Z., Islam, I., Ahmed, M., Hasan, S. S., and Prodhaz, F. A. (2022). Spatio-temporal changes of land use land cover and ecosystem service values in coastal Bangladesh. Egypt. J. Remote Sens. Space Sci. 25, 173–180. doi:10.1016/j.ejrs.2022.01.008
Hu, Z., Wang, S., Bai, X., Luo, G., Li, Q., Wu, L., et al. (2020). Changes in ecosystem service values in karst areas of China. Agric. Ecosyst. Environ. 301, 107026. doi:10.1016/j.agee.2020.107026
Hurskainen, P., Adhikari, H., Siljander, M., Pellikka, P. K. E., and Hemp, A. (2019). Auxiliary datasets improve accuracy of object-based land use/land cover classification in heterogeneous savanna landscapes. Remote Sens. Environ. 233, 111354. doi:10.1016/j.rse.2019.111354
Jiang, W., Wu, T., and Fu, B. (2021). The value of ecosystem services in China: A systematic review for twenty years. Ecosyst. Serv. 52, 101365. doi:10.1016/j.ecoser.2021.101365
Jin, G., Deng, X., Chu, X., Li, Z., and Wang, Y. (2017). Optimization of land-use management for ecosystem service improvement: A review. Phys. Chem. Earth, Parts A/B/C 101, 70–77. doi:10.1016/j.pce.2017.03.003
Klain, S. C., Satterfield, T. A., and Chan, K. M. A. (2014). What matters and why? Ecosystem services and their bundled qualities. Ecol. Econ. 107, 310–320. doi:10.1016/j.ecolecon.2014.09.003
Kreuter, U. P., Harris, H. G., Matlock, M. D., and Lacey, R. E. (2001). Change in ecosystem service values in the San Antonio area, Texas. Ecol. Econ. 39, 333–346. doi:10.1016/s0921-8009(01)00250-6
Kumar, S., and Banerji, H. (2022). Bayesian network modeling for economic-socio-cultural sustainability of neighborhood-level urban communities: Reflections from Kolkata, an Indian megacity. Sustain. Cities Soc. 78, 103632. doi:10.1016/j.scs.2021.103632
Lambin, E. F., and Meyfroidt, P. (2010). Land use transitions: Socio-ecological feedback versus socio-economic change. Land Use Policy 27, 108–118. doi:10.1016/j.landusepol.2009.09.003
Li, F., and Chen, C. (2021). Dynamic change of ecological-living-industrial land and the response to ecosystem service value-A case study of shunde (in Chinese). Res. Soil Water Conservation 28 (1), 250–257. doi:10.13869/j.cnki.rswc.2021.01.031
Li, F., Wang, R., Hu, D., Ye, Y., Yang, W., and Liu, H. (2014). Measurement methods and applications for beneficial and detrimental effects of ecological services. Ecol. Indic. 47, 102–111. doi:10.1016/j.ecolind.2014.06.032
Liu, J., Chen, L., Yang, Z., Zhao, Y., and Zhang, X. (2022). Unraveling the spatio-temporal relationship between ecosystem services and socioeconomic development in dabie mountain area over the last 10 years. Remote Sens. 14, 1059. doi:10.3390/rs14051059
Liu, Y., Long, H., Li, J., Liu, X., Wang, R., Liao, J., et al. (2018). Keratin 80 promotes migration and invasion of colorectal carcinoma by interacting with PRKDC via activating the AKT pathway. Cell Death Dis. 37 (5), 1009–1022. doi:10.1038/s41419-018-1030-y
Long, H., and Qu, Y. (2018). Land use transitions and land management: A mutual feedback perspective. Land Use Policy 74, 111–120. doi:10.1016/j.landusepol.2017.03.021
Lu, X., Zhang, Y., Lin, C., and Wu, F. (2021). Analysis and comprehensive evaluation of sustainable land use in China: Based on sustainable development goals framework. J. Clean. Prod. 310, 127205. doi:10.1016/j.jclepro.2021.127205
Ma, S., and Wen, Z. (2021). Optimization of land use structure to balance economic benefits and ecosystem services under uncertainties: A case study in wuhan, China. J. Clean. Prod. 311, 127537. doi:10.1016/j.jclepro.2021.127537
Notte, A. L., Maes, J., Dalmazzone, S., Crossman, N. D., Grizzetti, B., and Bidoglio, G. (2017). Physical and monetary ecosystem service accounts for europe: A case study for in-stream nitrogen retention. Ecosyst. Serv. 23, 18–29. doi:10.1016/j.ecoser.2016.11.002
Pan, F., Tian, C., Shao, F., Zhou, W., and Chen, F. (2012). Evaluation of ecological sensitivity in karamay, xinjiang, China. J. Geogr. Sci. 22, 329–345. doi:10.1007/s11442-012-0930-5
Polasky, S., Nelson, E., Pennington, D., and Johnson, K. A. (2011). The impact of land-use change on ecosystem services, biodiversity and returns to landowners: A case study in the state of Minnesota. Environ. Resour. Econ. (Dordr). 48, 219–242. doi:10.1007/s10640-010-9407-0
Prabhakar, S. V. R. K. (2021). A succinct review and analysis of drivers and impacts of agricultural land transformations in Asia. Land Use Policy 102, 105238. doi:10.1016/j.landusepol.2020.105238
Qiu, H., Hu, B., and Zhang, Z. (2021). Impacts of land use change on ecosystem service value based on SDGs report--Taking Guangxi as an example. Ecol. Indic. 133, 108366. doi:10.1016/j.ecolind.2021.108366
Quintero-Angel, M., Coles, A., and Duque-Nivia, A. A. (2021). A historical perspective of landscape appropriation and land use transitions in the Colombian South Pacific. Ecol. Econ. 181, 106901. doi:10.1016/j.ecolecon.2020.106901
Reed, M. S., Allen, K., Attlee, A., Dougill, A. J., Evans, K. L., Kenter, J. O., et al. (2017). A place-based approach to payments for ecosystem services. Glob. Environ. Change 43, 92–106. doi:10.1016/j.gloenvcha.2016.12.009
Remme, R. P., Schröter, M., and Hein, L. (2014). Developing spatial biophysical accounting for multiple ecosystem services. Ecosyst. Serv. 10, 6–18. doi:10.1016/j.ecoser.2014.07.006
Ruhl, J. B., Kraft, S. E., and Lant, C. L. (2013). The law and policy of ecosystem services. Washington, DC: Island Press.
Sannigrahi, S., Bhatt, S., Rahmat, S., Paul, S. K., and Sen, S. (2018). Estimating global ecosystem service values and its response to land surface dynamics during 1995–2015. J. Environ. Manag. 223, 115–131. doi:10.1016/j.jenvman.2018.05.091
Simpson, G. B., and Jewitt, G. P. W. (2019). The development of the water-energy-food nexus as a framework for achieving resource security: A review. Front. Environ. Sci. 7, 8. doi:10.3389/fenvs.2019.00008
Singh, J. S., Kumar, A., Rai, A. N., and Singh, D. P. (2016). Cyanobacteria: A precious bio-resource in agriculture, ecosystem, and environmental sustainability. Front. Microbiol. 7, 529. doi:10.3389/fmicb.2016.00529
Small, N., Munday, M., and Durance, I. (2017). The challenge of valuing ecosystem services that have no material benefits. Glob. Environ. Change 44, 57–67. doi:10.1016/j.gloenvcha.2017.03.005
Smith, A. C., Tasnim, T., Irfanullah, H. M., Turner, B., Chausson, A., and Seddon, N. (2021). Nature-based solutions in Bangladesh: Evidence of effectiveness for addressing climate change and other sustainable development goals. Front. Environ. Sci. 9, 737659. doi:10.3389/fenvs.2021.737659
Sun, Y., Liu, S., Dong, Y., An, Y., Shi, F., Dong, S., et al. (2019). Spatio-temporal evolution scenarios and the coupling analysis of ecosystem services with land use change in China. Sci. Total Environ. 681, 211–225. doi:10.1016/j.scitotenv.2019.05.136
United Nations Publications (2015). Transforming our world: The 2030 agenda for sustainable development.
Vu, H. T. D., Tran, D. D., Schenk, A., Nguyen, C. P., Vu, H. L., Oberle, P., et al. (2022). Land use change in the Vietnamese Mekong Delta: New evidence from remote sensing. Sci. Total Environ. 813, 151918. doi:10.1016/j.scitotenv.2021.151918
Wang, Y., Zhang, Z., and Chen, X. (2022). Spatiotemporal change in ecosystem service value in response to land use change in Guizhou Province, southwest China. Ecol. Indic. 144, 109514. doi:10.1016/j.ecolind.2022.109514
Wang, Z., and Cao, J. (2021). Assessing and predicting the impact of multi-scenario land use changes on the ecosystem service value: A case study in the upstream of xiong’an new area, China. Sustainability 13, 704. doi:10.3390/su13020704
Wang, Z., Cao, J., Zhu, C., and Yang, H. (2020). The impact of land use change on ecosystem service value in the upstream of xiong’an new area. Sustainability 12, 5707. doi:10.3390/su12145707
Wei, S., Lu, R., Lin, X., Pang, X., and Qin, Q. (2022). Cross-sensitivity analysis of ecological service function in guangxi border region based on land use transition (in Chinese). Res. Soil Water Conservation 29 (3), 308–316. doi:10.13869/j.cnki.rswc.2022.03.038
Xiao, Y., Huang, M., Xie, G., and Zhen, L. (2022). Evaluating the impacts of land use change on ecosystem service values under multiple scenarios in the Hunshandake region of China. Sci. Total Environ. 850, 158067. doi:10.1016/j.scitotenv.2022.158067
Xie, G., Zhang, C., Zhang, C., Xiao, Y., and Lu, C. (2015). The value of ecosystem services in China (in Chinese). Resour. Sci. 37 (9), 1740–1746.
Yi, L., Zhang, Z., Zhao, X., Liu, B., Wang, X., Wen, Q., et al. (2016). Have changes to unused land in China improved or exacerbated its environmental quality in the past three decades? Sustainability 8, 184. doi:10.3390/su8020184
Zhao, Y., Han, Z., and Xu, Y. (2022). Impact of land use/cover change on ecosystem service value in guangxi. Sustainability 14, 10867. doi:10.3390/su141710867
Zhou, L., Zhang, H., Bi, G., Su, K., Wang, L., Chen, H., et al. (2022). Multiscale perspective research on the evolution characteristics of the ecosystem services supply-demand relationship in the chongqing section of the three gorges reservoir area. Ecol. Indic. 142, 109227. doi:10.1016/j.ecolind.2022.109227
Keywords: land use transformation, ecosystem service value, change contribution rate, coefficient of improved cross-sensitivity, Jiangjin
Citation: Zhang C, Tan H, Zhou M and Wang Z (2022) What was the China’s spatial-temporal evolution characteristics of cross-sensitivity of ecosystem service value under land use transition? A case study of the Jiangjin, Chongqing. Front. Environ. Sci. 10:1080809. doi: 10.3389/fenvs.2022.1080809
Received: 26 October 2022; Accepted: 22 November 2022;
Published: 02 December 2022.
Edited by:
Xiaowei Chuai, Nanjing University, ChinaCopyright © 2022 Zhang, Tan, Zhou and Wang. This is an open-access article distributed under the terms of the Creative Commons Attribution License (CC BY). The use, distribution or reproduction in other forums is permitted, provided the original author(s) and the copyright owner(s) are credited and that the original publication in this journal is cited, in accordance with accepted academic practice. No use, distribution or reproduction is permitted which does not comply with these terms.
*Correspondence: Hongmei Tan, VGFuaG9uZ21laUBzdHUuY3F1dC5lZHUuY24=