
95% of researchers rate our articles as excellent or good
Learn more about the work of our research integrity team to safeguard the quality of each article we publish.
Find out more
ORIGINAL RESEARCH article
Front. Environ. Sci. , 04 January 2023
Sec. Environmental Economics and Management
Volume 10 - 2022 | https://doi.org/10.3389/fenvs.2022.1078357
This article is part of the Research Topic Resources and Environmental Management for Green Development View all 26 articles
 Huanhuan He*
 Rijia Ding*
Reducing agricultural carbon emissions is an important aspect of achieving China’s carbon peak and neutrality goals. Different agricultural centrality result in different agriculture status and role in different regions, affecting agricultural carbon emissions. In this study, agricultural centrality is introduced from the perspective of social network analysis. Spatial autocorrelation analysis, geographically and temporally weighted regression (GTWR) and other methods are used to empirically explore the effect of technological progress and agricultural centrality on the spatiotemporal heterogeneity of agricultural carbon emissions. The moderating effect of agricultural centrality on the relationship between technological progress and agricultural carbon emissions is further explored. The results show that 1) during the research period (2001–2019), the agricultural carbon emissions first increased and then decreased, with remarkable spatial agglomeration characteristics, revealing a significant spatial autocorrelation of carbon emissions among provinces; 2) provinces have distinctly uneven characteristics in the social network of agricultural carbon emissions, while the same province shows relative consistency in terms of location centrality and betweenness centrality. Areas with high centrality are the major grain producing areas, and they invariably play an important role in the spatially linked network of agricultural carbon emissions; 3) technological progress has an inhibitory effect on agricultural carbon emissions, and the regression coefficient decreases from western to eastern regions, demonstrating a spatial gradient distribution. The location centrality has a negative effect on agricultural carbon emissions, with significant spatial heterogeneity. The effect of betweenness centrality on agricultural carbon emissions has increased from positive to negative over time, and the promotion of each province’s intermediary role has inhibited the increase of agricultural carbon emissions; 4) both agricultural location centrality and betweenness centrality have significant positive moderating effects on the relationship between technological progress and agricultural carbon emissions. With the increase of location centrality and betweenness centrality, technological progress has an increasingly strong inhibitory effect on agricultural carbon emissions. We put forward targeted suggestions based on different agricultural centrality in order to reduce agricultural carbon emissions and provide directions for achieving the China’s carbon peak and neutrality goals and the Sustainable Development Goals of the United Nations’ Agenda 2030.
With the global attention to climate change and environment protection, agricultural carbon emissions have received more attention. According to the latest data of United Nations’ Food and Agriculture Organization, China’s total agricultural carbon emissions in 2019 amounted to 667.45 million tons, accounting for 25.73% and 11.20% of Asia’s and world’s total agricultural carbon emissions, respectively. Agriculture is one of the important sources of global greenhouse gas emissions (FAO, 2022). The increase in agricultural carbon emissions not only affects the climate and environment, but also threatens the security of agriculture itself (IPCC, 2021). Promoting carbon neutrality in agriculture is a critical aspect of accelerating the construction of a sustainable agro-ecological civilization and an important consideration for comprehensively addressing climate change. Agriculture is affected by natural conditions, climate change and human activities (Carlson et al., 2017), with the characteristics of large regional differentiation and complex sources of carbon emissions. Therefore, considering China’s carbon peak and neutrality goals, it is of great significance to reasonably measure agricultural carbon emissions, explore agricultural carbon emissions reduction measures based on China’s conditions and accelerate the pace of low-carbon transformation of agricultural production.
To advance more effective and expedient low-carbon development of agriculture, many scholars have focused on the agricultural carbon emissions (Carlson et al., 2017; Zhao et al., 2018; Liu Z. et al., 2021; Yang H. et al., 2022). At present, the main focus of agricultural carbon emission reduction research is emission characteristics and its influencing factors (Bhattacharyya et al., 2012; Zhang et al., 2019; Xiong et al., 2021; Zhou et al., 2021). In terms of the characteristics of agricultural carbon emissions, agricultural carbon emissions in China generally show a downward trend (Yang H. et al., 2022), and they mainly concentrated in major agricultural provinces, with remarkable spatial aggregation. In addition, carbon emissions in some regions have a rebound effect (Tian et al., 2014; Chen J. et al., 2019). The agricultural carbon emission intensity shows a downward trend over time, and the decline rate in central and eastern regions is significantly faster than the western regions (Li and Li, 2022). In terms of research methods, various methods such as slacks-based measure (SBM) model (Kuang et al., 2020; Liu D. D. et al., 2021), exploratory spatial data analysis (Chen J. et al., 2019; Cui et al., 2021), input-output model (Wang et al., 2020) and scenario simulation (Shan et al., 2018; Liu and Feng, 2020) have been used in the research on structure, offset and spatiotemporal variation of agricultural carbon emissions.
In terms of influencing factors, some scholars have explored the impact of natural climatic conditions, economic development level labour input, agricultural resource input, and agricultural technology on agricultural carbon emissions (Xu et al., 2021; Yang et al., 2021; Yang H. et al., 2022). Studies have demonstrated that economic development increases agricultural carbon emissions, and labour input and technology input have a remarkable inhibitory impact on the agricultural carbon emissions, with a significant spatial spillover effect, which is a key factor to improve carbon emission performance (Yang H. et al., 2022). Some scholars have explored the impact of technological progress on agricultural carbon emissions. Due to different research periods, some studies found that technological progress has a significant inhibitory impact on agricultural carbon emissions (Liu and Yang, 2021). Agricultural technological progress has a strong diffusion effect (He et al., 2021; Li and Li, 2022). Most of the previous studies only analyse the overall effect and ignore regional heterogeneity when exploring the effect of technological progress on agricultural carbon emissions; GTWR model can uncover the spatiotemporal heterogeneity of technological progress on agricultural carbon emissions. In addition, each province’s agriculture in each province is not independent, but has spatial network associations. The centrality in the agricultural social network can reflect regions’ status in the social network (Shen et al., 2021).
The different status and role of agriculture in different regions will affect the dissemination of information and technology applications, which may influence agricultural carbon emissions. Moreover, the emission decision of a region is influenced not only by its own agricultural resource and economic development level, but also by the emission decision of other regions (He et al., 2021). At the same time, the “Matthew effect” in the spatial network is relatively common. The regions occupying the central position of the network can often obtain numerous of resources by virtue of their location advantages, promoting carbon emissions reduction. Marginal regions exhibit minimal network benefit effect (He et al., 2021; Yang N. Z. et al., 2022; Song et al., 2022), which may further increase the gap between the impact of regional centres on agricultural carbon emissions and exacerbate the unbalanced development of agricultural carbon emissions. At present, there is no research on the effect of centrality on agricultural carbon emissions and its moderating effect between technological progress and agricultural carbon emissions based on agricultural social network associations. Under the background of deepening spatial correlation, it is necessary to deeply explore the relationship between centrality and agricultural carbon emissions based on SNA theory, reveal the influencing mechanism of spatial connection on agricultural carbon emissions, and provide practical reference for achieving China’s carbon peak and neutral goals and the Sustainable Development Goals (SDGs) of the United Nations’ Agenda 2030.
Based on the above analysis, the provincial panel data from 2001 to 2019 are used to quantitatively calculate agricultural carbon emissions and the SBM model is used to calculate and decompose agricultural technological progress. The agricultural centrality is calculated based on SNA theory and gravity model. Then the technological progress and agricultural network centrality are introduced into the impact analysis framework of agricultural carbon emissions from the perspective of spatial correlation. The GTWR model is used to reveal the spatiotemporal heterogeneity of agricultural carbon emissions in different regions based on different levels of technological progress and centrality. The moderating effect of agricultural centrality on technological progress and agricultural carbon emissions is further explored. Finally, we propose targeted policy suggestions based on the research findings to achieve the precise implementation of agricultural carbon emissions reduction.
The innovations of this paper are as follows. First, based on the perspective of SNA, this paper introduce the agricultural network centrality into the analysis framework of agricultural carbon emissions, study the impact of agricultural network centrality on agricultural carbon emissions and further explore its moderating effect on the relationship between technological progress and agricultural carbon emissions. These studies broaden the research perspective and improves the mechanism analysis. Second, the GTWR model is used to explore the impact of technological progress on the spatiotemporal heterogeneity of agricultural carbon emissions at different time in different regions. The conclusion is more accurate. Third, we identify the status and role of different regions in the social network of agricultural carbon emissions, which helps to explain the impact of technological progress on agricultural carbon emission reduction from the perspective of centrality. This could also provide ideas for building regional synergistic emission reduction mechanisms to achieve China’s carbon emission goals.
Carbon emissions in agriculture are mainly generated by chemical fertilizers, agricultural films, pesticides and agricultural machinery diesel used in agricultural production activities. Referencing the carbon sources and emissions coefficients of related researches (Tian et al., 2014; Liu D. D. et al., 2021; Yang H. et al., 2022), which mainly include pesticides 4.9341 kg/kg, agricultural films 5.18 kg/kg, chemical fertilizer 0.8956 kg/kg, agricultural diesel 0.5927 kg/kg, agricultural ploughing 312.6 kg/km2 and agricultural irrigation 20.476 kg/hm2. The calculation formula is as follows.
where
The level of agricultural technological progress is estimated using the super-efficiency SBM model of undesired output. Referencing the existing research (Kuang et al., 2020; Liu D. D. et al., 2021; Xie et al., 2021), we first calculated the total factor productivity (TFP) of agriculture, in which the input is based on the different factors in the agricultural production process, including land, manpower, machinery, water, fertilizer, pesticide input, agricultural film and energy. Output indicators consist of expected and undesired output, wherein the expected output is the total agricultural output value, and the undesired output is the agricultural carbon emissions. Table 1 presents the variables and descriptive statistics. According to the Malmquist index, TFP of agriculture was cumulatively transformed to obtain the level of technological progress (Liu and Yang, 2021). The relevant calculation formula is as follows:
where
where
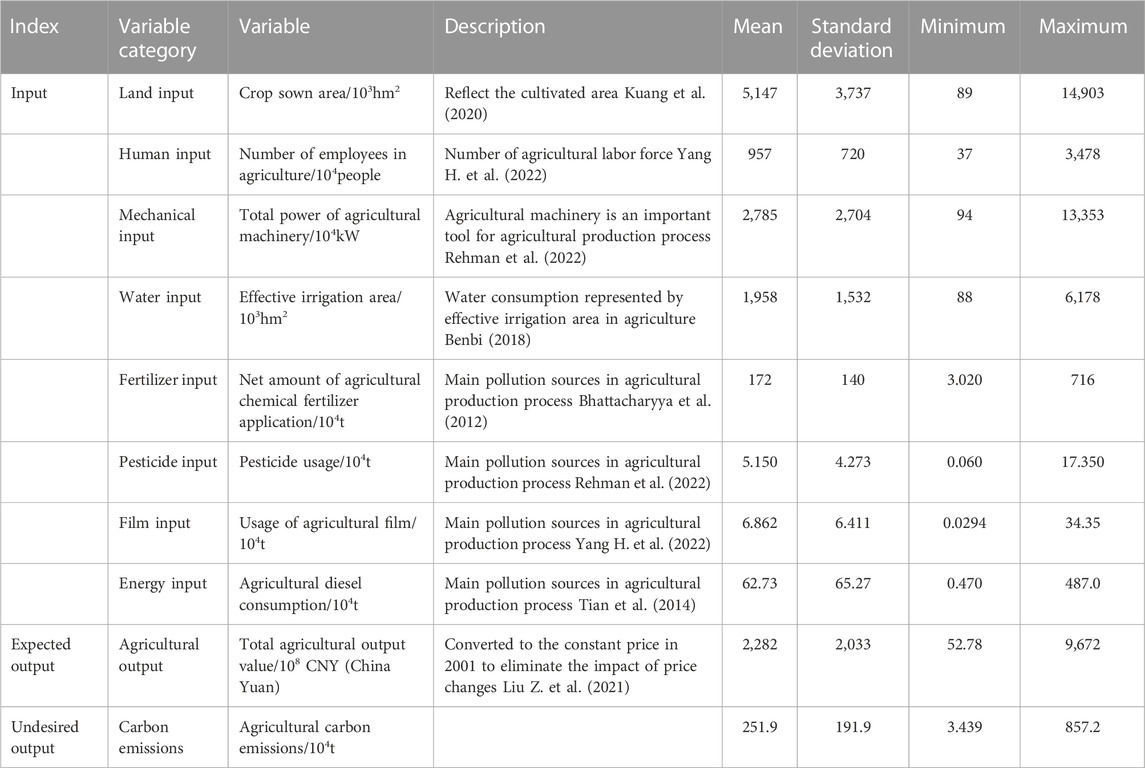
TABLE 1. Variable definitions and descriptive statistics.
SNA is one of the most widely used research methods in sociology and economics in recent years. The theoretical perspective of SNA focuses on the relationships and social structures between social actors. The object of SNA is a network structure consisting of the internal links of different actors. A network of inter-provincial agricultural production spatial linkages is constructed by calculating inter-regional gravity values. Through social network analysis, different agricultural centrality in each region are calculated to further explore the mechanisms of influence on agricultural carbon emissions.
The gravity model is introduced into the agricultural social correlation network, and the output value of agricultural in each region was divided by the square of the regional distance to reflect the agricultural spatial correlation between regions. The larger the agricultural output value and the closer the geographical distance between regions, the larger the gravitational value and the stronger the association. The greater the association between regions, the greater the mutual influence. The gravity value is converted into a gravity matrix (Shen et al., 2021). The calculation formula of the gravity value is as follows:
where
With reference to relevant literature, we use network analysis indicators to quantify the different connectivity characteristics of each Chinese province, calculating the degree centrality and betweenness centrality of agricultural in each area (He et al., 2021; Shen et al., 2021). The degree centrality represents the ratio of the number of members directly associated with a member to the total number of individuals most likely to be directly associated. The higher the degree centrality, the more control a member has over other members. The betweenness centrality indicates the extent to which members of the network play a mediating role for other members. The higher the degree of betweenness centrality, the more pronounced the intermediary position of a member in the network. The degree centrality and betweenness centrality are used to characterise the different agricultural positions and roles of individual provinces, and to further explore the mechanisms of their influence on agricultural carbon emissions.
In the analysis of the overall network of agricultural links in China, all provinces are considered as the overall network structure and each province is considered as a node in the network. The connections between the regions are considered as edges in the network. The inter-provincial network of spatial linkages in agricultural production is based on a gravity model. The agricultural situation in each province is analysed by calculating the degree of agricultural centrality of each region, and the links between different provinces are explored through a social network linkage map.
According to the first law of geography, “all things are related, but nearby things are more related than distant things” (Tobler, 1970), therefore, spatial correlation in terms of agricultural carbon emissions may also be present. Whether the spatial effect should be considered in the model depends on whether agricultural carbon emissions are geographically dependent and correlated. Moran’s I (Moran, 1950) is used to test whether there is a spatial correlation in provincial agricultural carbon emissions. The Moran’s I is calculated as follows:
where
In contrast to traditional geographically weighted regression model that only consider spatial dimensions, the GTWR model combines both time and space factors. Incorporating the time dimension into geographic space to form a three-dimensional spatiotemporal weight matrix reveals the spatiotemporal evolution of the driving force of agricultural carbon emissions in each region at a certain period, which provides an analytical basis for simultaneously dealing with the “space-time” non-stationarity (Yang et al., 2021). The formula is as follows:
where
Among them, the calculation formula of the observation point
where
The explained variable in the regression model is agricultural carbon emissions. An index system affecting China’s agricultural carbon emissions is established based on the relevant research (Chen Y. H. et al., 2019; Liu D. D. et al., 2021; He et al., 2021; Koondhar et al., 2021; Sun and Xu, 2022). The related variables are shown in Table 2.
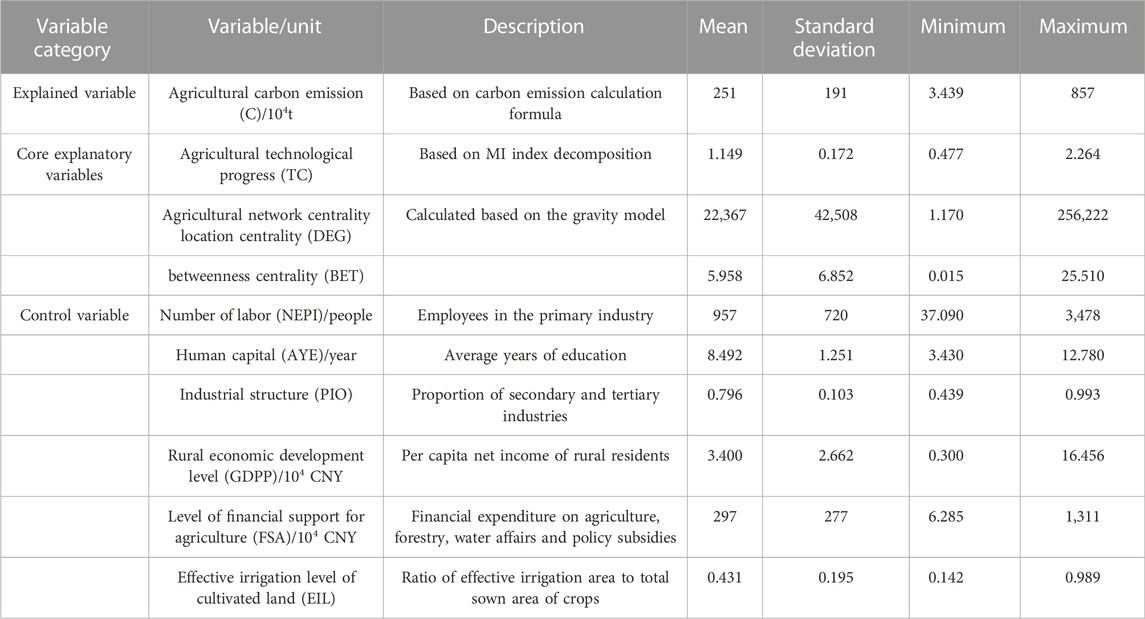
TABLE 2. Variable definitions and descriptive statistics.
Core explanatory variables: 1) Agricultural technology progress. Relevant studies have shown that industrial technological progress can inhibit industrial carbon emissions (Chen et al., 2020; Zhang et al., 2020). In the field of agricultural production, the diffusion, learning and competition effect of agricultural technological progress among regions will affect agricultural carbon emissions (Yang et al., 2021). Through the decomposition of TFP, we can obtain the level of technological progress, and further explore the spatiotemporal heterogeneity of technological progress on agricultural carbon emissions (Xie et al., 2021; You and Zhang, 2022). 2) Agricultural network centrality. As the basic industry for human survival, agriculture not only has symbiotic characteristics caused by geographical location and climate environment, but also has spatial correlation behaviours such as imitation or competition caused by industrial homogeneity. The importance of different agricultural locations and different degrees of intermediary connection in the national agricultural social network may have a heterogeneous impact on regional agricultural carbon emissions (He et al., 2021). We calculate the agricultural point centrality and betweenness centrality according to the gravity model. The point degree of centrality reflects the provinces’ position in the centre of China’s agricultural social network. The larger the index value, the greater the regional centrality and the closer the relationship with other regions. For convenience of understanding, we use the location centrality in the interpretation of this paper. The betweenness centrality reflects regions’ the intermediary role in agriculture. The greater the value, the greater the intermediary role of the region in the agriculture spatial social network (Al-Ezzi et al., 2021), so as to explore the impact of each province’s agricultural status and the degree of intermediate contact on regional agricultural carbon emissions.
Control variables: 1) Employees in agriculture. Labour is one of the necessary factors for agricultural production activities. The use of agricultural machinery and the collection and use of agricultural information require labour input. Some studies demonstrate that higher employee investment leads to lower agricultural carbon emissions and higher ecological efficiency (Cui et al., 2018). 2) Human capital. The number of agricultural employees only accounts for changes in the number of agricultural labour, whereas human capital can provide relevant information regarding the quality of workers (Long et al., 2018). Human capital is measured by the average level of education. The level of education in each region represents the overall quality of the region, which also includes the quality of the labour force. Therefore, it is reasonable to use the average years of schooling of the population in each province as an approximate indicator of the level of human capital, referencing the research of Romer (1990) and Mankiw et al. (1992). 3) Industrial structure. The upgrading of industrial structure from the primary industry to secondary and tertiary industry has generated a squeeze on agriculture, resulting in the reduction of agricultural production activities and subsequent reductions in agricultural carbon emissions. The impact of the industries structure of agriculture is represented by the change in the proportion of secondary and tertiary output value on agricultural carbon emissions (He et al., 2021). 4) The level of rural economic development (Zhang et al., 2019). It is measured by rural per capita GDP. 5) The level of financial support for agriculture. The higher the value, the higher the government attaches importance to agriculture (Chavas, 2001; Guo et al., 2022). It is measured by the total of both financial expenditure on agriculture, forestry and water affairs as well as policy subsidies. 6) Effective irrigation level. It represents the effective use of water resources in agricultural production activities and is represented by the ratio of effective irrigation area to total sown crop area (Chen Y. H. et al., 2019). The variables involving prices are converted to the constant price in 2001 to eliminate the impact of price changes. The variables and descriptive statistics are shown in Table 2.
The relevant data of 31 provinces (excluding Hong Kong SAR, China, Macao SAR, China and Taiwan) in China used in this paper are mainly from China Statistical Yearbook from 2001 to 2019 (http://www.stats.gov.cn/tjsj/ndsj/). The data of employees in primary industry are from China demographic and Employment Statistical Yearbook (http://www.stats.gov.cn/tjsj/). Some missing data comes from provincial statistical yearbooks (e.g., http://tjj.xinjiang.gov.cn/), and some missing data in individual years are processed using linear interpolation. The geographic longitude and latitude data are obtained from the Basic Geographic Information Centre in China (https://www.ngcc.cn/ngcc/).
Due to the different natural resources and economic development levels of each province, there are considerable differences in agricultural carbon emissions. Figure 1 presents the agricultural carbon emissions of each province in 2001, 2005, 2010, 2015 and 2019. From the perspective of time sequence change, China’s agricultural carbon emission shows a general trend of growth followed by decline. From 2001 to 2015, the vast majority of areas saw a significant increase in carbon emissions, especially in Henan, Inner Mongolia, Heilongjiang, Yunnan, Hebei, Jilin, Gansu, Guangxi, Anhui, Shaanxi, Hunan, Hubei, and Guangdong, where the increase in their carbon emissions was more than one million tonnes. From 2015 to 2019, most provinces achieved varying degrees of reduction in agricultural carbon emissions. Among them, Hebei, Shandong, Hubei, Henan, Yunnan, Gansu, Heilongjiang, Anhui and Jiangxi had very significant reductions of more than 400,000 tonnes in 4 years (Henan and Shandong remained in the highest classification after the reduction due to their large carbon emission base). This is probably because the Chinese government has become more and more explicit about carbon emission reduction in recent years, and all regions (especially the main grain-producing regions) have responded positively to the government’s call for carbon emission reduction, which has had a significant effect.
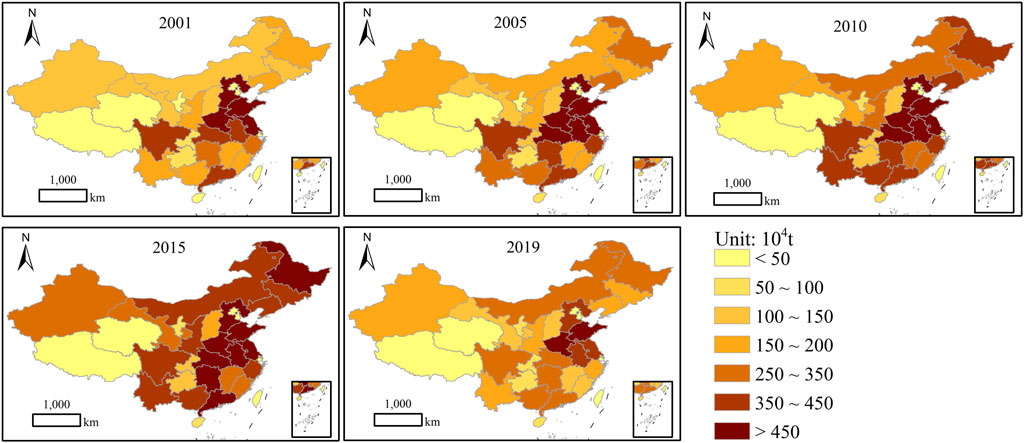
FIGURE 1. Agricultural carbon emissions by province (2001, 2005, 2010, 2015 and 2019).
From the perspective of spatial distribution, the characteristics of spatial agglomeration are significant, and primarily concentrated in major grain producing provinces in central and eastern China. Areas with high agricultural carbon emissions include Henan, Shandong, Hebei, Jiangsu, Anhui, Hubei, Heilongjiang, Hunan and other regions, all of which are major grain producing areas. Due to more input in agricultural production factors (fertilizers, pesticides, etc.), the carbon emissions are high in these provinces. The areas with low agricultural carbon emissions include Hainan, Ningxia, Shanghai, Tianjin, Qinghai, Beijing and Tibet etc., most of which are developed or remote regions. The industries in developed areas are concentrated in manufacturing and service industries, and the agricultural industry only accounts for a small proportion, therefore, agriculture produces less carbon emissions. In remote areas, due to natural climatic conditions and extensive operations, the pollution to the environment is relatively minimal, and the carbon emissions are relatively low.
To test whether the spatial effects should be considered in the regression, a global Moran autocorrelation test was performed on China’s agricultural carbon emissions, and the results are shown in Figure 2. During the study period, the global Moran’s I was greater than 0 and the Z value was greater than 1.65, which was significant at the 5% level. The overall Moran’s I exhibited a downward trend first, followed by an upward trend. From 2001 to 2009, the global Moran’s I was greater than 0.2. It began to decline in 2009 and then increased in recent years, indicating that the spatial autocorrelation and spatial agglomeration among provinces have increased in recent years. The results demonstrated a remarkable spatial autocorrelation in agricultural carbon emissions between provinces. Agricultural carbon emissions in a certain region have spatial spillover effects on other provinces, therefore, spatial effects should be considered when exploring the driving factors of China’s agricultural carbon emissions.
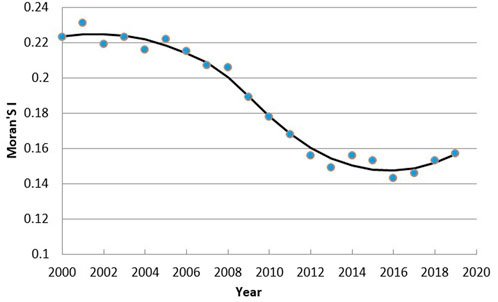
FIGURE 2. The changing trend of Moran’s I of agricultural carbon emissions in China.
Network structure characterization and centrality analysis were used to determine the importance of each node in the agricultural carbon emission side of the network. The gravity model is used to calculate the location centrality and betweenness centrality of agricultural carbon emissions in each province. This provides a regional reference for subsequent policy formulation according to local conditions. The structure of social network connections in 2001 and 2019 are shown in Figure 3, where each node represents each province and a straight line connection means that there is a link between two provinces.
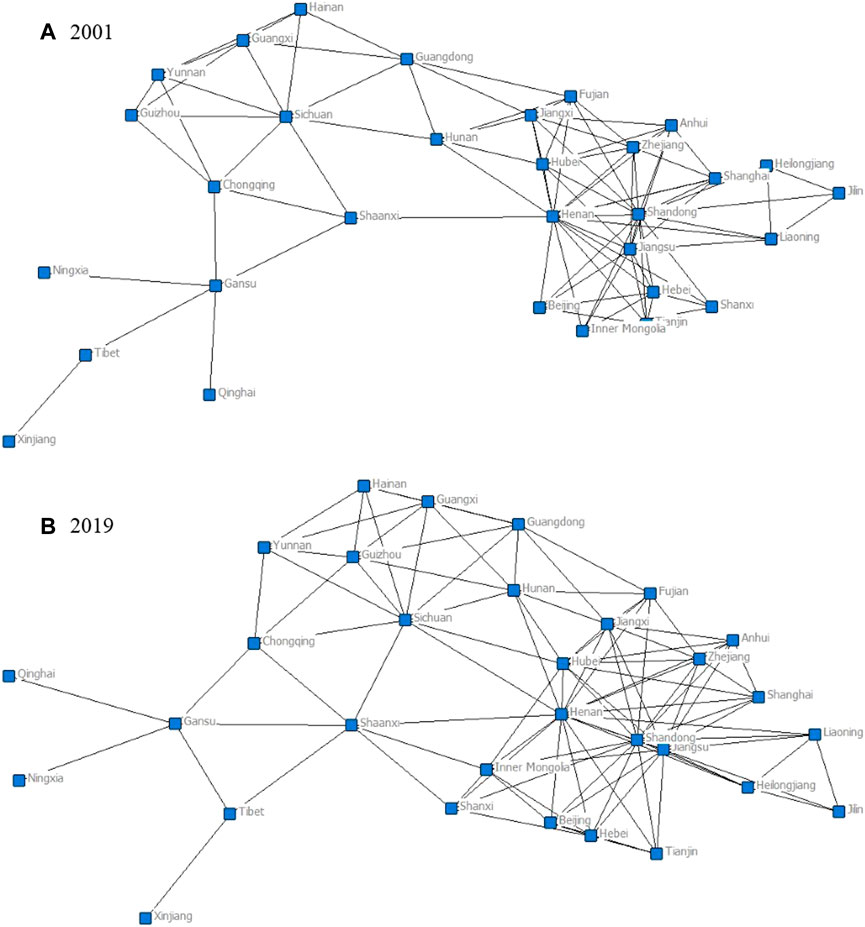
FIGURE 3. Social network structure based on centrality in China.
Figure 3 shows the network of agricultural connectivity for each province (node) in 2001 and 2019 respectively. From Figure 3, we can see how each province is connected to the other provinces. In both 2001 and 2019, the network is dominated by Henan, Shandong, Hubei, Jiangsu, Jiangxi, Zhejiang, and Anhui. These provinces always play an important role in the spatially linked network of agricultural carbon emissions in China. Provinces with significantly increased connectivity and importance to other regions in the connectivity network mainly include Inner Mongolia, Sichuan, Hunan, Shaanxi, and Guizhou. These provinces are increasingly important in the China’s agriculture and are more likely to have an impact on other regions. Provinces with significantly lower connectivity to other regions in the connectivity network include Beijing, Tianjin, and Tibet. Due to economic development or remote geographical location, these regions are less important in the agricultural network and have less impact on other regions.
Due to space constraints in the paper, only the location centrality and the betweenness centrality of 2019 are shown in Tables 3, 4. The location centrality and the betweenness centrality are both reported the normalized result. Table 3 shows the location centrality results. The regions with high level of location centrality include Henan, Shandong, Hubei, Jiangsu, Jiangxi, and Zhejiang, followed by Inner Mongolia, Anhui, Fujian, Sichuan, Shanghai, Hunan, and Hebei. Most of the above-mentioned provinces are large agricultural provinces in the north or in the middle and lower reaches of the Yangtze River, which are relatively concentrated in the spatial correlation of agricultural carbon emissions in China. The findings indicate that the stability of the overall network structure is highly dependent on these provinces, which have a key role in the spatial pattern of China’s agricultural carbon emissions. The provinces with low level of location centrality include Guangdong, Guizhou, Guangxi, Hainan, Chongqing, Yunnan, and the regions with the lowest level of regional centrality include Jilin, Tibet, Gansu, Qinghai, Ningxia, and Xinjiang. Most of these areas are remote areas, where agricultural carbon emissions are less related to other provinces, leaving them in a subordinate position in the social correlation network of China’s agricultural carbon emissions. Although Jilin is also one of the main agricultural producing areas, the remoteness of the region and its distance from the rest of China’s provinces has resulted in a low centrality, which is less connected to other regions due to geographical distance, natural climate, etc. Similar to this are Heilongjiang and Liaoning.
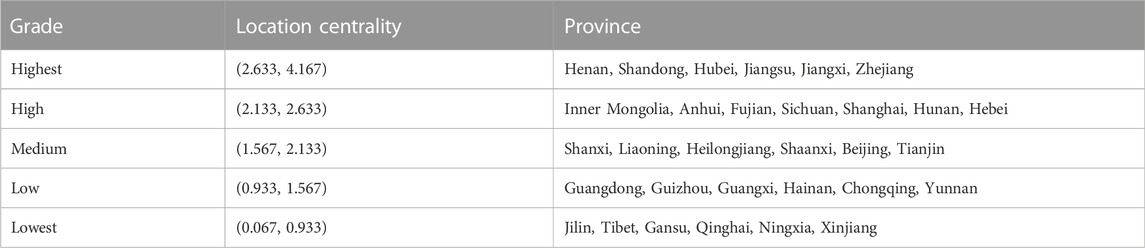
TABLE 3. Spatial distribution of location centrality.
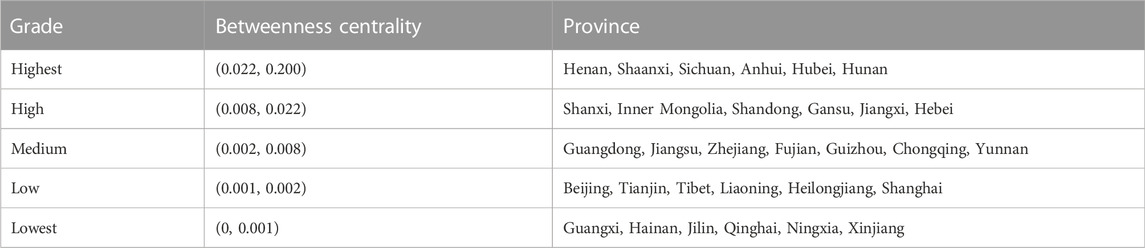
TABLE 4. Spatial distribution of betweenness centrality.
Table 4 shows the betweenness centrality results. The provinces with the highest betweenness centrality include Henan, Shaanxi, Sichuan, Anhui, Hubei, and Hunan. Those with high degree of betweenness centrality include Shanxi, Inner Mongolia, Shandong, Gansu, Jiangxi, and Hebei. These provinces are in the core of the spatial network of agricultural and have a strong ability to control agricultural carbon emissions in other provinces. The provinces with low levels of betweenness centrality mainly include Beijing, Tianjin, Tibet, Liaoning, Heilongjiang, and Shanghai. The provinces with the lowest level of betweenness centrality are Guangxi, Hainan, Jilin, Qinghai, Ningxia, and Xinjiang. These regions are easer affected by those with high betweenness centrality, and it is difficult to control or dominate the carbon emissions in other regions.
In general, each province shows significant unbalanced characteristics in the social association network of agricultural, but many province shows relative consistency in the location centrality and betweenness centrality. Henan, Shandong, Hubei, Jiangxi, Jiangsu, Inner Mongolia, Anhui, Sichuan, Hunan, Hebei, and other cited regions, have high location centrality and betweenness centrality. Most of them are large agricultural provinces. They are in a significant central position in the associated network, with a strong intermediary and control role. In contrast, Guangxi, Hainan, Chongqing, Jilin, Tibet, Qinghai, Ningxia, Xinjiang, and other regions have low location centrality and betweenness centrality, and have a marginal position in the social networking.
To understand the correlation between variables and avoid collinearity, the Pearson correlation analysis and the variance inflation factor (VIF) test are performed on the variables involved. The results are shown in Tables 5, 6, respectively. Table 5 indicates the dependent variable has a high correlation with each independent variable, while the correlation between independent variables is low. The VIF test results are shown in Table 6. The VIF of each independent variable is less than 8, and the average VIF is 3.49, indicating that there is no serious collinearity between the independent variables. The next step of the regression analysis can be performed.
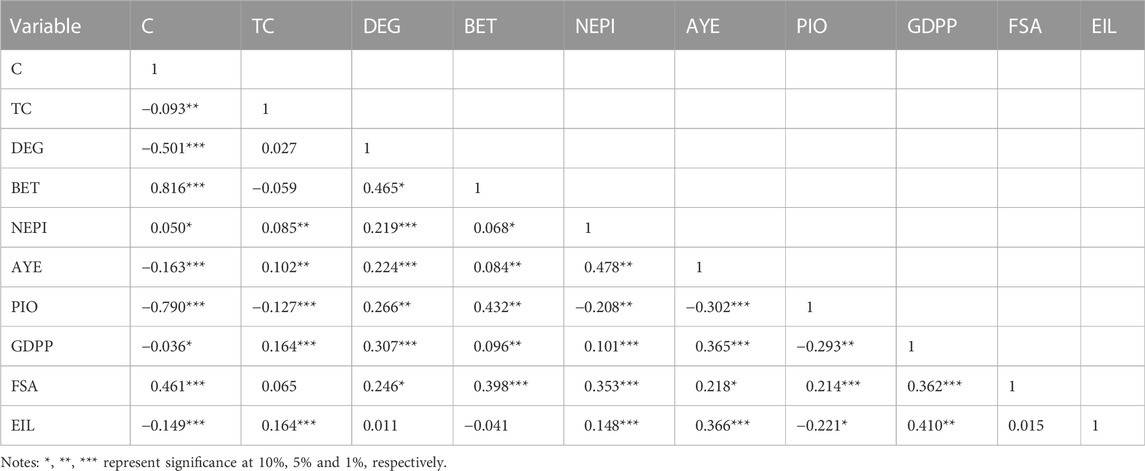
TABLE 5. Correlation test between variables.
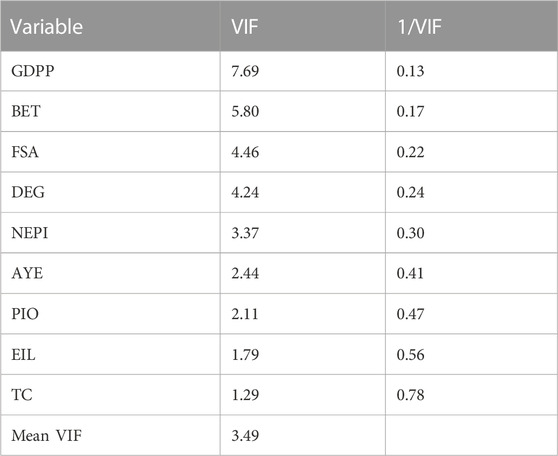
TABLE 6. VIF test of explanatory variables.
Table 7 presents the model fitting results of ordinary least squares (OLS), time weighted regression (TWR), geographically weighted regression (GWR) and GTWR. It can be seen that the R2 increases significantly and AICc is smaller after adding spatial weight. Comprehensively comparing various indicators, the GTWR model is the most accurate, thus, the GTWR model is used for empirical analysis. ArcGIS 10.2 software is used to present the spatial pattern evolution trend of the core explanatory variables (technological progress, location centrality and betweenness centrality) on the influence coefficient of provincial agricultural carbon emissions. Due to space limitations, Figure 4 only presents 2000, 2010 and 2019.
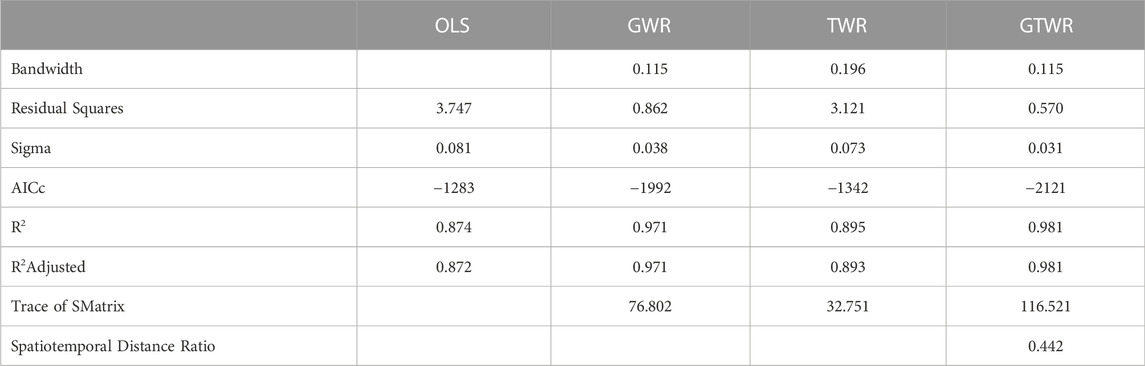
TABLE 7. Model selection and regression results.
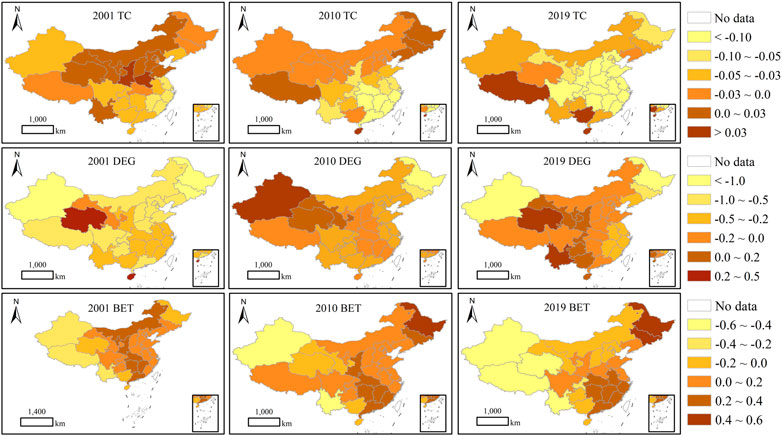
FIGURE 4. Spatiotemporal heterogeneity of the impact of technological progress and centrality on agricultural carbon emissions.
In terms of technological progress, technological progress has a negative effect on agricultural carbon emissions, and the regression coefficient decreases from western to eastern regions. The spatial gradient distribution characteristics are obvious, with significant heterogeneity among provinces. In 2000, the regression coefficients of most provinces is negative, indicating that technological progress had an inhibitory impact on agricultural carbon emissions. Moreover, they mainly distributed in major grain areas. In 2010 and 2019, the regression coefficients of all provinces decreased significantly. In 2019, only three regions of Hainan, Guangxi and Tibet had positive regression coefficients, and the remaining 28 provinces are all negative. The regression coefficient decreased significantly, and the number of provinces changed from positive to negative, indicating an increasingly inhibitory impact of technological progress on agricultural carbon emissions.
In terms of location centrality, the regression coefficients of most provinces in 3 years are negative, except for Hainan and Qinghai in 2001, Xinjiang, Qinghai and Gansu in 2010, and Yunnan, Qinghai, Chongqing, Shaanxi, Ningxia, Guangxi, Gansu, Hainan, and Guizhou in 2019. This indicates that the location centrality has a negative impact on agricultural carbon emissions, and the greater the agricultural location centrality of a region, the less the agricultural carbon emissions of the region.
In terms of betweenness centrality, the number of provinces with positive regression coefficients for betweenness centrality in 2001 and 2010 is 24 and 25, respectively. However, the regression coefficients of 15 provinces are negatively correlated in 2019. The number of regions whose regression coefficient changed from positive to negative has increased. The regression coefficient of most positive correlation provinces has decreased, and the positive correlation has weakened, indicating that the effect of mediation on agricultural carbon emissions had a trend from positive to negative.
The fixed-effect hierarchical regression method is used to conduct empirical tests with referencing related studies to further explore the influencing mechanism of centrality on technological progress and agricultural carbon emissions (Verdier, 2020; Lv et al., 2021; Qi et al., 2021; Zheng et al., 2021).
First, we verify the moderating effect of the interaction term between technological progress and location centrality on agricultural carbon emissions. The first step is to conduct the regression of technological progress and agricultural carbon emissions. The second step is introducing the location centrality into the model as an independent variable for regression. The third step is adding the interaction term between technological progress and location centrality for regression. The results are shown in columns 1), 2) and 3) in Table 8, respectively. Column 1) reveals a significant negative effect between technological progress and agricultural carbon emissions, which is consistent with the results in Figure 4. Column 2) demonstrates that location centrality has a positive effect on agricultural carbon emissions. After introducing the interactive term of technological progress and location centrality in column 3), the location centrality shows a significant negative impact on agricultural carbon emissions, indicating that greater location centrality leads to more important the status and the less agricultural carbon emissions. The interaction coefficient is significantly negative (β = −0.838, p < .01), indicating that the location centrality has a significant positive moderating effect on the relationship between technological progress and agricultural carbon emissions. The greater the regional agricultural location centrality is, the stronger the inhibition effect of technological progress on agricultural carbon emissions is. In contrast, the smaller location centrality leads to weaker the inhibition effect of technological progress on agricultural carbon emissions. Location centrality strengthens the negative impact of technological progress on agricultural carbon emissions.
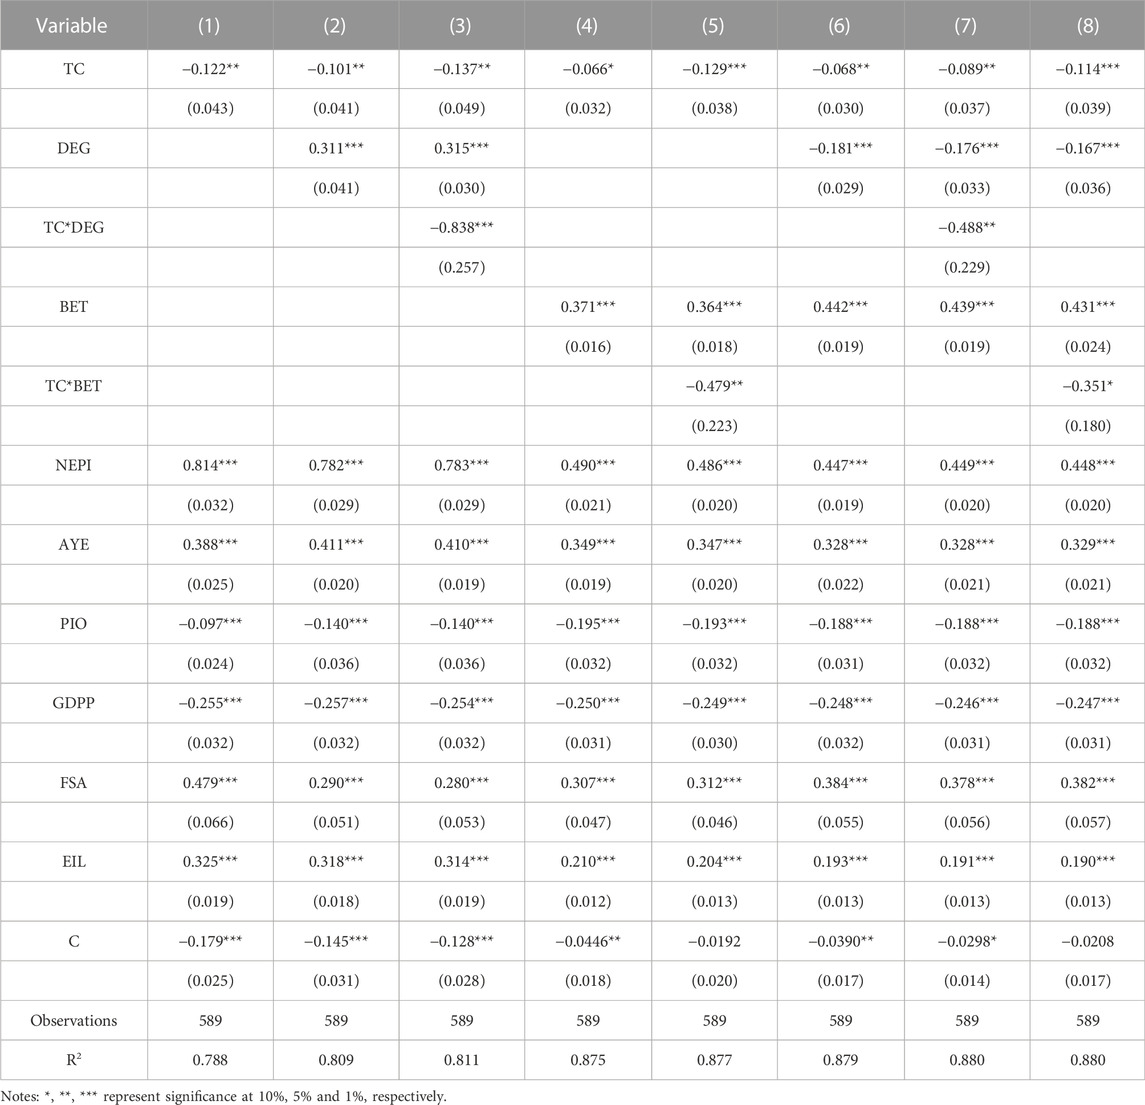
TABLE 8. Regression results of moderating effect.
Second, we verify the impact of the interaction term between technological progress and betweenness centrality on agricultural carbon emissions. The first step is performing the regression of technological progress and agricultural carbon emissions, the second step is introducing betweenness centrality into the model as an independent variable for regression, and the third step is adding the interaction term between technological progress and betweenness centrality for regression. The results are shown in columns (1), (4) and (5) in Table 8, respectively. In column (4), the overall effect of betweenness centrality on agricultural carbon emissions is positive, which is consistent with Figure 4. The interaction coefficient between technological progress and betweenness centrality in column (5) is significantly negative (β = −0.479, p < .05), indicating that betweenness centrality significantly strengthens the negative effect of technological progress on agricultural carbon emissions with a positive regulatory effect. The greater the regional betweenness centrality, the stronger the inhibitory impact of technological progress on agricultural carbon emissions; the smaller the betweenness centrality, the weaker the inhibitory impact of technological progress on agricultural carbon emissions. Although the betweenness centrality has a positive effect on agricultural carbon emissions overall, it can significantly strengthen the inhibitory effect of technological progress on agricultural carbon emissions. It may be that regions in the middle of the communication between nodes have a significant role as a bridge and a strong ability to control resources. It is easier to grasp the advantages of various information, technology and other resources over time in these regions, resulting low-carbon and carbon reduction in agriculture.
Finally, in order to ensure the robustness of the moderating effect, location centrality and betweenness centrality are introduced in column (6), and the interactive terms of technological progress and location centrality and the interactive terms of technological progress and intermediary centrality are introduced in columns (7) and (8), respectively. The interaction term between technological progress and centrality is tested by regression. The results are shown in columns (6), (7) and (8) in Table 8, respectively. The coefficients of the interaction terms are all significantly negative, indicating that location centrality and betweenness centrality both have a significant positive moderating effect on the relationship between technological progress and agricultural carbon emissions. With the increase of location centrality and betweenness centrality, the impact of technological progress on agricultural carbon emissions increases. The sign and significance of the regressions in columns (3) and (6) are relatively consistent with columns (7) and (8), respectively, indicating that the regression results are robust.
According to the first law of geography “all things are related, but nearby things are more related than distant things” (Tobler, 1970). Similarly, agriculture interact with each other in different regions, and carbon emissions are linked in different regions. The social network association uses a gravity model that takes into account the distance between two regions and the agricultural situation to measure the relationship and status of subjects in different regions. In this paper, social network analysis is used to obtain the locational centrality and betweenness centrality of agriculture, and to explore the mechanisms by which different locational centrality plays a role in agricultural carbon emissions.
The increase or decrease of agricultural carbon emissions in one region will adjust its own emissions according to the reference of other regions. This cooperative approach to emissions reduction can be explained by the “peer effect”. The emission decision of a region is influenced not only by its own agricultural resource and economic development level, but also by the emission decision of other regions (He et al., 2021).
As an important way to achieve emission reduction, technological progress has become an important direction of mutual learning among regions. Through the “learning effect”, agricultural technology progress may benefit more regions in emission reduction (Xie et al., 2021). The different status and role of agriculture in different regions will influence the voice of agriculture in China, and further influence the dissemination and application of technology, which in turn will have a certain impact on agricultural carbon emissions. In addition, due to the “Matthew effect”, regions that occupy the centre of the network can obtain a large amount of resources and promote their own carbon emission reduction by virtue of their location, which further intensifies the unbalanced development of carbon emissions in agricultural regions with different centres.
The analysis of spatial heterogeneity and moderating effect helps to explain the impact of technological progress on agricultural carbon emissions from the perspective of centrality. We can understand the impact mechanism of agricultural status and role on regional government decision-making better, and these provide ideas for the construction of regional collaborative emissions reduction mechanism. The specific impact mechanisms are analysed below.
First, the agricultural status and role of different provinces are explored. Each province shows significant unbalanced characteristics in the social association network of agricultural carbon emissions, but the same provinces have relative consistency in the location centrality and betweenness centrality. The provinces with high location centrality and betweenness centrality are in a significant central position in the associated network, have a strong intermediary and control role. The provinces with low location centrality and betweenness centrality are in a marginal position in the social network. Different degrees of centrality result in different levels of impact on other areas in the network of agricultural carbon connections.
Second, the research found that the technological progress has a negative effect on agricultural carbon emissions. Since technological progress is confirmed to reduce agricultural carbon emissions by improving agricultural machinery and other processes, with a strong positive externality. The location centrality has a negative impact on agricultural carbon emissions. The greater a region’s agricultural location centrality, the lower the region’s the agricultural carbon emissions. It may be that the area is more connected to other areas in the social network and that learning behaviours occur to adopt measures to reduce agricultural carbon emissions. The increase of the regression coefficient from negative to positive indicates that the carbon reduction bonus brought by the agricultural location centrality has reduced, and the progress of science and technology and the convenience of information dissemination lead to a reduction in the network connectivity advantage of the location centrality. The effect of betweenness centrality on agricultural carbon emissions had trend from positive to negative. These enlighten the government to attach importance to the technology and the intermediary advantages of the region to grasp resources and actively learn and exchange to reduce agricultural carbon emissions.
Third, the moderating effect of agricultural centrality on the relationship between technological progress and agricultural carbon emissions is explored. The agricultural location centrality and betweenness centrality have a significant positive moderating effect on the relationship between technological progress and agricultural carbon emissions. With the increase of location centrality and betweenness centrality, the inhibitory effect of technological progress on agricultural carbon emissions increases. This is probably due to the fact that the higher the centrality of a region, the stronger the lead and diffusion role it plays, allowing for faster and wider diffusion of technology. Due to the centrality advantage, more resources such as information and technology can be obtained, thus curbing agricultural carbon emissions. Therefore, the moderating effect of high centrality on technological progress and agricultural carbon emissions should also be emphasized, and inhibition effect of technological progress on agricultural carbon emissions should be strengthened to achieve more efficient carbon reduction.
Based on the above analysis of carbon emissions, agricultural centrality and the regulation effect of centrality on carbon emissions in different regions, the status and role of different agricultural centrality regions are discussed from the perspective of carbon emission reduction, and corresponding suggestions are put forward to reduce agricultural carbon emissions and help achieve the SDGs.
1) The advantages of agricultural regional centres should be valued, and the driving and diffusion effects should be enhanced. For Henan, Shandong, Hubei, Jiangxi, Jiangsu, Inner Mongolia, Anhui, Sichuan, Hunan, Hebei, the major agricultural carbon emission provinces are also regions with high location centrality, and they have a key driving role in the spatial pattern of China’s agricultural carbon emissions. Areas such as Henan, Shaanxi, Sichuan, Anhui, Hubei, Hunan, Shanxi, Inner Mongolia, Shandong, Gansu, Jiangxi and Hebei have a high betweenness centrality and play the role of a bridge of communication. It is important to give full play to the advantages of agricultural regional centres to enhance the driving and diffusion effects. Therefore, it is necessary to consider the moderating effect of spatial correlation effects on carbon emission reduction. Since regions with higher centrality are easer connected with other regions and have more significant carbon emissions reduction effects, policy formulation should take advantage of the special status of such regions, make full use of the diffusion effect of such regions, and actively promote low-carbon production technologies and effective policies to facilitate agricultural carbon emission reduction in other regions.
2) Policy guidance and financial support for marginalised agricultural areas should be strengthened. For agricultural regions with low locational centrality and marginalised in socially connected networks, such as Guangxi, Hainan, Chongqing, Jilin, Tibet, Qinghai, Ningxia, Xinjiang and other regions (provinces with essentially no agricultural industry are omitted), policy guidance should be strengthened and active learning from areas with significant agricultural carbon reduction.
3) The regional coordination mechanisms for emission reduction should be established, and regional exchanges and collaboration should be promoted and strengthened. There is an obvious spatial correlation between agricultural carbon emissions. The carbon emissions of a region are not only related to the agricultural and economic development of this region, but are also influenced by the relevant spatial social networks in the region, showing a learning behaviour of agricultural carbon emission reduction. Therefore, a regionally coordinated mechanism for emission reduction should be established so that regions can learn from each other to achieve sustainable development and ecological civilization in agriculture.
4) It is important to focus on the progress and application of agricultural science and technology, as well as the moderating role of the central degree on agricultural technology. On the one hand, agricultural economic linkages should be strengthened to clear obstacles to the spatial spillover of technological progress and allow different regions to benefit from technological progress. On the other hand, we should make full use of the moderating effect of high centrality on technological progress and agricultural carbon emissions, and strengthen the inhibiting effect of technological progress on agricultural carbon emissions to achieve higher and more efficient carbon emission reduction.
Due to limited data availability, the primary sources of agricultural carbon emissions considered in this research include six common categories, including pesticides, agricultural films, agricultural irrigation, chemical fertilizer, agricultural ploughing, and agricultural diesel. Theoretically, the crop type and different farming methods also have impact on carbon emissions, which may affect the results. Therefore, further research should performed in future. In addition, agricultural carbon emissions may influenced by many factors at different spatial and temporal scales. We selected only some of potential variables, but the influence of residents’ environmental awareness, governmental policy priorities and other circumstances are important. It is required further exploration including these factors.
This study use relevant data from 31 provinces in China from 2001 to 2019 to explore the spatiotemporal changes of agricultural carbon emissions. The SBM model, SNA and GTWR model are used to study the effect of technological progress and agricultural centrality on the spatiotemporal heterogeneity of agricultural carbon emissions. The moderating effect of agricultural centrality on the relationship between technological progress and agricultural carbon emissions is further explored. The main conclusions are as follows.
First, agricultural carbon emissions in China increased significantly during the study period. The spatial agglomeration characteristics were significant, and they were mainly concentrated in major grain producing areas. There is a significant spatial dependence of agricultural carbon emissions among provinces. The non-equilibrium characteristics of each province in the social network of agricultural carbon emissions are noticeable, while the same provinces show relative consistency in terms of location centrality and betweenness centrality. Areas with high centrality are the major grain producing areas, and they invariably play an important role in the spatially linked network of agricultural carbon emissions.
Second, technological progress has an inhibitory effect on agricultural carbon emissions, and the inhibitory effect gradually increases. The regression coefficient decreases from western to eastern regions, with remarkable spatial gradient distribution characteristics. The agricultural location centrality has a negative effect on overall agricultural carbon emissions, and the spatial heterogeneity is significant, however, the number of regions where the impact has changed from negative to positive has increased over time, indicating that the carbon reduction dividend brought by location centrality has decreased. The impact of betweenness centrality on agricultural carbon emissions has changed from positive to negative in many provinces over time. The enhancement of provinces’ intermediary role has a trend of promoting the inhibiting impact on agricultural carbon emissions.
Third, agricultural location centrality and betweenness centrality have a significant positive moderating effect on the relationship between technological progress and agricultural carbon emissions. With the increase of location centrality and betweenness centrality, the inhibitory effect of technological progress on agricultural carbon emissions increases.
The original contributions presented in the study are included in the article/supplementary material, further inquiries can be directed to the corresponding authors.
HH performed concept development, modeling analysis, and writing. RD performed writing-review and editing. All authors contributed to the article and approved the submitted version.
This research is funded by the China National Key R&D Program (2022YFF0607404), Natural Science Foundation of China (42206240), Shandong Provincial Natural Science Foundation, China (ZR2020QD055).
The authors declare that the research was conducted in the absence of any commercial or financial relationships that could be construed as a potential conflict of interest.
All claims expressed in this article are solely those of the authors and do not necessarily represent those of their affiliated organizations, or those of the publisher, the editors and the reviewers. Any product that may be evaluated in this article, or claim that may be made by its manufacturer, is not guaranteed or endorsed by the publisher.
Al-Ezzi, A., Kamel, N., Faye, I., and Gunaseli, E. (2021). Analysis of default mode network in social anxiety disorder: EEG resting-state effective connectivity study. Sensors (Basel) 21 (12), 4098. doi:10.3390/s21124098
Benbi, D. K. (2018). Carbon footprint and agricultural sustainability nexus in an intensively cultivated region of Indo-Gangetic Plains. Sci. Total Environ. 644, 611–623. doi:10.1016/j.scitotenv.2018.07.018
Bhattacharyya, P., Roy, K. S., Neogi, S., Adhya, T. K., Rao, K. S., and Manna, M. C. (2012). Effects of rice straw and nitrogen fertilization on greenhouse gas emissions and carbon storage in tropical flooded soil planted with rice. Soil & Tillage Res. 124, 119–130. doi:10.1016/j.still.2012.05.015
Carlson, K. M., Gerber, J. S., Mueller, N. D., Herrero, M., MacDonald, G. K., Brauman, K. A., et al. (2017). Greenhouse gas emissions intensity of global croplands. Nat. Clim. Change 7 (1), 63–68. doi:10.1038/Nclimate3158
Chavas, J.-P. (2001). “Chapter 5 Structural change in agricultural production: Economics, technology and policy,” in Handbook of agricultural economics (Elsevier), 263–285.
Chen, J. D., Gao, M., Mangla, S. K., Song, M. L., and Wen, J. (2020). Effects of technological changes on China's carbon emissions. Technol. Forecast. Soc. Change 153, 119938. doi:10.1016/j.techfore.2020.119938
Chen, J., Gao, M., Ma, K., and Song, M. (2019). Different effects of technological progress on China's carbon emissions based on sustainable development. Bus. Strategy Environ. 29 (2), 481–492. doi:10.1002/bse.2381
Chen, Y. H., Li, M. J., Su, K., and Li, X. Y. (2019). Spatial-temporal characteristics of the driving factors of agricultural carbon emissions: Empirical evidence from fujian, China. Energies 12 (16), 3102. doi:10.3390/en12163102
Cui, H. R., Zhao, T., and Shi, H. J. (2018). STIRPAT-based driving factor decomposition analysis of agricultural carbon emissions in Hebei, China. Pol. J. Environ. Stud. 27 (4), 1449–1461. doi:10.15244/pjoes/77610
Cui, Y., Khan, S. U., Deng, Y., Zhao, M., and Hou, M. (2021). Environmental improvement value of agricultural carbon reduction and its spatiotemporal dynamic evolution: Evidence from China. Sci. Total Environ. 754, 142170. doi:10.1016/j.scitotenv.2020.142170
FAO (2022). Food and agriculture organization of the united Nations. Available at: http://www.fao.org/faostat/zh/#data/GT (Accessed January 24, 2022).
Färe, R., Grosskopf, S., Lindgren, B., and Roos, P. (1992). Productivity changes in Swedish pharamacies 1980–1989: A non-parametric malmquist approach. J. Prod. Analysis 3 (1), 85–101. doi:10.1007/BF00158770
Guo, L. L., Zhao, S., Song, Y. T., Tang, M. Q., and Li, H. J. (2022). Green finance, chemical fertilizer use and carbon emissions from agricultural production. Agriculture-Basel 12 (3), 313. doi:10.3390/agriculture12030313
He, Y., Lan, X., Zhou, Z., and Wang, F. (2021). Analyzing the spatial network structure of agricultural greenhouse gases in China. Environ. Sci. Pollut. Reseaech 28 (7), 7929–7944. doi:10.1007/s11356-020-10945-3
IPCC (2021). Sixth assessment report of climate change 2021: The physical science basis. Cambridge, UK: Cambridge University Press.
Koondhar, M. A., Aziz, N., Tan, Z. X., Yang, S. X., Abbasi, K. R., and Kong, R. (2021). Green growth of cereal food production under the constraints of agricultural carbon emissions: A new insights from ardl and vecm models. Sustain. Energy Technol. Assessments 47, 101452. doi:10.1016/j.seta.2021.101452
Kuang, B., Lu, X. H., Zhou, M., and Chen, D. L. (2020). Provincial cultivated land use efficiency in China: Empirical analysis based on the SBM-DEA model with carbon emissions considered. Technol. Forecast. Soc. Change 151, 119874. doi:10.1016/j.techfore.2019.119874
Li, Z., and Li, J. (2022). The influence mechanism and spatial effect of carbon emission intensity in the agricultural sustainable supply: Evidence from China's grain production. Environ. Sci. Pollut. Reseaech 29 (29), 44442–44460. doi:10.1007/s11356-022-18980-y
Liu, D. D., Zhu, X. Y., and Wang, Y. F. (2021). China's agricultural green total factor productivity based on carbon emission: An analysis of evolution trend and influencing factors. J. Clean. Prod. 278, 123692. doi:10.1016/j.jclepro.2020.123692
Liu, M., and Yang, L. (2021). Spatial pattern of China's agricultural carbon emission performance. Ecol. Indic. 133, 108345. doi:10.1016/j.ecolind.2021.108345
Liu, Y., and Feng, C. (2020). Decouple transport CO2 emissions from China's economic expansion: A temporal-spatial analysis. Transp. Res. Part D-Transport Environ. 79, 102225. doi:10.1016/j.trd.2020.102225
Liu, Z., Lang, L. L., Hu, B., Shi, L. H., Huang, B. T., and Zhao, Y. J. (2021). Emission reduction decision of agricultural supply chain considering carbon tax and investment cooperation. J. Clean. Prod. 294, 126305. doi:10.1016/j.jclepro.2021.126305
Long, X. L., Luo, Y. S., Wu, C., and Zhang, J. J. (2018). The influencing factors of CO2 emission intensity of Chinese agriculture from 1997 to 2014. Environ. Sci. Pollut. Res. 25 (13), 13093–13101. doi:10.1007/s11356-018-1549-6
Lv, C., Shao, C., and Lee, C.-C. (2021). Green technology innovation and financial development: Do environmental regulation and innovation output matter? Energy Econ. 98, 105237. doi:10.1016/j.eneco.2021.105237
Mankiw, N. G., Romer, D., and Weil, D. N. (1992). A contribution to the empirics of economic-growth. Q. J. Econ. 107 (2), 407–437. doi:10.2307/2118477
Moran, P. A. P. (1950). A curvilinear ranking test. J. R. Stat. Soc. Ser. B-Statistical Methodol. 12 (2), 292–295. doi:10.1111/j.2517-6161.1950.tb00063.x
Qi, G., Jia, Y., and Zou, H. (2021). Is institutional pressure the mother of green innovation? Examining the moderating effect of absorptive capacity. J. Clean. Prod. 278, 123957. doi:10.1016/j.jclepro.2020.123957
Rehman, A., Ma, H., Khan, M. K., Khan, S. U., Murshed, M., Ahmad, F., et al. (2022). The asymmetric effects of crops productivity, agricultural land utilization, and fertilizer consumption on carbon emissions: Revisiting the carbonization-agricultural activity nexus in Nepal. Environ. Sci. Pollut. Reseaech 29 (26), 39827–39837. doi:10.1007/s11356-022-18994-6
Romer, P. M. (1990). Endogenous technological change. J. Political Econ. 98 (5), S71–S102. doi:10.1086/261725
Shan, Y., Guan, D., Hubacek, K., Zheng, B., Davis, S. J., Jia, L., et al. (2018). City-level climate change mitigation in China. Sci. Adv. 4 (6), eaaq0390. doi:10.1126/sciadv.aaq0390
Shen, W., Liang, H., Dong, L., Ren, J., and Wang, G. (2021). Synergistic CO2 reduction effects in Chinese urban agglomerations: Perspectives from social network analysis. Sci. Total Environ. 798, 149352. doi:10.1016/j.scitotenv.2021.149352
Song, J. Z., Hu, X. X., Wang, X. P., Yuan, W. J., and Wang, T. (2022). The spatial characteristics of embodied carbon emission flow in Chinese provinces: A network-based perspective. Environ. Sci. Pollut. Res. 29 (23), 34955–34973. doi:10.1007/s11356-022-18593-5
Sun, B., and Xu, X. C. (2022). Spatial-temporal evolution of the relationship between agricultural material inputs and agricultural greenhouse gas emissions: Experience from China 2003-2018. Environ. Sci. Pollut. Res. 29 (31), 46600–46611. doi:10.1007/s11356-022-19195-x
Tian, Y., Zhang, J. B., and He, Y. Y. (2014). Research on spatial-temporal characteristics and driving factor of agricultural carbon emissions in China. J. Integr. Agric. 13 (6), 1393–1403. doi:10.1016/S2095-3119(13)60624-3
Tobler, W. R. (1970). A computer movie simulating urban growth in the detroit region. Econ. Geogr. 46, 234. doi:10.2307/143141
Verdier, V. (2020). Estimation and inference for linear models with two-way fixed effects and sparsely matched data. Rev. Econ. Statistics 102 (1), 1–16. doi:10.1162/rest_a_00807
Wang, X. C., Klemes, J. J., Wang, Y. T., Dong, X. B., Wei, H. J., Xu, Z. H., et al. (2020). Water-Energy-Carbon Emissions nexus analysis of China: An environmental input-output model-based approach. Appl. Energy 261, 114431. doi:10.1016/j.apenergy.2019.114431
Xie, Z. H., Wu, R., and Wang, S. J. (2021). How technological progress affects the carbon emission efficiency? Evidence from national panel quantile regression. J. Clean. Prod. 307, 127133. doi:10.1016/j.jclepro.2021.127133
Xiong, C. H., Wang, G. L., and Xu, L. T. (2021). Spatial differentiation identification of influencing factors of agricultural carbon productivity at city level in Taihu lake basin, China. Sci. Total Environ. 800, 149610. doi:10.1016/j.scitotenv.2021.149610
Xu, X., Yang, H., and Yang, H. (2021). The threshold effect of agricultural energy consumption on agricultural carbon emissions: A comparison between relative poverty regions and other regions. Environ. Sci. Pollut. Reseaech 28 (39), 55592–55602. doi:10.1007/s11356-021-14831-4
Yang, H., Wang, X. X., and Bin, P. (2022). Agriculture carbon-emission reduction and changing factors behind agricultural eco-efficiency growth in China. J. Clean. Prod. 334, 130193. doi:10.1016/j.jclepro.2021.130193
Yang, N. Z., Sun, X. T., and Qi, Q. (2022). Impact of factor quality improvement on agricultural carbon emissions: Evidence from China's high-standard farmland. Front. Environ. Sci. 10. doi:10.3389/fenvs.2022.989684
Yang, X. H., Jia, Z., Yang, Z. M., and Yuan, X. Y. (2021). The effects of technological factors on carbon emissions from various sectors in China-A spatial perspective. J. Clean. Prod. 301, 126949. doi:10.1016/j.jclepro.2021.126949
You, J. M., and Zhang, W. (2022). How heterogeneous technological progress promotes industrial structure upgrading and industrial carbon efficiency? Evidence from China's industries. Energy 247, 123386. doi:10.1016/j.energy.2022.123386
Zhang, F., Deng, X. Z., Phillips, F., Fang, C. L., and Wang, C. (2020). Impacts of industrial structure and technical progress on carbon emission intensity: Evidence from 281 cities in China. Technol. Forecast. Soc. Change 154, 119949. doi:10.1016/j.techfore.2020.119949
Zhang, L., Pang, J., Chen, X., and Lu, Z. (2019). Carbon emissions, energy consumption and economic growth: Evidence from the agricultural sector of China's main grain-producing areas. Sci. Total Environ. 665, 1017–1025. doi:10.1016/j.scitotenv.2019.02.162
Zhao, R. Q., Liu, Y., Tian, M. M., Ding, M. L., Cao, L. H., Zhang, Z. P., et al. (2018). Impacts of water and land resources exploitation on agricultural carbon emissions: The water-land-energy-carbon nexus. Land Use Policy 72, 480–492. doi:10.1016/j.landusepol.2017.12.029
Zheng, S. N., Wang, R., Mak, T. M. W., Hsu, S. C., and Tsang, D. C. W. (2021). How energy service companies moderate the impact of industrialization and urbanization on carbon emissions in China? Sci. Total Environ. 751, 141610. doi:10.1016/j.scitotenv.2020.141610
Keywords: agricultural carbon emissions, centrality, technological progress, GTWR, moderating effect
Citation: He H and Ding R (2023) Spatiotemporal heterogeneity effect of technological progress and agricultural centrality on agricultural carbon emissions in China. Front. Environ. Sci. 10:1078357. doi: 10.3389/fenvs.2022.1078357
Received: 24 October 2022; Accepted: 12 December 2022;
Published: 04 January 2023.
Edited by:
Lei Gao, Commonwealth Scientific and Industrial Research Organisation (CSIRO), AustraliaCopyright © 2023 He and Ding. This is an open-access article distributed under the terms of the Creative Commons Attribution License (CC BY). The use, distribution or reproduction in other forums is permitted, provided the original author(s) and the copyright owner(s) are credited and that the original publication in this journal is cited, in accordance with accepted academic practice. No use, distribution or reproduction is permitted which does not comply with these terms.
*Correspondence: Huanhuan He, aGVoaDQ3QDE2My5jb20=; Rijia Ding, cmlqaWFkaW5nQDEyNi5jb20=
Disclaimer: All claims expressed in this article are solely those of the authors and do not necessarily represent those of their affiliated organizations, or those of the publisher, the editors and the reviewers. Any product that may be evaluated in this article or claim that may be made by its manufacturer is not guaranteed or endorsed by the publisher.
Research integrity at Frontiers
Learn more about the work of our research integrity team to safeguard the quality of each article we publish.