- 1School of Economics and Business Administration, Heilongjiang University, Harbin, China
- 2School of Economics and Management, Harbin Engineering University, Harbin, China
The sustainability of the ecological environment has been greatly threatened. Based on carbon emissions and combined with the panel data of 30 provinces in China from 2003 to 2020, this paper studied the various mechanisms of industrial structure optimization and population agglomeration on carbon emissions. The fixed effect model, panel threshold model and spatial spillover model are used to study the direct and indirect effects of industrial structure optimization and population agglomeration on carbon emissions, and the robustness of the results is tested in various ways. In terms of direct effects, the industrial structure optimization has a significant negative effect on carbon emissions, and the significance level is 1%. Population agglomeration has a significant positive effect on carbon emissions, with a significance level of 1%. In terms of indirect effects, 1) by adding the cross term of industrial structure optimization and population agglomeration, it is proved that population agglomeration can promote the carbon emission reduction effect of industrial structure optimization. 2) Population agglomeration was used as the threshold variable to verify the interval effect of industrial structure optimization on carbon emission reduction. The results show that the industrial structure optimization has a double threshold effect of population agglomeration on carbon emissions, and the threshold values are 2.1137 and 5.9263, respectively. And the larger the population agglomeration interval, the weaker the inhibition effect of industrial structure optimization on carbon emissions. 3) The industrial structure optimization, population agglomeration and carbon emissions have significant spatial spillover effects. The industrial structure optimization in neighboring areas has a significant inhibitory effect on carbon emissions, and the population agglomeration in neighboring areas has a significant promoting effect on carbon emissions.
1 Introduction
To address climate change and achieve carbon neutrality is a global trend and the call of The Times. It bears on the future survival and development of mankind. In 2020, energy-related carbon dioxide emissions accounted for about 87% of the total global carbon dioxide emissions (UNEP, 2021), and fossil energy combustion was the main source of global carbon dioxide emissions. Accelerating energy transformation and reducing energy consumption intensity are necessary measures to reduce carbon emissions and achieve the goal of “zero carbon” (ECIU, 2021). Industrial structure optimization is the fundamental way to reduce carbon emission. Carbon emissions mainly come from the massive use of fossil energy such as coal, oil and natural gas, which can cause desertification, greenhouse effect and global climate change. The rapid development of industrialization has a high demand for various energy sources, resulting in an increase in carbon emissions. As far as China’s current post-industrialization development stage is concerned, the proportion of the secondary industry shows an obvious downward trend, replaced by the rapid development of the tertiary industry, which reflects the country’s industrial structure gradually tends to be advanced and rationalization (Huang and Li, 2017). In contrast, the tertiary industry has a weak dependence on energy, which can greatly reduce the total consumption and consumption intensity of fossil energy caused by China’s industrial development. This is also a realistic way for China to promote the development of low-carbon economy through structural adjustment and mode transformation (Zhao et al., 2022). However, the rapid development of the tertiary industry is often accompanied by a large number of population agglomeration (Yang, 2018). Take China as an example, more and more people are moving to large and medium-sized cities with higher tertiary industry development level, and some first-tier and second-tier cities have very rapid population growth. This is because the development of the tertiary industry is more dependent on population agglomeration than the manufacturing and agricultural sectors (Duranton and Puga, 2020). On the one hand, compared with the manufacturing industry, most of the products of the tertiary industry are non-tradable and conform to the production and sale model. Enterprises and consumers need close interaction. On the other hand, tertiary industry products have higher income elasticity (Ngai and Pissarides, 2007) and attract population. The unreasonable population density will lead to the increase of carbon emission and the structural imbalance of regional carbon emission (Sun et al., 2013; He et al., 2019). This conclusion has been confirmed by a large number of scholars. However, some scholars hold the opposite view, believing that population agglomeration has positive external effects and can improve economies of scale in the use of resources and energy (Edward and Matthew, 2009). In this case, the effect of simply relying on industrial structure optimization to promote carbon emission reduction could be complex and uncertain, and the effect of industrial structure optimization accompanied by population agglomeration on carbon emission needs to be further verified.
Accordingly, this paper aims to construct a theoretical analysis framework for industrial structure optimization, population agglomeration and carbon emission. And explore the following questions: 1) Under the coexistence of regional industrial structure optimization and population agglomeration, what are the direct action mechanisms of the two factors on regional carbon emissions? 2) What is the non-linear mechanism of regional carbon emission under the interaction of industrial structure optimization and population agglomeration? Is there an interval effect with the population agglomeration scale as the threshold? 3) Do industrial structure optimization, population agglomeration and carbon emissions have spatial spillover effects? What is the effect? In order to answer the above questions, based on the panel data of 30 provincial-level regions in China from 2003 to 2020, this paper comprehensively verifies the direct and indirect mechanisms of industrial structure optimization and population agglomeration on carbon emissions by using OLS estimation, intra-group interval estimation (fixed effect model), panel threshold effect model and spatial econometric model. It provides ideas for national and local governments to formulate reasonable industrial structure adjustment policies, population mobility and supporting policies in order to promote carbon emission reduction and achieve the goal of “carbon peak”. Therefore, the adjustment and industrial structure optimization to reduce carbon emissions, promote high-quality economic development and regional coordinated development has been widely concerned by the government and academia.
2 Literature review
The industrial structure optimization not only reflects the advanced development of economic development of a country or region (Fu, 2010; Gan et al., 2011), but also brings important impact on the ecological environment of a country or region (Chang, 2015; Li, 2021). For more than a decade, the adjustment and industrial structure optimization to reduce carbon emissions, promote high-quality economic development and regional coordinated development has been widely concerned by the governments around the world and academia. Kaya’s identity proves that the upgrading of industrial structure is the fundamental driving force for the low-carbon development of industrial system. Reducing the energy use intensity and carbon emissions of the industry is conducive to the realization of low-carbon development of the industry (Sheinbaum and Belizza, 2010). As for the impact of industrial structure upgrading on carbon emissions, the current academic opinion holds that industrial structure optimization and upgrading can reduce carbon emissions through structural adjustment and technological effect. However, this influence has regional differences at different spatial scales, including different countries (Duro and Padilla, 2006; Yuan et al., 2016) and different regions in the same country (Pau and Bhattacharya, 2004; Zhao et al., 2022). Different industrial sectors also have different impacts on carbon emissions. Some empirical studies prove that almost all industrial scale growth will make a positive contribution to carbon emissions (Al-Ghandoor, 2010). However, the contribution of the tertiary industry is significantly smaller than that of the secondary industry (Liu and Lung, 2010). In addition, some scholars use the spatial econometric model to demonstrate the spatial spillover effect of industrial structure on carbon emissions. The results show that the upgrading of industrial structure can not only reduce the local carbon intensity, but also reduce the carbon intensity of the surrounding areas. However, the capacity to reduce varies with the level of economic development, technological innovation and urbanization (Yu, et al., 2022).
Population size is an important factor in environmental pollution and carbon emissions. Since Marshall (1890) first proposed the concept of agglomeration, the relationship between population agglomeration and energy consumption, carbon emission and environmental pollution has attracted the attention of scholars in demography, development economics, geographic economics and other related fields (Liddle, 2014). There are three main viewpoints in academic research on the relationship between population and environment. First, population density will bring a large amount of pollutants in a short time, beyond the load-carrying capacity of the environment (Fang and Lin, 2009). Secondly, population agglomeration will bring positive external effect to the environment, which is conducive to improving environmental pollution (Chen, et al., 2020; Wang, et al., 2021). Thirdly, the relationship between population agglomeration and environment presents temporal and interval heterogeneity. In the time dimension, population growth increases the carbon footprint and CO2 emissions in the short term. But in the long run, the consumption of natural resources and renewable energy improves the quality of the environment in the long run, along with population growth (Khan et al., 2020). From the interval dimension, there is a U-shaped relationship between population agglomeration and environmental pollution. When the agglomeration level is low, population agglomeration plays a positive externality and has a positive impact on environmental pollution. Only when the concentration exceeds a certain level can it have a negative impact on the environment. (Wang, 2015). In recent years, studies have also shown that the impact of population agglomeration on carbon emissions has significant regional differences (Clark, 2010; Menz and Welsch, 2012; Li et al., 2019). The differences are not only between countries, but also between regions and cities within countries. And the conclusion accords with the environmental Kuznets curve theory (EKC) (Grossman and Kruege, 1995).
Regional economic development depends on agglomeration economy, and agglomeration includes both industrial agglomeration and population agglomeration. And the two have synergistic effect (Ahmad et al., 2021). Both types of agglomeration will inevitably put enormous pressure on energy consumption and environmental pollution (Kaya and Koc, 2019; Qin et al., 2022). Many scholars have comprehensively considered the impacts of population agglomeration and industrial agglomeration on the environment, but no consensus has been reached. With the deepening of the research, some scholars are concerned that there is a certain relationship between the development of industry and population itself, so they begin to explore the non-linear relationship between the three. The general result is that population density can positively regulate environmental efficiency by strengthening the spillover effect of industrial synergistic agglomeration (Zhu et al., 2021). In addition, some scholars have verified the spatial effects among the three by using spatial metrology. It is also confirmed that the industrial development and population in neighboring areas have spillover effects on local carbon emissions.
Based on the above literature review, fruitful results have been obtained in the research on the relationship between industrial structure and carbon emissions, but there are still three aspects that can be improved. First, most of the existing studies on carbon emission or environment by industrial structure optimization only consider the simple linear relationship between industrial structure and environment, and whether there is interval heterogeneity in the emission reduction effect of industrial structure optimization has not been thoroughly studied. Second, most existing studies have studied the pairwise relationship between industrial structure, population agglomeration and carbon emissions, and rarely put in the same framework. Despite the comprehensive consideration of the relationship between industrial agglomeration, population and carbon emissions, industrial agglomeration cannot measure the structural problems of industries. At the same time, the relationship between regional variables is mostly investigated in isolation, while the possible agglomeration and spillover effects between regions are ignored. Third, generally speaking, a certain conduction mechanism affecting carbon emissions may exist as a function of time from its occurrence to its effect. In terms of the impact time of industrial structure optimization and population agglomeration on regional carbon emissions, it may be reflected in a time lag of one or 2 months, or one or 2 years. However, there are few literature that consider both long-term and short-term time effects when conducting empirical studies.
Therefore, the marginal contribution of this paper is to comprehensively consider the direct and indirect effects, short-term effects and long-term effects of industrial structure factors and population factors of carbon emissions. First, consider the general regulation effect and threshold effect of industrial structure optimization of population agglomeration on carbon emissions. Firstly, population agglomeration is included in the research framework of carbon emission effect of industrial structure optimization. The general regulating effect and threshold effect of industrial structure optimization of population agglomeration on carbon emission were explored respectively. Second, the long-term and short-term effects of industrial structure optimization and population agglomeration on carbon emissions were investigated from two time dimensions, namely, the same period and the lag period. Thirdly, from the perspective of spatial spillover, whether industrial structure optimization and population agglomeration have spatial effects on carbon emissions is investigated. Exploring the direct and indirect spatio-temporal relationships among the three has important theoretical significance and strategic value for realizing the two-carbon goal by optimizing the industrial structure and improving the population mobility policy.
3 Theoretical mechanism analysis
Mechanism analysis of industrial structure optimization on carbon emission. The energy demand of each industry is quite different, and the carbon emission coefficient of each energy is different, so the carbon emission generated in the process of burning energy is also different. The secondary industry includes most of the industries with high energy consumption coefficient, and has a large demand for a variety of energy sources. China is in the process of post-industrial development, and the tertiary industry is the leading industry in China at the present stage (Yu, 2015). With the increase of the proportion of service industry, low energy consumption industries form clusters, which gradually reduce the proportion of high energy consumption and high emission industries (Zhang et al., 2016). In addition, from the perspective of factor flow, the industrial structure optimization has realized the flow of important production factors to the tertiary industry. Capital or labor factors flow to higher-end industrial sectors faster, and technological progress indirectly promotes carbon emission reduction that drives the industrial structure optimization (Cai, 2013). Therefore, the optimization of the industrial structure is realized by means of the “structural dividend” released by the coordinated development of various departments between and within the industry. In this way, more economic benefits can be obtained and the energy efficiency of the whole industry can be improved (Ervural, et al., 2018). At the same time, the spillover effect exists in a certain distance (Liu and Ma, 2021).
Mechanism of population agglomeration on carbon emissions. There are three mechanisms of population agglomeration on carbon emissions. First, population agglomeration greatly reduces the actual travel distance of residents, and large-scale use of public transport will achieve scale efficiency of carbon emission reduction (Holden and Norland, 2005; Brownstone and Golob, 2009). At the same time, the aggregation of population can improve the utilization rate of various resources, reduce the occupation of various resources by repeated construction, especially conducive to the sharing of public facilities. In this way, enterprises or individuals can reduce the cost of obtaining and using resources and public facilities and improve the economies of scale in the use of resources (Glaeser, 2011). In addition, it can increase the matching between jobs and workers, reduce the cost of job searching and improve work efficiency. More importantly, it can accelerate the generation of new knowledge and technology, promote the renewal of production and environmental protection technology to a certain extent, which is conducive to the control of environmental pollution. Second, Population agglomeration has negative environmental externalities. The large-scale disordered agglomeration of population will lead to a significant increase in regional domestic energy consumption, especially in the energy consumption of buildings, transportation and household appliances. A large amount of energy consumption increases the emission of regional pollutants. The economic development mode, population flow and wind conditions in neighboring areas will also lead to the close-range diffusion of pollutants. Moreover, it has a positive spatial effect on carbon emissions in neighboring areas (Xia and Lu, 2015).
Mechanism of industrial structure optimization and population agglomeration on carbon emission. Labor supply and population size affect the industrial value-added structure of consumption and investment through the income channel and the price channel respectively, so as to bring about the adjustment of industrial structure. People’s pursuit of life status and quality is gradually advanced, so it strongly promotes the development of service industry and the industrial structure optimization (Thorpe and Schmuller, 1958). When people’s pursuit of higher living conditions and quality gradually promotes the development of service industry and reduces the proportion of secondary industry. The development of tertiary industry not only reflects the stage and level of regional economic development, but also represents the technical level of the region. The tertiary industry sector has a higher level of demand for labor force, so that labor force can learn through a variety of channels (Marshall, 1890). As a result, the labor tends to match high-end industrial sectors with better pay, better working conditions, more room for advancement and higher demand for skills. Thus promote the industrial structure optimization, and finally reduce regional energy consumption and carbon emissions. The tertiary industry sector is highly dependent on labor and energy, and migrants tend to flow to areas with better public services (Xia and Lu, 2015), resulting energy consumption of the population. But population agglomeration can also have positive externalities, reducing travel distances and sharing regional facilities, thus achieving economies of scale in energy consumption (Liddle, 2004). At the same time, the labor force can improve the labor production efficiency of the tertiary industry and reduce the energy consumption by constantly applying their knowledge to the production services of the tertiary industry. Therefore, the impact of industrial structure optimization and population agglomeration on carbon emissions depends on the difference between the direct energy consumption brought about by industrial structure optimization and population agglomeration and the indirect energy consumption reduced by agglomeration through positive externalities, which is closely related to the level of population agglomeration.
4 Research design
4.1 Model setting and data
4.1.1 Baseline regression model
Cobb-Douglas production function describes the functional relationship between labor force, capital and other production factors and economic output, which can profoundly reflect the nature and characteristics of changes in the output of economic activities (Phelps Brown, 1957). With the continuous development of economic theory and social practice, the production function has been continuously developed (Samuelson, 1979; Mc Combie, 1991). This paper refers to the model derivation method of Cheng et al. (2019). In this paper, referring to the model derivation method of Cheng et al. (2019), a direct impact model of industrial structure optimization on carbon emissions was constructed for the direct transmission mechanism (Model 1). On this basis, it is considered that the industrial structure optimization and population agglomeration may have a non-linear indirect mechanism of action on carbon emissions, that is, the general regulation effect of population agglomeration on the industrial structure optimization. Population agglomeration influences the industrial structure optimization from two aspects: “Marshallian technology externality” and the expansion of consumption demand (Jia et al., 2022). Therefore, the carbon reduction adjustment effect model of population agglomeration on industrial structure optimization (Model 2) was established, that is, the interaction term between industrial structure optimization and population agglomeration was added on the basis of Model 1.
Model 1: Direct impact model of industrial structure optimization on carbon emissions
Model 2: General moderating effect model of population agglomeration
In Eqs 1, 2,
4.1.2 Panel threshold regression model
In order to further clarify the non-linear mechanism of population aggregation, the panel threshold model was established by reference to Hansen (1999) method to verify whether there is complex interval effect in the regulating effect of population aggregation. Firstly, a single threshold effect model (Model 3) was established:
Model 3: Xxx.
Secondly, a double threshold effect model (Model 4) was established:
Model 4: Xxx.
4.1.3 Spatial effect model
Industrial structure optimization, population agglomeration and carbon emission are likely to show certain spatial aggregation characteristics. Therefore, in order to further discuss the spatial spillover effect of industrial structure optimization and population agglomeration on carbon emissions, the spatial interaction term with the spatial weight matrix is introduced into Model 1, which is further expanded into a general spatial econometric model (Anselin and Florax 1995; Shao et al., 2016). Spatial econometric models generally include spatial auto regressive model (SAR), spatial error model (SEM) and spatial Dubin model (SDM) (Ma and Zhang, 2014). Due to uncertainty in model selection, general spatial econometric model is adopted for verification (see Model 5):
Model 5: Xxx.
In Eq. 5,
4.2 Data selection and processing
4.2.1 Data sources
Carbon Emission (ceto). The carbon emission in this paper refers to the carbon emission per capita, because the carbon emission is the carbon emission caused by various energy consumption, but the official institution has not given this series of data. Therefore, in accordance with IPCC emission guidelines (IPCC, 2006) and various energy data statistics of various provinces, this paper uses the following formula to calculate carbon emissions:
Where,
Industrial Structure Optimization (ms). Petti-clark theorem points out that with the continuous development of economy, the industrial center will gradually transfer from tangible property production to intangible service production, and the proportion of non-agricultural industry is higher and higher, while the proportion of agriculture is continuously lower, which also reflects the upgrading of industrial structure (Clark, 1940). Therefore, many scholars use the proportion of output value of the secondary and tertiary industries in the total output value to measure the upgrading of industrial structure (Wu and Liu, 2013). At the different stages of national development, suitable leading industries are needed to promote economic development. In the middle and late stage of industrialization, the leading industries are capital intensive heavy industry and technology intensive industry respectively. In the late stage of industrialization, the public’s demand for consumer services and social services rose sharply, and the leading industry began to transform into the service industry based on information economy and knowledge economy, which greatly increased the development volume of the “tertiary industry”. Therefore, this paper follows the method of previous scholars and uses the ratio of output value of tertiary industry and secondary industry to measure the optimization level of industrial structure.
Population Agglomeration (tp). In this paper, population density is used as a proxy index of population agglomeration, which is equal to the ratio of the total population of the current year to the area of the administrative region (Yang and Ren, 2018). Generally speaking, the greater the regional population density, the stronger the population agglomeration.
Spatial weight matrix (
Control variables. Technological innovation, environmental regulation, regional economic growth and foreign direct investment have important effects on regional carbon emissions. On the basis of determining the core explanatory variables, environmental regulation (ER) (Xu, 2016), technological innovation (PA) (Wang and Wei, 2019), regional economic development (GDP) (Teixeira and Queiros, 2016; Liu et al., 2018) and foreign direct investment (FDI) (Sarkodie and Strezov, 2019) were further selected as control variables. The total investment amount of industrial pollution control, the number of patent applications, per capita GDP and the total investment of foreign enterprises in each region are respectively used to express. Among them, pollution control investment, per capita GDP and foreign enterprise investment are based on 2002 and converted into constant prices.
5 Mechanism test and discussion
5.1 Carbon emission level analysis
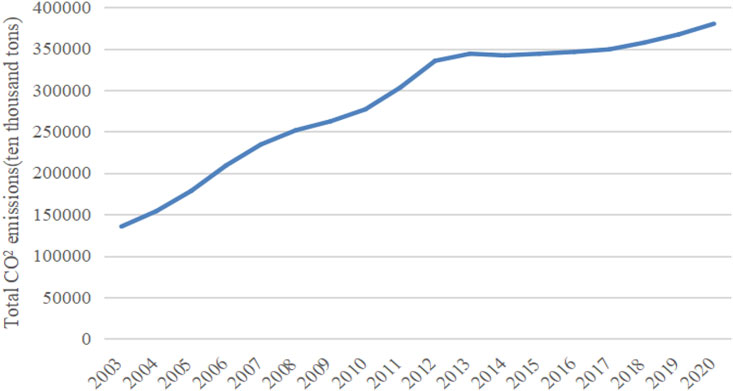
In order to understand the carbon emission level of each provincial region in China from 2003 to 2020, a broken line chart of China’s total carbon emission from 2003 to 2020 was drawn (see Figure 1). As can be seen from Figure 1, in recent 20 years, the total carbon emissions in China have been on the rise. However, after 2012, the rising speed and amplitude of the total carbon emissions decreased to a large extent, and the rising amplitude of the total carbon emissions tended to be gentle. This is because before 2011, China was in the stage of rapid industrial development, the development of the secondary and tertiary industries will inevitably promote the increase of energy consumption as the input factor, while after the 12th Five-Year Plan, China began to enter the post-industrial era, the demand for coal resources is constantly decreasing.
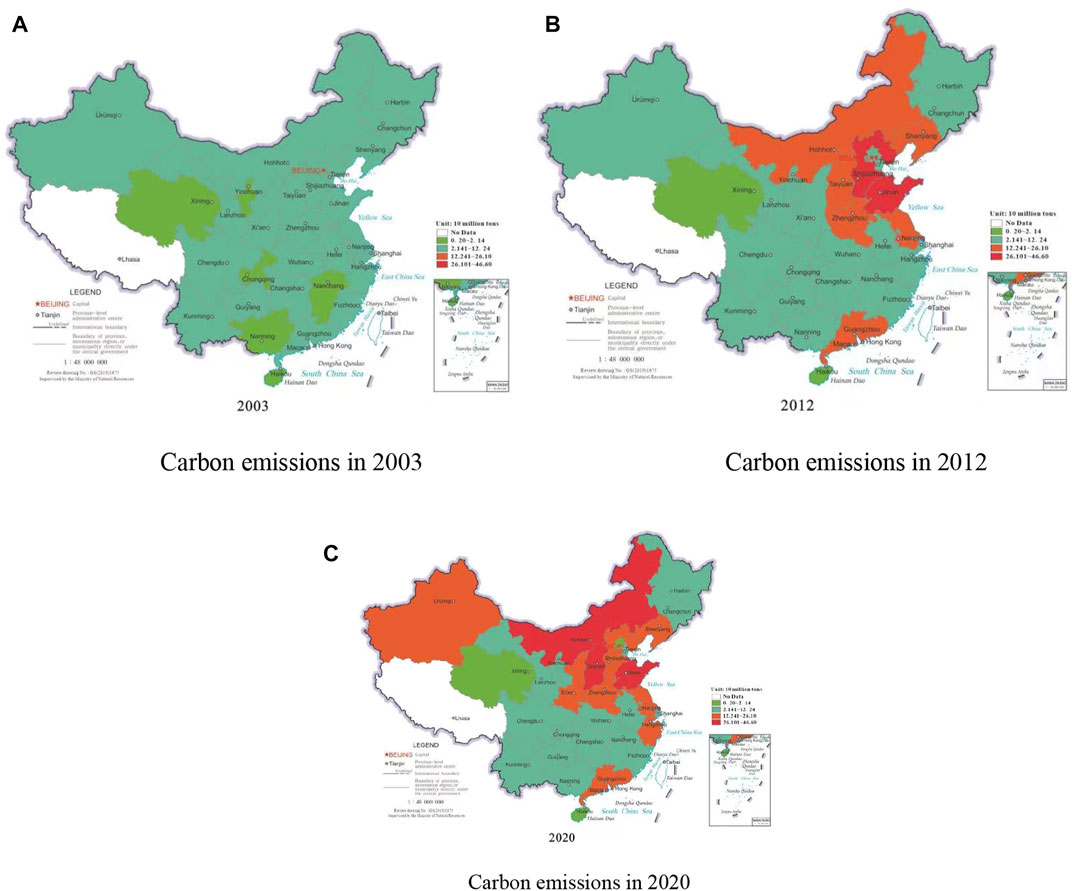
The emissions of each region in 2003, 2012 and 2020 were selected for analysis. According to the carbon emissions of each region in the 3 years, the emissions were divided into four ranges from small to large, which were named as low emission region, moderate emission region, high emission region and ultra-high emission region (see Figure 2). From 2003 to 2020, the number of regions with high emission and ultra-high emission also showed an increasing trend. The number of high-emission areas increased from zero in 2003 to six in 2012 and eight in 2020, while the number of ultra-high-emission areas increased from zero in 2003 to two in 2012 and three in 2020. The regions with the highest emissions in 2012 were Shandong and Hebei. Shandong is a major manufacturing center along China’s east coast, and its energy, industrial and agricultural sectors are also strong. Hebei, in northern China that surrounds Beijing, is the country’s largest steel-producing province. In 2020, the regions with ultra-high emissions were Inner Mongolia, Shandong and Shanxi. Among them, Inner Mongolia and Shanxi are large provinces with rich coal resources and high total carbon emission. This is partly evidence of the “resource curse” effect (Wu, et al., 2018).
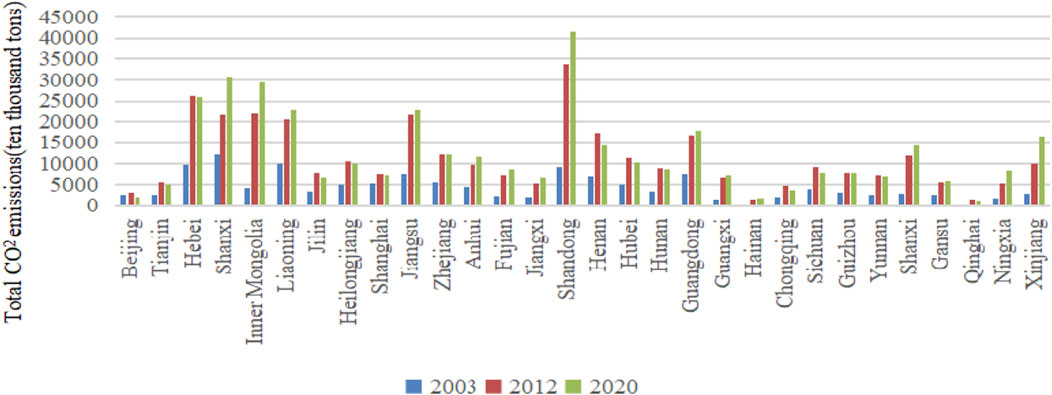
In order to fully understand the change trend of carbon emissions in 30 provincial-level regions in China during the 3 years, the column chart of carbon emissions in 30 provincial-level regions in 3 years was drawn (see Figure 3). Specifically, from 2012 to 2020, carbon emissions in most provincial-level regions showed a continuous rise trend, while the rise trend tended to be flat in the past decade. In addition, the total carbon emissions of a considerable number of provincial-level regions, such as Beijing, Tianjin, Jilin, Henan and Chongqing, have shown considerable reductions. Although the number of high emission and ultra-high emission areas has increased in China, as far as the structure of carbon emission is concerned, there are different directions and different degrees of carbon emission change trends in various regions, and the “Matthew effect” of carbon emission between regions is also vaguely presented. This is because each region becomes more dependent on its own comparative advantage, and the comparative advantage of factor endowment further strengthens the changes of regional industrial structure and energy consumption.
5.2 Direct impact test
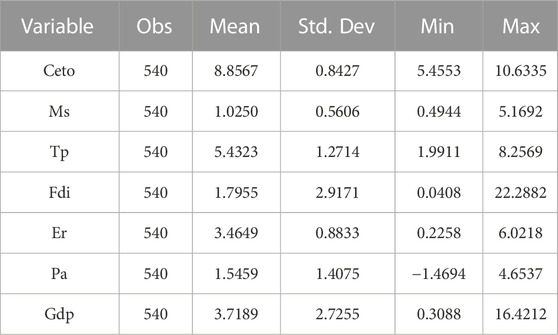
The least squares (OLS) estimation method is used to estimate the relationship between them. The mixed estimation model assumes that all individuals have exactly the same regression equation, so that all the data can be put together and OLS regression can be performed just like cross-sectional data, so it is called mixed regression. Before regression, descriptive statistical analysis was carried out on variables. In this paper, indicators of 30 provincial-level regions in China from 2003 to 2020 were used, and the total number of observation samples was 540 (see Table 2). The specific results of the mixed estimation are shown in Table 3.
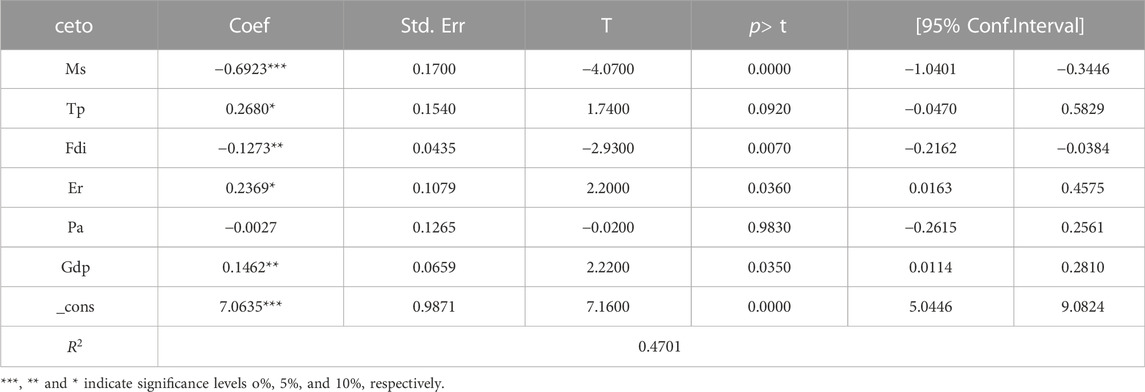
TABLE 3. Mixed estimation of industrial structure optimization, population agglomeration and carbon emissions.
According to Table 3, without considering individual effects, industrial structure optimization has a significant negative effect on carbon emissions, with a significance level of 1%.Population agglomeration has a significant positive effect on carbon emissions at a significant level of 10%.It can be seen that the industrial structure optimization can reduce carbon emissions on the whole, and regional carbon emissions also increase with the increase of population agglomeration level.
Since the basic assumption of mixed regression is that there are no individual effects, it is also known as’ Population-averaged estimator’ (PA), because the individual effects are averaged out. This hypothesis must be tested statistically. The null hypothesis that there is no individual effect is rejected by testing the mixed estimates. At the same time, the fixed effects model with cluster robust standard error (between-group estimator) was used to investigate the relationship between the two. The specific results are shown in Table 4.
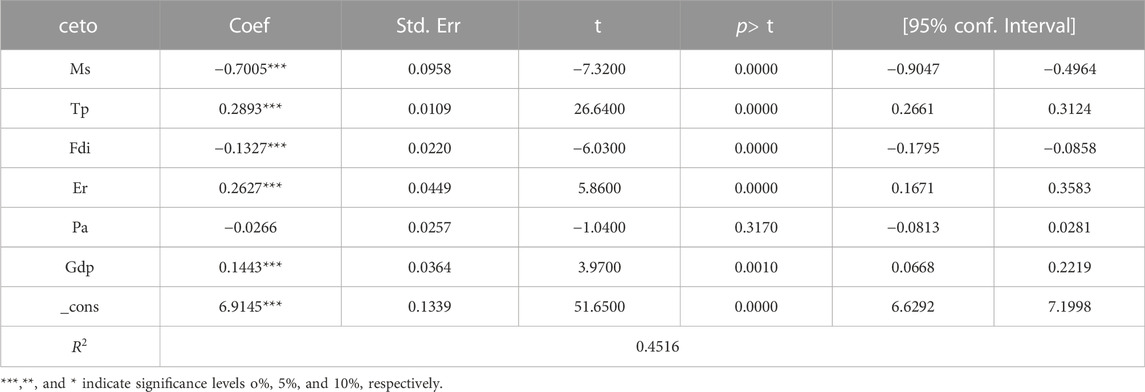
TABLE 4. Fixed effect model estimation of carbon emissions from industrial structure optimization and population agglomeration.
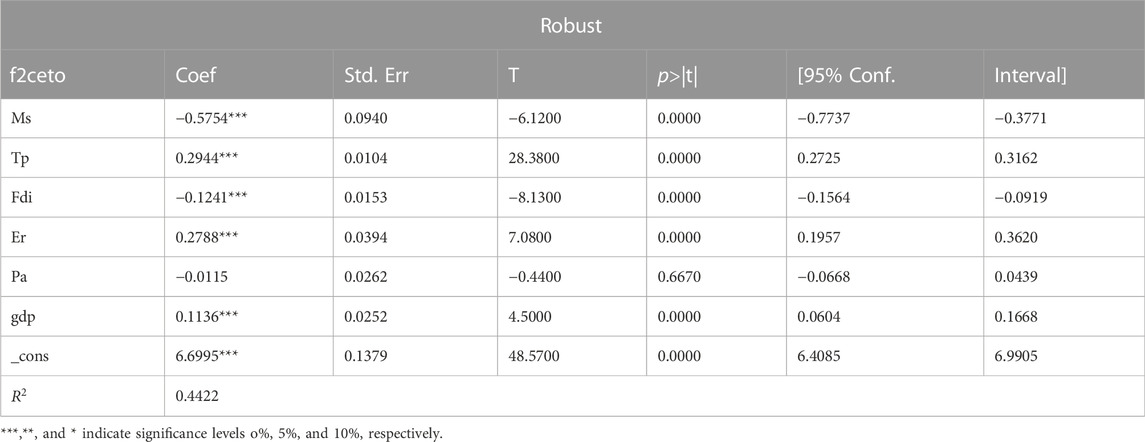
In order to further prove the robustness of the estimation within the group and clarify the possible long-term time effect among the three, the data with the dependent variable lagging for 2 years were selected for the robustness test of the model. The test results are shown in Table 5. Compared with Table 5, the results of the dependent variable taking the current year’s amount and the lag of 2 years are very close. Meanwhile, the impact of industrial structure optimization and population agglomeration on the dependent variable is similar to that of the mixed estimation results, which further indicates the robustness of the results. It can be seen that industrial structure optimization has a significant inhibitory effect on carbon emissions at the level of 1%, and population agglomeration has a significant promoting effect on carbon emissions at the level of 1%.
5.3 General moderating effect test
It can be seen from the above that industrial structure optimization and population agglomeration have a significant direct effect on carbon emissions. In view of the causal relationship between industrial structure and population agglomeration, the panel fixed effect model is used to estimate the moderating effect of population agglomeration on the relationship between industrial structure optimization and carbon emissions. Meanwhile, the results of the same period and the two lag periods were compared. On the one hand, the robustness of the results is proved. On the other hand, the differences of the long-term and short-term effects of industrial structure optimization and population agglomeration on carbon emissions are compared. The estimated results are shown in Table 6. As can be seen from Table 6, the model fit degrees were 0.7580 and 0.6534, respectively, indicating a high degree of fit. The estimated coefficient of the interaction term of industrial structure optimization and population agglomeration is −0.1210, which is significant at the 1% level. This indicates that the effect of industrial structure optimization on carbon emission will be moderated by population agglomeration. That is, with the increase of population agglomeration level, the inhibition effect of industrial structure optimization on carbon emission is enhanced. By comparing the results of two lag periods, it is found that industrial structure optimization, population agglomeration and their cross terms have the same direction of action on carbon emissions, and their influence coefficients are very close, which proves the robustness of the results. However, in the long run, the carbon emission reduction effect of industrial structure optimization is stronger, while the carbon emission effect of population agglomeration is weaker, and the synergistic effect of the two is also stronger.
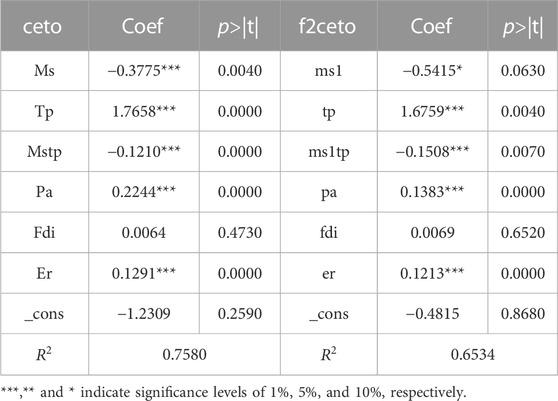
TABLE 6. General adjustment effect analysis of population agglomeration on emission reduction effect of industrial structure optimization.
5.4 Threshold effect test
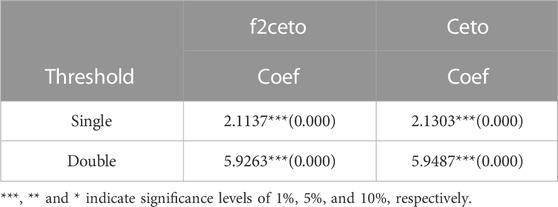
To further verify the non-linear action mechanism of industrial structure optimization and population agglomeration on carbon emissions, and explore whether population agglomeration has a threshold effect on carbon emission reduction caused by the upgrading of industrial structure. The existence of threshold effect was tested based on the method of hansen (1999), and repeated sampling was conducted for 300 times through the “self-help method”. The results of the independent variable lagging for two periods were also used as comparative analysis and robustness test. The sampling results show that both the simultaneous threshold effect and the lag two periods are tested by single threshold and double threshold, but not by triple threshold. The test results and estimates of the double threshold model are shown in Tables 7, 8.
Figures 4A, B of the likelihood ratio function with a lag of two periods were drawn. The 95% confidence intervals of the threshold estimators 2.1137 and 5.9963 are the critical value estimators under the significance level of all LR statistics less than 1%, which is in the acceptance domain of the null hypothesis that the threshold estimate is equal to the true value, that is, the acceptance threshold estimate is equal to the true value.
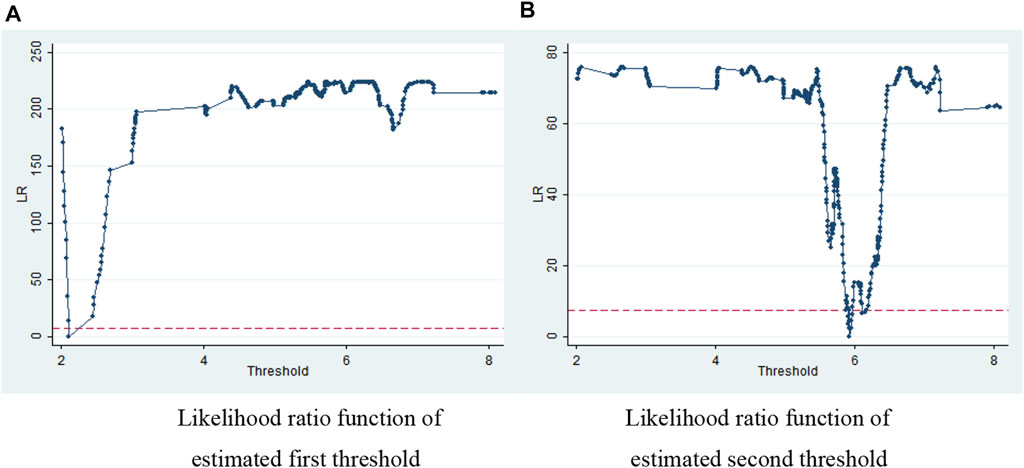
FIGURE 4. (A) Likelihood ratio function of estimated first threshold (B) Likelihood ratio function of estimated second threshold.
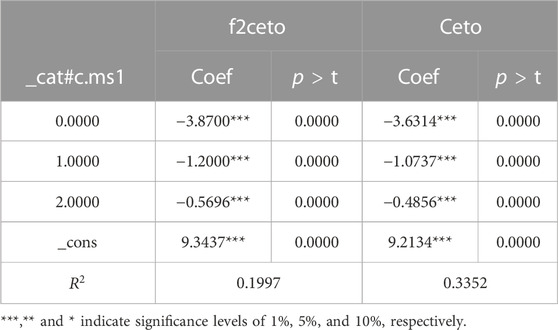
Combining Figures 4A, B with Tables 7, 8, it can be seen that, The industrial structure optimization has a threshold effect of population aggregation on carbon emissions, and there is a double threshold effect, the threshold values are 2.1137 and 5.9963, respectively, and both of them are significant at the level of 1%.According to the estimation results in Table 8, in the first interval, the influence coefficient of industrial structure optimization on carbon emission is −3.87, which is significant at the level of 1%.This indicates that when the population concentration degree is less than 2.1137, the industrial structure optimization has a significant inhibitory effect on carbon emissions. In the second interval, the influence coefficient of industrial structure optimization on carbon emission reduction is −1.2, which is significant at 1% level. When the population concentration level is greater than 5.9963, the industrial structure optimization has a significant negative effect on carbon emissions, and the influence coefficient is −0.5696. From the above results, it can be seen that the industrial structure optimization has an interval effect on regional carbon emissions with the population concentration level as the threshold. The carbon emission reduction effect of industrial structure optimization will be weakened with the increase of population concentration level. Comparing the estimation results of the same period, it is found that the direction of the estimation coefficients is the same, and the estimation coefficients are very close, which proves the robustness of the interval effect of population agglomeration on the industrial structure optimization. However, the interval effect of industrial structure optimization on carbon emissions is stronger than the inhibition effect in each interval.
5.5 Spatial spillover effect test
Spatial econometric models generally include SAR, SEM and SDM, each of which has its own applicable situation. In order to avoid model selection bias, this paper uses the general spatial panel econometric model to verify the spatial effects among the three. Before the spatial econometric analysis, the existence of spatial effect is tested first, that is, the spatial auto correlation test is conducted on the optimization level of industrial structure, population agglomeration and carbon emissions. The Moran ‘i index method was used to calculate the spatial effect from 2003 to 2020 under the geographical distance matrix. The results showed that the Moran ‘i index reached the significance level of 1% in each year. This indicates that there is a significant spatial auto correlation between industrial structure optimization, population agglomeration and carbon emission in 30 provinces from 2003 to 2020, which means that there is spillover effect in spatial distribution between them (the results are omitted).
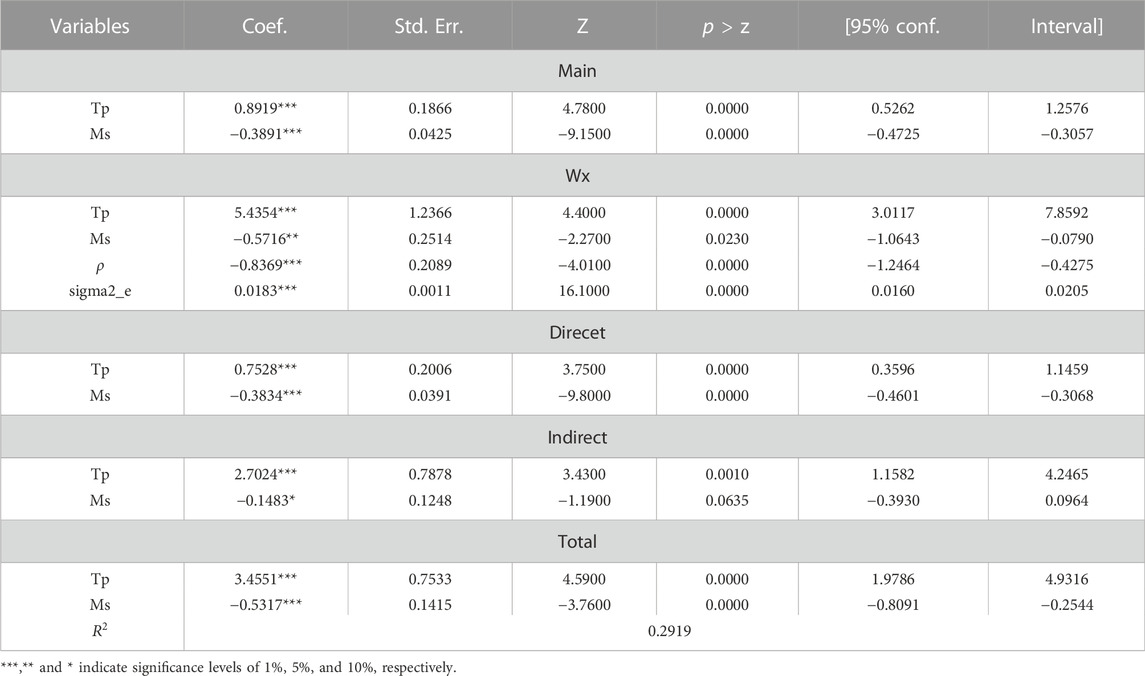
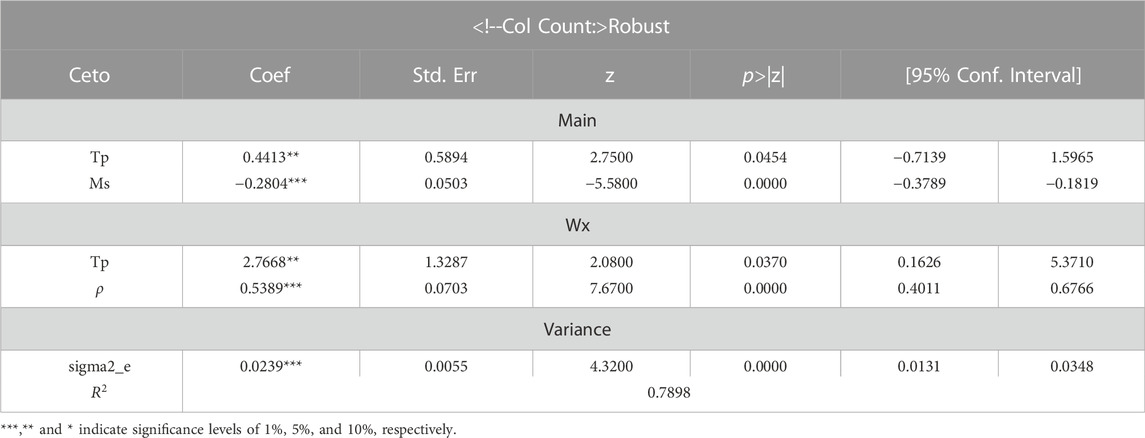
Based on the spatial weight matrix of geographical distance, the general spatial panel model is used to verify the spatial spillover effects of industrial optimization and population agglomeration on carbon emissions. The results are shown in Table 9. According to Table 9 , the total effect of industrial structure optimization on carbon emission is 3.4551, and the significance level is 1%.The total impact coefficient of population agglomeration on carbon emissions is −0.5317, and the significance level is 1%.In addition, the direct and indirect effects of industrial structure optimization and population agglomeration are also significant in the partial differential interpretation results of variable changes. The industrial structure optimization and population agglomeration have significant indirect effects on carbon emissions, and the industrial structure optimization in neighboring provinces has a significant negative spatial spillover effect on carbon emissions in their own province, and the influence coefficient of −0.1483 is significant at 10% level. However, the population agglomeration of neighboring provinces has a positive spatial spillover effect on the carbon emission of the province, and the coefficient is estimated to be 2.7024, which is significant at the level of 1%.According to the above results, industrial structure optimization can reduce carbon emissions of neighboring provinces through spatial spillover effect, while population agglomeration can increase carbon emissions of neighboring provinces through spatial spillover effect.
Since the Spatial Dubin Model (SDM) combines the advantages of the spatial lag model and the spatial error model, it can investigate the spatial effects of the main variables and unobservable random shocks at the same time. Therefore, the SDM model is used to test the robustness of the relationship between the three. The test results are shown in Table 10. According to the results in Table 10, the test results of the SDM model are very close to the results of the general spatial panel model, indicating the robustness of the spatial spillover effect of industrial structure optimization and population agglomeration on carbon emissions.
6 Discussion
The results of Tables 2–Tables 5 show that industrial structure optimization has a significant negative effect on regional carbon emissions. In the long run, it has a stronger inhibition effect on carbon emissions. This is due to the optimization and upgrading of industrial structure, which can weaken the influence of natural resources on the formation of resource-dependent industrial structure (Wang and Chen, 2020). The negative external effect of population agglomeration is obvious, because the consumption of daily energy brought by population increases greatly, such as transportation energy consumption and electricity consumption (Liddle and Lung, 2010). Thus, improving energy efficiency and lowering carbon emissions by providing or encouraging living in high-rise buildings and using public transport resources is not proven.
The results in Tables 7–Tables 9 show that population agglomeration has a significant positive moderating effect and a double threshold effect on carbon emissions from industrial structure optimization. From the perspective of population agglomeration promoting the industrial structure optimization, the cross-terms of the two have a significant inhibiting effect on carbon emission at the level of 1%.This means that when more people are matched into a more optimized industrial structure, carbon emissions can be effectively reduced (Wu et al., 2021). However, in terms of interval effect, there are significant interval differences in the effect of industrial structure optimization on carbon emissions, which are not reflected in the direction of the effect, but in the intensity of the effect. In the current period, when the population concentration level is lower than 2.1303, the industrial structure optimization has the strongest carbon emission reduction effect. However, when the concentration level is greater than 5.9487, the intensity of carbon emission reduction is the weakest. In the long run, when the population concentration level is less than 2.1137, the carbon emission reduction intensity is maximum, and when the population concentration level is greater than 5.9263, the carbon emission reduction intensity is minimum. This indicates that the carbon emission reduction effect of industrial structure optimization is limited by the population agglomeration level, and the lower the agglomeration level, the stronger the emission reduction effect. In the long run, the emission reduction effect of industrial structure optimization is better, but there is a more strict limit on the population concentration level. According to the above findings, it is necessary to find a reasonable match between regional population size and industrial structure (Khan et al., 2020).
Tables 9, 10 show that industrial structure optimization, population agglomeration and carbon emissions have significant spatial spillover effects. The spatial spillover effect of industrial structure optimization is significantly negative, while the spatial spillover effect of population agglomeration is significantly positive. Geographical proximity facilitates internal information exchange and the spread of green technologies through frequent interaction of professional and technical personnel, as well as the integration of development concepts and industrial synergies (Zeng et al., 2021).
7 Conclusion and policy implications
Nature is the basic condition for human survival and development. o actively yet prudently promote carbon peaking and carbon neutralization, and to carry out carbon peaking in planned steps, is a necessary measure for China to actively participate in global governance on climate change. Industrial structure adjustment is an effective path for our country to reduce carbon emissions and strive to achieve the peak target as soon as possible. However, the optimization of regional industrial structure is often accompanied by the accumulation of resources, especially the large-scale agglomeration of population. It has important practical significance and strategic value to explore how to reduce carbon emission under the coexistence of industrial structure optimization and regular population crowding.
This paper constructed a panel model to verify the various mechanisms of industrial structure optimization and population agglomeration on carbon emissions, based on the panel data of provincial regions from 2003 to 2020. 1) The fixed effects model was used to verify the direct effects and general moderating effects among the three. 2) Panel threshold model was used to further explore the heterogeneous effect of population agglomeration on emission reduction interval of industrial structure optimization. 3) The spatial weight matrix was introduced to construct a spatial econometric model to analyze the spatial spillover effects of industrial structure optimization, population agglomeration and carbon emissions. The specific conclusions are as follows:
First, considering the environmental regulation, the scale of opening to the outside world, regional economic development and technological progress, the improvement of industrial structure optimization level can effectively reduce regional carbon emissions, this conclusion is consistent with the mainstream conclusion of the academic circle (Zhao et al., 2022).
Second, population agglomeration plays an important role in the relationship between industrial structure optimization and carbon emission (Liu J. et al., 2021). First, population agglomeration can reduce regional carbon emissions by adjusting industrial structure optimization. Secondly, in terms of regional heterogeneity test, population agglomeration is taken as the threshold variable to verify that there is a significant double threshold effect in the carbon emission reduction of industrial structure optimization. With the increase of population agglomeration level, the carbon emission reduction effect of industrial structure optimization is gradually weakened.
Thirdly, industrial structure optimization, population agglomeration and carbon emissions have significant spatial spillover effects. Industrial structure optimization is conducive to carbon emission reduction in neighboring areas, while excessive population agglomeration contributes positively to carbon emissions in neighboring areas.
According to the above conclusions, some suggestions are put forward to promote the low-carbon development of 30 provincial-level regions in China. First, optimizing industrial structure is an effective way to reduce regional carbon emissions and realize the target of carbon peak soon in China. Therefore, we should continue to vigorously develop the tertiary industry and increase the proportion of tertiary industry output. Policymakers should give full play to their role in industrial development, and optimize and upgrade local industrial structure by improving regional infrastructure, building a good business environment and attracting a number of high-quality large enterprises to settle in. At the same time, carbon reduction strategies can be optimized by developing energy-saving carbon pricing (Jiang et al., 2022) and promoting natural gas reform (Jiang et al., 2021). Second, population sprawl and unsustainable lifestyle are important reasons for the increase of regional carbon emissions. Therefore, policymakers should control the overuse of natural resources by the population and promote sustainable lifestyles, such as water and energy conservation and the use of renewable energy. We should give full play to the positive externalities of population agglomeration, strive to achieve economies of scale in the utilization of energy and resources, and improve the quality level of population and environmental awareness. Thirdly, formulate reasonable population mobility policies, especially to raise the population entry threshold in regions with a high level of industrial structure optimization, and maximize the green and low-carbon development effect of the regional industrial system. Fourthly, due to the obvious spatial effects of industrial structure optimization and population agglomeration on carbon emissions, good information sharing and economic sharing mechanisms should be established among regions. To avoid “beggar-thy-neighbor” phenomenon, we should build a platform for inter-regional interaction and cooperation of industrial factors and promote the rational inter-regional flow of innovative resources and technological factors. At the same time, we will give full play to the regional linkage mechanism and formulate and improve policies for coordinated socio-economic development to rationalize the spatial distribution of population.
8 Prospects
The mechanism of industrial structure optimization and population agglomeration on carbon emissions is based on the provincial data from 2003 to 2020. So, the action mechanism of urban industrial structure and population agglomeration on urban carbon emission is averaged out. The actual situation of industrial structure optimization, population agglomeration and carbon emissions may vary greatly among cities within provinces. Therefore, in the future, the industrial structure optimization, population agglomeration and carbon emissions of prefecture-level cities in China will be explored, and the relationship among them will be verified.
Data availability statement
Publicly available datasets were analyzed in this study. This data can be found here: http://www.stats.gov.cn/.
Author contributions
LL: Conceived and designed the study, Built the model and wrote the paper. CH: Built the model and revised the manuscript. ZH: Formal analysis, Revised the manuscript, All authors read and approved the manuscript.
Acknowledgments
The authors wish to express their sincere gratitude to the Philosophy and Social Science Project of Heilongjiang Province (21JYC243), Heilongjiang Province University Basic scientific Research funds project (2021-KYYWF-0084).
Conflict of interest
The authors declare that the research was conducted in the absence of any commercial or financial relationships that could be construed as a potential conflict of interest.
Publisher’s note
All claims expressed in this article are solely those of the authors and do not necessarily represent those of their affiliated organizations, or those of the publisher, the editors and the reviewers. Any product that may be evaluated in this article, or claim that may be made by its manufacturer, is not guaranteed or endorsed by the publisher.
References
Ahmad, M., Khan, Z., Anser, M. K., and Jabeen, G. (2021). Do rural-urban migration and industrial agglomeration mitigate the environmental degradation across China’s regional development levels? J. Sustain. Consum. 2021 (27), 679–697. doi:10.1016/j.spc.2021.01.038
Al-Ghandoor, A., Al-Hinti, I., Mukattash, A., and Al-Abdallat, Y. (2010). Decomposition analysis of electricity use in the Jordanian industrial sector. J. Int. J. Sustain. Energy 29 (4), 233–244. doi:10.1080/14786461003782724
Anselin, L., and Florax, R. J. (1995). M. New directions in spatial econometrics. Berlin, Heidelberg: Springer, 3–18.New directions in spatial econometrics
Brownstone, D., and Golob, T. F. (2009). The impact of residential density on vehicle usage and energy consumption. J. Urban Econ. (1), 91–98.
Cai, F. (2013). How does China's economic growth shift to total factor productivity- driven growth. J. Chin. Soc. Sci. 2013 (01), 56–71.
Chang, N. (2015). Changing industrial structure to reduce carbon dioxide emissions:A Chinese application. J. Clean. Prod. 103 (15), 40–48. doi:10.1016/j.jclepro.2014.03.003
Chen, J., Wang, B., Huang, S., and Song, M. (2020). The influence of increased population density in China on air pollution. J. Sci. Total Environ. 735, 139456. doi:10.1016/j.scitotenv.2020.139456
Cheng, Z. H., Liu, J., and Li, L. S. (2019). Study on the influence effect of industrial Structure Adjustment and technological Progress on haze emission reduction. J. China Soft Sci. 2019 (01), 146–154.
Clark, J. B., and Clark, B. (2010). Assessing the temporal stability of the population/environment relationship in comparative perspective: A cross-national panel study of carbon dioxide emissions, 1960–2005. J. Popul. Environ. 32, 27–41. doi:10.1007/s11111-010-0117-x
Duranton, G., and Puga, D. (2020). The economics of urban density. J. J. Econ. Perspect. 34 (3), 3–26. doi:10.1257/jep.34.3.3
Duro, J., and Padilla, E. (2006). International inequalities in per capita CO2 emissions:A decomposition methodology by Kaya factors. J. Energy Econ. 28 (2), 170–187. doi:10.1016/j.eneco.2005.12.004
Edward, L. G., and Matthew, E. K. (2009). The greenness of cities: Carbon dioxide emissions and urban development. J. J. Urban Econ. 67 (3), 404–418. doi:10.1016/j.jue.2009.11.006
Ervural, B. C., Zaim, S., and Delen, D. (2018). A two-stage analytical approach to assess sustainable energy efficiency. J. Energy 164, 822–836. doi:10.1016/j.energy.2018.08.213
Fang, C., and Lin, X. (2009). The eco-environmental guarantee for China's urbanization process. J. J. Geogr. Sci. 19, 95–106. doi:10.1007/s11442-009-0095-z
Fu, L. H. (2010). An empirical study on the relationship between advanced industrial structure and economic growth in China. J. Stat. Res. 27 (8), 79–81.
Gan, C. H., Zheng, R. G., and Yu, D. F. (2011). The influence of China's industrial structure change on economic growth and fluctuation. J. Econ. Res. 2011 (05), 200–320.
Glaeser, E. (2011). Triumph of the city: How our greatest invention makes us richer, smarter, greener, healthier, and happier. London, United Kingdom: M. Penguin Press.
Grossman, G. M., and Kruege, A. B. (1995). Economic growth and the environment. J. Q. J. Econ. 110 (2), 353–377. doi:10.2307/2118443
Hansen, B. E. (1999). Threshold effects in non-dynamic panels: Estimation, testing, and inference. J. Econom. (93), 345–368.
He, W. J., Zhang, H. F., Chen, X. H., and Yan, J. J. (2019). Empirical research on population density, industrial agglomeration and carbon emission in China province - is based on the perspective of agglomeration economy, crowding effect and spatial effect. J. Nankai Econ. Res. 2019 (02), 207–225.
Holden, E., and Norland, I. T. (2005). Three challenges for the compact city as a sustainable Urban form: Household consumption of energy and transport in eight residential areas in the greater Oslo region. J. Urban Studies (12), 2145–2166.
Huang, Q. H., Li, F. F., et al. (2017). Industrialization blue book: China’s industrialization process report (1995-2015). M. Beijing: Social Sciences Academic Press, 129–135.
IPCC (2006). IPCC guidelines for national greenhouse gas inventories. R. Kana qawa. Kanagawa, Japan: The Institute for Global Environmental Strategies.
Jia, J., Gao, Y. Z., and Shen, Y. (2022). Population agglomeration and advanced industrial structure: Which comes first. J. Financial Sci. 2022 (07), 106–121.
Jiang, H. D., Purohit, P., Liang, Q. M., Dong, K., and Liu, L. J. (2022). The cost-benefit comparisons of China's and India's NDCs based on carbon marginal abatement cost curves. J. Energy Econ. 109, 105946. doi:10.1016/j.eneco.2022.105946
Jiang, H., Xue, M. M., Dong, K., and Liang, Q. M. (2021). How will natural gas market reforms affect carbon marginal abatement costs? Evidence from China. Oxon: J. Economic Systems Research.
Kaya, A., and Koc, M. (2019). Over-agglomeration and its effects on sustainable development: A case study on istanbul. J. Sustain. 11 (1), 135. doi:10.3390/su11010135
Khan, I., Hou, F., and Le, H. P. (2020). The impact of natural resources, energy consumption, and population growth on environmental quality: Fresh evidence from the United States of America. J. Sci. Total Environ. 754, 142222. doi:10.1016/j.scitotenv.2020.142222
Li, C. (2021). The impact of industrial structure upgrading on my country's carbon emission reduction from the perspective of high-quality development. J. Sustain. Dev. 11 (1), 149–159. doi:10.12677/sd.2021.111018
Li, K., Fang, L., and He, L. (2019). How population and energy price affect China's environmental pollution? J. Energy Policy 129, 386–396. doi:10.1016/j.enpol.2019.02.020
Liddle, B. (2004). Demographic dynamics and per capita environmental impact:Using panel regressions and household decompositions to examine population and transport. J. Popul. Environ. 26 (1), 23–39. doi:10.1023/b:poen.0000039951.37276.f3
Liddle, B. (2014). Impact of population, age structure, and urbanization on carbon emissions/energy consumption:evidence from macro-level, cross-country analyses. J. Popul. &Environment 2014.
Liddle, B., and Lung, S. (2010). Age-structure, urbanization, and climate change in developed countries: Revisiting STIRPAT for disaggregated population and consumption-related environmental impacts. Dordrecht: J. Population and Environment.
Liu, J., Li, S., and Ji, Q. (2021). Regional differences and driving factors analysis of carbon emission intensity from transport sector in China. J. Energy. 120178.
Liu, J. Q., and Ma, X. Y. (2021). Population aging, industrial structure upgrading and carbon emission --: Spatial measurement analysis based on STIRPAT model. J. Finance Econ. 2021 (7), 54–62.
Liu, Z. Y., Li, H. J., and Hu, Y. Y. (2018). The upgrading of human capital structure and economic growth. J. Econ. Stud. 3, 50–63.
Liu, Z., Chen, C., Niu, G., Wang, F., Liu, S., and Chen, X. (2010). Optical imaging of integrin alphavbeta3 expression with near-infrared fluorescent RGD dimer with tetra(ethylene glycol) linkers. J. Abroad Soc. Sci. 9 (3), 21–29.
Ma, L. M., and Zhang, X. (2014). Spatial effect of haze pollution and economic and energy structure influence in China. J. China’s Ind. Econ. 2014 (4), 19–31.
Mc Combie, J. S. L. (1991). Estimating technical change in aggregate production functions: A critique. J. Int. Rev. Appl. Econ. 5, 24–46. doi:10.1080/758524204
Menz, T., and Welsch, H. (2011). Population aging and environmental quality in OECD countries: Evidence from sulfur dioxide emissions data. J. Popul. Environ. 33 (1), 55–79. doi:10.1007/s11111-011-0132-6
Ngai, L. R., and Pissarides, C. (2007). Structural change in a multi-sector model of growth. J. LSE Res. Online Documents Econ. 2007.
Paul, S., and Bhattacharya, R. (2004). CO2 emission from energy use in India:a decomposition analysis. J. Energy Policy 32 (5), 585–593. doi:10.1016/s0301-4215(02)00311-7
Phelps Brown, E. H. (1957). The meaning of the fitted Cobb-Douglas function. Q. J. Economics‚1957. 71 (4), 546–560∙. doi:10.2307/1885710
Qin, Y. M., Zhang, H., Zhao, H., Li, D., Duan, Y., and Han, Z. (2022). Research on the spatial correlation and drivers of industrial agglomeration and pollution discharge in the Yellow River Basin. J. Front. Environ. Sci. 10 (10), 2022. doi:10.3389/fenvs.2022.1004343
Samuelson, P. A. (1979). Paul Douglas’s measurement of production functions and marginal productivities. J.Journal Political Econ. 87, 923–939. doi:10.1086/260806
Sarkodie, S. A., and Strezov, V. (2019). Effect of foreign direct investments, economic development and energy consumption on greenhouse gas emissions in developing countries. J. Sci. total Environ. 646, 862–871. doi:10.1016/j.scitotenv.2018.07.365
Shao, S., Li, X., Cao, J. H., and Yang, L. L. (2016). China’s economic policy choices for governing smog pollution based on spatial spillover effects. J. Econ. Res. J. 51 (9), 73–88.
Sheinbaum, C., Belizza, J., and Ozawa, L. (2010). Energy consumption and related CO2 emissions in five Latin American countries: Changes from 1990 to 2006 and perspectives. Energy 07, 1–10.
Sun, F. H., Sun, D. Q., Hu, Y., Li, S. P., and Xu, J. B. (2013). China patterns of Chinese population pressure on the ecological environment:1990-2010. J. Popul. Res. 37 (5), 103–113.
Teixeira, A. A. C., and Queiros, A. S. S. (2016). Economic growth, human capital and structural change: A dynamic panel data analysis. J. Res. Policy 45 (8), 1636–1648. doi:10.1016/j.respol.2016.04.006
Wang, Q. (2015). Threshold effect of urban population size on environmental pollution. Beijing: Capital University of Economics and Business, 27–30.
Wang, W. Z., Liu, L., Liao, H., and Wei, Y. M. (2021). Impacts of urbanization on carbon emissions: An empirical analysis from OECD countries. J. Energy policy 151 (151), 112171. doi:10.1016/j.enpol.2021.112171
Wang, Y., and Chen, X. (2020). Natural resource endowment and ecological efficiency in China: Revisiting resource curse in the context of ecological efficiency. J. Resour. Policy 66, 101610–10. doi:10.1016/j.resourpol.2020.101610
WangWei, H. W. (2019). Coordinating technological progress and environmental regulation in CO2mitigation: The optimal levels for OECD countries&emerging economies. J. Energy Econ. 87, 104510. doi:10.1016/j.eneco.2019.104510
Wu, F. H., and Liu, R. M. (2013). Industrial Upgrading and Independent Innovation Capacity Construction - empirical research based on China interprovincial panel data. J. Industrial Econ. China 05, 57–69.
Wu, L., Sun, L., Qi, P., Ren, X., and Sun, X. (2021). Energy endowment, industrial structure upgrading, and CO2 emissions in China: Revisiting resource curse in the context of carbon emissions. J. Resour. Policy 74, 102329. doi:10.1016/j.resourpol.2021.102329
Wu, S., Li, L., and Li, S. (2018). Natural resource abundance, natural resource-oriented industry dependence, and economic growth: Evidence from the provincial level in China. J. Resour. Conservation Recycl. 139, 163–171. doi:10.1016/j.resconrec.2018.08.012
Xia, Y. R., and Lu, M. (2015). The “Three Migration of Mencius and Mother”between cities -- an empirical study on the influence of public service on labor flow. J. Manag. World 2015 (10), 78–90.
Xu, Z. W. (2016). Industrial economic development, environmental regulation intensity and pollution effect of emission reduction: Theoretical analysis and empirical test based on the development model of “pollution first, treatment later”. J. Financial Res. 42 (3), 134–144.
Yang, C. G. (2018). Population quality dividend, industrial transformation and sustainable economic and social development in China. J. Dongyue Treatise 39 (1), 46–53.
Yang, D. L., and Ren, H. F. (2018). Study on the influence of population Agglomeration on regional economic development in China. Demogr. J. 40 (03), 30–41.
Yang, D. L., and Ren, H. F. (2018). The effect of population cluster on regional economic development in China. J. Demogr. J. 40 (03), 30–41.
Yu, B. B. (2015). Economic growth effect of industrial structure adjustment and productivity improvement Analysis based on the panel model of urban dynamic space in China. J. Industrial Econ. China 2015 (12), 83–98.
Yu, Z., Fan, Y., and Luo, H. (2022). Study on the influence of Industrial structure upgrading on carbon emission intensity in China. J. East China Econ. Manag. 36 (01), 78–87.
Yuan, Y., Xi, Q., Sun, T. H., and Li, G. P. (2016). The impact of industrial structure on regional carbon emissions —— Is an empirical analysis based on multi-country data. J. Geogr. Res. 35 (01), 82–94.
Zeng, W., Li, L., and Huang, Y. (2021). Industrial collaborative agglomeration, marketization, and green innovation: Evidence from China’s provincial panel data. J. J. Clean. Prod. 279, 123598. doi:10.1016/j.jclepro.2020.123598
Zhang, W., Zhu, Q. G., and Gao, H. (2016). Industrial structure upgrading, energy structure optimization and low-carbon development of industrial system. J. Econ. Res. 51 (12), 62–75.
Zhao, Y. H., Qian, Z. L., and Xu, X. (2022). Impact of industrial structure upgrading on carbon emissions in China under the background of carbon peak and carbon neutrality. J. Explor. Econ. Issues 2022 (03), 87–105.
Keywords: industrial structure optimization, province, mechanism, population agglomeration, carbon emissions
Citation: Liang L, Huang C and Hu Z (2023) Industrial structure optimization, population agglomeration, and carbon emissions—Empirical evidence from 30 provinces in China. Front. Environ. Sci. 10:1078319. doi: 10.3389/fenvs.2022.1078319
Received: 24 October 2022; Accepted: 15 December 2022;
Published: 12 January 2023.
Edited by:
Muhammad Tayyab Sohail, Xiangtan University, ChinaReviewed by:
Anlu Zhang, Huazhong Agricultural University, ChinaHong-Dian Jiang, China University of Geosciences, China
Copyright © 2023 Liang, Huang and Hu. This is an open-access article distributed under the terms of the Creative Commons Attribution License (CC BY). The use, distribution or reproduction in other forums is permitted, provided the original author(s) and the copyright owner(s) are credited and that the original publication in this journal is cited, in accordance with accepted academic practice. No use, distribution or reproduction is permitted which does not comply with these terms.
*Correspondence: Lei Liang, MjAxOTA0NUBobGp1LmVkdS5jbg==
 Lei Liang
 Chongzhen Huang2
 Zixu Hu
