- 1School of Environmental Science and Engineering, Zhejiang Gongshang University, Hangzhou, China
- 2Zhejiang Key Laboratory of Ecological and Environmental Big Data, Hangzhou, China
- 3Zhejiang Ecological Environmental Monitoring Center, Hangzhou, China
The current water environment management of China has gradually shifted from reaching water quality standards to preserving water ecological health, and the control focus has extended from traditional nitrogen and phosphorus pollutants to micropollutants, such as heavy metals and emerging pollutants. However, the precise traceability and regulatory system of micropollutants in different regions’ watersheds was not yet mature. A five-step strategy of risk assessment and management was proposed this study to successfully construct a list of industrial priority pollutants and a list of 376 priority control discharge enterprises in 13 administrative regions of China’s Taihu Lake Basin. Firstly, a preliminary list of 78 pollutants was determined with reference to the emission standards of major regional industrial pollution sources, relevant national environmental regulations and literature reports. Secondly, 22 types of priority control pollutants were re-screened based on the analytical results of surface water samples obtained from 26 monitoring sites in the study area. Then the environmental risk values of the re-screened pollutants were calculated referring to the Chemical Hazard Evaluation for Management Strategy (CHEMS-1) method. Next, the regional environmental risk baseline value was determined and the risk value equivalent (EY) for each pollutant was calculated. Finally, according to the EY results, the regional priority control pollutants were identified, and the priority control discharge enterprises were confirmed retroactively. The results of this study can provide methodological support and a scientific basis for the precise control of micropollutants in surface water from differentiated regions.
1 Introduction
With the continuous promotion of national ecological environmental protection, the current water environment management of China’s surface water environment has gradually shifted from reaching water quality standards to preserving water ecological health, and its control focus has been extended from conventional nitrogen and phosphorus pollutants (Wang, et al., 2015) to micropollutants, such as heavy metals (Cui, et al., 2022; Huang, et al., 2022) and emerging pollutants (Chen, et al., 2021; Li, et al., 2021). As the third largest freshwater lake in China, Taihu Lake plays a pivotal role in the economic development of the lower reaches of the Yangtze River. However, in recent years, toxic and harmful substances discharged by enterprises in heavy polluting industries such as chemical industry, textile printing and dyeing, and ferrous metallurgy in the basin have caused serious damage to the water quality of Taihu Lake (Xu, et al., 2022; Meng, et al., 2018). Currently, there is a lack of regional differential screening and identification methods for such substances, and it is difficult for the environmental protection department to carry out targeted control of pollution in the specific implementation. There is an urgent need for the government to develop a list of localized priority pollutants to support the high-level improvement of water ecological environment quality.
Since the mid-1970s, some developed countries and relevant international organizations have been conducting screening of environmental priority control pollutants (Cui, et al., 2010). The United States Environmental Protection Agency (USEPA) mainly uses the production of pollutants, environmental detection rate, acute and chronic toxicity, as well as the environmental and biological effects of toxicity as assessment indicators, and then combines expert argumentation method to screen priority pollutants (Li, et al., 2018). The EU Water Framework Directive is based on monitoring and model prediction to calculate the exposure score and toxicity effect score of pollutants, and the risk ranking of pollutants according to the total score, and finally the priority pollutants are determined by expert evaluation (EC, 2011). The screening of priority pollutants in the environmental white paper issued by the Japanese government takes into account the toxicity, persistence, and bioconcentration of pollutants (Bu, et al., 2016), and the methodology is objective but does not consider the human health risks associated with environmental exposure.
China had selected a total of 68 types of 14 categories of benzene, phenol, DDT, etc. for the blacklist of priority control pollutants in China’s water based on the comprehensive assessment of the acute and chronic toxicity, carcinogenic, teratogenic and mutagenic effects, product yield, and environmental detection rate of pollutants, were (He, et al., 2014). However, the evaluation method is highly subjective, which also lacks model parameters and scoring criteria based on the actual local environmental conditions in China, and does not consider the risk of human health exposure caused by pollutants. Meanwhile, with the rapid development of economy, science and technology, the status quo of pollutants in China’s environment and the level of government supervision and control have changed. The blacklist of priority-controlled pollutants in China’s water can't meet the requirements of current regional differentiated and precise pollution control.
The specific methods for screening priority pollutants in the environment all over the world include the potential hazard index method, the Hasse graphical method, and the comprehensive scoring method and so on. The potential hazard index method is a method for ranking chemical substances based on their potential hazard level to the environment, which can use various toxicity data to estimate the potential hazard level of chemical substances through a unified model (Du, et al., 2022), which is fast, easy and comparable. The Hasse graphical method is a method that uses vectors to describe the hazards of compounds and graphically shows the relative magnitude of the hazards of compounds and the logical relationship between them (Kudlak, et al., 2014), which can visually represent the relative magnitude of the hazards of compounds and the contradiction of different indicators (Tsakovski, et al., 2010). However, these method does not take into account the state of existence of pollutants in the environment and cannot reflect the diffusion law of chemical substances (Fan, et al., 2016), which needs further improvement. Among the various comprehensive evaluation methods, the Chemical Hazard Evaluation for Management Strategy (CHEMS-1) adopted by EPA is screened based on the pollutants’ toxic effects, hazards to the environment and human health and exposure effects, combining with the emission, persistence and bioaccumulation of pollutants in the ecosystem for comprehensive evaluation (USEPA, 1994; Pei, et al., 2013; Zhu, et al., 2013). Then, the list of regional priority pollutants is determined by assigning quantitative evaluation results and ranking. This method has been used in various studies to evaluate and prioritize contaminant risks (Swanson, et al., 1997; Tobiszewski and Namieśnik, 2015; Guo, et al., 2021). Compared with other evaluation methods, CHEMS-1 technology has the following advantages: 1) it integrates human health effects, environmental hazards and exposure effects, and has a more comprehensive evaluation perspective; 2) the evaluation method is based on the toxicity effects of pollutants, which is more practical for evaluating regions where the main discharged pollutants are relatively toxic pollutants, and is more consistent with the pollution production characteristics of enterprises in heavy pollution industries; 3) based on the emission and persistence of pollutants and other factors, starting from the actual pollution situation, and taking into account the long-term harm degree of pollutants, the selected list of priority pollutants screened out is more time-sensitive and more consistent with the future pollution situation; 4) the calculation process is simpler and easier to implement than other methods, and is currently widely used (Zhang, et al., 2015; Karahan Ozgun, et al., 2016).
This study focused on the pollutants discharged from industrial pollution sources in the water environment of different regions. A five-step method was proposed for identifying regional priority industrial pollutants that need to be controlled urgently referring to EPA’s CHEMS-1 technology. On this basis, trace the industrial enterprises that discharge these pollutants in the region and a list of key industrial enterprises was determined. This method is scientific, accurate and operable, making it easier for local governments to control industrial pollution sources and provide technical support for regionalized, differentiated and precise environmental pollution control.
2 Materials and methods
2.1 Study area
The water area of Taihu Lake is about 2338 km2, with an average depth of 1.9 m and a maximum depth of about 3.4 m (Dai, et al., 2016). The study area covers 13 county-level administrative regions of Zhejiang province in China. The leading industries in this area are paper making, printing and dyeing, tannery, electroplating, pharmaceutical and other heavy pollution industries. Zhejiang area of the Taihu Lake Basin has been one of the key areas for water environment management in China.
2.2 Sampling point layout
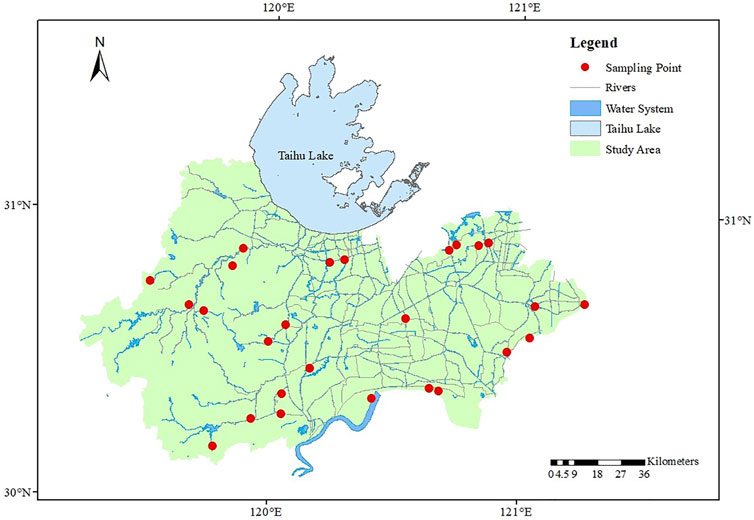
There are 13 administrative regions in Zhejiang area of Taihu Basin. The sampling principle was to distribute at least 2 monitoring points in each county-level administrative area, thus a total of 26 monitoring locations were selected for surface water sampling and analysis in August 2020. The monitoring points were all national/provincial/municipal control cross-section points, so the water samples can represent the pollution level of local surface water. Figure 1 shows the distribution of specific sampling points, and Supplementary Table S1 shows the detailed latitude and longitude of sampling points. Sampling methods are shown in Supplementary Text S1 of the Supplementary Material. Monitoring indicators cover 67 contaminants in the initial screening list. Sample collection, pre-treatment, instrument analysis and quality control carried out in accordance with national standard methods or the methods recommended in the “Surface Water Environmental Quality Standards” (GB3838-2002).
2.3 Construction of a priority pollutant identification and assessment method
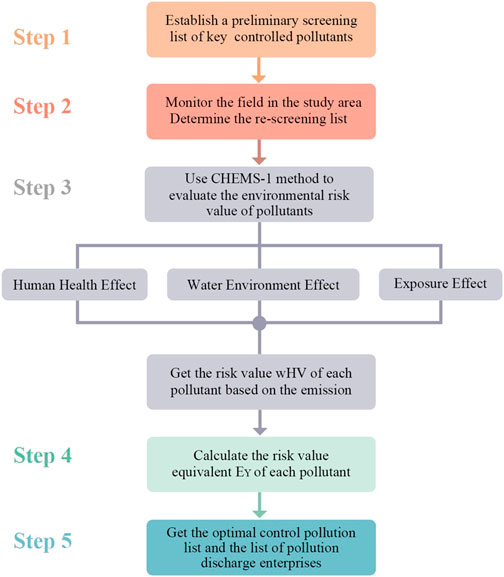
This study establishes the identification, screening and evaluation method of regional industrial priority control pollutants based on CHEMS-1 method (Figure 2). Specifically, there are five steps: 1) establishing the initial screening list of priority pollutants by referring to national environmental protection laws, industry emissions standards, and regulations and literature reports; 2) sampling and testing of surface water in the study area and re-screening of the pollutants according to the analysis results; 3) evaluating the environmental risk values of pollutants in the re-screening list by referring to the CHEMS-1 evaluation method and calculating the risk values of each pollutant; 4) determining the regional environmental risk benchmark value and calculate the risk value equivalent EY for each substance based on the risk benchmark value; 5) for pollutants with EY ≥1, determining the priority pollutants to be controlled in the region, and finally determining the regional key industrial enterprises list under control based on the basic emission statistics of regional pollution sources.
2.3.1 Initial screening
In the process of screening and identification of regional industrial priority pollutants, a preliminary screening list of pollutants should be established first. The initial screening principles are as follows: 1) give priority to select pollutants with large production, use and emissions in major industries in the region or basin; 2) give priority to pollutants with high environmental detection rate and resistance to degrade; 3) give priority to pollutants with bioaccumulation and biotoxicity; 4) give priority to pollutants that have certain analytical conditions to be detected by targeted or non-targeted analytical methods. The initial screening lists of pollutants in different surface water environments are mainly based on the blacklist of priority control pollutants in China’s water, Surface Water Environmental Quality Standards (GB 3838–2002) and wastewater discharge standards of various industries, etc., with reference to relevant pollutant research literature and reports as well as the actual pollution conditions of the studied areas.
2.3.2 Re-screening
Surface water monitoring sections in the study area were selected to conduct point monitoring with the method of 2.2 introduced, and based on the monitoring results, the indicators of the pollutants not detected in the area were eliminated and the priority control pollutants present were re-screened from the initial screening list.
2.3.3 Environmental risk assessment and assignment
The environmental risk assessment and assignment of priority control pollutants refer to the aforementioned CHEMS-1 technique, which integrates the human health effects, water environment effects and exposure effects of the re-screened pollutants, quantifies the evaluation results by assigning scores, and then ranks the pollutant scoring results to finally obtain the priority control pollutant list.
The aquatic animals in Taihu Lake Basin mainly include white fish, white shrimp, silver fish, white chub, chub, crucian carp, grass carp and cyprinid; aquatic plants include bitter grass, spiny bitter grass, whorled black algae, microtooth eyelet, goldfish algae and Malaysian eye (Gao, et al., 2019). In the risk assignment of pollutants, the corresponding pollutant risk assignment of these aquatic organisms was selected, and the scoring of each risk value was expressed by the continuity equation, and the risk level of each risk item and the calculation method of the assignment are shown in Supplementary Table S2.
The human health effects (HH-E) risk values were calculated by grading the human acute oral risk (LD50 of rodent), human acute inhalation toxicity (LC50 of rodent), carcinogenicity and other effects, and then scoring. The LD50 and LC50 data sources were obtained by reviewing the literature based on plant and aquatic animal species in the Taihu Lake Basin. Carcinogenicity was based on the International Agency for Research on Cancer (IARC) and EPA classifications, and was assessed using the Safety Assessment Report (SAR) if neither IARC nor EPA classified the chemical as its carcinogenicity.
HH-E is calculated using the following equation:
where HVOR is the human acute oral effects; HVINH is the human acute inhalation toxicity effects; HVCAR is the carcinogenicity effects; and HVother is the other specific effects, including mutagenicity, developmental effects, reproductive effects, neurotoxicity and neurotoxicity.
The calculation of risk values for water environmental effects (WE-E) is based on rodent oral LD50, fish LC50 and fish no observable effect level (NOEL). NOEL is used to assess chronic sublethal effects on fish and is estimated from acute toxicity data (i.e. LC50 data) and the n-octanol water partition coefficient (Kow) of the chemical, calculated as follows:
When 2 ≤ logKow <5,
When logKow ≥5,
When logKow <2,
WE-E is calculated using the following equation:
where HVMAM is the acute oral effects for terrestrial organisms; HVFA is the acute toxicity effects for fish; and HVFC is the chronic toxicity effects for fish.
Exposure effects (E-E) are classified as persistence and bioconcentration. The former is based on the assessment of the half-life of biological oxygen demand (BOD) and the half-life of hydrolytic degradation (HYD) to obtain the residual persistence of pollutants in the environment, calculated with reference to the Hammett and Taft substitution constant method. Bioconcentration factor (BCF) is determined by the quantitative structure-activity relationship (QSAR) equation (Binetin and Devillers, 1994).
E-E is calculated using the following equation:
The total risk values for contaminants include HH-E, WE-E and E-E, with the following equations:
where HV is the total risk value; emission data refers to the 2020 Zhejiang Province Ecological Environment Statistics Annual Report; wHV is the risk value based on emission; RWF is the emission weight of pollutants in water.
2.3.4 Identifying regional priority pollutants and their industrial priority emission sources
As mentioned above, the identification range of priority pollutants was determined through pollutant screening, and then the potential risk value of each pollutant was quantified by constructing a scoring system to obtain its potential risk value to the environment. Due to the lack of evaluation benchmarks for the current risk level of micropollutants in the water environment, an evaluation benchmark needs to be set reasonably to further screen different regional priority pollutants.
Since there were no mercury pollutants discharged from the enterprises involved in the study area, and the long-term monitoring results from the cross-sectional monitoring stations showed that the mercury content in surface water usually met the water quality standard for surface water (category III, GB3838-2002), Therefore, it is assumed that mercury will continue to be at low risk level and can be considered as the benchmark pollutant in the study area. If the pollutants’ risk value is lower than that of mercury, the pollutant is considered to be at low risk and can be excluded from the list of regional priority pollutants. Based on the above assumptions, the environmental risk background values of the benchmark pollutant were calculated according to the environmental limit value (0.0001 mg/L) of total mercury in surface waters (category III) of the Surface Water Environmental Quality Standards (GB3838-2002) and the amount of surface water in study area. Due to the algorithm takes into account the different regional surface water environmental capacity, the evaluation results of environmental risk background values are more accurate and more in line with the actual control needs of regional differentiated environmental risks and priority control pollutants.
The risk value of each pollutant in each region is divided by the environmental risk background value to obtain the risk value equivalent of each pollutant in each region relative to the baseline pollutant, expressed by the letter EY and EY calculated as:
where Y is the pollutant type; EY is the risk value equivalent of pollutant Y; X is each county and urban area of Taihu Lake Basin; wHVX, Y is the risk value of pollutant Y in area X based on the discharge; wHVX, b is the environmental risk background value of the benchmark pollutant in area X.
The pollutants with risk value equivalent EY ≥1 in the region were listed as industrial priority pollutants for control in the region. Combined with the existing environmental statistics database and the results of pollution source census and other information, a list of pollutant sources with priority pollutant emissions in the study area was obtained.
3 Results and discussion
3.1 Primary screening of industrial priority pollutants in Taihu Lake Basin
For the Zhejiang area of Taihu Lake Basin studied in this study, the blacklist of priority pollutants in China’s water, Surface Water Environmental Quality Standards (GB 3838–2002) and wastewater discharge standards of paper, printing and dyeing, tannery, electroplating, pharmaceutical, lead battery and other industries are used as benchmarks, and then refer to relevant pollutant research literature and reports, a total of 78 priority pollutants in 34 categories are initially identified, covering conventional pollutants, persistent organic pollutants, emerging pollutants, volatile organic pollutants and inorganic toxic hazardous pollutants, as shown in Supplementary Table S3.
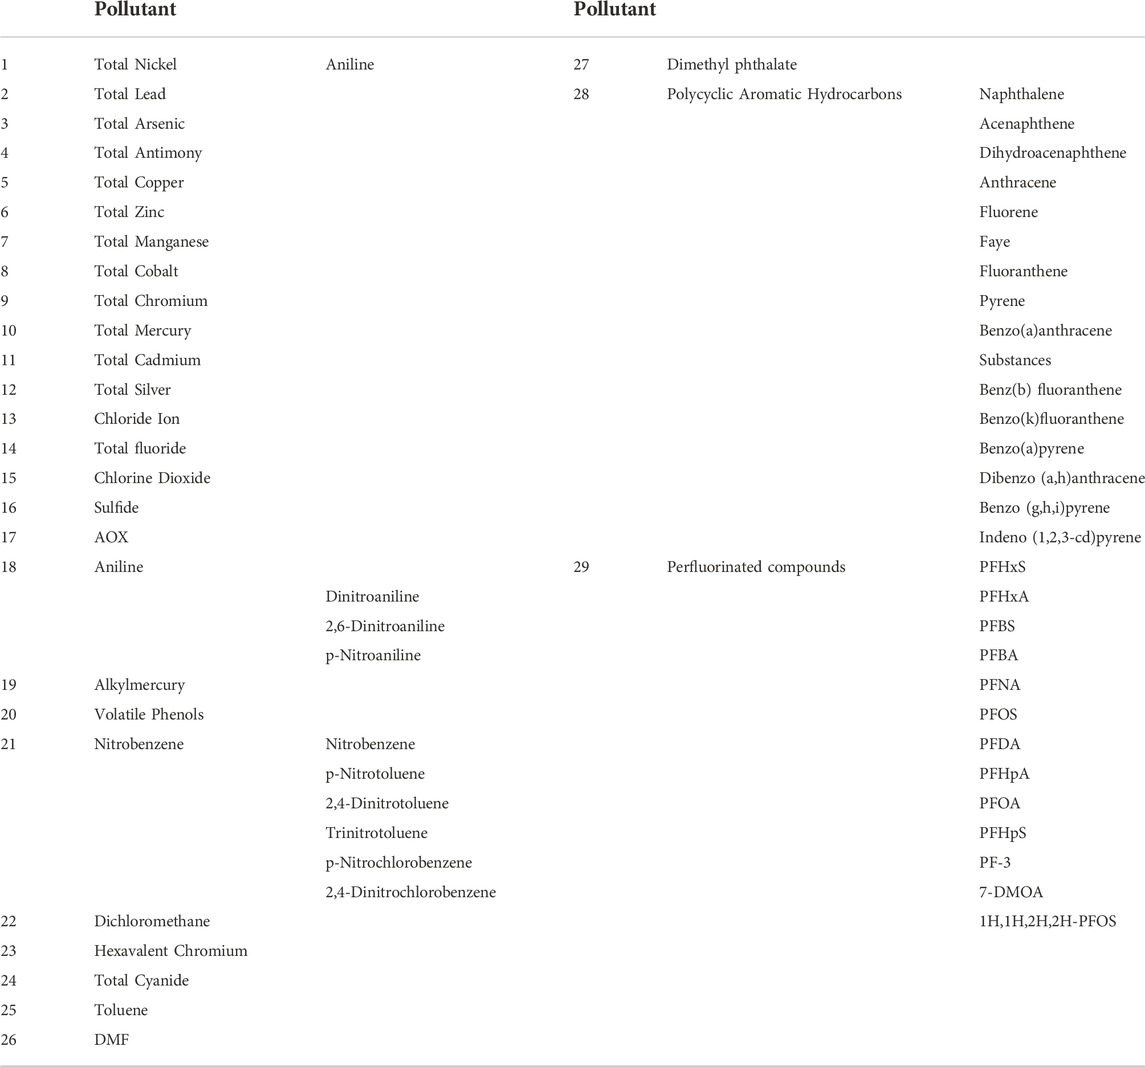
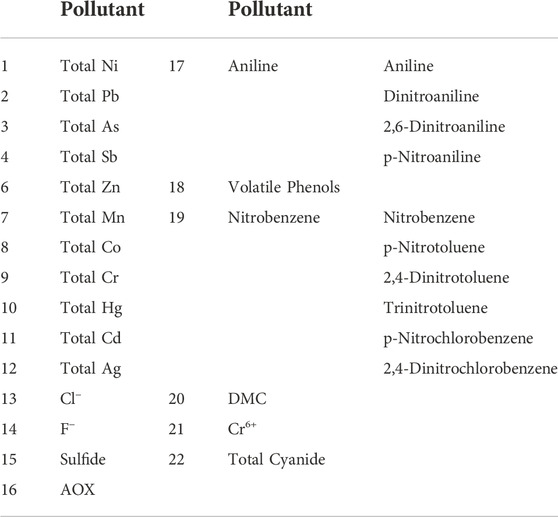
Seven conventional pollutants with lower environmental risk were excluded (including COD, NH4-N, TN, TP, petroleum, animal and vegetable oils, TOC) and the preliminary screening list of priority control pollutants was obtained as follows (Table 1).
3.2 Re-screening of industrial priority pollutants
The water sample monitoring results of the priority control pollutants in Table 1 are shown in Supplementary Table S4. The mean concentrations and detection rates of the detected pollutants are shown in Figure 3. As shown in Figure 3, total Ni, total Pb, total As, total Sb, total Cu, total Zn, total Mn, total Co, total Cr, total Hg, Cl−, fluoride, sulfide, AOX and aniline were detected in all regions. Total Cd, total Ag, volatile phenols, nitrobenzene, DMC, Cr6+ and total cyanide were detected in some areas, and the detection rates were 23.01%, 23.01%, 30.77%, 38.46%, 69.23%, 84.62% and 7.69%, respectively. The rest of the pollutants in Supplementary Table S4 were below the detection limit and recorded as non-detect.
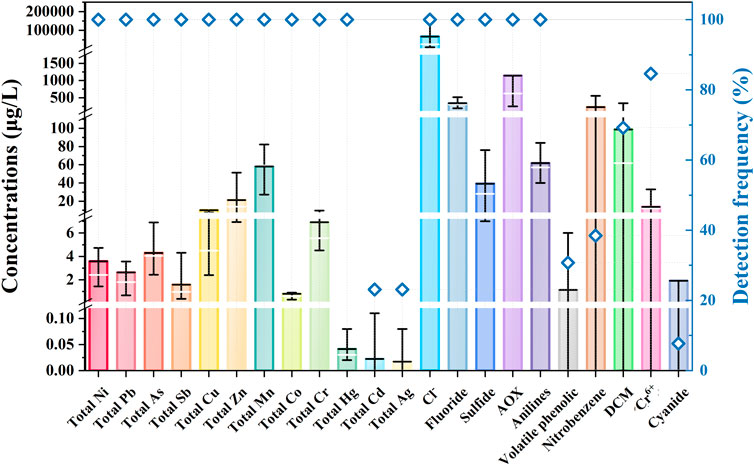
FIGURE 3. The concentration (left Y-axis) and detection frequency (right Y-axis) of the detected pollutants in 13 regions.
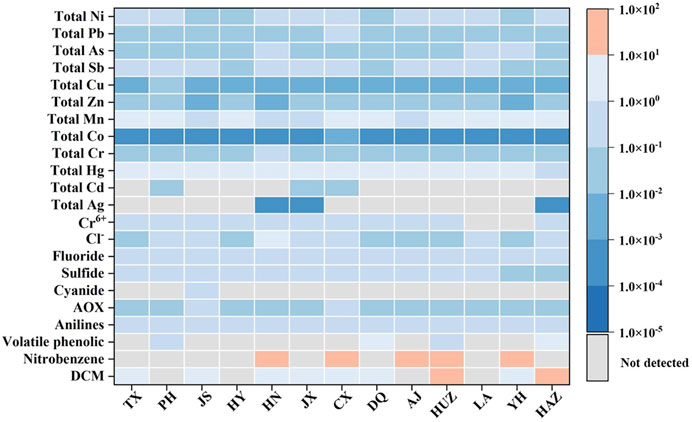
As shown in Figure 4, the data in the heat map indicate the standing-reaching quotient of each pollutant in surface water, ≥ 1 means exceedance, and <1 means meet the standard. The results show that some of the study regions’ levels of nitrobenzene, DCM, volatile phenolic, Cl−, and total Mn exceeded the surface water environmental quality standards, with DCM levels exceeding the standards in 69.23% of the regions. The detected pollutants were considered to be at risk and were further rescreened as priority control pollutants, including total Ni, total Pb, total As, total Sb, total Cu, total Ag, Cl−, F−, sulfide, AOX, aniline, volatile phenols and other 22 types of pollutants (Table 2).
3.3 Environmental risk assessment and assignment of regional industral priority pollutant
For the 22 types of pollutants in Table 2 of the re-screening list of priority control pollutants in Taihu Lake Basin, the evaluation was carried out from HH-E, WE-E and E-E in accordance with the environmental risk assessment method of priority control pollutants in Section 2.3.3, and assigned points for accounting. The accounting results are detailed in Supplementary Table S5–S8.
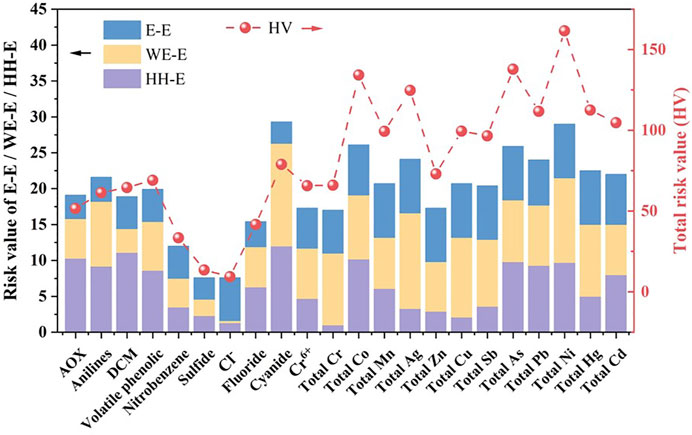
Despite the significant differences in human health, environmental health and exposure factors for each pollutant, the total risk value calculated by considering the three factors together gives a better indication of the true risk level. The scoring calculation results show that the risk of Ni was the highest, followed by As, Co and Ag, thus the local contamination with heavy metals was still predominant, while the risk from trace organic pollutants was relatively low (Figure 5).
According to the actual emissions of each pollutant in 13 regions in Taihu Lake Basin (calculated by using environmental statistics and pollutant discharge coefficients), the RWF of pollutants in water was calculated, and then the wHV of pollutants in each region was obtained, and the accounting results of each region are detailed in Supplementary Table S9. The pollutants with the highest wHV are DMC in HAZ region; total Ni in LA region, AJ and CX regions; aniline in YH, DQ, JS and TX regions; total Sb in HUZ, HN and JX regions; and AOX in HY and PH regions, respectively.
3.4 Equivalent risk value accounting of the regional priority pollutants
With the method of risk benchmark values and risk value equivalents described in 2.3.4, the regional environmental risk background values of benchmark pollutants were calculated by taking the environmental limit value of total Hg in surface water (0.0001 mg/L) and referring to the total amount of surface water in 13 administrative areas of Taihu Lake Basin in the Water Resources Bulletin of Zhejiang Province in 2020. The environmental risk background values of each region are shown in Supplementary Table S10.
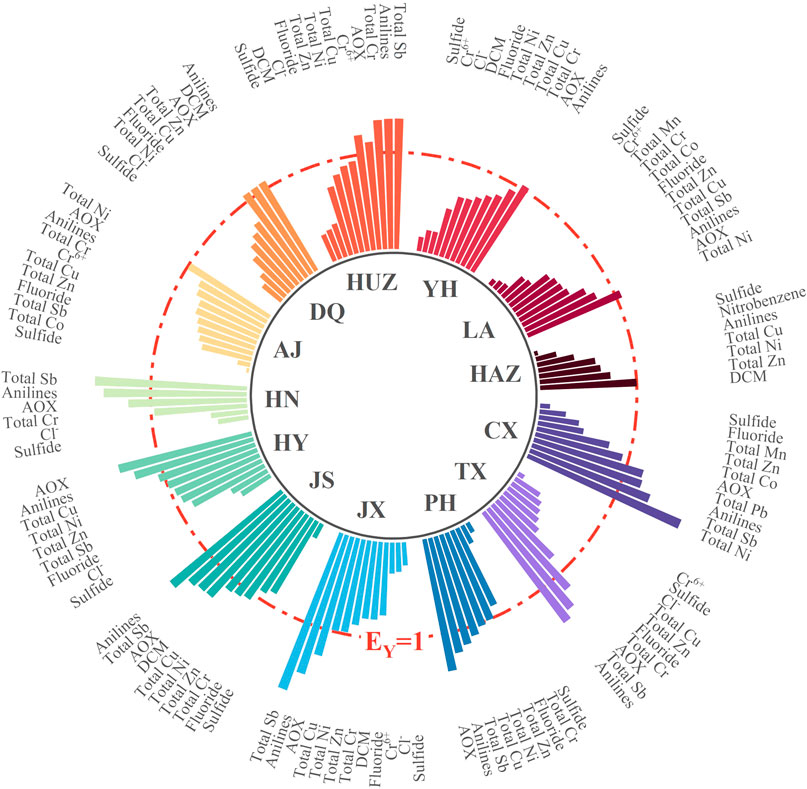
The pollutants with EY ≥1 are listed as priority control pollutants, and the list of industrial priority pollutants in each regions is shown in Figure 6 and Supplementary Table S11. It shows that the three pollutants with the highest frequency in the priority control pollutants in 13 administrative regions in Taihu Lake Basin were aniline, AOX and total antimony, which distributed in 10 regions, 8 regions and 7 regions, respectively. JS region requires the most types of the priority control pollutants, including aniline, total Sb, AOX, DCM, total Cu, total Ni, total Zn. The next is HUZ region whose priority control pollutants include total Sb, aniline, total Cr, AOX, and Cr6+.
The industries with the highest wastewater discharge in Taihu Lake Basin are chemical fiber weaving and processing, chemical fiber fabric dyeing and paper manufacturing industry, which account for 38.5%, 22.5% and 18.7% of the total regional industrial source wastewater discharge, respectively. It can be seen that the regional industrial priority pollutant categories screened by this method are in line with the actual emission status of regional industrial sources.
3.5 List of regional key industrial enterprises
Based on the regional priority control pollutant list, combined with the environmental statistics database and the results of the Second National Pollution Source Census and other information, the priority pollutant emission sources were listed to be priority-controlled in each region. The number of key industrial enterprises in each region is shown in Figure 7 and Supplementary Table S12. A total of 376 priority control discharge enterprises were identified retroactively. From the data, HUZ region has the highest number of key industrial enterprises with 178, followed by JX region 117) and TX region (107), which should be targeted to control to minimize the environmental risks caused by their emission of pollutants.
It is noteworthy that nitrobenzene was not included in the regional priority pollutants in each region after calculating the pollutant emissions from industrial enterprises, which could be due to the fact that the enterprises we investigated did not cover all the sources of nitrobenzene emissions, or there were other potential sources of nitrobenzene besides industrial sources. The number of enterprises involved in the research area of this study was very large, therefore, according to the annual report of environmental statistics, the six industries with the largest amount of wastewater discharge in Zhejiang Province were selected for screening (paper making, textile, tanning, electroplating, medicine, and battery industry). Among the six industries, only the medicine industry has included nitrobenzene in its regulation (Supplementary Table S3). Nitrobenzene is an essential raw material for producing dyes, resins, explosives, pesticides and so on (Min, et al., 2022), so it was likely that nitrobenzene comes from other industries with small wastewater discharge but high nitrobenzene content (such as petrochemical industry, etc.), or from agricultural pollution sources. Similarly, pollutants such as DCM were not classified as a priority pollutant in some exceedance regions. These pollutants require in-depth local traceability in the future study, for example, from raw material production and other directions to identify the source of pollution.
4 Conclusion
The five-step method proposed in this study can successfully establish a regional industrial priority pollutant discharge list in the surface water environment of 13 administrative regions of Taihu Lake Basin. Twenty-two types of industrial priority pollutants were screened out from the initial list of 78 water pollutants in regional water bodies, and 376 priority control discharge enterprises were confirmed on this basis, which provides theoretical guidance for the regional water pollution management and control.
This method takes into account the toxicity, persistence, bioaccumulation and uses the risk value assignment method to quantitatively screen the priority control pollutants in the study area based on risk value equivalents. Given the regional differences in surface water environmental pollution conditions, this study’s method can establish a localized industrial priority control pollutant list, which is more conducive to the formation of a differentiated regional priority control pollutant water quality benchmark, with the ultimate goal of protecting aquatic organisms and human health.
Data availability statement
The original contributions presented in the study are included in the article/Supplementary Material, further inquiries can be directed to the corresponding author.
Author contributions
YK: Conceptualization, Methodology, Writing- Reviewing and Editing. YC: Investigation, Validation, Writing—Reviewing and Editing. MZ: Investigation, Formal analysis, Writing, and Editing. YX: Investigation, Formal analysis. HF: Methodology, Supervision, Funding acquisition. RC: Formal analysis, Visualization, Writing—Reviewing and Editing, Supervision.
Funding
This study was supported by the Open Funding of Zhejiang Key Laboratory of Ecological and Environmental Big Data (No. EEBD-2022–03).
Conflict of interest
The authors declare that the research was conducted in the absence of any commercial or financial relationships that could be construed as a potential conflict of interest.
Publisher’s note
All claims expressed in this article are solely those of the authors and do not necessarily represent those of their affiliated organizations, or those of the publisher, the editors and the reviewers. Any product that may be evaluated in this article, or claim that may be made by its manufacturer, is not guaranteed or endorsed by the publisher.
Supplementary material
The Supplementary Material for this article can be found online at: https://www.frontiersin.org/articles/10.3389/fenvs.2022.1077430/full#supplementary-material
Abbreviations
AOX, Absorbable organic halogen; BCF, Bioconcentration factor; DCM, Dichloromethane; DMF, Dimethylformamide; EY, Risk value equivalent of pollutant Y; E-E, Exposure effects; HH-E, Human health effects; HV, Total risk value; HVOR, Human acute oral effects; HVINH, Human acute inhalation toxicity effects; HVCAR, Carcinogenicity effects; HVother, Other specific effects; HVMAM, Acute oral effects for terrestrial organisms; HVFA, Acute toxicity effects for fish; HVFC, Chronic toxicity effects for fish; HVHYD, Hydrolytic degradation; HVBOD, Biological oxygen demand; IARC, International Agency for Research on Cancer; Kow, Octanol water partition coefficient; LC50, Lethal Concentration 50%; LD50, Lethal Dose 50%; NOEL, No observable effect level; RWF, Emission weight of pollutants in water; SAR, Safety Assessment Report; USEPA, United States Environmental Protection Agency; WE-E, Water environmental effects; wHV, Risk value based on the discharge; wHVX, Y, Risk value of pollutant Y in area X based on the discharge; wHVX, b, Environmental risk background value of the benchmark pollutant in area X.
References
Binetin, S., and Devillers, J. (1994). Qsar for organic chemical sorption in soils and sediments. Chemosphere 28 (6), 1171–1188. doi:10.1016/0045-6535(94)90335-2
Bu, Q. W., Wang, D. H., and Wang, Z. J. (2016). A risk-based screening approach for priority organic contaminants at the watershed scale: Method development. Asian J. Ecotoxicol. 11 (1), 61–69. doi:10.7524/AJE.1673-5897.20150415007
Chen, R. Y., Li, G. W., He, Y. T., Pan, L. L., Yu, Y., and Shi, B. Y. (2021). Field study on the transportation characteristics of PFASs from water source to tap water. Water Res. 198, 117162. doi:10.1016/j.watres.2021.117162
Cui, X. Y., Ding, W. J., Chai, T. Y., and Zhang, F. (2010). Comparative study on the ranking of environmental and health risks of chemical pollutants at home and abroad. Beijing: Science Press.
Cui, L., Li, J., Gao, X., Tian, B., and Liu, Z. (2022). Human health ambient water quality criteria for 13 heavy metals and health risk assessment in Taihu Lake. Front. Environ. Sci. Eng 16, 4. doi:10.1007/s11783-021-1475-6
Dai, X. L., Qian, P. Q., Ye, L., and Song, T. (2016). Changes in nitrogen and phosphorus concentrations in lake Taihu, 1985-2015. J. Lake Sci. 28 (5), 935–943. doi:10.18307/2016.0502
Du, Y. J., Xu, X., Liu, Q. Z., Bai, L., Hang, K. X., and Wang, D. H. (2022). Identification of organic pollutants with potential ecological and health risks in aquatic environments: Progress and challenges. Sci. Total Environ. 806 (3), 150691. doi:10.1016/j.scitotenv.2021.150691
EC (2011). Guidance Document No. 27. Technical Guidance For Deriving Environmental Quality Standards. Brussels: European Communities.
Fan, W., Zhou, J. L., and Zeng, Y. Y. (2016). Research progress on screening methods for priority pollutants for control of water environment. Ground Water 38 (3), 94–96.
Gao, H. L., Cheng, H. F., Zhan, M. H., and Wang, B. Y. (2019). Research progress of aquatic plants in Taihu Lake. Wetl. Sci. 17 (1), 11–17. doi:10.13248/j.cnki.wetlandsci.2019.01.002
Guo, Q., Wei, D., Wang, F., Chen, M., and Du, Y. (2021). A novel risk score-based prioritization method for pollutants in reclaimed water. Sci. Total Environ. 795, 148833. doi:10.1016/j.scitotenv.2021.148833
He, W., Qin, N., Kong, X. Z., Liu, W. X., He, Q. S., Wang, Q. M., et al. (2014). Water quality benchmarking (wqb) and priority control screening (pcs) of persistent toxic substances (ptss) in China: Necessity, method and a case study. Sci. Total Environ. 472, 1108–1120. doi:10.1016/j.scitotenv.2013.11.119
Huang, T. B., Chen, Y., Lu, J. A., Xia, T., and Xu, N. (2022). Evaluation of heavy metal pollution characteristics in sediments of Taihu Lake basin. J. Nanjing tech Univ. Nat. Sci. Ed. 44 (4), 443–449.
Karahan Ozgun, O., Basak, B., Eropak, C., Abat, S., Kirim, G., Girgin, E., et al. (2016). Prioritization methodology of dangerous substances for water quality monitoring with scarce data. Clean. Technol. Environ. Policy 19 (1), 105–122. doi:10.1007/s10098-016-1194-z
Kudlak, B., Tsakovski, S., Simeonov, V., Sagajdakow, A., Wolska, L., and Namiesnik, J. (2014). Ranking of ecotoxisity tests for underground water assessment using the Hasse diagram technique. Chemosphere 95, 17–23. doi:10.1016/j.chemosphere.2013.05.049
Li, Q. F., Lv, Y. L., Wang, P., and Zhang, Y. Q. (2018). Selection of priority contaminants in a watershed using risk ranking methodology. Environ. Sci. 39 (10), 4472–4478. doi:10.13227/j.hjkx.201802135
Li, Y., Wang, X. P., and Gong, P. (2021). Combined risk assessment method based on spatial interaction: A case for polycyclic aromatic hydrocarbons and heavy metals in Taihu Lake sediments. J. Clean. Prod. 328, 129590. doi:10.1016/j.jclepro.2021.129590
Meng, C., Qiang, W., Shan, G., Zhu, L., Yang, L., and Liu, M. (2018). Occurrence, partitioning and bioaccumulation of emerging and legacy per- andpolyfluoroalkyl substances in Taihu Lake, China. Science of the TotalEnvironment 634, 251–259. doi:10.1016/j.scitotenv.2018.03.301
Min, X. B., Chu, C., Luo, Z. H., Ma, J. Y., Fu, Y. F., Wei, Z. S., et al. (2022). Transformation of phenol and nitrobenzene by superoxide radicals: Kinetics and mechanisms. Chem. Eng. J. 442, 136134. doi:10.1016/j.cej.2022.136134
Pei, S. W., Zhou, J. L., and Liu, Z. T. (2013). Research progress on screening of environment priority pollutants. J. Environ. Eng. Technol. 3 (4), 363–368.
Swanson, M. B., Davis, G. A., Kincaid, L. E., Schultz, T. W., Bartmess, J. E., Jones, S. L., et al. (1997). A screening method for ranking and scoring chemicals by potential human health and environmental impacts. Environ. Toxicol. Chem. 16, 372–383. doi:10.1002/etc.5620160237
Tobiszewski, M., and Namieśnik, J. (2015). Scoring of solvents used in analytical laboratories by their toxicological and exposure hazards. Ecotoxicol. Environ. Saf. 120, 169–173. doi:10.1016/j.ecoenv.2015.05.043
Tsakovski, S., Astel, A., and Simeonov, V. (2010). Assessment of the water quality of a river catchment by chemometric expertise. J. Chemom. 24 (11-12), 694–702. doi:10.1002/cem.1333
USEPA (1994). Chemical hazard evaluation management strategies: A method for ranking and scoring chemicals by potential human health and environmental impacts. Washington: United States Environmental Protection Agency.
Wang, D. C., Xie, W. P., and Cao, J. (2015). Characterization of nitrogen and phosphorus pollution in typical rivers entering Taihu Lake and analysis of pollution sources. Pollut. Control Technol. 28 (2), 71–75.
Xu, L., Liu, S., and Tang, Y. (2022). Long-term dechlorination of polychlorinated biphenyls (PCBs) in Taihu Lake sediment microcosms: Identification of new pathways, PCB-driven shifts of microbial communities, and insights into dechlorination potential. Environmental Science and Technology 56 (2), 938–950. doi:10.1021/acs.est.1c06057
Zhang, X. M., Li, B., Liu, R. X., Zeng, P., Song, Y. H., and Yang, Y. Z. (2015). Identification of priority pollutants in river polluted by effluents from printing and dyeing enterprises in taizihe watershed. Chin. J. Environ. Eng. 9 (4), 2007–2013.
Zhou, l. J., Zhang, Q., and Shi, L. L. (2019). The formulation methods of priority water pollutants and environmental quality standards in the Eu and their reference significance to China. Environ. Monit. Forewarning 11 (1), 1–9.
Keywords: environmental management, regionalization, industrial sources, priority pollutants, risk assessment
Citation: Kang Y, Chen Y, Zhou M, Xu Y, Feng H and Chen R (2022) Identification of regional industrial priority pollutants in surface water: A field study in Taihu Lake Basin. Front. Environ. Sci. 10:1077430. doi: 10.3389/fenvs.2022.1077430
Received: 23 October 2022; Accepted: 08 November 2022;
Published: 22 November 2022.
Edited by:
Jun Wu, Harbin Engineering University, ChinaReviewed by:
Xueci Xing, Guangzhou University, ChinaElena Neverova-Dziopak, AGH University of Science and Technology, Poland
Copyright © 2022 Kang, Chen, Zhou, Xu, Feng and Chen. This is an open-access article distributed under the terms of the Creative Commons Attribution License (CC BY). The use, distribution or reproduction in other forums is permitted, provided the original author(s) and the copyright owner(s) are credited and that the original publication in this journal is cited, in accordance with accepted academic practice. No use, distribution or reproduction is permitted which does not comply with these terms.
*Correspondence: Ruya Chen, Y2hlbnJ1eWEyMDIxQDE2My5jb20=
 Ying Kang1,2,3
 Ruya Chen