- 1School of Economics and Management, Chongqing Jiaotong University, Chongqing, China
- 2School of General Education, Guangzhou College of Technology and Business, Guangzhou, China
- 3School of Mathematics and Statistics, Chongqing Jiaotong University, Chongqing, China
Supply chain emissions reduction is an important way to promote the development of a low-carbon economy and address climate challenges. Although the scale of livestream shopping has demonstrated unprecedented growth globally, especially since the COVID-19 outbreak, livestreaming supply chains have also contributed significantly to carbon emissions. Currently, optimisation models for the low-carbon governance of livestreaming supply chains are relatively lacking. To address the issue of carbon emission reduction in livestreaming supply chains, this study paper proposes three low-carbon governance decision-making models based on environmental and operating costs to compare which governance model is optimal. The most suitable decision result for the policymaker and supply chain is both cost-effective and environmentally successful under the model considering carbon tax and carbon trade. The results show that 1) governance based only on carbon tax and collaborative operation will decrease the total cost of the livestreaming supply chain but increase the environmental cost. 2) Governance based only on carbon trading and collaborative operation will increase the total cost of the livestreaming supply chain, while the environmental cost will not change. 3) Under governance that combines carbon tax and carbon trading, collaborative operations can effectively reduce both the total cost and the environmental cost of livestreaming supply chains. Theoretically, our study enriches the research on the low-carbon governance of livestreaming supply chains. Moreover, the research results provide useful insights into the formulation of a low-carbon policy for livestreaming supply chains.
1 Introduction
Livestreaming sales are developing rapidly in China, and the expansion of the logistics of upstream and downstream enterprises in the livestreaming supply chain has increased carbon emissions (Fangqing et al., 2021). Livestreaming sales have surpassed other forms of sales in an increasing number of countries (Xu et al., 2018; Twitch tracker, 2020). The COVID-19 pandemic has changed people’s consumption habits, further promoting the rapid development of live streaming sales. Livestream shopping has become a part of life and has taken the Chinese market by storm. For example, in 2020, there were approximately 617 million livestream users in China, representing a penetration rate of 62.4% among Internet users (Pwc’s consumer insights survey 2021 China report, Price Waterhouse Coopers, 2021). The rapid development of livestreaming has also promoted an increase in logistics activities in livestreaming supply chains. Livestreaming supply chains consume a large amount of energy for logistics, packaging, and storage, resulting in a large amount of carbon emissions that have an impact on the climate and environment (Lin, 2019). In 2020, the volume of express parcels reached 83.36 billion pieces, 80% of which serve e-commerce businesses such as livestreaming (Qian and Cai, 2020). During the process of commodity trading, goods circulation, and distribution services, such as transportation and freight packaging, livestreaming supply chains generate large amounts of carbon emissions, which negatively impact the climate and environment (Zhu et al., 2020). For example, in 2019, the carbon emissions from e-commerce, such as livestreaming in logistics, packaging, and storage, were as high as 53, 226, 449 tons, representing approximately 1% of the total carbon emissions in 2019. Carbon dioxide is a major greenhouse gas that causes global warming (Ripple et al., 2020). Climate change would have disastrous consequences for the global environment and human society if the temperature rise exceeded 2°C (Intergovernmental Panel on Climate Change (IPCC), 2013; Leemans and Vellinga, 2017). Therefore, the reduction of carbon emissions in the livestreaming supply chains is of great significance to China’s carbon peaking and global climate governance.
The rapid development of livestreaming and low-carbon supply chains has attracted the attention of scholars. Livestreaming sales are free from the constraints of time, space, and “untouchability” (Zhang et al., 2017; Ang et al., 2018). Real-time interaction between anchors and consumers can effectively improve consumers’ perceived value of products (Bhaskaran and Krishnan, 2009; Lu et al., 2016; Wongkitrungrueng et al., 2020; Sun et al., 2021). In 2020, owing to the COVID-19 pandemic, China’s livestreaming sales showed explosive growth, with the turnover of live streaming exceeding one trillion yuan. According to the theoretical framework of Stimulus–Organism–Response, scholars have confirmed that social presence, trust, flow experience, and streamer characteristic improve consumers’ willingness to buy via live streaming (Ha and Perks, 2005; Lu et al., 2016; Schouten et al., 2020). Some scholars have studied the influencing factors, operation mode and profit mode of livestreaming using empirical methods and cases (Pu et al., 2020; Zhang et al., 2020). Other scholars have studied the introduction strategy, price strategy, operation coordination strategy, and revenue sharing strategy in livestreaming supply chains using the model method (Zhu and Liu, 2021; Wang and Zhang, 2022). The goal of carbon neutralisation has attracted great attention from scholars because frequent climate change has a severe impact not only on human survival but also on their wellbeing and development, and no country is excluded from these effects (Cramer et al., 2018; Umar et al., 2021a; Umar et al., 2021b). To curb increase in carbon emissions, governments have tried different measures such as imposing carbon taxes, promoting clean energy, and shutting down low-capacity and energy-intensive enterprises. To achieve the goal of carbon peaking by 2030, the Chinese government has actively promoted carbon labelling and energy consumption labelling to promote the reduction of emissions by enterprises and guide consumers to choose low-carbon products. Concepts such as “conserve energy and reduce emissions”, “climate change”, and “low-carbon economy”, advocated by the 2009 Copenhagen Conference, have had a profound impact on organisations and individuals, which has changed the behaviour of consumers and enterprises (James 1996). The awakening of global low-carbon consciousness has gradually penetrated all supply chain links. Low-carbon supply chain research has achieved fruitful results in the following two aspects: operational decision making of a single enterprise in a low-carbon supply chain (Hua et al., 2011; Du et al., 2016) and low-carbon supply chain decision making under a single channel or multiple channels (Ji et al., 2017; Xu et al., 2018). However, to the best of our knowledge, there is still a lack of research on optimal low-carbon governance models based on multi-scenario case studies for livestreaming supply chains.
Previous studies have suggested that it is difficult to effectively reduce carbon emissions through the efforts of a single company in a supply chain (Liu et al., 2020). Under the condition of a market economy, carbon emissions can be reduced only through the collaboration of upstream and downstream companies in the supply chain, and the goal of maximising economic and social benefits can be achieved (Omri et al., 2021). Therefore, it is strategic and imperative to reduce carbon emissions in supply chains through collaborative regulation (Jabbour et al., 2015). This study develops a mathematical model of the total cost of a live streaming supply chain under collaborative operation, which includes operating and environmental costs. By comparing the environmental cost and total cost under the three governance scenarios, it can be concluded that the governance model is the optimal low-carbon governance model for livestreaming supply chains. Unlike the existing literature, the main contributions of this study are as follows. First, in addition to considering carbon trading prices and carbon taxes, the manufacturer’s supply speeds are considered in the manufacturer and livestreaming retailer operating costs, which have not usually been involved in prior studies. Second, there are few studies on the increase in carbon emissions caused by the rapid development of livestreaming supply chains. This study focuses on the low-carbon governance of livestreaming supply chains based on multiple scenarios for the first time, which is different from the previous literature on optimal operational decisions of live streaming supply chain members. Third, a comparative analysis of the three governance scenarios in this study provides important theoretical support for governments to promote low-carbon development of livestreaming supply chains and help firms optimise their operations under various scenarios.
The remainder of this paper is organised as follows. The next section presents a literature review. Section 3 presents the model. Section 4 is a case study and the results. The discussion and policy implication, sensitivity analysis, and conclusion are presented in Sections 5–7.
2 Literature review
This study focuses on optimising the low-carbon governance model of livestreaming supply chains. The literature review in this section includes two parts: Live streaming sales and low-carbon governance of supply chains.
2.1 Live streaming sales
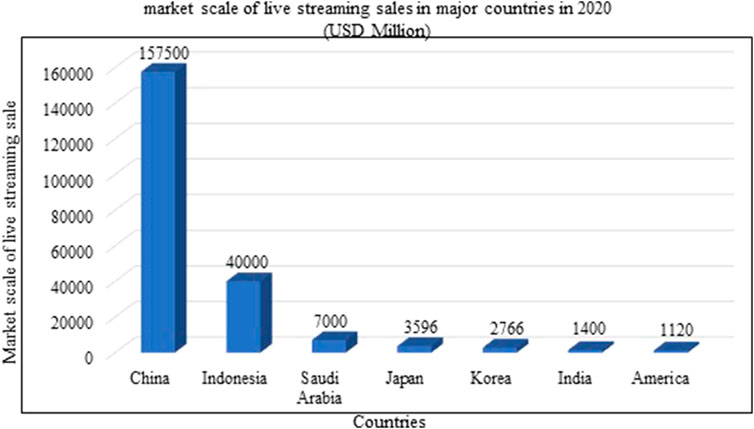
Over the past 3 years, livestreaming sales have become the fastest growing new business model globally, especially in developing countries (Zheng et al., 2022). China has ushered a new era of livestreaming sale models in the world, as Twitch stated that China’s live streaming market was at “another level”, reaching 157.5 billion, and was growing more aggressively than the rest of the world (Figure 1) (China Daily 2020; Li et al., 2020; Post, 2020; Statista 2021a; Statista 2021b; EcommerceDB 2021; Idia brand equity foundation, 2021; Paypal, 2021; Sina Business Headlines 2021).
The literature on livestreaming sales has mainly adopted two methods: modelling and empirical methods. Studies using the empirical method mainly consider consumer behaviour, whereas those using the modelling method mainly consider operational decision making. In terms of empirical research methods, with the worldwide popularity of livestreaming sales, an increasing number of scholars have studied the psychological characteristics, motivation, and behaviour of consumers during livestreaming (Hilvert-Bruce and Neill, 2018; Li et al., 2021; Wang B, 2021; Wang Y, 2021; Chen et al., 2022). Sun et al. (2019) studied how livestreaming affects customers’ purchase intentions from the perspective of IT affordability. Ang et al. (2018) investigated whether and how livestreaming as a firm-initiated digital social viewing strategy impacted customers’ consequential behavioural intentions. Most livestreaming platforms in China support gifting services, and relational identities can affect viewers’ gifting behaviour, which in turn affects consumer comments (Li et al., 2020; Wang and Li, 2020). Other studies have examined the roles, characteristics, and reasons for the rise in livestreaming sales. For example, Lim et al. (2020) explored the role of emotional engagement, wishful identification, and parasocial relationships during repeated viewing of livestreaming games from a social cognitive perspective. Livestreaming sales can facilitate consumers and sellers to interact in real-time using mobile devices such as smartphones during the dynamic livestreaming sales process (Wongkitrungrueng et al., 2020). De et al. (2020) found that livestreaming platforms such as Twitch, which facilitate participatory online communities as an integral part of game culture, are one of the reasons for the increase in the number of livestreaming platforms.
In terms of modelling methods, some studies have examined the decision-making problem of livestreaming sale enterprises (Mao et al., 2022; Yang et al., 2022). With the continuous development of livestream shopping, some studies have conducted research on the expansion and application of livestreaming. With the large growth in the demand for live streaming services on the Internet, video-on-demand is more sensitive to jitter, variations in delay, and packet loss because they require higher-quality service requirements for live streaming. Santos et al. (2021) proposed a method that outperformed competing Active Queue Management algorithms to address network congestion problems. There is also literature focusing on the application of livestreaming in rural agriculture. Peng et al. (2021) studied farmers’ income from livestreaming sales with random rewards from the perspective of China’s rural revitalisation. Wang Z et al. (2021) explored the factors that impact the adoption intention of livestreaming on Chinese flower and seedling family farms.
These studies contribute to the exploration of the mechanisms by which livestreaming affects consumer behaviour and the decision making of livestreaming supply chain members. Shopping on livestreaming platforms has become very popular and has documented unparalleled growth worldwide. With the rapid development of livestreaming supply chains, it should also be noted that the increase in warehousing, transportation, distribution, and other activities of livestreaming supply chains leads to an increase in carbon emissions. For example, the expansion of livestreaming supply chains has driven the rapid growth of China’s express delivery business. In the past 10 years, the volume of express parcels has increased 36 times (Figure 2). Therefore, in addition to studying the impact of livestreaming on consumer behaviour and decision making of livestreaming supply chain members, it is necessary to study the low-carbon governance of livestreaming supply chains. However, there is a lack of research on low-carbon livestreaming supply chain governance using empirical or model methods. Literature examines low-carbon supply chains, which will be reviewed in the next section.
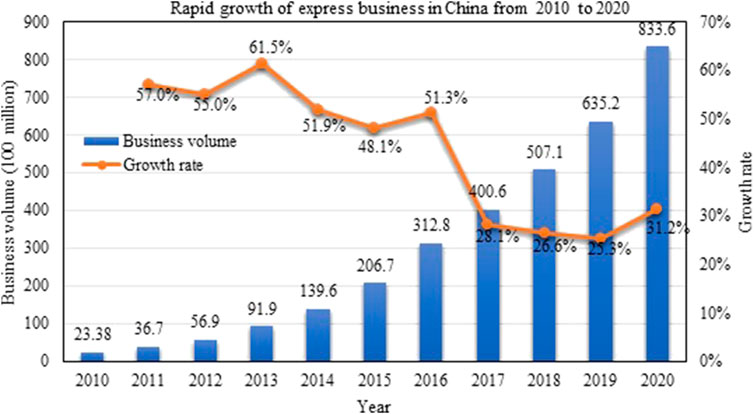
FIGURE 2. Business volume of express service enterprises in China from 2010 to 2020 (From National Bureau Statistics of China 2021).
2.2 Low-carbon supply chain
Many efforts have been made to investigate the design of government low-carbon policies such as carbon trade, carbon taxes, carbon quotas, and carbon emission allowances (Mayor and Tol, 2007; khanna et al., 2014; Nie et al., 2020; Zhang et al., 2022). With the advancement of a low-carbon economy, research on low-carbon supply chains has drawn considerable attention from scholars (Wu et al., 2022). Several studies have examined carbon trade policies. Laffont and Tirole. (1996) showed that carbon caps and trade policies could effectively reduce carbon emissions. Benjaafar and Elhafsi. (2012), who first introduced carbon emission constraints into the supply chain system, proposed, based on a study on the impact of carbon quota and trading policy on the optimal decision of participants, that enterprises can maximise their profits by increasing the number of orders. Du et al. (2013) proved the uniqueness of obtaining the optimal supply chain strategy by studying the production decisions of enterprises under a carbon quota and carbon trading mechanism. Other studies have focused on carbon quota and the trading mechanism by Hoen et al. (2014), Du et al. (2015), Du et al. (2013), and Xu et al. (2015), indicating that the carbon trading price and the low-carbon preference of consumers have an impact on optimal decision making and supply chain income. By developing a game model between low-carbon and ordinary products, Xia et al. (2020) analysed the impact of carbon trading on low-carbon supply chains under different production modes. China is actively taking responsibility for reducing emissions and is determinated to achieve its two climate goals (carbon peaking by 2030 and carbon neutrality by 2060) (Bai et al., 2020). From 2005 to 2020, China’s carbon emissions were among the highest in the world (Statistical review of world energy, 2021). China, as the largest carbon emitter, accounted for 30.66% of the total global carbon emissions in 2020 (Figure 3). China has legislated tightening low-carbon policies, and a carbon cap-and-trade mechanism, one of the most common carbon reduction policies, has been implemented in Beijing (Kang et al., 2019).
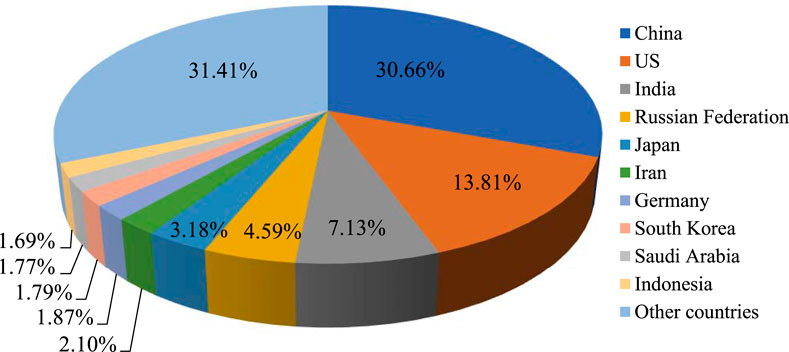
FIGURE 3. Proportion of carbon emissions of the major countries in the world (Date from BP Statistical Review of World Energy 2021. 70th edition).
Some studies have focused on the carbon tax and government subsidy policy of supply chains. Hao. (2015) examined the impact of carbon tax policies on the output and pricing decisions of competitive manufacturers in low-carbon supply chains against the background of the carbon tax imposed by the government. In addition to the carbon tax and government subsidy policies, carbon quota policies are also the subject of research. For example, Letmatheab and Balakrishnan. (2005) analysed the problems of optimal production and product structure by introducing carbon quota constraints into manufacturers. Recent research has also been extended to optimal procurement decisions in the low-carbon manufacturing industry. For example, Meng et al. (2021) proved that government subsidies reduce the price of green products and effectively promote the sales of green products. Huang et al. (2020) studied the issue of low-carbon government subsidies against the background that the government’s goal was to maximise social welfare. Liu et al. (2021) found that energy consumption and supply chain management have a nonlinear relationship with enterprise performance. Yu et al. (2022) examined pricing decisions and carbon emission reduction efforts for a two-chain system under carbon taxation. They found that the government can impose appropriate carbon taxes to encourage manufacturers to optimize the abatement rate of their products. Prior studies have designed different policies to achieve a low-carbon supply chain, and the impact of different policies on the decision making of supply chain members has also been studied separately. However, in supply chain practices, the government implements more than one low-carbon governance policy. Therefore, there is a lack of research on the optimal low-carbon governance model of supply chains based on multiple policy scenarios in the existing literature, especially on livestreaming supply chains.
In summary, although there is some literature investigating live streaming sales as well as low-carbon supply chains, research on the low-carbon governance of livestreaming supply chains, especially based on multiple scenario approaches, is still insufficient. Research on low-carbon supply chains focuses mainly on optimisation or decision making under a single policy. There are few low-carbon governance studies that compare carbon tax, carbon trading, and a combination of the two, and even fewer studies are based on livestreaming supply chains. Unlike previous literature, this article focuses not only on the rapidly growing livestreaming supply chain system but also on how to achieve optimal low carbon governance of the livestreaming supply chains. This study explores which low-carbon governance is optimal by analysing the three scenarios of carbon tax, carbon trading, and combining carbon tax and carbon trading, from the perspective of collaboration and non-collaboration between manufacturers and livestreaming retailers.
3 Model
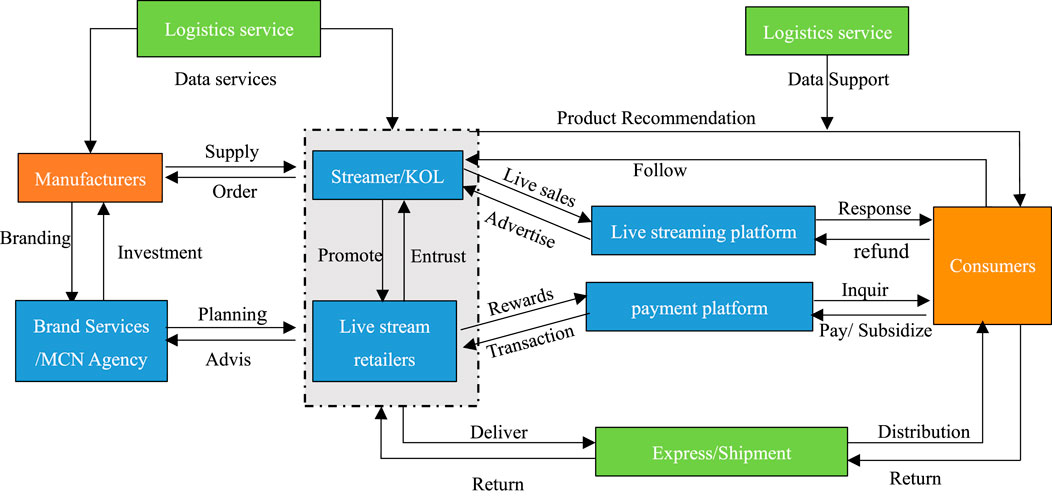
To investigate the optimal low-carbon governance of a livestreaming supply chain consisting of suppliers and livestreaming retailers, a novel model based on multiple scenarios is proposed. The objective of the model is to optimise the collaborative delivery speed between livestreaming retailers and suppliers to reduce carbon emission costs and total supply chain costs. A livestreaming supply chain is generally composed of the following four parts: manufacturers, livestreaming retailers, logistics services, and consumers (Figure 4). Rapid expansion of logistics and storage in livestreaming supply chains increase carbon emissions. If the speed at which livestreaming retailers purchase from manufacturers does not match the speed at which manufacturers supply to the livestreaming retailers, there will be an increase in carbon emissions caused by the transportation and storage of the product. Therefore, it is necessary to determine the optimal supply speed for reducing the cost of carbon emissions. Supply speed is a function of both the supply chain operating costs and carbon emissions. In the livestreaming supply chain model, the speed of supply is a function of operating costs as well as a function of carbon emissions. The speed of supply can be determined by the minimum operating cost or by the minimum carbon emission. When the supplier collaborates with the livestreaming retailer, an optimal supply speed is generated, which is between the two supply speeds determined above. Therefore, the purpose of this model is to reduce carbon emissions and the total cost of the supply chain by solving the optimal collaborative supply speed.
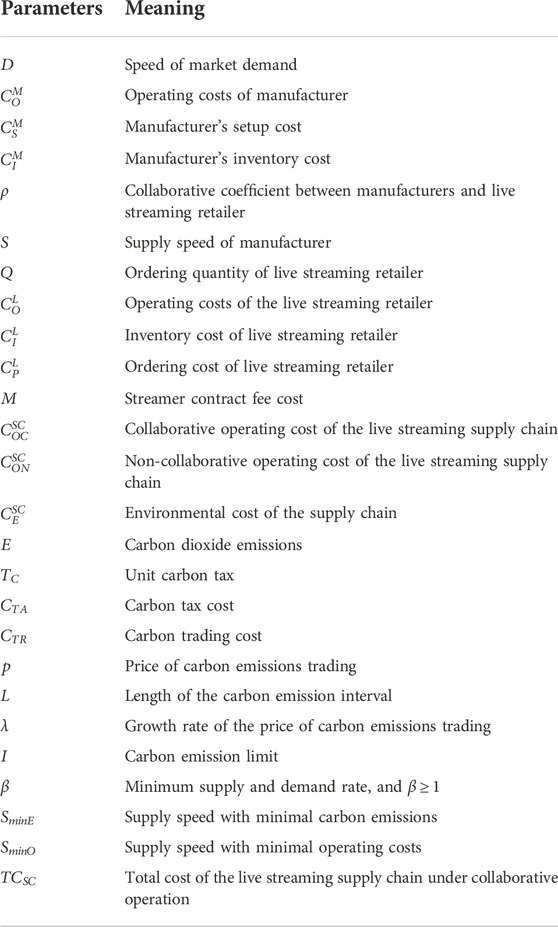
In a livestreaming supply chain, livestreaming retailers procure products from manufacturers and sell them to consumers through livestreaming sale platforms, such as Taobao and TikTok. Logistics provides transportation and distribution services in the procurement and sales processes. Fund settlement along the supply chain is provided by online payment platforms, such as Alipay. In this study, low-carbon governance of the supply chain includes three scenarios: carbon tax, carbon trading, and a combination of carbon tax and carbon trading. From the perspective of marketing goals, different sales models pursue the optimisation of cost, efficiency, and experience (Wang B, 2021). Therefore, a low-carbon livestreaming supply chain should achieve optimisation of cost, efficiency, and experience. Under the three scenarios, the total cost of a low-carbon livestreaming supply chain includes operating and environmental costs, of which environmental costs include carbon tax and carbon trading costs. Carbon tax and carbon trading costs depend on carbon emissions. The cost optimisation of the model in this study refers to determining a collaborative supply speed when the supplier collaborates with the livestreaming retailer to minimise the environmental cost or total cost of the supply chain. Efficiency refers to the lowest carbon emissions in the entire livestreaming supply chain, in which everyone should enjoy a green, low-carbon natural environment. Based on the enterprise case values, the environmental and total costs of the livestreaming supply chain under the three scenarios were compared to determine the optimal low-carbon governance model. The definitions of the variables related to the model are listed in Table 1.
Under the low-carbon governance model, the total cost of livestreaming supply chain includes environmental cost and operating cost, which is expressed as
Or
where
The manufacturer’s operating costs consist of inventory and setup costs. Referring to Glock et al., 2012, the manufacturer’s operating costs are expressed as follows:
The operating cost of a live streaming retailer includes ordering, inventory, and streamer contract fee costs. To attract consumers, livestreaming retailers usually hire celebrities as streamers and pay contract fees. According to El Saadany and Jaber. (2008), the operating costs of live streaming retailers are expressed as follows:
Therefore, the more specific operating cost of the live streaming supply chain is:
Because
Substituting Eq. 7 into Eq. 6, we obtain
From Eq. 8, the minimum operating cost of livestreaming supply chain
The non-collaborative operating cost of a livestreaming supply chain can be obtained based on Eqs. 1, 2 and Eq. 9 (Jaber et al., 2013).
The sum of the carbon tax cost and carbon trading cost is defined as the environmental cost, namely
It can be seen from Eq. 11 that a minimum carbon emission of the livestreaming supply chain
The carbon tax of the live streaming supply chain is expressed as
Based on the carbon emission reduction cost proposed by Ang et al. (2019), carbon trading cost is expressed as follows:
Therefore, the total cost of the live streaming supply chain under collaborative operation is
By substituting Eq. 8, and Eq. 12 into Eq. 14, we obtain
If only the operating costs of the supply chain are considered, then minimum supply speed is
If only carbon tax is considered, the supply speed with the minimum carbon emissions can be obtained by equating the first derivative of Eq. 11 to zero as follows:
Supply speed considering only the carbon tax or operating cost is not a collaborative supply speed. A collaborative supply speed can achieve optimal low-carbon governance of the livestreaming supply chain, which is the purpose of this research. According to Eqs. 16, 17, there are three possibilities for collaborative supply speed S* that consider both the operating cost and the carbon emission cost: Either equal to
Based on Eq. 8, supply chain operating costs are related to the value of
Let
4 Case study and result
According to data from the China Internet Network Information Center, as of June 2021, the number of live streaming users in China had reached 638 million, accounting for 63.1% of the total number of netizens. In 2020, the market size of live streaming e-commerce reached 1.05 trillion yuan, and it is expected to reach 2.3 trillion yuan in 2021. Therefore, the future development of live streaming e-commerce is very promising (China Internet Network Information Center, 2021; Pan 2021). Taobao, TikTok, and Kuaishou are the three largest livestreaming platforms in China, accounting for approximately 90% of the total market size for livestreaming (sohu.com, 2021). Many top streamers, such as Luo Yonghao, Liu Genghong, and New Oriental Education, have professional supply chain teams, including suppliers, logistics, and storage. These professional livestreaming teams achieve considerable gross merchandise volumes and increase carbon emissions by virtue of their professional supply chain operations and the popularity of streamers. Taking the Kuaishou livestreaming platform as an example, in 2020, there were 95 live streams with a gross merchandise volume of more than RMB 100 million (Table 2), the cumulative merchandise volume reached RMB 22.113 billion, and the express delivery volume reached 229 million (Pan 2021).

TABLE 2. Category distribution of Kuaishou livestreaming with gross merchandise volumes over RMB 0.1 billion.
According to data from the sales list of live streaming products on the TikTok livestreaming platform, Luo Yonghao, from a professional livestreaming supply chain team, sold these products through 33 livestreams on the TikTok livestreaming platform in 2020, which achieved a gross merchandise volume of RMB 1 billion. Among the sales list, the data on Luo Yonghao’s live streaming sales of beer produced by a beer manufacturer will be analysed as a reference for some parameters of the case study. Among the list, the data on Luo Yonghao’s live streaming sales of beer will be used as a reference for some parameters in this part of the case analysis. Therefore, we used the following parameter values:
4.1 Scenario 1
4.1.1 Governance of carbon tax
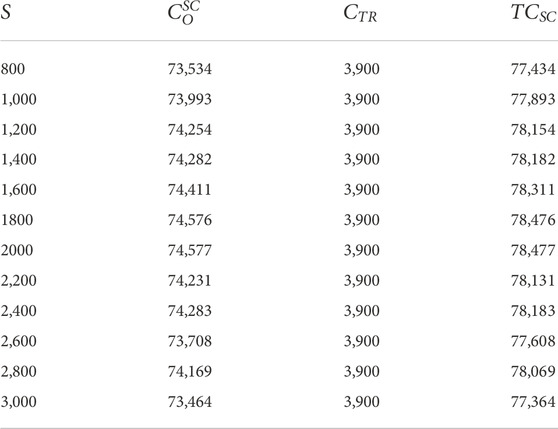
Under the governance of the carbon tax, the government levies only a carbon tax on member enterprises of the livestreaming supply chain based on their carbon emissions. According to the mathematical model and the given values, the total cost and environmental cost can be calculated under the coordination of supply speed and without coordination. According to Eqs. 8, 9, Eqs. 12, 13, the Simulink Matlab simulation module was used to obtain the following simulation results: collaborative supply speed
Supply speed of minimum carbon emissions
Under the governance of carbon tax, supply speed
4.2 Scenario 2
4.2.1 Governance of carbon trading
Carbon trading uses carbon emission right as the underlying asset. Based on the cap-and-trade principle, the government first grants companies a certain amount of carbon emission quota. If the amount exceeds this quota, companies must purchase the carbon quota in a shortage (Wang and Xu, 2018). Under carbon-trading governance, enterprises only need to bear the environmental cost of purchasing a carbon quota in a shortage. Under carbon trading governance, there is no carbon tax. According to Eq. 8, Eq. 10, Eq. 12, and Eq. 13, the Simulink simulation module of Matlab was used to obtain the following simulation results:
Collaborative supply speed
Supply speed of minimum carbon emission
Under the carbon-trading governance, supply speed
4.3 Scenario 3
4.3.1 Combined governance of carbon tax and carbon trading
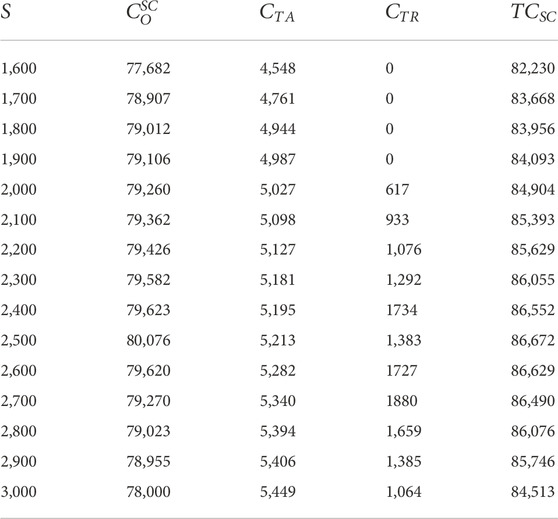
Under this governance model, the member enterprises of the livestreaming supply chain will not only be subject to carbon taxes, but also face carbon trading costs for carbon quotas in shortage. Under this combined governance model, the impact of the collaborative operation between the manufacturer and the livestreaming retailer on the cost of carbon emissions will be different from the separate governance model mentioned above. According to Eq. 8, Eq. 9, Eq. 10 Eq. 12, and Eq. 13, and the Simulink simulation module of Matlab was used to obtain the following simulation results:
Collaborative supply speed
Supply speed of minimum carbon emission
Under the governance of combining carbon tax and carbon trading, supply speed
5 Sensitivity analysis of the low-carbon governance model
In this section, we examine how the operating cost and total cost of the livestreaming supply chain change with the collaborative coefficient, supply speed, and order quantity in different scenarios. The scenario with the lowest total cost should be selected as the optimal low-carbon governance model for the livestreaming supply chain. We still used the following initial values:
First, to examine the impact of collaborative coefficient
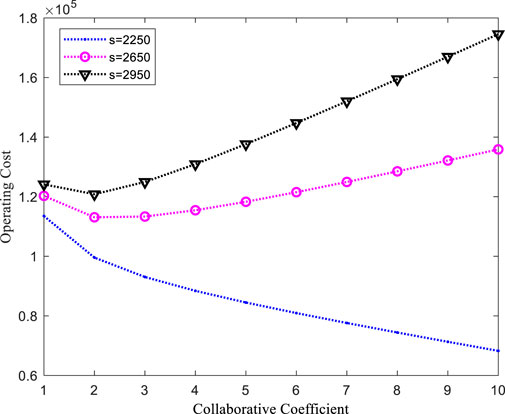
FIGURE 5. Operating costs with different supply speed changes with changing collaborative coefficients.
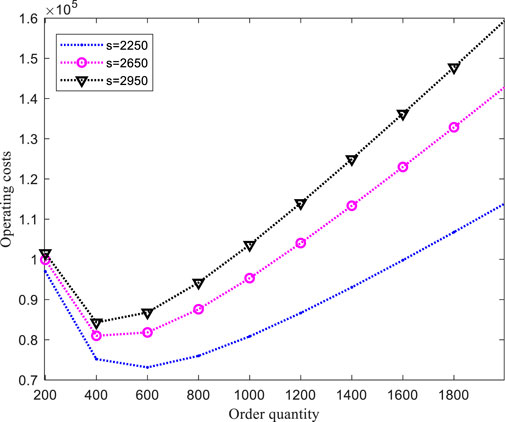
Next, to examine the impact of the ordering quantity of livestreaming retailer
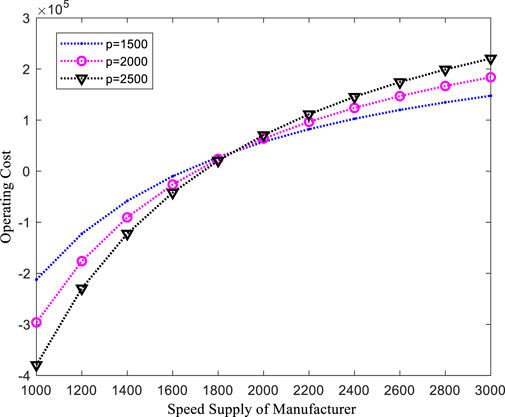
Third, different from the second case, the impact of the supply speed of manufacturer on the operating costs under different ordering quantities of livestreaming retailer was examined;
6 Discussion and policy implications
By comparing the simulation data results under the three scenarios, the impact of cooperative or non-cooperative operations between the manufacturer and live-streaming retailer on carbon emissions and carbon emission costs can be obtained.
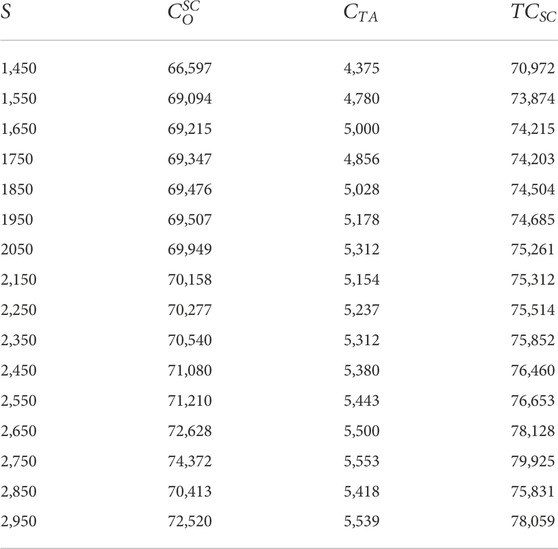
As shown in Table 3,
Based on the above simulation results, Table 6 lists the data of the three governances with collaboration and non-collaboration operations for comprehensive analysis, where Co., Non-Co, and ROC represent collaboration, non-collaboration, and the rate of change, respectively.
Table 6 shows that under the scenario of carbon tax, where
Therefore, according to the analysis results of the low-carbon governance mathematical model of the livestreaming supply chain in the three scenarios, the following implications can be drawn. The governance model combining carbon tax and carbon trading is the optimal governance model, as it can not only reduce the environmental cost, but also the total cost. If China wants to develop a livestreaming supply chain with a low-carbon goal, the combined governance model of carbon tax and carbon trading will minimise the environmental cost of the supply chain and have the most effective carbon emission reduction. This provides useful insight for policy-makers.
At the end of the discussion, it is necessary to compare the main findings of this study with existing research. First, the main findings of this study are related to low-carbon governance optimisation of entire live streaming supply chain, which is different from the existing literature on the decision making of members of livestreaming supply chains. Second, the existing literature has found that the growth of livestreaming supply chains leads to an increase in carbon emissions, and the main findings of this study are conducive to solving this problem. Third, the supply speed of the manufacturer affects the environmental and operating costs of the livestreaming supply chain, which is not included in existing research. Fourth, existing studies have designed a variety of low-carbon governance policies, which have been studied separately for their impact on emissions reduction or on the operational decisions of supply chain members. The main findings of the study consider multi-scenarios governance, which can provide better answers to problems in real livestreaming supply chains.
7 Conclusion
We established a total cost model for livestreaming supply chains by considering carbon emission cost, so as to reduce the carbon emissions (environmental cost) and total cost of supply chains by determining the collaborative supply speed between manufacturers and livestreaming retailers. The advantages of this model are as follows. First, it is feasible to reduce carbon emissions during the transportation process by coordinating the supply speed of the manufacturer with the procurement speed of the livestreaming retailer. Second, the model can be applied to scenarios of carbon tax and carbon trading, which are real scenarios encountered during the implementation of many national policies.
We drew some new and interesting conclusions. If the carbon tax governance model is implemented, although the collaborative operation will lead to a reduction in the total cost of the livestreaming supply chain, it will lead to an increase in the environmental cost. If the carbon trading governance model is implemented, the collaborative operation will lead to an increase in the total cost of the livestreaming supply chain, while the environmental cost will remain unchanged. However, if a governance model combining carbon tax and carbon trading is implemented, collaborative operations can reduce both the total cost and environmental cost of the livestreaming supply chain. Therefore, the governance mode combining carbon tax and carbon trading is the optimal governance mode for livestreaming supply chains, as it can achieve the goal of carbon emissions reduction. The findings provide a useful reference for policy-makers in formulating low-carbon supply chain governance.
Streamer reputation can greatly stimulate potential market demand, resulting in a sudden increase in orders, which will impact the speed of supply and environmental costs. In addition, the reasons for the lack of change in environmental costs under carbon trading governance require further analysis. These issues will be the focus of future studies.
Data availability statement
The data supporting the conclusions of this paper are calculated based on the set parameter values in article. Code using the Matlab calculation process in this study are available on request from the corresponding authors.
Author contributions
LP: Methodology, modeling, solution, and proof method for the model; writing original draft, writing review and editing, writing revised draft; formal analysis, responding to reviewers’ comments. GL: Using Matlab simulink to solve the model, proof method for the model, data curation, and numerical analysis, software. ML: Analysis of the reviewers’ comments, writing revised draft, validation, supervision. YL: Conceptualisation, supervision, writing-review, validation, and resources. ZZ: Edit, solution, validation, and proof method for the model. All authors read and approved the final manuscript.
Funding
This work was partially supported by the Chongqing Science and Technology Commission (Grant CSTB2022NSCQ-MSX1325) and the National Natural Science Foundation of China (Grant 52172341).
Acknowledgments
The authors would like to thank the department editor and the reviewer for their helpful suggestions and comments.
Conflict of interest
The authors declare that the research was conducted in the absence of any commercial or financial relationships that could be construed as a potential conflict of interest.
Publisher’s note
All claims expressed in this article are solely those of the authors and do not necessarily represent those of their affiliated organizations, or those of the publisher, the editors and the reviewers. Any product that may be evaluated in this article, or claim that may be made by its manufacturer, is not guaranteed or endorsed by the publisher.
References
Ang, T., Wei, S., and Anaza, N. A. (2018). Livestreaming vs pre-recorded: How social viewing strategies impact consumers’ viewing experiences and behavioral intentions. Eur. J. Mark. 52 (9/10), 2075–2104. doi:10.1108/ejm-09-2017-0576-
Ang, Y., Wang, Y., Huang, Y., Yang, J., Ma, Y., Yu, H., et al. (2019). Operation optimization of regional integrated energy system based on the modeling of electricity-thermal-natural gas network. Appl. Energy 251, 113410. doi:10.1016/j.apenergy.2019.113410
Bai, C., Zhou, L., Xia, M., and Feng, C. (2020). Analysis of the spatial association network structure of China’s transportation carbon emissions and its driving factors. J. Environ. Manage. 253, 109765. doi:10.1016/j.jenvman.2019.109765
Benjaafar, S., and Elhafsi, M. (2012). A production-inventory system with both Patient and Impatient demand Classes. IEEE Trans. Autom. Sci. Eng. 9 (1), 148–159. doi:10.1109/tase.2011.2158645
Bhaskaran, S. R., and Krishnan, V. (2009). Effort, revenue, and cost sharing mechanisms for collaborative new product development. Manag. Sci. 55 (7), 1152–1169. doi:10.1287/mnsc.1090.1010
Chen, H., Chen, H., and Tian, X. (2022). The dual-process model of product information and habit in influencing consumers’ purchase intention: The role of live streaming features. Electron. Commer. Res. Appl. 53 (2), 101150. doi:10.1016/j.elerap.2022.101150
Chen, J., Hu, Z., and Chen, Y. (2021). Thermoelectric optimization of integrated energy system considering ladder-type carbon trading mechanism and electric hydrogen production. Electr. Power Autom. Equip. 41 (9), 48–55.
China daily (2020). Livestreaming e-commerce to become trillion-yuan market in 2020. Available at http://www.chinadaily.com.cn/a/202010/22/WS5f915209a31024ad0ba805d9.html (accessed November 1, 2021).
China Internet Network Information Center (CNNIC) (2021). The 49th China statistical report on Internet development. Available at http://www.cnnic.net.cn/ (accessed July 1, 202).
Cramer, W., Guiot, J., Fader, M., Garrabou, J., Gattuso, J.-P., Iglesias, A., et al. (2018). Climate change and interconnected risks to sustainable development in the Mediterranean. Nat. Clim. Chang. 8, 972–980. doi:10.1038/s41558-018-0299-2
De, W., van der Kraan, J., and Alicia, T. J. (2020). Live streams on Twitch help viewers Cope with difficult Periods in life. Front. Psychol. 11, 586975. doi:10.3389/fpsyg.2020.586975
Du, S., Hu, L., and Wang, L. (2015). Low-carbon supply policies and supply chain performance with carbon concerned demand. Ann. Oper. Res. 255 (1–2), 569–590. doi:10.1007/s10479-015-1988-0
Du, S., Zhu, L., Liang, L., and Ma, F. (2013). Emission-dependent supply chain and environment-policy-making in the ‘cap-and-trade’ system. Energy Policy 57 (1), 61–67. doi:10.1016/j.enpol.2012.09.042
Du, S. F., Hu, L., and Song, M. L. (2016). Production optimization considering environmental performance and preference in the cap-and-trade system. J. Clean. Prod. 112 (2), 1600–1607. doi:10.1016/j.jclepro.2014.08.086
EcommerceDB (2021). The eCommerce market in Saudi Arabia. Available at https://ecommercedb.com/en/markets/sa/all (accessed November 1, 2021).
El Saadany, A. M. A., and Jaber, M. Y. (2008). Coordinating a two-level supply chain with production Interruptions to Restore-process quality. Comput. Industrial Eng. 54 (1), 95–109. doi:10.1016/j.cie.2007.06.037
Fangqing, W., Zhang, X., Chu, J., Yang, F., and Yuan, Z. (2021). Energy and environmental efficiency of China’s transportation sectors considering CO2 emission uncertainty. Transp. Res. Part D Transp. Environ. 97 (6), 102955. doi:10.1016/j.trd.2021.102955
Glock, C. H. (2011). Batch sizing with Controllable production rates in a multi-stage production system. Int. J. Prod. Res. 49 (20), 6017–6039. doi:10.1080/00207543.2010.528058
Glock, C. H., Kurt, S., and Jaber, M. Y. (2012). An EOQ model with fuzzy demand and learning in fuzziness[J]. Int. J. Serv. Operations Manag. 12 (1), 90–100.
Ha, H.-Y., and Perks, H. (2005). Effects of consumer Perceptions of brand experience on the Web: Brand Familiarity, Satisfaction and brand trust. J. Consumer Behav. 4 (6), 438–452. doi:10.1002/cb.29
Hao, G. (2015). Sustainable pricing and production policies for two competing firms with carbon emissions tax. Int. J. Prod. Res. 53 (21), 1–13.
Hilvert-Bruce, Z., Neill, J. T., Sjoblom, M., and Hamari, J. (2018). Social motivations of live-streaming viewer engagement on Twitch. Comput. Hum. Behav. 84 (5), 58–67. doi:10.1016/j.chb.2018.02.013
Hoen, K. M. R., Tan, T., Fransoo, J. C., and Houtum, G. J. (2014). Effect of carbon emission regulations on transport mode selection under stochastic demand. Flex. Serv. Manuf. J. 26 (1-2), 170–195. doi:10.1007/s10696-012-9151-6
Hua, G. W., Cheng, T. C. E., and Wang, S. Y. (2011). Managing carbon Foot-prints in inventory management. Int. J. Prod. Econ. 132 (2), 178–185. doi:10.1016/j.ijpe.2011.03.024
Huang, S., Fan, Z., and Wang, N. (2020). Green subsidy modes and pricing strategy in a capital-constrained supply chain. Transp. Res. Part E Logist. Transp. Rev. 136, 101885. doi:10.1016/j.tre.2020.101885
Idia brand equity foundation (2021). India's overall online video market to grow at 26% CAGR to reach US$ 4.5 billion by 2025: Report. Available at https://www.ibef.org/news/indias-overall-online-video-market-to-grow-at-26-cagr-to-reach-us-45-billion-by-2025-report (accessed January 12, 2021).
Intergovernmental Panel on Climate Change (IPCC) (2013). Climate change 2013: The Physical science Basis. Cambridge: Cambridge University Press.
Jabbour, C. J. C., Neto, A. S., Gobbo, J. A., Ribeiro, Md S., and Jabbour, A. B. L. de S. (2015). Eco-innovations in more sustainable supply chains for a low-carbon economy: A multiple case study of human critical success factors in Brazilian leading companies. Int. J. Prod. Econ. 164 (1), 245–257. doi:10.1016/j.ijpe.2014.11.015
Jaber, M. Y., Glock, C. H., and El Saadany, A. M. (2013). Supply chain coordination with emissions Reduc⁃tion Incentives. Int. J. Prod. Res. 51 (1), 69–82. doi:10.1080/00207543.2011.651656
James, A. R. (1996). Green consumers in the 1990s: Profile and implications for advertising. J. Bus. Res. 36 (3), 217–231. doi:10.1016/0148-2963(95)00150-6
Ji, J. N., Zhang, Z. Y., and Yang, L. (2017). Carbon emission reduction decisions in the retail-/dual-channel supply chain with consumers' preference. J. Clean. Prod. 141, 852–867. doi:10.1016/j.jclepro.2016.09.135
Kang, K., Zhao, Y., Zhang, J., and Qiang, C. (2019). Evolutionary game theoretic analysis on low-carbon strategy for supply chain enterprises. J. Clean. Prod. 230, 981–994. doi:10.1016/j.jclepro.2019.05.118
Khanna, N., Fridley, D., and Hong, L. (2014). China's pilot low-carbon city initiative: A comparative assessment of national goals and local plans. Sustain. Cities Soc. 12 (1), 110–121. doi:10.1016/j.scs.2014.03.005
Laffont, J., and Tirole, J. (1996). Pollution permits and compliance strategies. J. Public Econ. 62 (1-2), 85–125. doi:10.1016/0047-2727(96)01575-7
Leemans, R., and Vellinga, P. (2017). The scientific motivation of the internationally agreed ‘well below 2 °C’ climate protection target: A historical perspective. Curr. Opin. Environ. Sustain. 26-27, 134–142. doi:10.1016/j.cosust.2017.07.010
Letmatheab, P., and Balakrishnan, N. (2005). Environmental considerations on the optimal product mix. Eur. J. Operational Res. 167 (2), 398–412. doi:10.1016/j.ejor.2004.04.025
Li, R., Lu, Y., Ma, J., and Wang, W. (2020). Examining gifting behavior on live streaming platforms: An identity-based motivation model. Inf. Manag. 2020, 103406. doi:10.1016/j.im.2020.103406
Li, Y., Li, X., and Cai, J. (2021). How attachment affects user stickiness on live streaming platforms: A socio-technical approach perspective. J. Retail. Consumer Serv. 60, 102478. doi:10.1016/j.jretconser.2021.102478
Lim, J. S., Choe, M., Zhang, J., and Noh, G. (2020). The role of wishful identification, emotional engagement, and parasocial relationships in repeated viewing of livestreaming games: A social cognitive theory perspective. Comput. Hum. Behav. 108, 106327. doi:10.1016/j.chb.2020.106327
Lin, Ning (2019). CO2 emissions mitigation potential of buyer consolidation and rail-based intermodal transport in the China-Europe container supply chains. J. Clean. Prod. 240 (C), 118121. doi:10.1016/j.jclepro.2019.118121
Liu, H., Fan, L., and Shao, Z. (2021). Threshold effects of energy consumption, technological innovation, and supply chain management on enterprise performance in China's manufacturing industry. J. Environ. Manag. 300, 113687. doi:10.1016/j.jenvman.2021.113687
Liu, X., Latif, K., Latif, Z., and Li, N. (2020). Relationship between economic growth and CO2 emissions: Does governance matter? Environ. Sci. Pollut. Res. 27 (14), 17221–17228. doi:10.1007/s11356-020-08142-3
Lu, B. Z., Fan, W. G., and Zhou, M. (2016). Social presence, trust, and social commerce purchase intention: An empirical research. Comput. Hum. Behav. 56, 225–237. doi:10.1016/j.chb.2015.11.057
Mao, Z., Du, Z., Yuan, R., and Miao, Q. (2022). Short-term or long-term cooperation between retailer and MCN? New launched products sales strategies in live streaming e-commerce. J. Retail. consumer Serv. 67 (7), 102996. doi:10.1016/j.jretconser.2022.102996
Mayor, K., and Tol, R. S. J. (2007). The impact of the UK Aviation tax on carbon dioxide emissions and Visitor numbers. Transp. Policy 14 (6), 507–513. doi:10.1016/j.tranpol.2007.07.002
Meng, Q., Li, Z., Zhang, J., Li, M., and Liu, W. (2021). Pricing policies of dual-channel green supply chain: Considering government subsidies and consumers’ dual preferences. Sustain. Prod. Consum. 26 (6), 1021–1030. doi:10.1016/j.spc.2021.01.012
Nie, Duxian, Li, Haitao, Qu, Ting, Liu, Yang, and Li, Congdong (2020). Optimizing supply chain configuration with low carbon emission. J. Clean. Prod. 271, 122539. doi:10.1016/j.jclepro.2020.122539
Omri, A., Kahia, M., and Kahouli, B. (2021). Does good governance moderate the financial development-CO2 emissions relationship? Environ. Sci. Pollut. Res. 28 (34), 47503–47516. doi:10.1007/s11356-021-14014-1
Pan, X. (2021). The development status and governance mechanism of online live broadcast e-commerce in China—based on the statistical analysis of Kuaishou live broadcast data in 2020. Acad. Exch. 327 (6), 100–109.
Paypal (2021). Beyond networking: Social commerce as a driver of digital payments - Asia report. Available at https://www.paypalobjects.com/digitalassets/c/website/marketing/global/stories/images/paypal-asia-social-commerce-report.pdf.
Peng, L., Lu, G., Pang, K., and Yao, Q. (2021). Optimal farmer’s income from farm products sales on live streaming with random rewards: Case from China’s rural revitalisation strategy. Comput. Electron. Agric. 189 (10), 106403. doi:10.1016/j.compag.2021.106403
Post, Jakarta (2020). Ecommerce has evolved: Lazada CEO. Available at https://www.thejakartapost.com/news/2020/12/07/e-commerce-has-evolved-lazada-ceo.html (accessed November 1, 2021).
Price Waterhouse Coopers (pwc) (2021). Global consumer insights survey China report. Available at https://www.pwccn.com/en/retail-and-consumer/publications/consumer-insights-survey-2021-china-report.pdf.
Pu, X., Sun, S., and Shao, J. (2020). Direct selling, Reselling, or Agency selling? Manufacturer’s online distribution strategies and their impact. Int. J. Electron. Commer. 24 (2), 232–254. doi:10.1080/10864415.2020.1715530
Qian, F., and Cai, Y. (2020). E-Commerce in China 2020. China commerce and trade press 2-8 (In Chinese).
Ripple, W., Wolf, C., Newsome, T., Barnard, P., Moomaw, W., Palomo, I., et al. (2020). World Scientists’ Warning of a climate Emergency. BioScience 70 (1), 894–898. doi:10.1093/biosci/biab079
Santos, C. E. M., da Silva, C. A. G., and Pedroso, C. M. (2021). Improving perceived quality of live Adaptative video streaming. Entropy 23 (8), 948. doi:10.3390/e23080948
Schouten, A. P., Janssen, L., and Verspaget, M. (2020). Celebrity vs. Influencer endorsements in advertising: The role of identification, credibility, and product-Endorser fit. Int. J. Advert. 39 (2), 258–281. doi:10.1080/02650487.2019.1634898
Sina Business Headlines (2021). In the United States, just entered the studio: So boring. Available at https://t.cj.sina.comcn/articles/view/1750070171/684ff39b020011b3d?from=tech&sudaref=cn.bing.com&display=0&retcode=0 (Accessed October 30, 2021).
sohu.com (2021). Taobao, Kuaishou and Douyin account for 90%? "The first half of the live broadcast e-commerce market data report" announced. Available at https://www.sohu.com/a/486391915_120491808 (accessed August 29, 2021).
Statista (2021b). Estimated on-demand video streaming market size in Japan from 2011 to 2020. Available at https://www.statista.com/statistics/1100890/japan-paid-video-streaming-market-size/ (accessed November 1, 2021).
Statista (2021a). Market size of live commerce in South Korea in 2020, with a forecast from 2021 to 2023(in trillion South Korean won). Available at https://www.statista.com/statistics/1238226/south-korea-live-commerce-market-size/ (accessed November 1, 2021).
Statistical review of world energy (2021). Statistical review of world energy. Available at https://www.bp.com/en/global/corporate/energy-economics/statistical-review-of-world-energy.html (accessed June 27, 2021).
Sun, H., Chen, J., and Fan, M. (2021). Effect of live Chat on Traffic-to-sales Conversion: Evidence from an online Marketplace. Prod. Oper. Manag. 30 (5), 1201–1219. doi:10.1111/poms.13320
Sun, Y., Shao, X., Li, X., Guo, Y., and Nie, K. (2019). How live streaming influences purchase intentions in social commerce: An IT Affordance perspective. Electron. Commer. Res. Appl. 37, 100886. doi:10.1016/j.elerap.2019.100886
Twitch tracker (2020). Twitch Statistics. Available at https://twitchtracker.com/statistics.
Umar, M., Ji, X., Kirikkaleli, D., and Alola, A. A. (2021a). The imperativeness of environmental quality in the United States transportation sector amidst biomass-fossil energy consumption and growth. J. Clean. Prod. 285, 124863. doi:10.1016/j.jclepro.2020.124863
Umar, M., Ji, X., Mirza, N., and Naqvi, B. (2021b). Carbon neutrality, bank lending, and credit risk: Evidence from the Eurozone. J. Environ. Manage. 296, 113156. doi:10.1016/j.jenvman.2021.113156
Wang, B. (2021). The Essence, logic and Trend of livestreaming E-commerce. China Bus. Mark. 4, 48–57.
Wang, J., and Zhang, X. (2022). The value of influencer channel in an emerging livestreaming e-commerce model. J. Operational Res. Soc. 73 (10), 1–13. doi:10.1080/01605682.2022.2027825
Wang, M., and Li, D. (2020). What motivates audience comments on live streaming platforms? PLoS ONE 15 (4), e0231255. doi:10.1371/journal.pone.0231255
Wang, Q., and Xu, H. (2018). A review of China’s carbon trading market. Renew. Sustain. Energy Rev. 91 (8), 613–619. doi:10.1016/j.rser.2018.04.026
Wang, Y. (2021). Playing live-streaming “love games”: Mediated intimacy and desperational labour in digital China. J. Gend. Stud. 30 (5), 621–632. doi:10.1080/09589236.2021.1929100
Wang, Z., Li, J., and Chen, P. (2021). Factors influencing Chinese flower and seedling family farms’ intention to use live streaming as a sustainable marketing method: An application of extended theory of planned behavior. Environ. Dev. Sustain. 24 (7), 4299–4322. doi:10.1007/s10668-021-01616-5
Wongkitrungrueng, A., Dehouche, N., and Assarut, N. (2020). Live streaming commerce from the sellers’ perspective: Implications for online relationship marketing. J. Mark. Manag. 36 (5-6), 488–518. doi:10.1080/0267257x.2020.1748895
Wu, C., Xu, C., Zhao, Q., and Lin, S. (2022). Research on financing strategy of low-carbon supply chain based on cost-sharing contract. Environ. Sci. Pollut. Res. 29 (2), 48358–48375. doi:10.1007/s11356-022-19291-y
Xia, X., Li, C., and Zhu, Q. (2020). Game analysis for the impact of carbon trading on low-carbon supply chain. J. Clean. Prod. 276, 123220. doi:10.1016/j.jclepro.2020.123220
Xu, Jianteng, Qi, Qi, and Bai, Qingguo (2018). Coordinating a dual-channel supply chain with price Discount contracts under carbon emission capacity regulation. Appl. Math. Model. 56, 449–468. doi:10.1016/j.apm.2017.12.018
Xu, X., Zhang, W., He, P., and Xu, X. (2015). Production and pricing problems in make-to-order supply chain with cap-and-trade regulation. Omega 11 (5–6), 389–402.
Yang, C., Yan, S., and Zhong, W. (2020). Optimal thermo-electric dispatching of regional integrated energy system with power-to-gas. Power Syst. Technol. 44 (11), 4254–4264.
Yang, X., Gou, Q., Wang, X., and Zhang, J. (2022). Does bonus motivate streamers to perform better? An analysis of compensation mechanisms for live streaming platforms. Transp. Res. Part E Logist. Transp. Rev. 164, 102758. doi:10.1016/j.tre.2022.102758
Yu, W., Wang, Y., Feng, W., Bao, L., and Han, R. (2022). Low carbon strategy analysis with two competing supply chain considering carbon taxation. Comput. Industrial Eng. 169, 108203. doi:10.1016/j.cie.2022.108203
Zhang, F., Wang, X., and Liu, G. (2022). Allocation of carbon emission quotas based on global equality perspective. Environ. Sci. Pollut. Res. 29 (35), 53553–53568. doi:10.1007/s11356-022-19619-8
Zhang, M., Qin, F., and Wang, G. A. (2020). The impact of live video streaming on online purchase intention[J]. Serv. Industries J. 40 (9/10), 1–26.
Zhang, W., Zhang, Q., Mizgier, K. J., and Zhang, Y. (2017). Integrating the customers’ perceived risks and benefits into the triple-channel retailing. Int. J. Prod. Res. 55 (22), 6676–6690. doi:10.1080/00207543.2017.1336679
Zheng, R., Li, Z., and Na, S. (2022). How customer engagement in the live-streaming affects purchase intention and customer acquisition, E-tailer's perspective. J. Retail. consumer Serv. 68, 103015. doi:10.1016/j.jretconser.2022.103015
Zhu, L., and Liu, N. (2021). Game theoretic analysis of logistics service coordination in a live-streaming e-commerce system. Electron. Commer. Res. 64 (9), 1–39. doi:10.1007/s10660-021-09502-y
Keywords: low carbon governance, carbon emissions reduction, carbon tax, live streaming, low carbon supply chain, environmental cost
Citation: Peng L, Lu G, Liu M, Liu Y and Zou Z (2022) Optimal low-carbon governance model of livestreaming supply chain based on multiple scenarios. Front. Environ. Sci. 10:1075713. doi: 10.3389/fenvs.2022.1075713
Received: 20 October 2022; Accepted: 14 November 2022;
Published: 30 November 2022.
Edited by:
Chenchen Shi, Capital University of Economics and Business, ChinaReviewed by:
Xiaoyun Du, Zhengzhou University, ChinaAdis Puška, University of Bijeljina, Bosnia and Herzegovina
Copyright © 2022 Peng, Lu, Liu, Liu and Zou. This is an open-access article distributed under the terms of the Creative Commons Attribution License (CC BY). The use, distribution or reproduction in other forums is permitted, provided the original author(s) and the copyright owner(s) are credited and that the original publication in this journal is cited, in accordance with accepted academic practice. No use, distribution or reproduction is permitted which does not comply with these terms.
*Correspondence: Liangjun Peng, NjExMjEwMTIwMDAyQG1haWxzLmNxanR1LmVkdS5jbg==; Yawei Liu, eWF3ZWlsY25AY3FqdHUuZWR1LmNu
 Liangjun Peng
 Gang Lu2
 Yawei Liu