 Qiaohua Lin
 Qiuwangh Cheng2,3
 Wenhe Lin
95% of researchers rate our articles as excellent or good
Learn more about the work of our research integrity team to safeguard the quality of each article we publish.
Find out more
ORIGINAL RESEARCH article
Front. Environ. Sci. , 07 December 2022
Sec. Environmental Economics and Management
Volume 10 - 2022 | https://doi.org/10.3389/fenvs.2022.1074992
In the context of financial support for rural revitalization, digital financial inclusion may become a new “gospel” to alleviate agricultural surface source pollution. Based on the panel data of 30 Chinese provinces from 2011 to 2020, the study constructs a fixed-effects model to test the mitigation effect of digital financial inclusion on agricultural non-point source pollution empirically. The study finds that: 1) Digital financial inclusion has a mitigating effect on agricultural non-point source pollution, and the abatement effect still exists after the robustness tests such as replacing the explanatory variables, reducing the sample size, and endogeneity treatment. 2) The moderating effect test shows that the income structure of farmers strengthens the mitigation effect of digital financial inclusion on agricultural non-point source pollution, i.e., the more the income structure of farmers tends to be “non-farmed”, the stronger the mitigation effect of digital financial inclusion. 3) The heterogeneity test found that all three dimensions of digital financial inclusion, including the breadth of coverage, depth of use, and degree of digitization, can mitigate agricultural non-point source pollution, but there are differences in the intensity of the effect. Compared with the northwestern part of the “hu huan yong” line, the mitigation effect of digital inclusive finance is more significant in the southeastern part of the “hu huan yong” line. 4) The threshold effect test shows that the mitigation effect of digital financial inclusion on agricultural non-point source pollution has non-linear characteristics, and there is a double threshold effect of digital financial inclusion, and the mitigation effect will be enhanced as the development level of digital financial inclusion increases.
Ensure access to water and sanitation for all is one of the 2030 UN Sustainable Development Targets (The United Nations). While international efforts have increased the use of improved drinking water sources from 76% to 90% of the global population between 1990 and 2015, three in ten people worldwide still do not have access to safely managed drinking water services (The United Nations). Global wastewater generation and its overall pollution load are increasing, making water pollution a growing part of the overall water cycle (Water Quality and Wastewater). Non-point source pollution is an important issue in water environment pollution, among which agricultural non-point source pollution poses the greatest risk (Ongley et al., 2010), and the negative impact of agricultural production on link pollution has received wide attention (Rehman et al., 2022a; Rehman et al., 2022b; Chishti et al., 2022). In China, agricultural non-point source pollution also poses a great threat to the water environment. According to the Second National Pollution Source Statistics Bulletin released by China in 2020, China’s water pollutant emissions in 2017 were 21, 439, 800 tons of chemical oxygen demand, 963,400 tons of ammonia nitrogen, 3,041,400 tons of total nitrogen, and 315,400 tons of total phosphorus. Among them, water pollutant emissions from agricultural sources were 10.671.3 thousand tons of chemical oxygen demand, 216.2 thousand tons of ammonia nitrogen, 1.414.9 thousand tons of total nitrogen, and 210.2 thousand tons of total phosphorus. However, both in theory and in practice, compared to industrial point source pollution, agricultural non-point source pollution has not received the attention it deserves (Ouyang, 2021). Due to the characteristics of agricultural non-point source pollution such as dispersed, hidden, random, difficult to observe and uncertainty (Shen et al., 2012), it makes the prevention and control of agricultural non-point source pollution difficult, and how to control agricultural non-point source pollution has become a difficult problem that restricts the green transformation of agriculture (Jiang et al., 2021).
Agricultural production is highly dependent on resources and the environment (Xie et al., 2021), and financial instruments, as tools for providing production factors and mitigating production risks, will likely influence the chemical input and production factor allocation behavior of agricultural operators and reduce the generation of non-point source pollution in agriculture. Many countries have designed and implemented a series of incentives from different perspectives, such as the elimination of non-point source pollution through economic measures such as taxes, subsidies and pollution trading (Wang, 2006). Compared with administrative instruments, market-based financial instruments help agricultural production and management agents to enhance the enthusiasm of agricultural pollution control by providing direct financing and financing platforms (Jiang et al., 2019). However, under the traditional financial service framework, the provision of financial services to rural areas is characterized by high risk and high cost, which hinders financial institutions from entering agriculture and rural areas (Gao et al., 2022).
In the International Microcredit Year of 2005, the United Nations officially introduced the concept of “inclusive finance”, which means a financial system that effectively and comprehensively serves all segments and groups of society (Jiao et al., 2015). Financial inclusion is manifested by helping the poor and disadvantaged remove barriers to accessing formal financial services so that they have access to fair and safe formal financial services when they need them (Chakravarty and Pal, 2013). With the development of digital technologies such as big data, cloud computing and the Internet, digital financial inclusion relies on digital technologies to alleviate the problems of rural financial information asymmetry and difficulties in collateralization, helping to solve the problems of financing in agricultural development (Ji et al., 2021; Huang and Wang, 2022). China is the most widely used country in the world for digital finance (Chen and Zhao, 2021), and financial inclusion practices have expanded from microfinance to multi-business financial services such as payments, insurance, and credit with the widespread use of digital technologies (Guo et al., 2020). In this context, we explore whether digital financial inclusion has a role in reducing agricultural non-point source pollution, which will be an important reference for implementing rural environmental protection policies in developing countries.
In a comprehensive view, the prevention and control of agricultural non-point source pollution has become urgent, but compared with industrial pollution, agricultural non-point source pollution has not received due attention either in theory or in practice. Based on existing studies, this study explores the role of digital financial inclusion on agricultural non-point source pollution, which not only proposes new ideas on the management of agricultural non-point source pollution, but also expands the related studies on pollution prevention by financial means. The main contributions of this study are as follows. First, it is the first time to verify the agricultural non-point source pollution abatement effect of digital financial inclusion. Second, the study finds that the structure of farmers’ income has a moderating effect on the agricultural non-point source pollution abatement effect of digital financial inclusion, and the higher the farmers’ non-farm income, the stronger the abatement effect of digital financial inclusion on agricultural non-point source pollution. Third, the study verifies that the emission reduction effect of digital financial inclusion on agricultural non-point source pollution is non-linear, and its emission reduction effect on agricultural non-point source pollution will increase as the development level of digital financial inclusion increases.
The rest of this paper is organized as follows. Section 2 conducts the literature review and hypothesis formulation, reviewing relevant studies on agricultural non-point source pollution and digital financial inclusion, according to which the role of digital financial inclusion on agricultural non-point source pollution is analyzed and the corresponding hypotheses are proposed. Section 3 presents the model design, indicator selection, and data sources, including the construction of the baseline model and the moderating effect model. Section 4 shows the results of empirical tests, such as regression results, robustness tests, endogeneity tests, and heterogeneity analysis of variables, heterogeneity analysis of variables. Section 5 provides a further discussion of the problem and explores whether the agricultural non-point source pollution abatement role of digital financial inclusion has a threshold effect. Section 6 discusses the results of the study and makes policy recommendations based on the findings.
Agricultural non-point source pollution refers to nutrients, pesticides, and other organic or inorganic pollutants that are input during agricultural production activities. These substances cause environmental pollution through surface runoff and seepage from agricultural fields, mainly including fertilizer pollution, pesticide pollution, and livestock and poultry manure pollution (Hill et al., 2005; Li et al., 2010a; Sun et al., 2012). Around how to reduce agricultural non-point source pollution, scholars have begun to explore its influencing factors, which can be broadly categorized as socio-economic factors, farmers’ own factors and institutional environmental factors. Of these, socioeconomic factors are most widely discussed. Li and Zhang (2009) introduced the environmental Kuznets curve (EKC) to agricultural economic development and agricultural non-point source pollution, and verified that there is a significant inverted “U” curve relationship between agricultural non-point source pollution and economic growth. Jie et al. (2018) further confirmed the existence of an inverted “U” shaped EKC relationship between fertilizer non-point source pollution and agricultural growth, and pointed out that scale effects would aggravate pollution, while structural and technological effects would reduce pollution. Meanwhile, urbanization (Xue et al., 2019), population growth (Wu et al., 2017), and moderate scale operation (Jiang et al., 2021) are all important socioeconomic factors affecting agricultural nonpoint source pollution. In addition to being driven by socioeconomic factors, the extent of agricultural non-point source pollution emissions is also influenced by the social background of farmers, their own characteristics and other factors (Tan et al., 2021). Xia et al. (2018) found that the level of agricultural non-point source pollution was significantly higher among part-time farmers than non-part-time farmers, based on the reality of continuous labor migration in agriculture. The “crowding-out effect” of part-time farming makes farmers increase short-term capital investment to compensate for the lack of labor input, resulting in the increase of agricultural non-point source pollution. However, the “income effect” of part-time farming motivates farmers to raise awareness of agricultural quality and safety and reduce fertilizer inputs on their own land, thus reducing agricultural non-point source pollution. Using provincial panel data, Shi and Yi (2020) similarly verify that increasing non-farm part-time income significantly enhances agricultural non-point source pollution. In terms of institutional environment, Ge and Zhou (2012) using provincial panel data, the study found that fertilizer industry price controls distort fertilizer factor markets and stimulate fertilizer agricultural non-point source pollution emissions. Qin et al. (2021) demonstrated that environmental regulation has a significant negative effect on agricultural non-point source pollution by constructing a dynamic panel model, and found that the effect of environmental regulation on agricultural non-point source pollution will change from negative to positive along with the increase of environmental decentralization. These studies have explored extensively the factors influencing agricultural non-point source pollution, but studies linking digital financial inclusion with agricultural non-point source pollution and exploring new tools for agricultural non-point source pollution are still to be added.
The relationship between financial development and environmental pollution has been studied for a long time, resulting in a debate between “inhibition theory”, “promotion theory” and “non-linear relationship”. The “inhibition theory” argues that the technology-enhancing effects of financial development are important for green and low-carbon economic development (Yan et al., 2016). Xu and zhu (2020) argue that financial development significantly contributes to green total factor productivity improvement through two paths: enhancing green technical efficiency and green technology. Weimin et al. (2022) found that positive impacts of innovative activities play a crucial role in reducing environmental pollution in developing countries and suggested the development of green technologies. Zhu and Zhang (2022) found that the development of digital financial helps to reduce pollution emissions, and technological progress and structural transformation strengthen the pollution reduction effect of digital finance. Tamazian et al. (2009) point out that the technological advancement effect of financial development promotes efficient use of resources and thus reduces carbon emissions. This shows that the promoting effect of technological progress of financial development on the environment has been more widely recognized. However, some scholars have also found that the effect of financial development on the environment can be decomposed into a technology effect and a scale effect, with the technology effect reducing environmental pollution and the scale effect enhancing environmental pollution, suggesting that the relationship between the two is nonlinear (Hu and Li, 2019). Ahmad et al. (2022) found that economic aggregates have a positive and significant effect on the carbon dioxide emissions based on long-term measurements, while the trade balance and the real exchange rate have a negative and significant effect. The “promotion theory” argues that financial development releases consumers’ financial constraints and stimulates their consumption of energy-consuming products, thus increasing pollutant emissions (Zhang, 2011). The initial increase in the level of financial development is often accompanied by the expansion of economic scale and increased carbon emissions, which is related to the lack of capacity of traditional finance to avoid high-risk projects and to deal with information and agency problems in high-technology areas (Chen and Hu, 2020).
Scholars’ views on the environmental effects of financial development are still not unified, and relevant studies have mainly focused on industrial pollution, while attention to the agricultural sector has yet to be strengthened, and the shortcomings of traditional finance have been revealed. Compared with traditional finance, digital financial inclusion has the advantages of breaking geographical limitations, low threshold, and convenience, and can reach more farmers and micro and small enterprises to meet their capital needs, which is inherently inclusive (Ji et al., 2021; Zhang and Peng, 2021). Existing studies have found that digital financial inclusion plays an important role in rural revitalization. Digital financial inclusion helps to alleviate credit constraints of farmers (FAN, 2021), and reduce their vulnerability (Wang and He, 2020); helps to narrow the urban-rural gap (Ji et al., 2021; Yu and Wang, 2021; Zhao et al., 2022), play an important role in rural economic development (Chen and Zhao, 2021); help promote the accumulation of rural human capital (Li et al., 2022), improve the level of agricultural green development (Guo et al., 2022). There are some results about the role of digital financial inclusion on the environment, e.g.: Cheng et al. (2022) believe that digital financial inclusion has ecological effects, and the development of digital financial inclusion can help reduce the intensity of agricultural carbon emissions. Zhong et al. (2022) show that digital financial inclusion can reduce agricultural carbon emissions by promoting technological advances in agriculture. Hong et al. (2022) found that digital financial inclusion can enhance green total factor productivity in agriculture by regulating the structure of the agricultural industry. The existing research findings provide a reference for the development of this study, but none of them have explored the relationship between digital financial inclusion and agricultural non-point source pollution. Based on this, this study confronts the problem of agricultural non-point source pollution and explores the direct impact of digital financial inclusion on agricultural non-point source pollution, which is an important reference for the implementation of rural environmental protection policies in developing countries.
Agricultural production is perennially faced with the problems of difficult, expensive, and complicated financing (SUN et al., 2022), which restrict the high-quality development of agriculture. When farmers’ investment behavior lacks strong financial support, it will cause farmers to invest less in sustainable fixed assets and more in factors of production that can yield short-term results, such as pesticides and fertilizers. The lack of financial resources and technology is also an important factor limiting farmers from carrying out agricultural green production practices such as soil conservation (Zhu and Qu, 1999). First, digital financial inclusion broadens the access of farmers to capital, significantly increases the availability and scale of formal credit for farmers (Fan, 2021), and effectively alleviates the “long tail” dilemma of the financial market (Cheng et al., 2022). This will make farmers, in order to maximize their own interests, thus increase the production factor inputs that are conducive to the sustainable development of farmland, choose green agricultural production and operation mode, and directly reduce agricultural non-point source pollution emissions. Secondly, digital financial inclusion builds financial and environmental protection service platforms, such as WeChat’s “agricultural cloud assistant applet” and Alipay’s various used goods recycling platforms, which show new potential in the governance of the rural environment. Finally, the development of digital financial inclusion makes it more convenient for farmers to obtain environmental protection-related information, supervise environmental management, and complain about environmental pollution, which improves farmers’ motivation for environmental protection and increases their sense of ownership. Accordingly, Hypothesis 1 is formulated:
Pesticides, fertilizers and other production factor inputs are to some extent for pest and disease prevention and risk aversion, and the more dependent farmers are on farming income, the more they tend to apply chemicals such as fertilizers and pesticides for risk aversion (Cai and Li, 2011). When farmers have higher levels of off-farm income, these farmers are less sensitive to crop yields and pests than full-time farmers, so they are relatively less willing to overuse pesticides than full-time farmers (Cai et al., 2022). Studies have found a relationship between farmers’ income structure and their willingness to protect the environment and their environmental behavior. Liang et al. (2005) found that the level of non-agricultural income of farmers influenced the willingness of farmers to protect water sources, and the higher the level of non-agricultural income, the stronger the willingness of farmers to protect water sources. Li et al. (2010b), in their survey of farmers’ land use behavior in Jiangxi Province, China, found that farmers’ non-agricultural income was negatively correlated with farmers’ fertilizer inputs at a significant level of 5%, with each 1% increase in farmers’ non-agricultural income being associated with a 7% decrease in average fertilizer inputs per mu (1 mu equals approximately 666.67 m2). In an analysis of fertilizer application and its influencing factors for two grain crops, winter wheat and summer maize, by farmers in the North China Plain, Ma (2006) found that the structure of farmers’ income sources influenced fertilizer application on grain crops, and that when farmers’ non-agricultural income increased by 1%, farmers reduced fertilizer application on grain crops by 0.089%. The development of digital financial inclusion provides farmers with funds to alleviate their vulnerability, and the abundant funds promote the rational allocation of production factors for farmers. After receiving financial support, farmers may choose to “leave the farm”, resulting in a decrease in the frequency of regional agricultural production and a reduction in agricultural non-point source pollution. Farmers who choose to “stay on the farm” may choose to expand the scale of agricultural production and adopt a production model that is conducive to sustainable agricultural development for long-term benefits. This can bring into play the scale effect of fertilizer and pesticide use and improve utilization rates, thereby reducing agricultural nonpoint source pollution. When farmers have higher levels of non-agricultural income, their greater experience of non-agricultural employment helps to change traditional thinking and improve farmers’ technological literacy (Xue et al., 2019). On the one hand, they are more willing to try new things and can receive help from digital financial inclusion through digital platforms. On the other hand, they can be exposed to more knowledge of green production through digital platforms, so that they can pay more attention to the adoption of green and clean technologies in agricultural production and reduce agricultural non-point source pollution. Based on this, Hypothesis 2 is proposed:
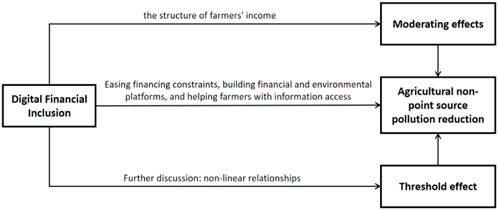
FIGURE 1. A theoretical framework diagram of digital financial inclusion on agricultural non-point pollution.
Considering the effect of heteroskedasticity, all variables in the model are logarithmically treated in this study. Since the data used in this study are panel data, applying a fixed-effects model helps to avoid those biases due to the omission of variables that do not change over time, or those things that change over time and affect each cross-sectional subject on average. Therefore, we construct a fixed-effects model of the impact of digital financial inclusion on agricultural f non-point source pollution, which is set as follows:
In equation Eq. 1, lnEIit is the dependent variable, indicating the intensity of agricultural non-point source pollution in province i in year t, with i being the province and t being the time; lnDFIit is the core explanatory variable, indicating the digital financial inclusion index in province i in year t; lnCONXit denotes other control variables in province i in year t, including the level of urbanization (lncity), the level of financial support to agriculture (lnfinace), the level of education (lnedu), the structure of cultivation (lnplanting), and the rate of land transfer (lnturnover); λi denotes regional fixed effects; and εit denotes the random error term.
Referring to the study of Fang et al. (2015), this study constructs a moderating effect model to verify the moderating effect of farmers’ income structure on the impact of agricultural non-point source pollution of digital financial inclusion, and the model is set as follows:
In equation Eq. 2, lnincomeit denotes the income structure of farm households, and lnDFIit × lnincomeit denotes the interaction term between digital financial inclusion and farmers’ income structure, where the regression coefficient α4 is the parameter of focus in the moderating effects model. Considering the possible multicollinearity interference of the interaction terms, the interaction terms are therefore centralized in this study.
Agricultural non-point source pollution emission intensity, expressed using the ratio of total agricultural non-point source pollution emission (E) to total agricultural output (AL) (EI, tons/billion). Compared to total agricultural non-point source pollution emissions, the intensity of agricultural non-point source pollution emissions better reflects the degree to which agricultural non-point source pollution satisfies the provincial units in the study area. The total agricultural non-point source pollution was measured with reference to Lai et al. (2004), and the pollution emissions of fertilizer, mulch, straw, and pesticides were measured by the unit survey method based on inventory analysis. Fertilizer pollution emissions were measured for total nitrogen (TN) and total phosphorus (TP) for nitrogen, phosphorus and compound fertilizers, with specific coefficients and fertilizer loss rates referring to studies by Lai et al. (2004) and Chen et al. (2006). The mulch pollution emission was measured as mulch residue and pesticide pollution emission was measured as pesticide loss, and the specific coefficients of mulch residue and pesticide loss were obtained from the Handbook of Agricultural Source Coefficients of the First National Pollution Source Census. The approach was to divide the sample provinces into northern highland areas, northeastern semi-humid plain areas, yellow and huaihai semi-humid plain areas, southern mountainous hilly areas, southern humid plain areas and northwestern arid and semi-arid plain areas, and to take the average values of mulch residue coefficients and pesticide loss coefficients under different patterns in each divided area. Straw pollution emissions were measured for total nitrogen (TN), total phosphorus (TP), and chemical oxygen demand (COD) of straw, and the main crops measured were rice, wheat, maize, beans, and potatoes, and the coefficients and calculation methods for straw grain ratio, nutrient content, pollution production coefficient, utilization structure, and nutrient loss rate were referred to the study by Xue (2019). The intensity of agricultural non-point source pollution emissions is calculated by the formula:
In equation Eq. 3, EI indicates the pollution intensity of agricultural non-point sources (tons/billion); E indicates the total pollution emission from agricultural non-point sources (tons); AL indicates the total agricultural output value (billion); EUi indicates the pollution emission of unit i (tons), i.e., the pollution emission of chemical fertilizer, mulch, straw and pesticide; ηi indicates the utilization efficiency of unit i; ρi indicates the pollution production intensity of unit i; ωi indicates the pollutant loss rate of unit i; and Кit indicates the pollutant emission coefficient of unit i is influenced by other factors such as time, climate and pollution treatment.
Digital financial inclusion (DFI), which is represented in this study using provincial-level data from the Digital Financial Inclusion Index compiled by the Digital Financial Inclusion Center of Peking University (Guo et al., 2020), as a reflection of the level of digital financial inclusion development in each province.
Before conducting the baseline regression, this study plots the scatter plot of digital financial inclusion and agricultural non-point source pollution emission intensity from 2011 to 2020 to take a preliminary look at the relationship between the two. As can be seen from Figure 2, there is a negative relationship between digital financial inclusion and agricultural non-point source pollution emission intensity without considering the influence of other factors on agricultural non-point source pollution.
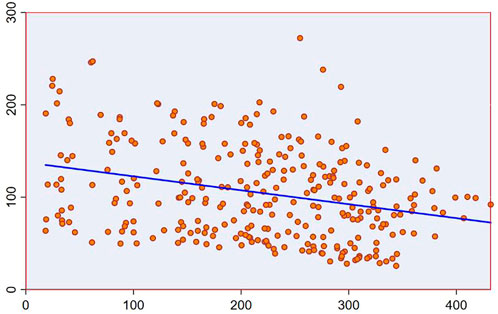
FIGURE 2. Scatter plot of digital financial inclusion and agricultural non-point source pollution intensity.
The structure of farmers’ income (income), referring to Xue et al. (2019), affected by the adjustment of statistical caliber, is expressed as the ratio of the sum of income other than household business income to rural residents’ per capita net household income before 2013, and the ratio of the sum of income other than rural residents’ per capita net disposable business income to rural residents’ per capita disposable income after 2013. After 2013, it is expressed as the ratio of the sum of income other than net disposable operating income per rural resident to the net income per rural resident.
The following control variables were selected with reference to existing studies. Referring to Jiang et al. (2021), the level of urbanization (city) is used to reflect the level of regional economic development, specifically expressed as the ratio of urban population to total population. Referring to the study of Xue et al. (2019), the level of fiscal support to agriculture (finance) is used to reflect the government’s willingness to support agriculture, specifically expressed as the ratio of expenditure on agriculture, forestry and water affairs to general budget expenditure. Referring to Hua et al. (2013), the educational level (edu) was used to reflect the regional human capital level. This is done by assigning the educational level illiterate and semi-literate as 0, elementary school as 6, junior high school as 9, senior high school as 12, and college and above as 16, and expressing the educational level by multiplying the number of each educational level by the ratio of the corresponding sum to the number of people aged six and above. For the reason of statistical caliber, the education level in 2020 is replaced by the education level in 2019. Referring to the study of Wu et al. (2017), the planting structure (planting) is used to reflect the share of cash crops, specifically expressed as the ratio of sown area of food to sown area of crops. Referring to the study of Ma et al. (2019), the land transfer rate was used to reflect the land transfer behavior of farm households, specifically expressed as the ratio of the total area of family contracted farmland transferred to the area of family contracted farmland.
Considering that the People’s Bank of China started to issue third-party payment licenses in 2011, and that the development of digital financial inclusion in China has entered a new stage since then, as well as the availability of data, this study selects data at the level of 30 provinces (cities) nationwide from 2011 to 2020 (excluding Hong Kong, Macao, Taiwan and Tibet). The data are mainly obtained from the Digital Financial Inclusion Index at the provincial level released by the Digital Finance Research Center of Peking University (Link: https://idf.pku.edu.cn/docs/20210421101507614920.pdf), the China Statistical Yearbook (Link: https://data.cnki.net/yearbook/Single/N2021110004), the China Rural Statistical Yearbook and the statistical yearbooks of each province in the past years (Link: https://data.cnki.net/yearbook/Single/N2021120010). The descriptive statistics of each variable are shown in Table 1.
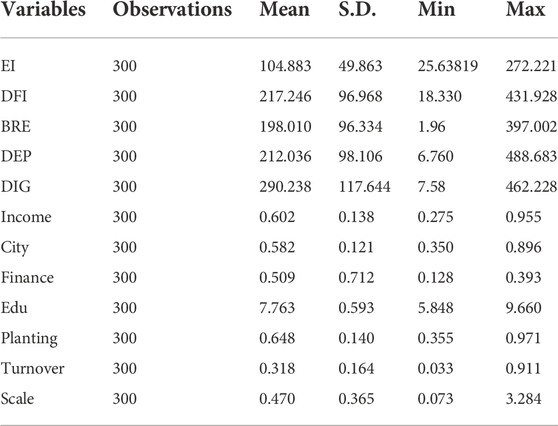
TABLE 1. Variable statistical description.
According to the Eq. 3 to measure the intensity of agricultural non-point source pollution emissions in each province (city) from 2011 to 2020, the average value of total agricultural non-point source pollution emissions and the average value of emission intensity in each province (city) in the past 10 years were calculated, as shown in Table 2. From 2011 to 2020, the average value of total agricultural non-point source pollution emissions in each province (city), the ten provinces with the largest average value of total emissions are Jiangsu, Shandong, Henan, Hebei, Guangdong, Hubei, Yunnan, Hunan, Shaanxi, Inner Mongolia, and overall the top ranked provinces are mostly agricultural provinces. From the average value of agricultural non-point source pollution emission intensity in each province (city) from 2011 to 2020, the ten provinces with the largest average emission intensity are Jilin, Inner Mongolia, Jiangsu, Tianjin, Ningxia, Yunnan, Guangdong, Beijing, Shaanxi, and Hubei. To some extent, this indicates that the agricultural non-point source pollution generated per billion dollars in these provinces is larger, and the reason may be that the agricultural production methods in these provinces are still relatively rugged, and also indicates that the green transformation of agricultural production needs to be further promoted.
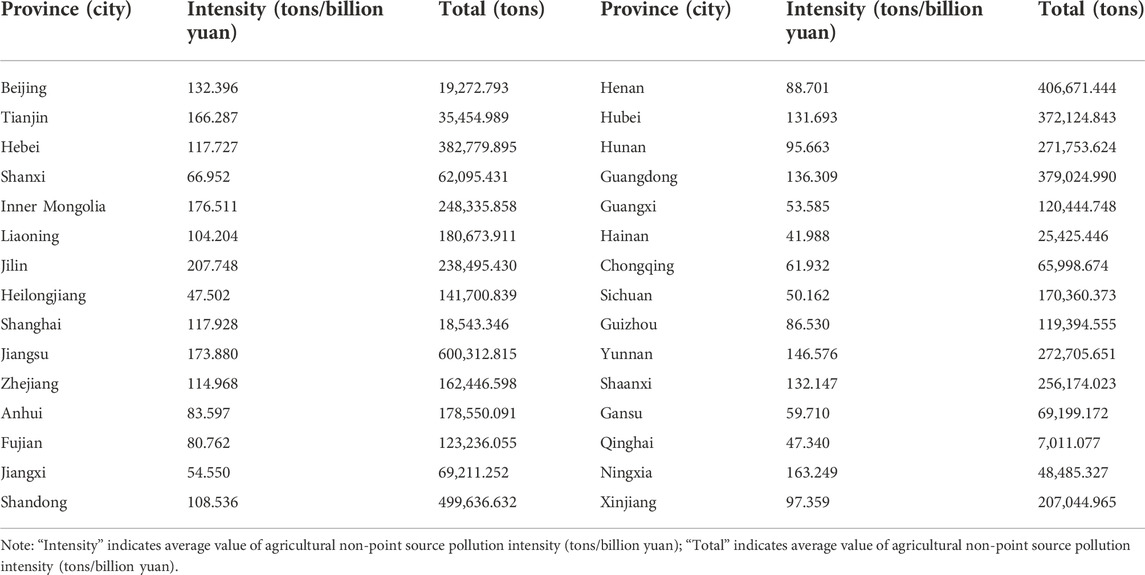
TABLE 2. Results of agricultural non-point source pollution emissions by province (city) in China from 2011 to 2020.
The appropriate model for this study needs to be selected before conducting the baseline regression. The pooled model and fixed effects model were first compared, and the result of F-test was 128.63 with a p-value of 0.000, and the LSDV method test showed that multiple individual dummy variables were significant, so the fixed effects model was chosen. Then comparing the fixed effects model with the random effects model, the Hausman test showed that the chi-square value was 45.09 and the p-value was 0.000, so the fixed effects model was finally chosen.
Table 3 reports the regression results of the effect of digital financial inclusion on agricultural non-point source pollution reduction. Model (1) is the regression result without the inclusion of control variables, and the results show that digital financial inclusion has a negative effect on the intensity of agricultural non-point source pollution emissions at the 5% statistical level, with a regression coefficient of −0.253. Model (2) adds control variables to model (1) and the regression results still show a negative effect of digital financial inclusion on the intensity of agricultural non-point source pollution emissions at the 5% statistical level with a regression coefficient of −0.053. This indicates that for every 1% increase in digital inclusion, the intensity of agricultural nonpoint source pollution emissions decreases by 5.3%, and Hypothesis 1 passes the test. From the regression results of control variables, urbanization and education level have a significant reduction effect on agricultural non-point source pollution emission intensity. Planting structure tends to be grain-based and has a significant increase effect on agricultural non-point source pollution emission intensity. Financial support level and land transfer rate do not have significant effects on agricultural nonpoint source pollution emission intensity.
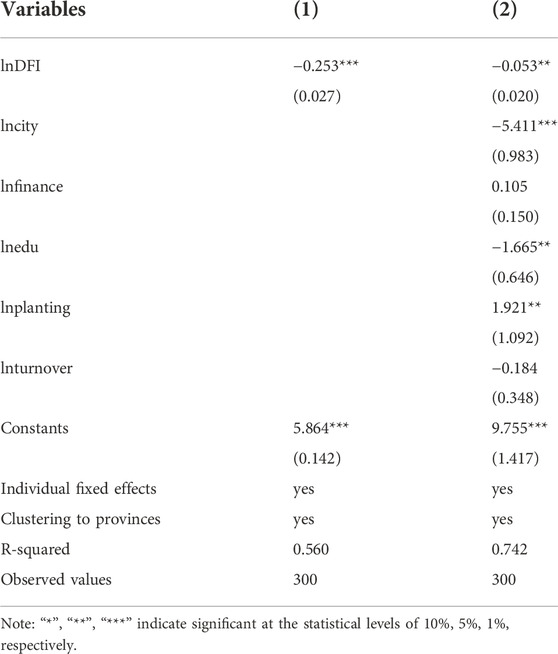
TABLE 3. Test of agricultural non-point source pollution abatement effect of digital financial inclusion.
Referring to Jiang et al. (2021), the weights of chemical factor inputs such as fertilizer, pesticide, agricultural film, and diesel were all set to 0.25, and the sum of each pollution source was found after assigning equal values to each source, and the ratio of agricultural non-point source pollution to total agricultural output was used to measure agricultural non-point source pollution. The regression results after replacement of the explanatory variables are shown in model (3) in Table 4. Digital financial inclusion significantly reduces the intensity of agricultural non-point source pollution emissions at the 5% statistical level with a regression coefficient of −0.056, verifying the agricultural non-point source pollution reduction effect of digital financial inclusion.

TABLE 4. Robustness test results.
Removing four municipalities, including Tianjin, Chongqing, Beijing and Shanghai, the agricultural non-point source pollution abatement effect of digital financial inclusion is again tested. The regression results are shown in model (4) in Table 4. Digital financial inclusion significantly reduces the intensity of agricultural non-point source pollution emissions at the 5% statistical level with a regression coefficient of −0.066, which again verifies that digital financial inclusion has an agricultural non-point source pollution reduction effect.
Referring to Zhang et al. (2022), the regression analysis was conducted again by removing the 2011 and 2012 samples from the sample, considering that the Chinese economy started to face the pressure of growth rate shift and structural adjustment in 2012. The regression results are shown in model (5) in Table 4, where digital financial inclusion significantly reduces agricultural non-point source pollution at the 1% statistical level with a regression coefficient of -0.472, indicating that the agricultural non-point source pollution reduction effect of digital financial inclusion remains significant.
Although a range of factors that may affect agricultural non-point source pollution have been considered, the residual term may still have other factors that affect agricultural non-point source pollution, and the study may be endogenously biased by omitted variables. The reduced funding needs of agricultural non-point source pollution will probably force digital financial inclusion to improve the level of inclusion, and the study may have an endogenous bias due to reverse causation. Therefore, this study mitigated the endogeneity problem by instrumental variables method and the test results are shown in Table 5.
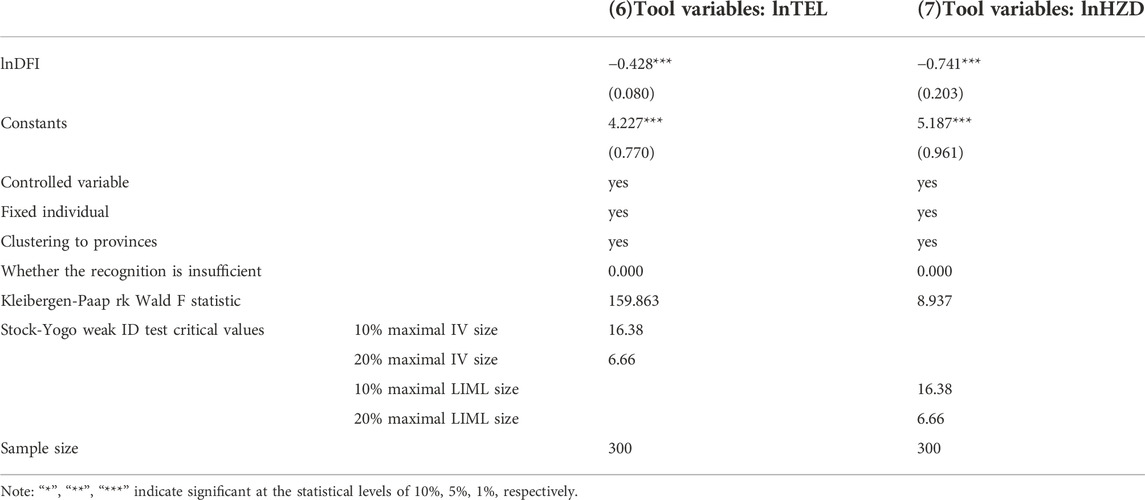
TABLE 5. Instrumental variable tests.
Digital financial inclusion is a product of the development of the Internet up to a certain period of time, and therefore, referring to the study of huang et al. (2019), the development history of Internet access technology in China is used as the background for the selection of instrumental variables. Internet access in China started with telephone line dial-up access, so the number of fixed telephones will affect the popularity of the Internet. The number of local post offices will affect people’s contact with each other before access to fixed-line telephone, so the number of local post offices will affect the access to fixed-line telephone and Internet penetration. Considering that the sample of this study is balanced panel data, the instrumental variables may be difficult to measure due to the application of fixed-effects models, so a comprehensive reference to Huang et al. (2019); Chen and Tan. (2022) and Nunn and Qian (2014), the interaction term (lnTEL) between the number of post offices per million people in 1984, the number of post offices per million people in 1984 and the average index of digital financial inclusion in that year are constructed as instrumental variables and tested using two-stage least squares method. The results, as shown in model (6) in Table 5, show that there is an agricultural non-point source pollution abatement effect at the 1% statistical level for digital financial inclusion, and both the under-identified instrumental variables and the weak instrumental variables issues also pass the test.
The development of digital financial inclusion is influenced by spatial factors. Hangzhou has the leading level of financial technology development in China, and the more distant the city from Hangzhou, the more difficult it is to promote Internet finance (Guo et al., 2017), so the spherical distance to Hangzhou affects the level of digital financial inclusion development in the city, and therefore satisfies the instrumental variable selection correlation requirement. Meanwhile, the intensity of agricultural non-point source pollution in each province and the spherical distance to Hangzhou are exogenous indicators, and agricultural non-point source pollution does not affect the spherical distance from each province to Hangzhou, satisfying the exclusion condition. Therefore, this study refers to Zhang et al. (2019) and selects the spherical distance (lnHZD) from the capital city of each province (city) to Hangzhou as an instrumental variable. The Cragg-Donald Wald F statistic was not greater than the 10% threshold of the Stock-Yogo weak ID test when tested using two-stage least squares, so it was eventually tested by a more robust limited information great likelihood estimation of the weak instrumental variable, and the results are shown in model (7) in Table 5, where digital inclusive finance significantly reduces agricultural nonpoint source pollution at the 1% statistical level.
This study examines the impact of three dimensions of digital inclusion, including breadth of coverage, depth of use, and degree of digitization, on the intensity of agricultural non-point source pollution emissions. The results are shown in Table 6, the breadth of coverage, depth of use, and digitization of digital financial inclusion significantly reduce agricultural non-point source pollution at a statistical level of 10%, 10%, and 1%, respectively. The breadth of coverage allows digital financial inclusion to reach more users and provide financial support for farmers to carry out green agricultural production. Depth of use provides farmers with diversified financial services, such as payment services, credit services, investment services and insurance services, to provide them with financial support in multiple directions. The degree of digitization enhances the convenience of farmers’ access to funds and promotes the flow of capital factors in the rural scope. Among the three dimensions of digital financial inclusion, the degree of digitization has the highest abatement effect on agricultural non-point source pollution, which effectively reflects that the characteristics of the degree of digitization, such as convenience, low cost and credit, are important factors for the low-threshold advantage of digital financial inclusion.
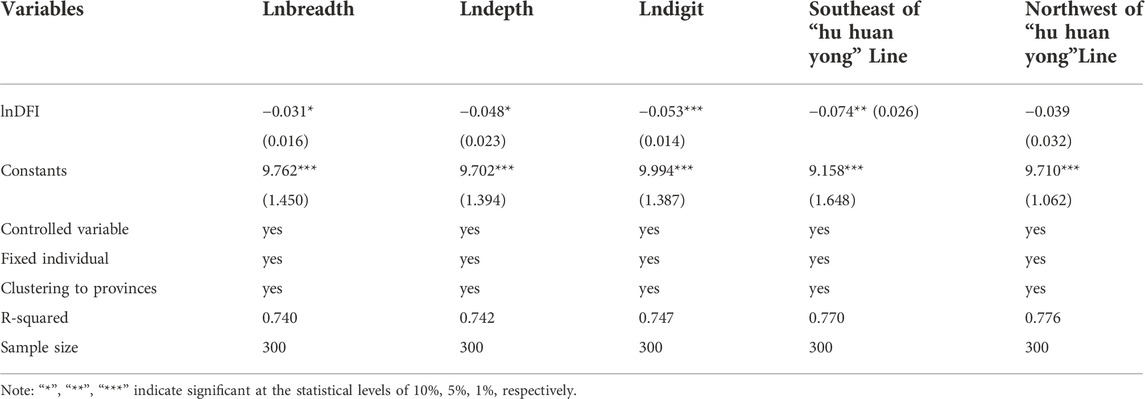
TABLE 6. Heterogeneity test results.
The “hu huan yong” line divides China into two regions, the southeast and the northwest, reflecting the differences in China’s population distribution and geographical environment, and is of great importance in geography and demography. The southeastern part of “hu huan yong” line has high population density, urbanization level is higher than the national average, and agriculture is mainly farming. The northwestern part of the line has low population density, the geographical structure is mostly grassland, desert and snow plateau, and the urbanization level is mostly lower than the national average. This study examines whether the impact of digital financial inclusion on agricultural non-point source pollution in the southeast and northwest of the “hu huan yong” line also follows population distribution and geographic differences. As shown in Table 6, the digital financial inclusion in the southeastern region of the “hu huan yong” line significantly reduces agricultural non-point source pollution at the 5% statistical level. The effect of digital financial inclusion on agricultural non-point source pollution in the northwestern part of the “hu huan yong” line is not significant. This may be due to the fact that the digital infrastructure in the northwestern part of the “hu huan yong” line is still incomplete, and farmers’ access to capital is still constrained by traditional finance, which also reveals that the digital infrastructure in the western part of the “hu huan yong” line should be strengthened to narrow the regional digital divide.
Table 7 shows the results of testing the moderating effect of farmers’ income structure on the role of digital financial inclusion in reducing agricultural nonpoint source pollution. As shown in Table 7, the interaction term between digital financial inclusion and farmers’ income structure on agricultural non-point source pollution is significant at 1% significant level and the sign of the regression coefficient is negative, indicating that farmers’ income structure plays a moderating effect in the effect of digital financial inclusion on agricultural non-point source pollution, and the higher the non-farm income of farmers, the stronger the effect of digital financial inclusion on agricultural non-point source pollution reduction. Thus Hypothesis 2 passes the test that the higher the non-agricultural income of farmers, the less dependent they are on agriculture and will be more likely to consider long-term benefits and choose green agricultural production methods after receiving digital financial inclusion support.
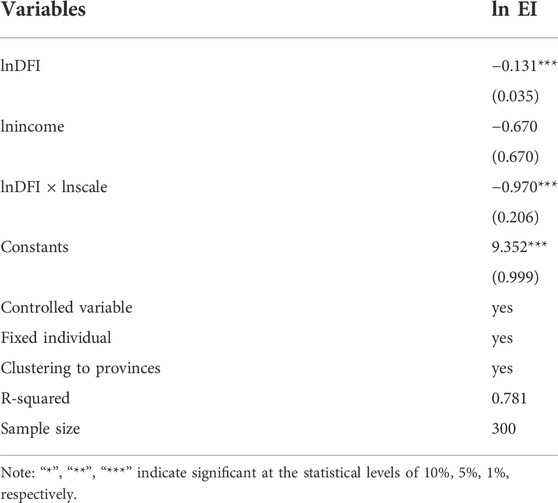
TABLE 7. Results of the test for moderating effects.
In addition to the negative linear relationship between digital financial inclusion on agricultural non-point source pollution verified by model (1) and model (2), this study further considers whether there is a non-linear relationship between the effects of digital financial inclusion on agricultural non-point source pollution abatement considering that the effects of digital financial inclusion on agricultural non-point source pollution abatement may be different for different levels of development in the context of non-equilibrium development of digital financial inclusion. Referring to Hansen (1999), a panel threshold model was constructed as follows:
In equation Eq. 4, lnDFIit denotes the level of digital financial inclusion development, which is the core explanatory variable of the model and also the threshold variable of the panel threshold model, γ denotes the threshold value to be estimated, I (·) denotes the exponential function, α denotes the correlation coefficient, and the other variables are consistent with the previous section.
Before conducting the panel threshold regression, it is necessary to determine whether there is a threshold effect, and if there is a threshold effect, the number of thresholds needs to be determined. Using the bootstrap method to determine the threshold number, the seed value was set to 500 and the results are shown in Table 8. As can be seen from Table 8, the p-value for the single threshold is 0.000, which is significant at the 1% statistical level, the p-value for the double threshold is 0.020, which is significant at the 5% statistical level, and the p-value for the triple threshold is not significant, so there is a double threshold.
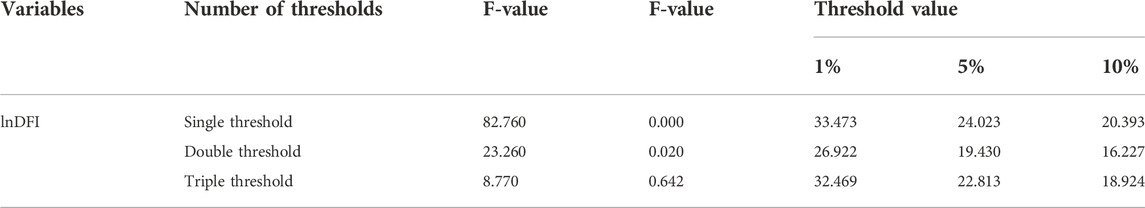
TABLE 8. Results of the threshold effect test.
After determining the existence of a double threshold, this study tested the single and double thresholds, and the results are shown in Table 9. The threshold value for the single threshold was 5.622 and did not lie within the interval [5.618, 5.622], and the threshold value for the dual threshold was 5.680 and lay within the interval [5.676, 5.680].
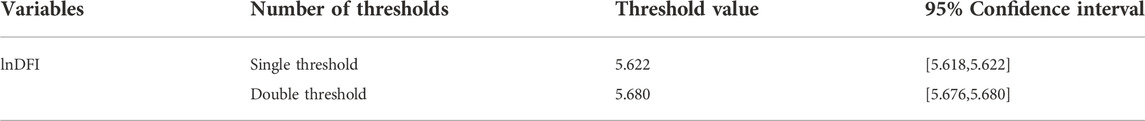
TABLE 9. Threshold estimation results.
Table 10 reports the results of the non-linear effects of digital financial inclusion on the intensity of agricultural non-point source pollution emissions. As can be seen from Table 10, there is a double threshold for the intensity of agricultural non-point source pollution emissions from digital inclusive finance. When digital financial inclusion is below the threshold (lnDFI ≤5.622), the emission reduction effect of digital financial inclusion on agricultural non-point source pollution is statistically significant at the 1% level with a coefficient of −0.113. When digital financial inclusion is between the threshold (5.622 < lnDFI ≤5.680), the emission reduction effect of digital financial inclusion on agricultural non-point source pollution is still statistically significant at the 1% level The coefficient is −0.128. When digital financial inclusion is greater than the threshold (lnDFI >5.680), the abatement effect of digital financial inclusion on agricultural non-point source pollution is increased, with a coefficient of −0141. The results show that with the improvement of the development level of digital financial inclusion, the effect of digital financial inclusion on agricultural non-point source pollution abatement will be gradually enhanced, and digital financial inclusion is expected to become a new tool for agricultural non-point source pollution abatement.
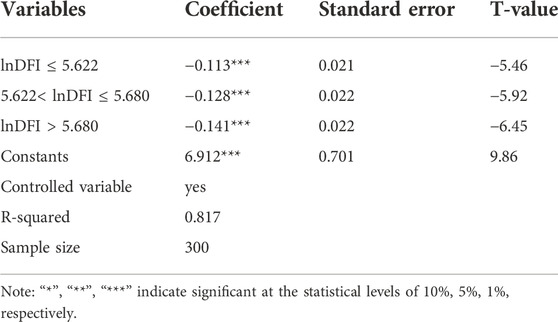
TABLE 10. Estimation results of the double threshold model.
This study constructs a fixed-effects model to analyze the impact of digital financial inclusion on agricultural non-point source pollution using a panel data of 30 Chinese provinces from 2011 to 2020 as a sample. It is found that 1) there is a significant abatement effect of digital financial inclusion on agricultural non-point source pollution. After robustness testing by replacing the explanatory variables, excluding municipalities directly under the central government, and excluding samples before 2013, the agricultural non-point source pollution abatement effect of digital financial inclusion remains significant. 2) The heterogeneity test shows that the three dimensions of digital financial inclusion, including breadth of coverage, depth of use, and degree of digitization, all have the effect of agricultural nonpoint source pollution reduction. The effect of digital financial inclusion on agricultural non-point source pollution reduction is significant in the southeastern region of the “hu huan yong” line, while the effect of digital financial inclusion on agricultural non-point source pollution is not significant in the northwestern region of the “hu huan yong” line. 3) The moderating effect test shows that the structure of farmers’ income has a moderating effect on the agricultural non-point source pollution abatement effect of digital financial inclusion, and the higher the farmers’ non-farm income, the stronger the agricultural non-point source pollution abatement effect of digital financial inclusion. 4) The emission reduction effect of digital financial inclusion on agricultural non-point source pollution is non-linear, with a double threshold, and its emission reduction effect on agricultural non-point source pollution will gradually increase as the level of development of digital financial inclusion increases.
Digital financial inclusion may become a new tool for agricultural non-point source pollution abatement and help rural development. Accordingly, the following recommendations are made. First, traditional financial institutions are encouraged to develop digital technologies to enable wider coverage of digital inclusive finance and innovative development of financial products and services. It allows digital inclusive finance to reach the countryside and provide better quality financial services to farmers. Guiding financial institutions to build innovative service platforms for finance and agriculture and environmental protection, and further exploiting the agricultural non-point source pollution reduction effect of digital financial inclusion. Secondly, the regulatory effect of the income structure of farmers should be brought into play to provide more financial products with low interest rates for farmers who are willing to start their own businesses and provide social services, and to guide farmers to reduce their business risks through agricultural insurance. Third, we should vigorously develop digital technology in the southeastern part of the “hu huan yong” line, strengthen the construction of digital infrastructure, eliminate the digital divide, and bring into play the role of township banks so that digital financial inclusion can benefit more farmers.
In the existing studies, the role of digital technology and financial instruments on the environment has been discussed, although it has not yet involved discussing the test of the effect of digital financial inclusion on the reduction of agricultural non-point source pollution. Ma et al. (2021) used fertilizer non-point source pollution as an example and found that agricultural insurance has an environmental protection effect, and the effect is higher in eastern China than in central and western China, a finding that is consistent with the findings of this study. Chen and Wang (2015) obtained different conclusions, they proposed that agricultural insurance increases agricultural non-point source pollution through scale benefits and reduces agricultural non-point source pollution through technology effects and structural effects, but they also found that in the effect of agricultural insurance on agricultural environment, the beneficiary regions tend to be more economically developed regions, which is consistent with the test of heterogeneity of this study. In addition, several studies have confirmed that digital financial inclusion has environmental protection effects (Yang et al., 2022; Zhu and Zhang, 2022). The conclusions obtained in this study are an effective supplement to the studies related to the agriculture environmental effects of digital financial inclusion, and the specific mechanisms of the agriculture environmental effects of digital financial inclusion can be further studied in depth in the future. In terms of testing the moderating effect, the findings of this study support that the higher the non-farm income of farmers, the stronger the emission reduction effect of digital financial inclusion on agricultural non-point source pollution. Xue et al. (2019) also focus on the moderating effect of non-farm income of farmers in a study on urbanization and agricultural non-point source pollution emission reduction, and found that an increase in the share of non-farm income can promote urbanization to exert the emission reduction effect of urbanization in eastern and western urbanization, and However, it can intensify the pollution effects of urbanization in central China. In subsequent studies, the effects of digital financial inclusion on the agricultural environment remain to be tested under different scenarios.
Although the study found that digital financial inclusion has an abatement effect on agricultural non-point source pollution, the conclusion can only be considered as a preliminary validation and has some limitations. First, on the measurement of digital financial inclusion, the index used in this study is from the Digital Finance Research Center of Peking University and the Ant Group Research Institute team, which has a wider recognition. However, the data compiled by this index comes from the Ant Group system, which is relatively single in terms of data sources. Second, in terms of the measurement of agricultural non-point source pollution, the measurement of agricultural non-point source pollution can be further extended in future studies due to the hidden and diverse sources of agricultural non-point source pollution. Third, this study finds a moderating role of farmers’ income structure in the role of digital financial inclusion in agricultural non-point source pollution reduction, but the mediating variables are to be further discovered. Fourth, this study uses provincial-level data in China, but in view of the relatively large variation within Chinese provinces, county-level data could be further considered for in-depth discussion in future studies.
All data are available via email from the corresponding author.
Conceptualization, QL; methodology, QL; software, QL; validation, QC; formal analysis, JZ; investigation, QC and QL; data curation, QL, and JZ; writing—original draft preparation, WL and QL; writing—review and editing, WL; funding acquisition, WL. All authors have read and agreed to the published version of the manuscript.
The first batch of 2022 Ministry of Education Industry-University Cooperation Collaborative Education Project (220500514205721); 2021 Fujian Provincial Social Science Planning Youth Project (FJ 2021C092); Fujian Agriculture and Forestry University on the 2018 National Research Project Cultivation Plan for Social Science (xpy201808).
The authors declare that the research was conducted in the absence of any commercial or financial relationships that could be construed as a potential conflict of interest.
All claims expressed in this article are solely those of the authors and do not necessarily represent those of their affiliated organizations, or those of the publisher, the editors and the reviewers. Any product that may be evaluated in this article, or claim that may be made by its manufacturer, is not guaranteed or endorsed by the publisher.
Ahmad, M., Jabeen, G., Shah, S. A. A., Rehman, A., Ahmad, F., and Işik, C. (2022). Assessing long- and short-run dynamic interplay among balance of trade, aggregate economic output, real exchange rate, and CO2 emissions in Pakistan. Environ. Dev. Sustain. 24, 7283–7323. doi:10.1007/s10668-021-01747-9
Cai, L., Wang, L., and Ning, M. (2022). Farmers’ livelihood differentiation and pesticide application: Empirical evidence from a causal mediation analysis. Sustainability 14, 8502. doi:10.3390/su14148502
Cai, S., and Li, J. (2011). Pesticide application intensity by farmers and its influences——based on the investigation data of farmers from major grain producing areas. Sci. Agric. Sin. 44, 2403–2410. doi:10.3864/j.issn.0578-1752.2011.11.025
Chakravarty, S. R., and Pal, R. (2013). Financial inclusion in India: An axiomatic approach. J. Policy Model. 35, 813–837. doi:10.1016/j.jpolmod.2012.12.007
Chen, B., and Zhao, C. (2021). Poverty reduction in rural China: Does the digital finance matter? PLoS ONE 16, e0261214. doi:10.1371/journal.pone.0261214
Chen, J., and Wang, H. (2015). Agricultural insurance and agricultural non-point source pollution: Influencing factors and their measurement --- scenario simulation based on simultaneous equations model. J. Shanghai Univ. Finance Econ. 17, 34–43+56. doi:10.16538/j.cnki.jsufe.2015.05.001
Chen, L., and Hu, W. (2020). Study on the synergistic effect of financial development, technological progress and carbon emissions--VAR analysis based on carbon emissions in 30 Chinese provinces from 2005-2017. Study & Explor., 117–124.
Chen, M., Chen, J., and Lai, S. (2006). Inventory analysis and spatial distribution of Chinese agricultural and rural pollution. CHINA Environ. Sci., 751–755.
Chen, Z., and Tan, W. (2022). On mechanism analysis and effect of digital economy on the promotion of high-quality economic development. J. Guangdong Univ. Finance Econ. 37, 4–20.
Cheng, Q., Xu, A., and Chen, Q. (2022). The realization path of agricultural carbon emission reduction under the background of “double carbon” target: Verification based on digital financial inclusion. J. Southwest Univ. Natl. 43, 115–126.
Chishti, M. Z., Alam, N., Murshed, M., Rehman, A., and Balsalobre-Lorente, D. (2022). Pathways towards environmental sustainability: Exploring the influence of aggregate domestic consumption spending on carbon dioxide emissions in Pakistan. Environ. Sci. Pollut. Res. 29, 45013–45030. doi:10.1007/s11356-022-18919-3
Fan, W. (2021). Does digital financial inclusion improve farmers’ access to credit? J. Huazhong Agric. Univ. Sci. Ed., 109–119. doi:10.13300/j.cnki.hnwkxb.2021.01.013
Fang, J., Wen, Z., Liang, D., and Li, N. (2015). Moderation effect analyses based on multiple linear regression. J. Psychol. Sci. 38, 715–720. doi:10.16719/j.cnki.1671-6981.2015.03.001
Gao, Q., Cheng, C., Sun, G., and Li, J. (2022). The impact of digital inclusive finance on agricultural green total factor productivity: Evidence from China. Front. Ecol. Evol. 10, 905644. doi:10.3389/fevo.2022.905644
Ge, J., and Zhou, S. (2012). Does factor market distortions stimulate the agricultural non-point source pollution? A case study of fertilizer. Issues Agric. Econ. 33, 92–98. doi:10.13246/j.cnki.iae.2012.03.001
Guo, F., Kong, T., and Wang, J. (2017). Analysis of the spatial agglomeration effect of Internet finance - evidence from the Internet finance development index. Stud. Int. Finance, 75–85. doi:10.16475/j.cnki.1006-1029.2017.08.008
Guo, F., Wang, J., Wang, F., Kong, T., Zhang, X., and Cheng, Z. (2020). Measuring China’s digital financial inclusion: Index compilation and spatial characteristics. China Econ. Q. 19, 1401–1418. doi:10.13821/j.cnki.ceq.2020.03.12
Guo, H., Gu, F., Peng, Y., Deng, X., and Guo, L. (2022). Does digital inclusive finance effectively promote agricultural green development?—a case study of China. IJERPH 19, 6982. doi:10.3390/ijerph19126982
Hansen, B. E. (1999). Threshold effects in non-dynamic panels: Estimation, testing, and inference. J. Econ. 93, 345–368. doi:10.1016/S0304-4076(99)00025-1
Hill, D. D., Owens, W. E., and Tchounwou, P. B. (2005). Impact of animal waste application on runoff water quality in field experimental plots. Int. J. Environ. Res. Public Health 8, 314–321. doi:10.3390/ijerph2005020017
Hong, M., Tian, M., and Wang, J. (2022). Digital inclusive finance, agricultural industrial structure optimization and agricultural green total factor productivity. Sustainability 14, 11450. doi:10.3390/su141811450
Hu, Z., and Li, Y. (2019). Dual effects and threshold characteristics of financial development on environmental pollution. Chin. Soft Sci. Mag., 68–80. doi:10.3969/j.issn.1002-9753.2019.07.007
Hua, C., Lu, Q., Jiang, Y., and Richard, W. (2013). A study on the effect of agricultural education and training programs on reducing agricultural surface source pollution--based on propensity score matching method. J. Agrotechnical Econ., 83–92. doi:10.13246/j.cnki.jae.2013.04.005
Huang, Q., Yu, Y., and Zhang, S. (2019). Internet development and productivity growth in manufacturing industry: Internal mechanism and China experiences. China Ind. Econ., 5–23. doi:10.19581/j.cnki.ciejournal.2019.08.001
Huang, Z., and Wang, P. (2022). The role of digital financial inclusion in the development of digital agriculture. Issues Agric. Econ., 27–36. doi:10.13246/j.cnki.iae.2022.05.007
Ji, X., Wang, K., Xu, H., and Li, M. (2021). Has digital financial inclusion narrowed the urban-rural income gap: The role of entrepreneurship in China. Sustainability 13, 8292. doi:10.3390/su13158292
Jiang, S., Qiu, S., Zhou, H., and Chen, M. (2019). Can FinTech development curb agricultural nonpoint source pollution? IJERPH 16, 4340. doi:10.3390/ijerph16224340
Jiang, S., Zhou, J., and Qiu, S. (2021). Can appropriate scale operation restrain agricultural non-point source pollution?——empirical study based on dynamic threshold panel model. J. Agrotechnical Econ., 33–48. doi:10.13246/j.cnki.jae.2021.07.003
Jiao, J., Huang, T., Wang, T., Zhang, S., and Wang, Z. (2015). The development process and empirical study of inclusive finance in China. Shanghai Finance, 12–22. doi:10.13910/j.cnki.shjr.2015.04.003
Jie, C., Wang, J., and Pang, Y. (2018). Agricultural growth and fertilizer surface pollution in China: Is there an environmental Kuznets curve? Rural. Econ., 110–117.
Lai, S., Du, P., and Chen, J. (2004). Evaluation of non-point source pollution based on unit analysis. J. TSINGHUA Univ. Technol., 1184–1187. doi:10.16511/j.cnki.qhdxxb.2004.09.009
Li, H., and Zhang, J. (2009). An empirical test on the EKC relationship between the agricultural non-point source pollution and economic development in China. Resour. Environ. Yangtze Basin 18, 585–590. doi:10.3969/j.issn.1004-8227.2009.06.015
Li, H., Zhuge, R., Han, J., Zhao, P., and Gong, M. (2022). Research on the impact of digital inclusive finance on rural human capital accumulation: A case study of China. Front. Environ. Sci. 10, 936648. doi:10.3389/fenvs.2022.936648
Li, M., Chen, L., and Shi, X. (2010). Empirical analysis on farmers’ non-agricultural employment and land use behavior: Allocation effect, multiple job holding effect and investment effect——based on household survey data in Jiangxi province in 2005. J. Agrotechnical Econ., 41–51. doi:10.13246/j.cnki.jae.2010.03.011
Li, X., Zhu, J., Gu, X., and Zhu, J. (2010). Current situation and control of agricultural non-point source pollution. China Popul. Resour. Environ. 20, 81–84. doi:10.3969/j.issn.1002-2104.2010.04.014
Liang, S., Jiang, N., and Gu, S. (2005). Analysis of farmers’ willingness to pay for environmental protection in urban water sources and the factors influencing it--Taking Miyun, a water source in the capital, as an example. Chin. Rural. Econ., 55–60.
Ma, J., Vu, A. T., Son, J. B., Choi, H., and Hazle, J. D. (2006). Analysis of fertilizer application and its influencing factors for food crops by farmers: An example from North China Plain. J. Magn. Reson. Imaging. 23, 36–41. doi:10.1002/jmri.20470
Ma, J., Yang, C., Cui, H., and Wang, X. (2021). The environmental effect and formation mechanisms of the promotion of agricultural insurance—from the perspective of non-point source pollution of chemical fertilizers in China. Insur. Stud., 46–61. doi:10.13497/j.cnki.is.2021.09.004
Ma, X., Che, X., Li, N., and Tang, L. (2019). Has cultivated land transfer and scale operation improved the agricultural environment? An empirical test on impact of cultivated land use on agricultural environment efficiency. China Land Sci. 33, 62–70. doi:10.11994/zgtdkx.20190603.091539
Nunn, N., and Qian, N. (2014). US food aid and civil conflict. Am. Econ. Rev. 104, 1630–1666. doi:10.1257/aer.104.6.1630
Ongley, E. D., Xiaolan, Z., and Tao, Y. (2010). Current status of agricultural and rural non-point source Pollution assessment in China. Environ. Pollut. 158, 1159–1168. doi:10.1016/j.envpol.2009.10.047
Ouyang, T. (2021). Theoretical deepening and tool extension of fiscal and tax legal governance of agricultural non-point source pollution. Acad. J. Zhongzhou, 56–62. doi:10.3969/j.issn.1003-0751.2021.10.010
Qin, T., Peng, J., Deng, Z., and Wang, J. (2021). Environmental decentralization, environmental regulation and agricultural non-point source pollution. China Popul. Resour. Environ. 31, 61–70.
Rehman, A., Alam, M. M., Alvarado, R., Işık, C., Ahmad, F., Cismas, L. M., et al. (2022). Carbonization and agricultural productivity in Bhutan: Investigating the impact of crops production, fertilizer usage, and employment on CO2 emissions. J. Clean. Prod. 375, 134178. doi:10.1016/j.jclepro.2022.134178
Rehman, A., Ma, H., Ozturk, I., and Ulucak, R. (2022). Sustainable development and pollution: The effects of CO2 emission on population growth, food production, economic development, and energy consumption in Pakistan. Environ. Sci. Pollut. Res. 29, 17319–17330. doi:10.1007/s11356-021-16998-2
Shen, Z., Liao, Q., Hong, Q., and Gong, Y. (2012). An overview of research on agricultural non-point source pollution modelling in China. Sep. Purif. Technol. 84, 104–111. doi:10.1016/j.seppur.2011.01.018
Shi, H., and Yi, M. (2020). Environmental regulation, non-agricultural part-time employment and agricultural surface pollution: The example of fertilizer application. Rural. Econ., 127–136.
Sun, B., Zhang, L., Yang, L., Zhang, F., Norse, D., and Zhu, Z. (2012). Agricultural non-point source pollution in China: Causes and mitigation measures. AMBIO 41, 370–379. doi:10.1007/s13280-012-0249-6
Sun, X., Yu, T., and Yu, F. (2022). The impact of digital finance on agricultural mechanization: Evidence from 1869 counties in China. Chin. Rural. Econ., 76–93.
Tamazian, A., Chousa, J. P., and Vadlamannati, K. C. (2009). Does higher economic and financial development lead to environmental degradation: Evidence from BRIC countries. Energy Policy 37, 246–253. doi:10.1016/j.enpol.2008.08.025
Tan, F., Wen, G., and Hu, X. (2021). Influence factors on farmers’ willingness to reduce chemical fertilizer based on the perspective of social embeddedness. Environ. Conform. Assess. 13, 168–175. doi:10.16868/j.cnki.1674-6252.2021.03.168
Wang, X., and He, G. (2020). Digital financial inclusion and farmers’ vulnerability to poverty: Evidence from rural China. Sustainability 12, 1668. doi:10.3390/su12041668
Wang, X. (2006). Management of agricultural nonpoint source pollution in China: Current status and challenges. Water Sci. Technol. 53, 1–9. doi:10.2166/wst.2006.033
Weimin, Z., Chishti, M. Z., Rehman, A., and Ahmad, M. (2022). A pathway toward future sustainability: Assessing the influence of innovation shocks on CO2 emissions in developing economies. Environ. Dev. Sustain. 24, 4786–4809. doi:10.1007/s10668-021-01634-3
Wu, Y., Feng, K., and Li, G. (2017). Population growth, structural adjustment and agricultural surface source pollution - an empirical study based on spatial panel STIRPAT model. J. Agrotechnical Econ., 75–87. doi:10.13246/j.cnki.jae.2017.03.008
Xia, Q., Li, D., and Zhou, H. (2018). Study on the influence of farmers concurrent business behavior on agricultural non-point source pollution. China Popul. Resour. Environ. 28, 131–138.
Xie, C., Huang, C., and Xu, H. (2021). Regional disparity and influencing factors of agricultural technology efficiency in China:based on dual constraint of agricultural carbon and agricultural non-point source pollution. Sci. Technol. Manag. Res. 41, 184–190.
Xu, Z., and Zhu, R. (2020). The impact of financial development on green total factor productivity and the analysis of its path:an empirical study from western China. J. Shanxi Univ. Soc. Sci. Ed. 43, 117–129. doi:10.13451/j.cnki.shanxi.univ(phil.soc.).2020.01.013
Xue, L., Liao, Z., and Wang, L. (2019). Urbanization and improvement of agricultural surface pollution: A spatial heterogeneity analysis based on the moderating effect of farmers’ income structure. Rural. Econ., 55–63.
Xue, L. (2019). Research on the impact of agricultural industry agglomeration on agricultural green development. Chengdu, China: Southwestern University of Finance and Economics. doi:10.27412/d.cnki.gxncu.2019.002449
Yan, C., Li, T., and Lan, W. (2016). Financial development, innovation and carbon emission. J. Financial Res., 14–30.
Yang, Y., Wu, L., Zhang, Q., and Wang, Y. (2022). The impact of digital financial inclusion on agricultural green growth: On the adjustment function of ural human capital investment. Inq. into Econ. Issues, 165–180.
Yu, N., and Wang, Y. (2021). Can digital inclusive finance narrow the Chinese urban-rural income gap? The perspective of the regional urban-rural income structure. Sustainability 13, 6427. doi:10.3390/su13116427
Zhang, Q., Song, J., and Qian, L. (2022). Digital inclusive finance and pro-poor growth. J. Manag. 35, 55–71. doi:10.19808/j.cnki.41-1408/f.2022.0026
Zhang, X., Wang, G., Zhang, J., and He, Z. (2019). Digital economy, financial inclusion, and inclusive growth. Econ. Res. J. 54, 71–86.
Zhang, Y.-J. (2011). The impact of financial development on carbon emissions: An empirical analysis in China. Energy Policy 39, 2197–2203. doi:10.1016/j.enpol.2011.02.026
Zhang, Y., and Peng, S. (2021). Digital financial inclusion and rural traditional financial institutions. J. South China Agric. Univ. Sci. Ed. 20, 14–26. doi:10.7671/j.issn.1672-0202.2021.03.002
Zhao, H., Zheng, X., and Yang, L. (2022). Does digital inclusive finance narrow the urban-rural income gap through primary distribution and redistribution? Sustainability 14, 2120. doi:10.3390/su14042120
Zhong, R., He, Q., and Qi, Y. (2022). Digital economy, agricultural technological progress, and agricultural carbon intensity: Evidence from China. IJERPH 19, 6488. doi:10.3390/ijerph19116488
Zhu, D., and Zhang, X. (2022). Research on the environmental effect of digital finance development in China and its influence mechanism. Collect. Essays Finance Econ., 37–46. doi:10.13762/j.cnki.cjlc.2022.03.007
Keywords: agricultural non-point source pollution, environmental pollution, digital financial inclusion, emission reduction, fixed effects model
Citation: Lin Q, Cheng Q, Zhong J and Lin W (2022) Can digital financial inclusion help reduce agricultural non-point source pollution?—An empirical analysis from China. Front. Environ. Sci. 10:1074992. doi: 10.3389/fenvs.2022.1074992
Received: 26 October 2022; Accepted: 21 November 2022;
Published: 07 December 2022.
Edited by:
Zhen Wang, Huazhong Agricultural University, ChinaReviewed by:
Ngo Thai Hung, University of Finance and Marketing, VietnamCopyright © 2022 Lin, Cheng, Zhong and Lin. This is an open-access article distributed under the terms of the Creative Commons Attribution License (CC BY). The use, distribution or reproduction in other forums is permitted, provided the original author(s) and the copyright owner(s) are credited and that the original publication in this journal is cited, in accordance with accepted academic practice. No use, distribution or reproduction is permitted which does not comply with these terms.
*Correspondence: Wenhe Lin, MjUzMDYyNzc1QHFxLmNvbQ==
Disclaimer: All claims expressed in this article are solely those of the authors and do not necessarily represent those of their affiliated organizations, or those of the publisher, the editors and the reviewers. Any product that may be evaluated in this article or claim that may be made by its manufacturer is not guaranteed or endorsed by the publisher.
Research integrity at Frontiers
Learn more about the work of our research integrity team to safeguard the quality of each article we publish.