 Siqi Gao
 Guotao Dong3,4*
 Xiaohui Jiang
94% of researchers rate our articles as excellent or good
Learn more about the work of our research integrity team to safeguard the quality of each article we publish.
Find out more
ORIGINAL RESEARCH article
Front. Environ. Sci. , 16 January 2023
Sec. Environmental Informatics and Remote Sensing
Volume 10 - 2022 | https://doi.org/10.3389/fenvs.2022.1072430
Surface vegetation represents a link between the atmosphere, water, and human society. The quality of the ecological environment in the upper and middle reaches of the Yellow River (UMRYR) has a direct impact on the downstream basin. However, only few studies have investigated vegetation changes in the UMRYR. Therefore, we used the coefficient of variation and linear regression analyses to investigate spatiotemporal variations in the normalized difference vegetation index (NDVI). Further, we used the geographical detector model (GDM) to determine the spatial heterogeneity of the NDVI and its driving factors and then investigated the factors driving the spatial distribution of the NDVI in different climatic zones and vegetation types. The results showed that the NDVI in the UMRYR was high during the study period. The NDVI was distributed in a spatially heterogeneous manner, and it decreased from the southeast to the northwest. We observed severe degradation in the southeast, mild degradation in the northwest and the Yellow River source region, and substantial vegetation recovery in the central basin. Precipitation and vegetation type drove the spatial distribution of the NDVI. Natural factors had higher influence than that of anthropogenic factors, but the interactions between the natural and anthropogenic factors exhibited non-linear and bivariate enhancements. Inter-annual variations in precipitation were the main natural factor influencing inter-annual NDVI variations, while precipitation and anthropogenic ecological restoration projects jointly drove NDVI changes in the UMRYR. This study provides a better understanding of the current status of the NDVI and mechanisms driving vegetation restoration in the UMRYR.
Vegetation plays a role in water conservation and soil preservation (Berendse et al., 2015). Global environmental changes are causing alterations in terrestrial vegetation and many regions of the globe are becoming greener (Zeng et al., 2018). Changes in vegetation are usually influenced by the surrounding environment, and changes in the vegetation structure affect ecological processes by influencing terrestrial atmospheric and water cycles (Forzieri et al., 2017) and are considered indicators of climate change (Flantua et al., 2016; Workie and Debella, 2018). Therefore, long-term regional monitoring of ground cover and studies on the factors that influence changes in vegetation coverage are critical. Currently, remote sensing technology is used to monitor global vegetation coverage. The normalized difference vegetation index (NDVI) is the most widely used indicator (Rousta et al., 2020) as it can eliminate the influence of various factors (solar altitude angle, atmosphere, etc.) on remote sensing images, and it is considered to be the best indicator of vegetation coverage (Zhou, 2014). The Moderate Resolution Imaging Spectroradiometer (MODIS) NDVI exhibits higher spatial resolution and accuracy for vegetation monitoring and has been widely used to study surface vegetation coverage at different spatial and temporal scales (Eckert et al., 2015; Zhang et al., 2017).
The Yellow River Basin is an important ecological security barrier in China, as well as an important area for anthropogenic activity and economic development, and it has a pivotal strategic position in the overall development and modernization of the country. Recently, the vegetation coverage in the Yellow River Basin has become a research focus (Jiang et al., 2015; Li et al., 2019). The upper and middle reaches of the Yellow River (UMRYR), particularly in the Loess Plateau area, experience frequent heavy rainfall and severe soil erosion, resulting in a riverbed that is higher than the ground surface in the lower reaches and a fragile ecological environment in the basin. Vegetation coverage is particularly important for soil and water conservation in regions with high slopes, loose soil, and heavy rainfall (Woznicki et al., 2020); therefore, it is critical to monitor vegetation changes in the UMRYR. Generally, changes in vegetation are considered to be the result of both natural and anthropogenic factors. However, these factors do not act independently on vegetation, but instead interact with each other. Traditional correlation methods can only detect linear relationships, thereby limiting their accuracy in determining the influence of NDVI factors. In contrast, the geographical detector model (GDM) proposed by Wang and Xu (2017) quantitatively detects spatial heterogeneity using variance. This method is not based on linear assumptions and can accurately identify interactions between factors; Shrestha and Luo (2017) believed that the GDM is more effective than Principal Component Analysis and Geographically Weighted Regression in determining the influence of explanatory variables. Thus, it is more suitable for investigating the drivers of spatial distribution of the NDVI, and it has been used in many studies worldwide (Wang et al., 2021; Peter et al., 2021; Zheng et al., 2021; Venkatesh et al., 2022).
Few studies of vegetation changes in the UMRYR have been conducted. Most existing studies have focused on the entire Yellow River Basin and examined the region-wide NDVI. The large topographic and climatic differences between the eastern and western UMRYR lead to very spatially heterogeneous vegetation distribution. This complex spatial heterogeneity results in a more complex response of the NDVI to its driving factors, and vegetation types respond differently to different factors. Therefore, it is important to understand the factors driving the NDVI of different vegetation types in the region to correctly understand the drivers of regional vegetation coverage. Moreover, previous studies of the NDVI in the UMRYR have mainly investigated natural factors such as climate (Lu et al., 2021), and anthropogenic factors such as land use (Wang et al., 2019), limiting the evaluation of other human activities that drive the NDVI. In addition, the spatial resolution of previous studies was relatively low and did not include data from recent years. Thus, they do not accurately reflect the current vegetation status.
Therefore, in this study, we selected MODIS NDVI data with a spatial resolution of 250 m and used the coefficient of variation and trend analysis to determine spatiotemporal variations in the NDVI in the UMRYR from 2000 to 2020 at both annual and growing season scales. We used the GDM to detect the spatial heterogeneity of the NDVI and its driving factors, and to study the factors driving NDVI in different climatic zones and vegetation types. The results of this study can provide a scientific basis for vegetation restoration in the UMRYR and help promote ecological protection and high-quality development in the Yellow River Basin.
The UMRYR (32°12′–41°50′ N, 95°53′–113°35′ E) (Figure 1) includes Qinghai, Sichuan, Gansu, Ningxia, Inner Mongolia, Shaanxi, Shanxi, and Henan provinces (autonomous regions) and has an area of 77.4 × 10⁴ km2, accounting for approximately 97% of the Yellow River Basin. The terrain in the basin is high in the west and low in the east, and the elevation difference from west to east occurs in three steps. The UMRYR is mainly located in the first and second steps. The first high-altitude step, with an average altitude of more than 4,000 m, is located in the northeastern Tibetan plateau, which is the source of the Yellow River. The second step, with an average altitude of 1,000–2000 m, occurs mainly on the Loess Plateau. The UMRYR mainly has a continental climate, owing to its large span from east to west, the topography and climatic characteristics differ between the east and west and include a southern temperate zone, a middle temperate zone, and a plateau climatic zone. The three main climate zones include nine secondary climate zones, and cover arid, semi-arid, and semi-humid regions. The watershed area contains huge climate differences for a variety of vegetation types. There are four main vegetation zones from west to east: the Tibetan Plateau vegetation zone, the desert zone, the steppe zone, and the deciduous broad-leaved forest zone. The watershed also experiences serious soil erosion, contains fragile ecosystems (Shi and Shao, 2000), and has spatially heterogeneous natural and socioeconomic conditions.
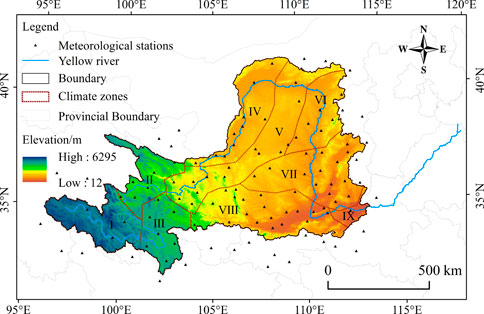
FIGURE 1. Map of the upper and middle reaches of the Yellow River Basin (I:Qingnan District; II: Qilian–Qinghai Lake District; III: Bomi–Chuanxi District; IV: Middle Temperate Zone Menggan District; V: Middle Temperate Zone Mengzhong District; VI: Middle Temperate Zone Mengdong District; VII: South Temperate Zone Jin–Shaanxi–Gan District; VIII: South Temperate Zone Weihe District; IX: South Temperate Zone Luhuai District).
In this study, MOD13Q1 NDVI data were used to analyze variations in the NDVI within the UMRYR. The MOD13Q1 NDVI data had a temporal resolution of 16 days and a spatial resolution of 250 m and were obtained from the NASA website (https://ladsweb.nascom.nasa.gov/). The maximum value composite (Holben, 1986) was used to produce monthly and annual NDVI data for 2000–2020. This method eliminated the effects of clouds, atmosphere, and solar altitude angle. April to October was selected as the vegetation growing season in the UMRYR (Ma et al., 2019), and the NDVI values from this period were averaged to produce the NDVI for each growing season. The NDVI values were divided equally into five vegetation coverage classes: low (≤ 0.2), medium-low (0.2–0.4), medium (0.4–0.6), medium-high (0.6–0.8), and high (> 0.8), to determine the spatial and temporal distributions of the NDVI.
Based on previous studies, we selected 18 factors that are representative, easily quantifiable, and accessible, as independent variables (Table 1). Topographic factors determine the redistribution of solar radiation and how much sunlight is received locally by the land surface, directly producing local climatic differences and affecting the spatial distribution of vegetation (Anderson et al., 2020). In this study, elevation, slope, and aspect were obtained from digital elevation model (DEM) data with a 30 m spatial resolution. Temperature is a limiting factor for vegetation growth, including mean, minimum, and maximum temperature (Buras et al., 2020). Precipitation is characterized by irregularity and seasonal variability, which is a particularly important factor in the distribution of the NDVI (Dagnachew et al., 2020). The number of hours of sunshine also affects vegetation growth (Saeed et al., 2017). The climate data were collected at 114 meteorological stations in and around the UMRYR (Figure 1) from 2000 to 2020 and interpolated using the inverse distance weighting method. Soil, vegetation, and landform types are important environmental factors that affect vegetation distribution (Peng et al., 2019). The anthropogenic factors selected for this study are indicators that have been shown by previous studies to quantify socioeconomic factors. Land use type is considered to be the most important anthropogenic factor influencing the NDVI (Bégué et al., 2011). Data related to roads, residences, and rivers were calculated using the Euclidean distance in ArcGIS (Liu et al., 2021). Data on GDP and population density, often used as indicators of the degree of human activity (Qin et al., 2022), were obtained by interpolating the statistical yearbooks of prefecture-level cities. The night-time light index is a quantitative indicator that can reflect the level of economic development, e.g., urbanization, and can effectively detect human activity. This index has been used to study the NDVI (Yang et al., 2019).
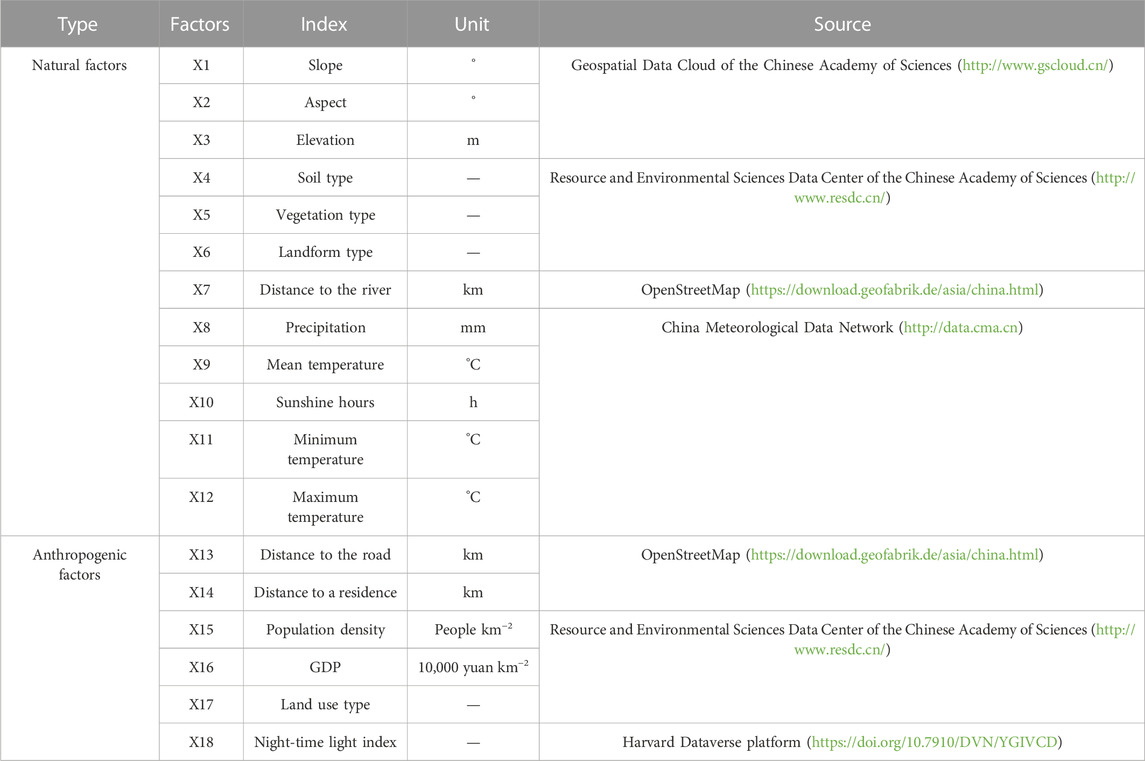
TABLE 1. Detection factors.
The independent variables in the GDM should be discrete quantities; thus, the driving factors must be classified. Slope was classified into 7 categories according to the Technical Regulations for Land Use Status Survey; aspect was classified into 9 categories according to slope orientation; soil type was classified into 16 categories according to the traditional “Soil Occurrence Classification” system; vegetation type was classified into 11 categories according to the 1:1,000,000 Chinese Vegetation Atlas; landform type was classified into 6 categories according to the 1:1,000,000 Landform Atlas of the People’s Republic of China; and land use type was classified into 8 categories according to the 1:1,000,000 Land Use Map of China. All other factors were classified according to the natural breakpoint method, which avoids artificially introduced interference, maximizes the difference between the classes (Chen et al., 2013), and is widely used to classify data for the GDM (Duan and Tan, 2020; Liu et al., 2021). The distances to the river and to the road were classified into 8 categories, and the remaining factors were all classified into 9 categories.
The above data were extracted according to the vector boundary of the UMRYR and were re-sampled to maintain the 250 m scale of the NDVI data. Using ArcGIS to create a fishnet tool, a 5 km × 5 km grid with 30,325 sampling points was generated for the entire region to spatially extract the attribute values.
The coefficient of variation (CV) can reflect the dispersion of the NDVI distribution and any fluctuations in the time series (Alavi and King, 2020). Larger CV values indicate a more heterogeneous vegetation coverage distribution, larger fluctuations in the time series data, and an unstable time series. Conversely, smaller CV values indicate a more concentrated vegetation coverage distribution and a more stable time series.
Linear regression analysis was used to analyze the trends of each image element in the images (Measho et al., 2019), which was then used to analyze the trends of the NDVI and climatic elements in the UMRYR from 2000 to 2020.
Pearson correlation analysis was used to investigate the correlation between the factors and dynamic NDVI changes (Kalisa et al., 2019).
The spatial distribution of geographic phenomena are heterogeneous, and the spatial distribution of the independent and dependent variables are similar when the independent variable has a significant influence on the dependent variable. The non-linear influences and interactions between the driving factors make it challenging to quantify the driving mechanisms (Piao et al., 2020). The GDM is a tool for detecting the spatial heterogeneities of geographic phenomena (Wang and Xu, 2017), and it uses spatial heterogeneity to identify its driving factors. In this study, we used the GDM to analyze the factors driving the spatial heterogeneity of vegetation distribution in the UMRYR.
(1) Factor detector
The factor detector can quantitatively detect the explanatory power of each factor on the spatial distribution of the NDVI, as expressed by the q statistic. The q value has a distinct physical meaning, indicating that factor X explains q × 100% of the spatial distribution of the NDVI. The q value ranges from 0 to 1 and a larger q value indicates a greater explanatory power of factor X on the NDVI (Wang et al., 2016).
(2) Interaction detector
Interactions also occur between geographic phenomena. For example, elevation affects temperature and precipitation changes. The interaction detector can identify the influence of interactions between different drivers on the dependent variable, as well as any relationships between the factors, which is an advantage of the GDM (Wang and Xu, 2017).
(3) Risk detector
A risk detector was used to determine whether there was a difference in the mean values of the dependent variables between two sub-regions (Wang, 2010). The sub-region with the larger NDVI value had the higher vegetation coverage.
(4) Ecological detector
The ecological detector was used to compare whether there was a significant difference between the effects of two factors on the spatial distribution of the NDVI (Wang, 2010).
The overall annual vegetation coverage in the UMRYR was high, with an annual average NDVI of 0.576 from 2000 to 2020. The middle reaches had a higher vegetation coverage than the upper reaches did. The NDVI values tended to be higher in the southeastern part of the UMRYR and lower in the northwestern part. High NDVI values were concentrated in the southeastern Yellow River source region, the Qilian Mountains in the western part of the basin, the Hetao Plain in the north, the Weihe Basin in Guanzhong, and the Lvliang Mountains in the east. The regions with low NDVI values were located in Inner Mongolia, northern Shaanxi, central Gansu, and central Ningxia provinces (Figure 2A). The NDVI was generally lower during the growing season than it was throughout the entire year. The average growing season NDVI from 2000 to 2020 was .426, and its distribution was consistent with that of the annual NDVI (Figure 2B).
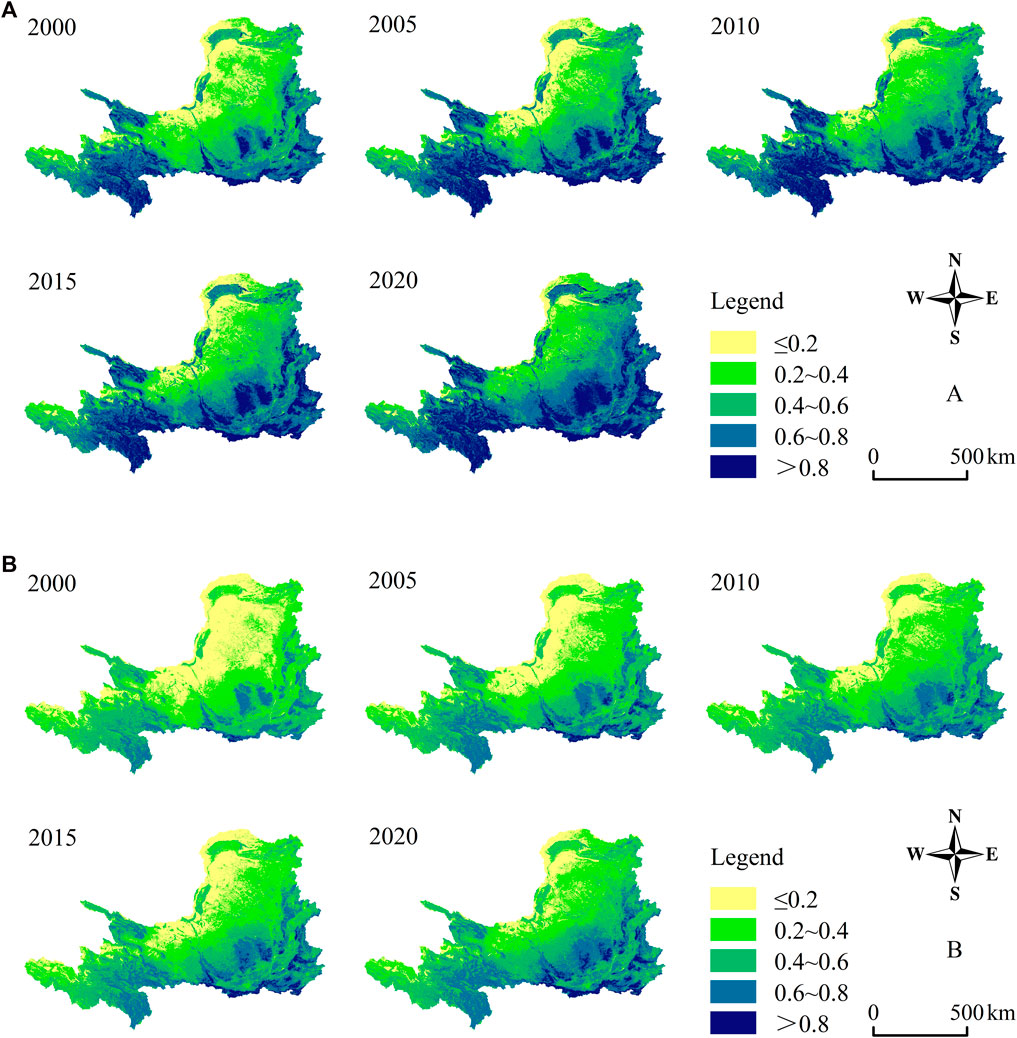
FIGURE 2. Spatial distributions of the (A) annual and (B) growing season NDVI.
The total area of the high and medium-high vegetation coverage regions (NDVI > 0.6) in the UMRYR increased from 36% to 62% from 2000 to 2020. The areas of both the high and medium-high vegetation coverage regions also increased substantially, while the total area of low and medium-low vegetation coverage regions (NDVI ≤ 0.4) decreased from 41% to 19% and the area of the low vegetation coverage region decreased substantially. Regions with low vegetation coverage transformed into medium-low vegetation coverage regions, medium-low vegetation coverage regions transformed into medium vegetation coverage regions, and so on. Thus, most of the vegetation coverage regions in each class shifted to a higher class, indicating that the vegetation coverage in the watershed improved (Figure 3A). Low, medium-low, and medium vegetation coverage (NDVI ≤ 0.6) regions dominated the watershed during the growing season. Although the total area of high and medium-high vegetation coverage regions increased over 21 years, this still only accounted for 27% of the total NDVI (Figure 3B).
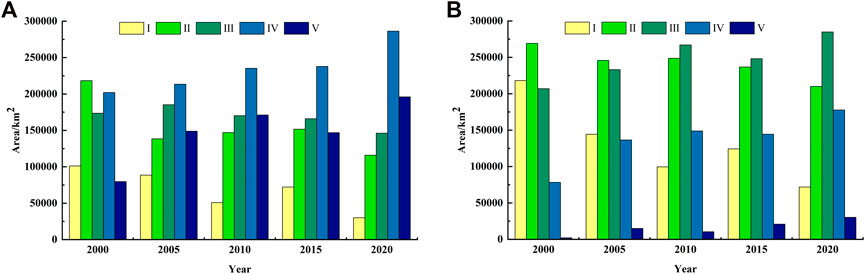
FIGURE 3. The (A) annual and (B) growing season NDVI values and areas of regions within each class. I: low vegetation coverage (0.0 < NDVI ≤0.2), II: medium-low vegetation coverage (0.2 < NDVI ≤.4), III: medium vegetation coverage (0.4 < NDVI ≤ 0.6), IV: medium-high vegetation coverage (0.6 < NDVI ≤0.8), V: high vegetation coverage (0.8 < NDVI ≤1.0).
The annual NDVI fluctuations were small during the past 21 years and the spatial coefficient of variation was relatively small. The coefficient of variation was less than 0.2 in most parts of the UMRYR, and the areas with the most variation were located in the steppe and desert regions of the basin (Figure 4).
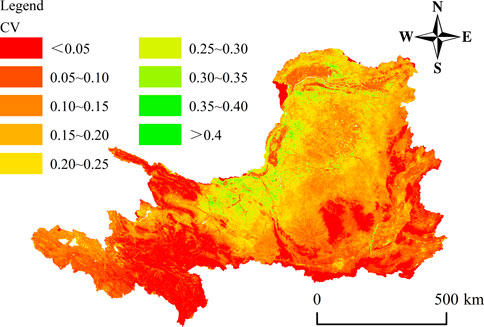
FIGURE 4. Spatial distribution of the coefficient of variation.
The degradation and improvements in vegetation coverage from 2000 to 2020 were clear. In the UMRYR, 43% of the areas with increased vegetation coverage were located in southeastern Gansu, southern Ningxia, and northern Shaanxi provinces in the central part of the basin, while 31% of the areas with reduced vegetation coverage, of which 27% was only slightly reduced, were concentrated in the Yellow River source region. The most serious vegetation degradation was observed in the southeastern part of the basin in Baoji, Xi’an, Weinan, Yuncheng, and other areas with a high degree of economic development (Figure 5).
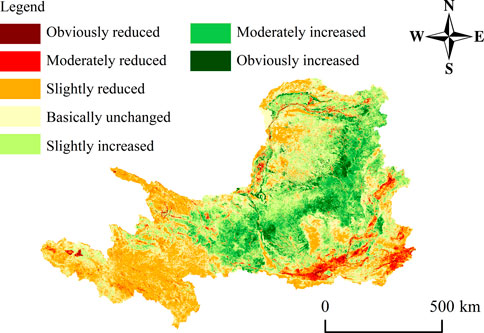
FIGURE 5. Spatial distribution of trends in the NDVI.
The growing season and annual NDVI changes from 2000 to 2020 both trended upward. The mean annual NDVI value increased from 0.488 to 0.631 (a rate of 0.048 (10 a)−1) and its minimum and maximum values occurred in 2000 and 2018 (0.488 and 0.636, respectively) (Figure 6A). The mean growing season NDVI value increased from 0.346 to 0.471 during the study period (a rate of 0.044 (10 a)−1) and its maximum and minimum values occurred in 2000 and 2018 (0.346 and 0.472, respectively) (Figure 6B). The annual and growing season NDVI trends and rates of change were approximately the same, even though the growing season NDVI was substantially lower than the annual NDVI. The significance test indicated that the trends in both the annual and growing season NDVI variations were significant (p < 0.05). The above results indicated that vegetation coverage in the UMRYR improved significantly from 2000 to 2020.
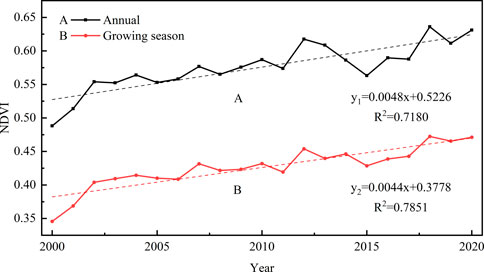
FIGURE 6. Temporal trends in the NDVI from 2000 to 2020. (A) Annual; (B)Growing season.
The magnitude of influence (q-value) of each factor on the spatial distribution of the NDVI in the UMRYR was obtained using the factor detector (Figure 7A). The influence of each driver on the NDVI was highly significant (p < 0.01). By comparing the q-values of the factors, we found that precipitation was the main factor driving the spatial distribution of the NDVI in the UMRYR, with an explanatory power of 51% for annual precipitation and 56% for growing season precipitation, both of which were much larger than the other factors. Precipitation was followed by vegetation type, which had an explanatory power of more than 40% for both annual and growing season NDVI distributions. Other factors had less than 30% explanatory power on an annual scale. During the growing season, the influence of minimum temperature was 34% and the influence of soil type was 31%. The influence of climatic factors (such as mean temperature, sunshine hours, and maximum temperature) decreased during the growing season, and the influence of precipitation and minimum temperature was greater on the growing season than on the annual NDVI distribution. The magnitude of the influence of each factor varied on different time scales. The overall influence of anthropogenic factors was smaller than that of natural factors, and among the anthropogenic factors, the influence of land use type was the largest at more than 20%.
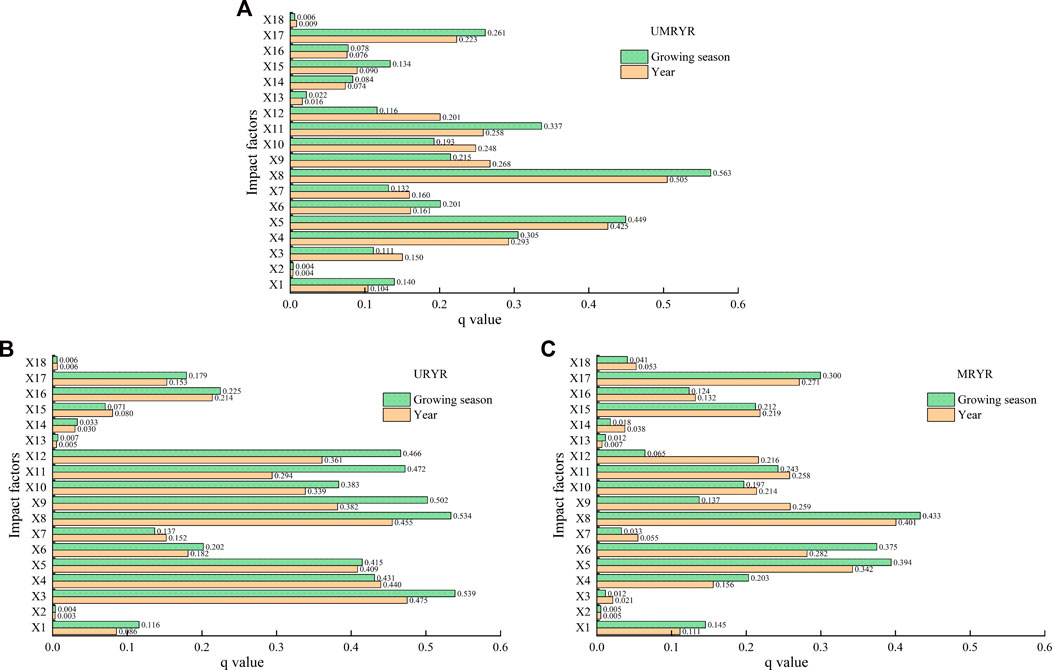
FIGURE 7. Detection factor q values [(A) UMRYR; (B) URYR; (C) MRYR].
The data revealed substantial differences between basins in the UMRYR. In the upper reaches of the Yellow River (URYR), elevation and precipitation were the main factors that influenced the NDVI spatial distribution. During the growing season, the influence of elevation and precipitation exceeded 50%. The influence of temperature factors (mean, maximum, and minimum temperatures) during the growing season was larger than that of the annual NDVI distribution (>45%), and the influences of the other factors were essentially the same (Figure 7B). In contrast, elevation had very little influence on the middle reaches of the Yellow River (MRYR), and precipitation was the main influencing factor (Figure 7C).
The q-values of the factors in 2000, 2005, 2010, 2015, and 2020 were investigated separately and their inter-annual changes were also analyzed. The influences of all factors changed very little, and the rankings of the influences did not change, indicating that the driving factors affecting the spatial distribution of the NDVI from 2000 to 2020 did not change substantially.
Ecological detection indicated that there were no significant differences between aspect and distance to the road and night-time light, elevation and landform type and distance to the river, landform type and distance to the river, minimum and mean temperatures and sunshine hours, distance to the road and night-time light, or distance to a residence and GDP. The other aspects were significantly different (p < 0.05) (Figure 8).
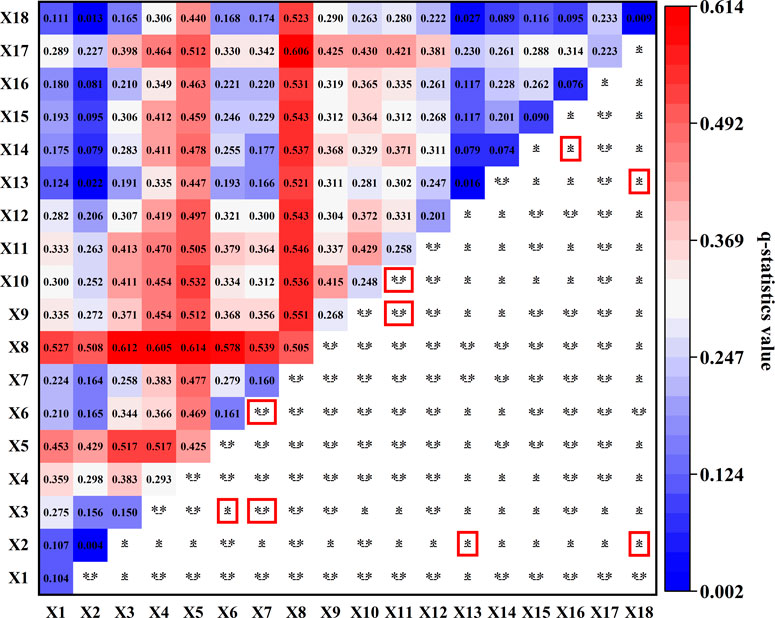
FIGURE 8. Interaction detection and ecological detection results. [Note: “*” and “**” indicate non-linear and bivariate enhancements of two factors, respectively; the red boxes indicate the absence of significant differences between the two factors (p < 0.05)].
The interaction detection results indicated that the explanatory power of the interactions between any two factors on the NDVI was larger than that of a single factor. In addition, the interactions between any two factors underwent non-linear or bivariate enhancement. Most of the study area experienced bivariate enhancement (Figure 8). The interactions between annual precipitation and other factors exceeded 50%, indicating that annual precipitation was the dominant factor driving the spatial distribution of the NDVI in the UMRYR. The interactions between annual precipitation and vegetation type had the highest q value (61%), while the interactions between vegetation type and the other factors all exceeded 40%, indicating that vegetation type also had a major influence on the NDVI. Some factors that had little influence on the NDVI when examined alone, substantially increased their influence on the NDVI when interacting with other factors. This indicated that some factors that had little direct influence on vegetation may influence vegetation growth under the combined effect of multiple factors.
The range and type of detection factors with better vegetation coverage are listed in Table 2. The implementation of the Grain to Green Program has transformed land with a slope greater than 25° into forests, thereby increasing vegetation coverage and effectively reducing regional soil erosion. These land areas were also less disturbed by human activity; thus, the NDVI values of regions in the UMRYR with slopes greater than 25° were high. The eastern, northwestern, and western slopes were all suitable for vegetation growth. The vegetation on these aspects was influenced by precipitation and was mainly composed of cultivated varieties. Compared to sunny slopes, shady slopes generally have lusher vegetation, less evaporation and more adequate water conditions, higher soil fertility, and better vegetation growth. The NDVI value varied with soil, vegetation, and landform types. The vegetation types in the regions with leached soil were mainly coniferous and broad-leaved forests, which contain sufficient soil moisture. A river can provide water for the vegetation in the surrounding area, which is conducive to its growth. Thus, the closer to the river, the higher the NDVI value. Additionally, the higher the annual precipitation, the higher the NDVI value, which reached 0.826 in the region with the highest precipitation. However, the NDVI value did not change substantially with an increase in annual mean temperature. The longer the sunshine hours, the smaller the NDVI value. Although the proper amount of light promotes photosynthesis, excessive solar radiation naturally decreases the NDVI. This is due to the decrease in moisture content caused by increased evapotranspiration. The NDVI trends for minimum and maximum temperature changes were consistent with that of the annual average temperature, indicating that temperature had little influence on the NDVI distribution throughout the year, yet played an important role during the growing season. The NDVI initially decreased, then increased with the distances to the road and to a residence. It reached a maximum in regions farthest from the road, indicating that road construction had a major influence on vegetation. The NDVI also reached maximums in regions with the smallest and largest distances to a residence. The regions farthest from a residence were less disturbed by human activity. The change trend of population density and the GDP was the same as above, indicating that human activity has not yet caused major disturbances to vegetation and that vegetation growth was better within a certain range. However, above a certain population density, excessive production activities may cause damage to vegetation growth. The NDVI was also influenced by changes in land use type, and vegetation coverage was the highest in forested land. Smaller night-time light intensity values yielded higher NDVI values. This also indicated that greater human activity disturbs vegetation more.
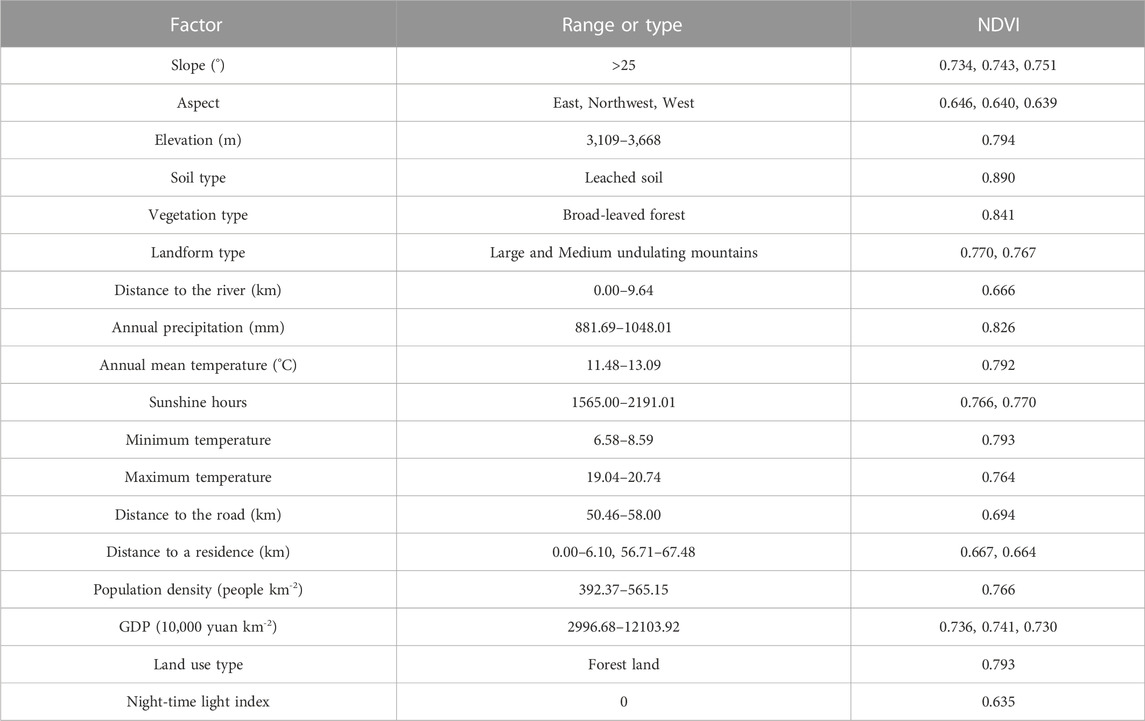
TABLE 2. Range or type of detection factor with better vegetation coverage.
To further investigate the relationships between climatic factors and changes in the NDVI, the correlations between temperature, precipitation, and the NDVI were determined (Figure 9). The annual precipitation and annual mean temperature increased at a rate of 4.940 mm (10 a)−1 and 0.243°C (10 a)−1, respectively. The correlation between the NDVI and temperature was 0.261, which explained 6.8% of the NDVI changes. The correlation between the NDVI and precipitation reached 0.700, with a 0.05 significance level, which explained 49% of the variations in the NDVI (p < 0.05). The correlations of the other climatic factors were all smaller. The NDVI and precipitation time series displayed the best consistency, and annual precipitation was both the main factor driving the spatial variability of vegetation and the main climatic factor driving the variations in the NDVI. The spatial distribution of annual precipitation and annual mean temperature changes are shown in Figures 10B, E. According to the spatial distribution of the correlations (Figures 10C, F), the changes in the NDVI were positively correlated with precipitation in Ningxia, Gansu, Inner Mongolia, and northern Shaanxi provinces, and with temperature in areas such as the Yellow River source region and the Qilian Mountains.
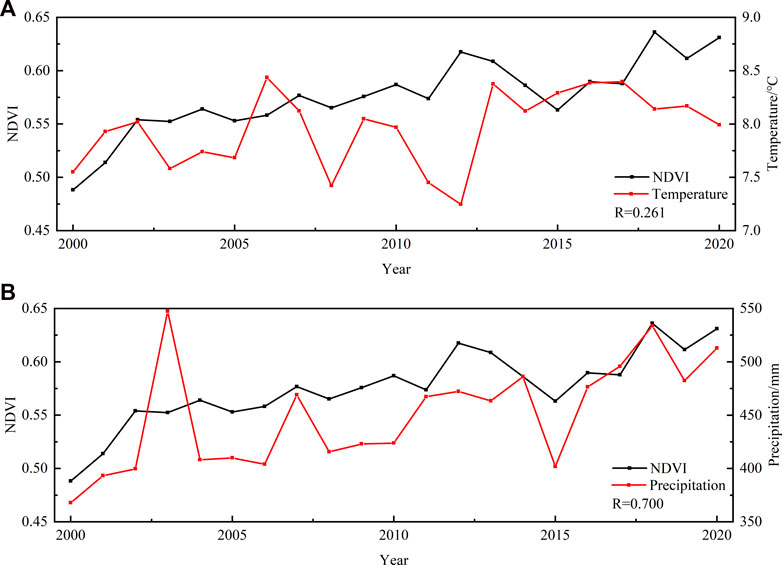
FIGURE 9. Temporal trends of annual mean temperature (A), annual precipitation (B), and NDVI.
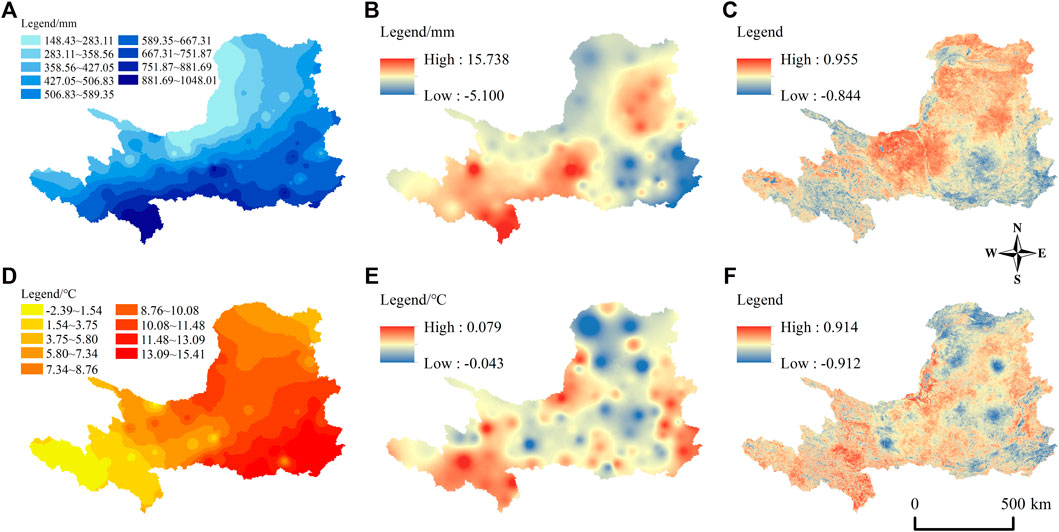
FIGURE 10. (A) Precipitation in 2020 (B) Precipitation trends (C) Correlation between the NDVI and annual precipitation (D) Mean temperature in 2020 (E) Annual mean temperature trends (F) Correlation between the NDVI and annual mean temperature.
In response to the effects of climate change and human activity, global vegetation greening programs have continued (Zhu et al., 2016). China is one of the countries that contributes the most to global vegetation greening (Luo et al., 2020), and the upper and middle reaches of the Yangtze and Yellow River basins exhibit the best vegetation recovery in China (Zhang and Ye, 2020). Major ecological protection and restoration projects implemented in the upper reaches of the Yellow River have curbed the trend of ecological degradation, restored important ecosystems, and strengthened the water-catching capacity through natural restoration and increased precipitation. The middle reaches have enhanced soil and water conservation through artificial ecological protection measures, including by returning farmland to forests and by planting trees according to local conditions (Wang et al., 2021). Effective methods of vegetation restoration in the Yellow River Basin can, therefore, be used as a reference for arid and semi-arid regions.
The NDVI in the UMRYR decreased approximately from a southeast to northwest direction, which is in alignment with the spatial distribution patterns of precipitation and vegetation types (Figure 10A; Figure 11). This also indicates the importance of the effect of precipitation and vegetation type on the spatial distribution of the NDVI. Desert and steppe regions are mainly distributed in the northwest, where the temperature is high and the precipitation is the lowest in the UMRYR. High temperatures accelerate evaporation, intensify drought, and reduce soil moisture (Peng et al., 2013), which is not conducive to vegetation growth; thus, the vegetation coverage is low. In contrast, the south and southeastern parts of the UMRYR had more favorable water and heat conditions, a prevalence of cultivated vegetation, and high vegetation coverage. Miao et al. (2012) found that the northwestern part of the UMRYR is mainly affected by wind erosion and the vegetation coverage is the lowest, while the northwestern part of the Yellow River source region is affected by freeze-thaw action and has low NDVI values. The region subject to water erosion was the largest and had the best vegetation coverage, which is consistent with the spatial distribution pattern of vegetation coverage obtained in this study.
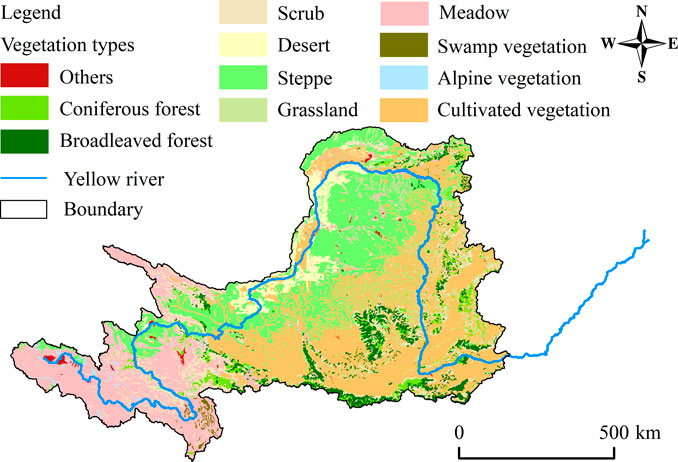
FIGURE 11. Spatial distributions of vegetation types in the UMRYR.
The spatial distribution of vegetation in the UMRYR is mainly influenced by precipitation, which is consistent with the findings of previous studies (Sun et al., 2002; Lu et al., 2021), and most regions in the study area are arid or semi-arid. Some studies have found that the NDVI in arid areas is highly correlated with precipitation (Djebou et al., 2015), which indicates that the results of this study are reliable. Based on the factor detection results, vegetation type clearly had a substantial influence on the spatial distribution of vegetation in the study area. Based on the analysis of spatial distribution maps (Figure 11), the spatial distribution of the NDVI was also aligned with the spatial distribution of vegetation types. The results of this study also indicate that different vegetation types respond differently to precipitation (Djebou et al., 2015). Therefore, we classified the climatic zones and vegetation types for further discussion.
According to the climatic zone divisions established by the China Meteorological Administration, the UMRYR contains nine zones (Figure 1). The climatic zones were divided according to moisture and heat, and the spatial distributions of the NDVI and moisture conditions in the basin were more similar than those of the NDVI and temperature. High NDVI values and high vegetation coverage were located in the humid and semi-humid climatic zones, while generally low NDVI values were located in the arid and semi-arid zones. In general, the climatic conditions in the southern temperate zone were relatively favorable, the vegetation was mostly cultivated vegetation, and the vegetation coverage was influenced by both positive and negative human activities. The middle temperate zone was more arid and water-scarce, and its vegetation was influenced by precipitation and soil moisture. The plateau climate zone had a higher altitude with relatively little human interference, and the spatial distribution of vegetation was influenced by topography, precipitation, and other natural conditions (Table 3).
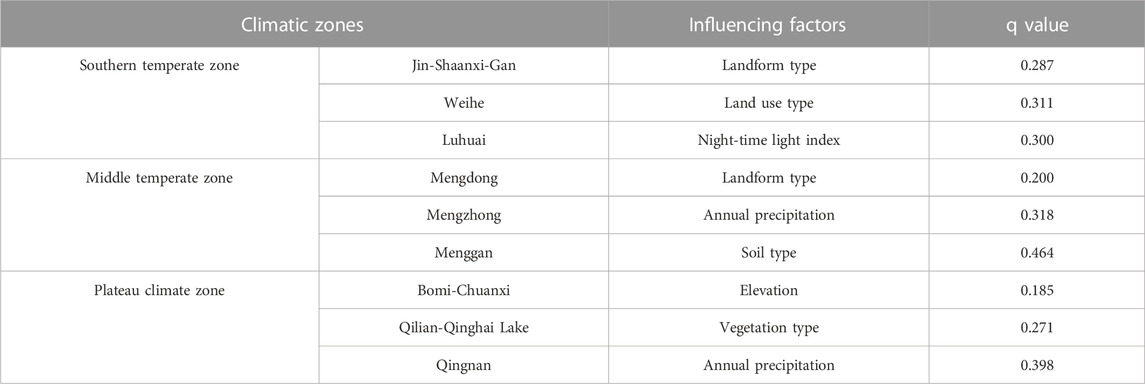
TABLE 3. Main influencing factors of the NDVI in different climatic zones.
The NDVI values increased for all vegetation types, with deserts, grasslands, and steppes exhibiting the largest increases. The NDVI of coniferous forest vegetation was mainly influenced by soil type, and the areas with leached and hydromorphic soils had high NDVI values due to their sufficient soil moisture and high natural fertility, both of which are suitable for coniferous forest growth. Broad-leaved forests were mainly located in the eastern and southern parts of the UMRYR, as well as in the Lvliang and Qinling Mountains and the North Luohe, Yanhe, and Weihe basins. Broad-leaved forests mainly grow in areas with abundant rainfall and sufficient sunshine, and they have specific precipitation and light requirements. Due to the arid climate, the scrubland area was very small and the influence of precipitation was evident in the presence of scrub in areas with good local moisture. The desert was located in the northwestern part of the watershed, containing low-lying areas with very few cold-tolerant, drought-resistant, and saline-tolerant plants. The desert was surrounded by steppes, which cover a large area of the watershed and experience low precipitation and high evaporation. Thus, the vegetation coverage in the desert and steppe regions was low due to the influence of precipitation. The CV results also indicated that the fluctuations of the NDVI in the steppe and desert regions during the last 21 years were large, the stability of the steppe and desert ecosystems was poor, and vegetation was easily changed by external environmental influences. Some studies have shown that steppes respond strongly to precipitation, followed by deserts in arid climates (Xu et al., 2018). The western region of the UMRYR belongs to the Tibetan Plateau vegetation zone, which has a high altitude, and climate and vegetation conditions that differ from those in the eastern region. The vast majority of the steppes were alpine meadows and alpine steppes, and the NDVI was influenced by elevation. Swamp and alpine vegetation were mainly distributed in a very small area of the Yellow River source region, whereas the largest area of cultivated vegetation was in the basin located in the middle reaches and was influenced by precipitation.
The watersheds comprising the upper reaches of the Yellow River are generally located at high altitudes. Altitude has a large influence on temperature and moisture, which may affect vegetation growth. The climate is also relatively cold and dry. Temperature has a very strong influence on vegetation growth during the growing season and higher temperatures can extend the length of the growing season, which is beneficial to vegetation growth (Wang et al., 2019). The middle reaches of the Yellow River are located on the Loess Plateau, where the climate is relatively dry and the precipitation has a strong influence. In general, the NDVI of the UMRYR was mainly influenced by natural factors, particularly climatic factors, and less influenced by human activity. However, although natural factors still dominated throughout the year and during the growing season, their magnitude of influence decreased and the influence of anthropogenic factors continued to increase from the upper to the middle reaches. Thus, the middle reaches were more disturbed by human activity than the upper reaches were.
The NDVI in the UMRYR increased from 2000 to 2020, which is consistent with the findings of previous studies (Wang et al., 2019; Lu et al., 2021). We determined that the inter-annual variations in the NDVI were influenced more by precipitation than they were by temperature, which is consistent with the findings of Zhang et al. (2021). Water is the main driver of biological processes in arid and semi-arid regions (Xu and Wang, 2016). The climate in the basin has become warmer and wetter over time, and NDVI values have increased in regions with increased precipitation. Serious decreases in the NDVI have also occurred in Baoji, Xi’an, Weinan, and Yuncheng in the southeastern part of the basin due to decreased precipitation and because these regions have higher degrees of economic development and, therefore, more anthropogenic disturbances. Since human activity influences the effect of precipitation on the NDVI (Sun et al., 2002), this scenario has produced a negative impact on the NDVI in these regions.
To support ecological restoration and to prevent ecological degradation, China established the Chinese National Nature Reserves (NNR), areas for the Three North Shelter Forest Program (TNSFP), and areas for the Natural Forest Protection Program (NFPP), in addition to other key ecological restoration projects (Lv et al., 2011). Of these projects, the most effectively implemented one was the NFPP in the upper and middle reaches of the Yellow River (Lv et al., 2015). The country initiated the Grain to Green Program (GTGP) in the upper and middle reaches of the Yellow and Yangtze River basins in 1999 to return farmland to forests and plant trees, with the goal of controlling soil erosion and improving the quality of the ecological environment (Song et al., 2014). The vegetation in the Yellow River Basin has recovered substantially and soil erosion has improved since the GTGP was implemented (Wu et al., 2019). As established herein, the upper reaches were mainly affected by natural factors, whereas the middle reaches were mainly affected by human activity. The forest construction projects in the middle reaches of the Yellow River have restored the vegetation in the region, and the ecological protection project has achieved good results (Jiang et al., 2021). The vegetation recovery in the middle reaches was better than that in the upper reaches, particularly in northern Shaanxi (Nie et al., 2021a; 2021b). The purpose of the ecological engineering projects in the Yellow River Basin was to prevent soil erosion and to improve vegetation coverage by enhancing precipitation and planting trees (Lu et al., 2021). The trend of the NDVI changes in the UMRYR has been dominated by very slow growth since the implementation of reforestation and ecological restoration projects in 1999, and the overall spatial patterns of vegetation coverage have improved. Precipitation is the main natural factor affecting vegetation changes, and changes in precipitation affect vegetation coverage in a subtle way. In addition, the role of anthropogenic ecological restoration projects was larger than the role of climatic factors after 2000. Human activity has both positive and negative effects on changes in vegetation coverage. The conversion of farmland to forests and grasslands promoted an increase in the NDVI, while surges in regional urbanization and industrialization, overgrazing, and deforestation led to a decrease in the NDVI. However, the positive effects were larger than the negative effects in the UMRYR, and the overall vegetation coverage increased due to the effective implementation of several ecological projects. Therefore, we assert that natural factors and human activity jointly drove changes in the NDVI, that precipitation was the main natural factor affecting the NDVI changes, and that ecological restoration projects played a driving role in the NDVI changes. These findings are similar to those of Wohlfart et al. (2016) and Li et al. (2017), while Liu et al. (2021) argued that climatic factors were more influential than human factors, mainly because the time scales studied differed and because climate is more sensitive to long-term NDVI. However, the study period used herein began in 2,000, and the benefits of ecological engineering projects appeared after 2,000, thereby indicating that the influence of anthropogenic factors on the NDVI changes increased gradually over time.
This study was the first to investigate the drivers of the spatial distribution of the NDVI in the UMRYR using the GDM, which can effectively detect the spatial heterogeneity of vegetation and interactions between factors (Peng et al., 2019), and can analyze the changes and factors driving NDVI in different vegetation types. In this study, we selected MOD13Q1 data with a high (250 m) spatial resolution, which were more accurate compared with data used in previous studies. However, the time series was limited; we only investigated the NDVI changes from 2000 to 2020, without making any comparisons with the NDVI values prior to the implementation of ecological projects in 2000. Quantifiable anthropogenic indicators are difficult to obtain, and quantitative studies of anthropogenic factors affecting changes in the NDVI could be more in-depth. The method and criteria for classifying the independent variables vary, which may lead to differences in the study results. To provide more effective suggestions for future vegetation restoration and sustainable development in the UMRYR, further research regarding the sustainability of vegetation changes is required.
In this study, MODIS NDVI data with a 250 m spatial resolution were used to analyze the spatiotemporal variations in the NDVI within the UMRYR from 2000 to 2020 using coefficients of variation and trend analysis. We also used the GDM to detect the spatial heterogeneity, driving factors, interactions between factors, and suitability of the NDVI. We found that the vegetation coverage in the UMRYR was high. The NDVI distribution was spatially heterogeneous, with the NDVI decreasing from southeast to northwest, and the NDVI in the central basin higher than that in the upper basin. The inter-annual variations in the NDVI were less volatile, and the trends of the growing season and annual NDVI values increased significantly from 2000 to 2020. In the southeastern part of the basin, the NDVI of the economically developed cities was severely degraded, while the NDVI of the northwestern part of the basin and the Yellow River source region was slightly degraded. In contrast, vegetation in the central part of the basin was restored. Precipitation and vegetation type were the main drivers of the spatial distribution of the NDVI in the UMRYR. The upper reaches were mainly influenced by elevation (48%). The middle reaches were mainly influenced by precipitation (40%). The influence of anthropogenic factors was much larger in the middle reaches than it was in the upper reaches, and the influence of natural factors throughout the basin was larger than that of anthropogenic factors. The factors influencing the NDVI varied by climatic zone and vegetation type. Inter-annual variations in precipitation were the main natural factor affecting inter-annual variations in the NDVI, and vegetation was effectively restored by the implementation of ecological restoration projects. This study provides a scientific basis for the future allocation of natural and human resources in the upper and middle reaches of the Yellow River. It also provided a reference for vegetation management in arid and semi-arid river basins at home and abroad. In the future, we will improve the existing classification methods and further investigate the sustainability of the NDVI in the upper and middle reaches of the Yellow River.
Publicly available datasets were analyzed in this study. This data can be found here: The data presented in this study are available on request from the corresponding author.
All authors contributed to the study conception and design. Conceptualization, SG; Methodology, SG; software, SG; validation, TN; formal analysis, TN; investigation, SG; resources, GD; data curation, SG; writing—original draft preparation, SG; writing—review, and editing, GD and XG; visualization, GD; supervision, GD; project administration, GD and XJ; funding acquisition, GD and XJ All authors have read and agreed to the published version of the manuscript.
This research was supported by the National Natural Science Fund (Grant numbers [51779099] and [51779209] and [51909099]), and the National key research and development plan (Grant numbers [2016YFC0402400]).
The authors declare that the research was conducted in the absence of any commercial or financial relationships that could be construed as a potential conflict of interest.
All claims expressed in this article are solely those of the authors and do not necessarily represent those of their affiliated organizations, or those of the publisher, the editors and the reviewers. Any product that may be evaluated in this article, or claim that may be made by its manufacturer, is not guaranteed or endorsed by the publisher.
Alavi, N., and King, D. (2020). Evaluating the relationships of inter-annual farmland vegetation dynamics with biodiversity using multi-spatial and multi-temporal remote sensing data. Remote Sens. 12, 1479. doi:10.3390/rs12091479
Anderson, K., Fawcett, D., Cugulliere, A., Benford, S., Jones, D., and Leng, R. (2020). Vegetation expansion in the subnival hindu kush himalaya. Glob. change Biol. 26 (3), 1608–1625. doi:10.1111/gcb.14919
Bégué, A., Vintrou, E., Ruelland, D., Claden, M., and Dessay, N. (2011). Can a 25-year trend in soudano-sahelian vegetation dynamics be interpreted in terms of land use change? A remote sensing approach. Glob. Environ. Change 21 (2), 413–420. doi:10.1016/j.gloenvcha.2011.02.002
Berendse, F., van Ruijven, J., Jongejans, E., and Keesstra, S. (2015). Loss of plant species diversity reduces soil erosion resistance. Ecosystems 18 (5), 881–888. doi:10.1007/s10021-015-9869-6
Buras, A., Rammig, A., and Zang, C, S. (2020). Quantifying impacts of the 2018 drought on European ecosystems in comparison to 2003. Biogeosciences 17 (6), 1655–1672. doi:10.5194/bg-17-1655-2020
Chen, J., Yang, S. T., Li, H. W., Zhang, B., and Lv, J. R. (2013). Research on geographical environment unit division based on the method of natural breaks (jenks). Remote Sens. Spatial Inf. Sci. 2013, 47–50. doi:10.5194/isprsarchives-xl-4-w3-47-2013
Dagnachew, M., Kebede, A., Moges, A., and Abebe, A. (2020). Effects of climate variability on normalized difference vegetation index (NDVI) in the gojeb river catchment, omo-gibe basin, Ethiopia. Adv. Meteorology 2020, 1–16. doi:10.1155/2020/8263246
Djebou, D. C. S., Singh, V. P., and Frauenfeld, O. W. (2015). Vegetation response to precipitation across the aridity gradient of the southwestern United States. J. Arid Environ. 115, 35–43. doi:10.1016/j.jaridenv.2015.01.005
Duan, Q. W., and Tan, M. H. (2020). Using a geographical detector to identify the key factors that influence urban forest spatial differences within China. Urban For. Urban Green. 49 (C), 126623. doi:10.1016/j.ufug.2020.126623
Eckert, S., Hüsler, F., Liniger, H., and Hodel, H. (2015). Trend analysis of MODIS NDVI time series for detecting land degradation and regeneration in Mongolia. J. Arid Environ. 113, 16–28. doi:10.1016/j.jaridenv.2014.09.001
Flantua, S. G. A., Hooghiemstra, H., Vuille, M., Behling, H., Carson, J. F., Gosling, W. D., et al. (2016). Climate variability and human impact in south America during the last 2000 years: Synthesis and perspectives from pollen records. Clim. Past 12 (2), 483–523. doi:10.5194/cp-12-483-2016
Forzieri, G., Alkama, R., Miralles, D. G., and Cescatti, A. (2017). Satellites reveal contrasting responses of regional climate to the widespread greening of Earth. Science 356 (6343), 1180–1184. doi:10.1126/science.aal1727
Holben, B. N. (1986). Characteristics of maximum-value composite images from temporal AVHRR data. Int. J. Remote Sens. 7, 1417–1434. doi:10.1080/01431168608948945
Jiang, L. G., Liu, Y., Wu, S., and Yang, C. (2021). Analyzing ecological environment change and associated driving factors in China based on NDVI time series data. Ecol. Indic. 129, 107933. doi:10.1016/j.ecolind.2021.107933
Jiang, W. G., Yuan, L. H., Wang, W. J., Cao, R., Zhang, Y. F., and Shen, W. M. (2015). Spatio-temporal analysis of vegetation variation in the Yellow River Basin. Ecol. Indic. 51, 117–126. doi:10.1016/j.ecolind.2014.07.031
Kalisa, W., Igbawua, T., Henchiri, M., Ali, S., Zhang, S., Bai, Y., et al. (2019). Assessment of climate impact on vegetation dynamics over East Africa from 1982 to 2015. Sci. Rep. 9 (1), 16865. doi:10.1038/s41598-019-53150-0
Li, J. J., Peng, S. Z., and Li, Z. (2017). Detecting and attributing vegetation changes on China’s Loess Plateau. Agric. For. Meteorology 247, 260–270. doi:10.1016/j.agrformet.2017.08.005
Li, Y., Xie, Z. X., Qin, Y. C., and Zheng, Z. C. (2019). Responses of the Yellow River Basin vegetation: Climate change. Int. J. Clim. Change Strategies Manag. 11 (4), 483–498. doi:10.1108/ijccsm-08-2018-0064
Liu, C. L., Li, W. L., Wang, W. Y., Zhou, H. K., Liang, T. G., Hou, F. J., et al. (2021a). Quantitative spatial analysis of vegetation dynamics and potential driving factors in a typical alpine region on the northeastern Tibetan Plateau using the Google Earth Engine. Catena 206, 105500. doi:10.1016/j.catena.2021.105500
Liu, H., Liu, F., and Zheng, L. (2021b). Effects of climate change and human activities on vegetation cover change in the Yellow River Basin. J. Soil Water Conservation 35 (4), 143–151. doi:10.13870/j.cnki.stbcxb.2021.04.02
Lu, C. P., Hou, M. C., Liu, Z. L., Li, H. J., and Lu, C. Y. (2021a). Variation characteristic of NDVI and its response to climate change in the middle and upper reaches of Yellow River Basin, China. IEEE J. Sel. Top. Appl. Earth Observations Remote Sens. 14, 8484–8496. doi:10.1109/jstars.2021.3105897
Lu, S. B., Cai, W. T., Shao, W., Taghizadeh-Hesary, F., Faisal, M., Zhang, H. B., et al. (2021b). Ecological water requirement in upper and middle reaches of the Yellow River based on flow components and hydraulic index. Int. J. Environ. Res. Public Health 18 (20), 10956. doi:10.3390/ijerph182010956
Luo, Y. Y., Yang, Y. T., Yang, D. W., and Zhang, S. L. (2020). Quantifying the impact of vegetation changes on global terrestrial runoff using the Budyko framework. J. Hydrology 590, 125389. doi:10.1016/j.jhydrol.2020.125389
Lv, Y. H., Fu, B. J., Wei, W., Yu, X. B., and Sun, R. H. (2011). Major ecosystems in China: Dynamics and challenges for sustainable management. Environ. Manag. 48 (1), 13–27. doi:10.1007/s00267-011-9684-6
Lv, Y. H., Zhang, L. W., Feng, X. M., Zeng, Y., Fu, B. J., Yao, X. L., et al. (2015). Recent ecological transitions in China: Greening, browning, and influential factors. Sci. Rep. 5 (1), 8732. doi:10.1038/srep08732
Ma, L. Q., Xia, H. M., and Meng, Q. M. (2019). Spatiotemporal variability of asymmetric daytime and night-time warming and its effects on vegetation in the Yellow River Basin from 1982 to 2015. Sensors 19 (8), 1832. doi:10.3390/s19081832
Measho, S., Chen, B. Z., Trisurat, Y., Pellikka, P., Guo, L. F., Arunyawat, S., et al. (2019). Spatio-temporal analysis of vegetation dynamics as a response to climate variability and drought patterns in the semiarid region, Eritrea. Eritrea. Remote Sens. 11, 724. doi:10.3390/rs11060724
Miao, C. Y., Yang, L., Chen, X. H., and Gao, Y. (2012). The vegetation cover dynamics (1982-2006) in different erosion regions of the Yellow River Basin, China. Land Degrad. Dev. 23 (1), 62–71. doi:10.1002/ldr.1050
Nie, T., Dong, G. T., Jiang, X. H., and Gu, J. H. (2021a). Spatiotemporal variation and driving forces of vegetation coverage in Yan′an area. Res. Soil Water Conservation 28 (5), 340–346. doi:10.13869/j.cnki.rswc.2021.05.039
Nie, T., Dong, G. T., Jiang, X. H., and Lei, Y. X. (2021b). Spatio-temporal changes and driving forces of vegetation coverage on the Loess Plateau of northern Shaanxi. Remote Sens. 13, 613. doi:10.3390/rs13040613
Peng, S. S., Piao, S. L., Ciais, P., Myneni, R. B., Chen, A. P., Chevallier, F., et al. (2013). Asymmetric effects of daytime and night-time warming on Northern Hemisphere vegetation. Nature 501 (7465), 88–92. doi:10.1038/nature12434
Peng, W. F., Kuang, T. T., and Tao, S. (2019). Quantifying influences of natural factors on vegetation NDVI changes based on geographical detector in Sichuan, Western China. J. Clean. Prod. 233, 353–367. doi:10.1016/j.jclepro.2019.05.355
Peter, P. O., Rashid, A., Nkinahamira, F., Wang, H., Sun, Q., Gad, M., et al. (2021). Integrated assessment of major and trace elements in surface and core sediments from an urban lagoon, China: Potential ecological risks and influencing factors. Mar. Pollut. Bull. 170, 112651. doi:10.1016/j.marpolbul.2021.112651
Piao, S. L., Wang, X. H., Park, T., Chen, C., Lian, X., He, Y., et al. (2020). Characteristics, drivers and feedbacks of global greening. Charact. drivers Feed. Glob. Green. 1 (1), 14–27. doi:10.1038/s43017-019-0001-x
Qin, X. M., Xia, W., Hu, X. X., and Shao, Z. (2022). Dynamic variations of cyanobacterial blooms and their response to urban development and climate change in Lake Chaohu based on Landsat observations. Environ. Sci. Pollut. Res. Int. 29 (22), 33152–33166. doi:10.1007/s11356-022-18616-1
Rousta, I., Olafsson, H., Moniruzzaman, M., Zhang, H., Liou, Y.-A., Mushore, T. D., et al. (2020). Impacts of drought on vegetation assessed by vegetation indices and meteorological factors in Afghanistan. Remote Sens. 12, 2433. doi:10.3390/rs12152433
Saeed, U., Dempewolf, J., Becker-Reshef, I., Khan, A., Ahmad, A., and Wajid, S. A. (2017). Forecasting wheat yield from weather data and MODIS NDVI using Random Forests for Punjab province, Pakistan. Int. J. Remote Sens. 38 (17), 4831–4854. doi:10.1080/01431161.2017.1323282
Shi, H., and Shao, M. G. (2000). Soil and water loss from the Loess Plateau in China. J. Arid Environ. 45 (1), 9–20. doi:10.1006/jare.1999.0618
Shrestha, A., and Luo, W. (2017). Analysis of groundwater nitrate contamination in the central valley: Comparison of the geodetector method, principal component analysis and geographically weighted regression. ISPRS Int. J. Geo-Information 6 (10), 297. doi:10.3390/ijgi6100297
Song, X. Z., Peng, C. H., Zhou, G. M., Jiang, H., and Wang, W. F. (2014). Chinese Grain for green program led to highly increased soil organic carbon levels: A meta-analysis. Sci. Rep. 4 (1), 4460. doi:10.1038/srep04460
Sun, R., Liu, C. M., and Zhu, Q. J. (2002). Dynamic change of net primary productivity and fractional vegetation cover in the yellow river Basin using multi-temporal AVHRR NDVI Data. J. Geogr. Sci. 12 (1), 29–34. doi:10.1007/bf02837424
Venkatesh, K., John, R., Chen, J. Q., Xiao, J. F., Amirkhiz, R. G., Giannico, V., et al. (2022). Optimal ranges of social-environmental drivers and their impacts on vegetation dynamics in Kazakhstan. Sci. Total Environ. 847, 157562. doi:10.1016/j.scitotenv.2022.157562
Wang, G. C., Huang, Y., Wei, Y. R., Zhang, W., Li, T. T., and Zhang, Q. (2019b). Inner Mongolian grassland plant phenological changes and their climatic drivers. Sci. Total Environ. 683, 1–8. doi:10.1016/j.scitotenv.2019.05.125
Wang, H., Yan, S. J., Liang, Z., Jiao, K. W., Li, D. L., Wei, F. L., et al. (2021a). Strength of association between vegetation greenness and its drivers across China between 1982 and 2015: Regional differences and temporal variations. Ecol. Indic. 128, 107831. doi:10.1016/j.ecolind.2021.107831
Wang, J. F., Li, X., Christakos, G., Liao, Y., Zhang, T., Gu, X., et al. (2010). Geographical detectors-based health risk assessment and its application in the neural tube defects study of the heshun region, China. Int. J. Geogr. Inf. Sci. 24 (1), 107–127. doi:10.1080/13658810802443457
Wang, J. F., and Xu, C. D. (2017). Geodetector: Principle and prospective. Acta Geogr. Sin. 72, 116–134. (In Chinese). doi:10.11821/dlxb201701010
Wang, J. F., Zhang, T. L., and Fu, B. J. (2016). A measure of spatial stratified heterogeneity. Ecol. Indic. 67, 250–256. doi:10.1016/j.ecolind.2016.02.052
Wang, W., Sun, L., and Luo, Y. (2019a). Changes in vegetation greenness in the upper and middle reaches of the Yellow River Basin over 2000-2015. Sustainability 11 (7), 2176. doi:10.3390/su11072176
Wang, Y. F., Chen, Y. P., Wang, H. J., Lv, Y. H., Hao, Y. B., Cui, X. Y., et al. (2021b). Ecosystem change and its ecohydrological effect in the Yellow River Basin. Bull. Natl. Nat. Sci. Found. China 35 (4), 520–528. doi:10.16262/j.cnki.1000-8217.2021.04.004
Wohlfart, C., Liu, G. H., Huang, C., and Kuenzer, C. (2016). A River Basin over the course of time: Multi-temporal analyses of land surface dynamics in the yellow River Basin (China) based on medium resolution remote sensing data. Remote Sens. 8, 186. doi:10.3390/rs8030186
Workie, T. G., and Debella, H. J. (2018). Climate change and its effects on vegetation phenology across ecoregions of Ethiopia. Glob. Ecol. Conservation 13, e00366. doi:10.1016/j.gecco.2017.e00366
Woznicki, S. A., Cada, P., Wickham, J., Schmidt, M., Baynes, J., Mehaffey, M., et al. (2020). Sediment retention by natural landscapes in the conterminous United States. Sci. Total Environ. 745, 140972. doi:10.1016/j.scitotenv.2020.140972
Wu, D., Zou, C. X., Cao, W., Xiao, T., and Gong, G. L. (2019). Ecosystem services changes between 2000 and 2015 in the Loess Plateau, China: A response to ecological restoration. PloS one 14 (1), e0209483. doi:10.1371/journal.pone.0209483
Xu, H. J., and Wang, X. P. (2016). Effects of altered precipitation regimes on plant productivity in the arid region of northern China. Ecol. Inf. 31, 137–146. doi:10.1016/j.ecoinf.2015.12.003
Xu, H. J., Wang, X. P., Zhao, C. Y., and Yang, X. M. (2018). Diverse responses of vegetation growth to meteorological drought across climate zones and land biomes in northern China from 1981 to 2014. Agric. For. Meteorology 262, 1–13. doi:10.1016/j.agrformet.2018.06.027
Yang, Y. J., Wang, S. J., Bai, X. Y., Tan, Q., Li, Q., Wu, L. H., et al. (2019). Factors affecting long-term trends in global NDVI. Forests 10 (5), 372. doi:10.3390/f10050372
Zeng, Z. Z., Piao, S. L., Li, L. Z. X., Wang, T., Ciais, P., Lian, X., et al. (2018). Impact of earth greening on the terrestrial water cycle. J. Clim. 31 (7), 2633–2650. doi:10.1175/jcli-d-17-0236.1
Zhang, C. Y., Guo, S., Guan, Y. N., Cai, D. L., and Bian, X. L. (2021). Temporal stability of vegetation cover across the Loess Plateau based on GIMMS during 1982-2013. Sensors 21 (1), 315. doi:10.3390/s21010315
Zhang, Y. H., and Ye, A. Z. (2020). Spatial and temporal variations in vegetation coverage observed using AVHRR GIMMS and Terra MODIS data in the mainland of China. Int. J. Remote Sens. 41 (11), 4238–4268. doi:10.1080/01431161.2020.1714781
Zhang, Y. L., Song, C. H., Band, L. E., Sun, G., and Li, J. X. (2017). Reanalysis of global terrestrial vegetation trends from MODIS products: Browning or greening? Remote Sens. Environ. 191, 145–155. doi:10.1016/j.rse.2016.12.018
Zheng, K. Y., Tan, L. S., Sun, Y. W., Wu, Y. J., Duan, Z., Xu, Y., et al. (2021). Impacts of climate change and anthropogenic activities on vegetation change: Evidence from typical areas in China. Ecol. Indic. 126, 107648. doi:10.1016/j.ecolind.2021.107648
Zhou, W., Gang, C., Chen, Y., Mu, S., Sun, Z., and Li, J. (2014). Grassland coverage inter-annual variation and its coupling relation with hydrothermal factors in China during 1982-2010. J. Geogr. Sci. 24 (4), 593–611. doi:10.1007/s11442-014-1108-0
Keywords: NDVI, spatial heterogeneity, spatiotemporal variations, driving factors, geographical detector model, upper and middle reaches of the yellow river
Citation: Gao S, Dong G, Jiang X, Nie T and Guo X (2023) Analysis of factors influencing spatiotemporal differentiation of the NDVI in the upper and middle reaches of the Yellow River from 2000 to 2020. Front. Environ. Sci. 10:1072430. doi: 10.3389/fenvs.2022.1072430
Received: 17 October 2022; Accepted: 07 December 2022;
Published: 16 January 2023.
Edited by:
Fang Chen, Aerospace Information Research Institute (CAS), ChinaReviewed by:
Dong Wang, Henan University, ChinaCopyright © 2023 Gao, Dong, Jiang, Nie and Guo. This is an open-access article distributed under the terms of the Creative Commons Attribution License (CC BY). The use, distribution or reproduction in other forums is permitted, provided the original author(s) and the copyright owner(s) are credited and that the original publication in this journal is cited, in accordance with accepted academic practice. No use, distribution or reproduction is permitted which does not comply with these terms.
*Correspondence: Guotao Dong, ZG9uZ2d1b3Rhb0BoaGdsai55cmNjLmdvdi5jbg==
Disclaimer: All claims expressed in this article are solely those of the authors and do not necessarily represent those of their affiliated organizations, or those of the publisher, the editors and the reviewers. Any product that may be evaluated in this article or claim that may be made by its manufacturer is not guaranteed or endorsed by the publisher.
Research integrity at Frontiers
Learn more about the work of our research integrity team to safeguard the quality of each article we publish.