 Kunming Li
 Xiao Liu
 Ying Bao2,3,4*
- 1Department of Architecture, Henan University of Technology, Zhengzhou, China
- 2School of Architecture, South China University of Technology, Guangzhou, China
- 3State Key Laboratory of Subtropical Building Science, South China University of Technology, Guangzhou, China
- 4Architectural Design and Research Institute Co., Ltd, South China University of Technology, Guangzhou, China
- 5Faculty of Architecture, The University of Hong Kong, Hong Kong, Hong Kong SAR, China
Considerations of urban microclimate and thermal comfort are necessary for urban development, and a set of guidelines for a comfortable microclimate must be developed. However, to develop such guidelines, the predictive ability of thermal indices for outdoor thermal perceptions under different design decisions must be defined. The present study aimed to determine suitable indices for assessing outdoor thermal reaction in humid subtropical residential areas of China. Five criteria of coefficients of determination, Spearman’s rho, percentage of correct prediction, percentage of thermal comfort indices’ class predictions, and distribution of thermal comfort indices’ class predictions per class of thermal sensation votes (TSV) were established to assess the performance of four thermal indices commonly used in outdoor thermal comfort research of China. The empirical thermal comfort index (TSVmodel) had a better correlation with TSV, while the Universal Thermal Climate Index (UTCI) was the most successful, simulating 29.8% of TSV. The testability of Physiologically Equivalent Temperature (PET) and Standard Effective Temperature (SET*) were very low, with the correct predictive ability 16.5% and 24.4% respectively. In the selected indices, the UTCI reasonably approximated the observed data for this study and was recommended to assess the outdoor thermal comfort for evaluating the thermal comfort level under different design decisions. For all the indices, the systematic errors were generally higher than the unsystematic errors, indicating that the assessment scales do not adapt to humid subtropical residential areas of China. It is necessary to establish the thermal sensation ranges of humid subtropical areas of China.
1 Introduction
Most of the world’s population lives in cities and is continuously becoming more urbanized (United Nation, 2019). By the end of 2021, the urbanization rate of China was 64.7% (China Bureau of Statistics, 2021), indicating more than 914.2 million people lived in cities. In the context of Chinese reality, most urban population live in concentrated residential areas. The outdoor space of residential area is an organic part of the city, and their quality provides comfort and healthy surroundings to city dwellers (Du and Xia, 2018; He, 2022) and contributes to the energy efficiency of buildings (Yang et al., 2014; Li et al., 2021; Li et al., 2022). Consequently, the creation of attractive outdoor spaces is one of the main tasks of planning designer. However, at the design stage, planners and architects face difficulties in assessing the impact of different design concepts on people’s perception. For the proposed difficulties, numerous thermal comfort indices have been developed to assess outdoor thermal comfort.
At present, commonly used thermal comfort indices for the valuation of outdoor thermal comfort could be divided into two groups of empirical and rational indices (Haghshenas et al., 2021). The former is derived from environmental variables and subjective estimates. One example is the correlation between subjective thermal sensation votes and measured microclimate parameters determined through multiple regression analysis. The rational indices are based on the heat balance equation of the human body. Common indicators for outdoor thermal comfort research are Predicted Mean Vote (PMV) (Fanger, 1970), Standard Effective Temperature (SET*) (Gagge et al., 1986), Outdoor Standard Effective Temperature (OUT_SET*) (Pickup and de Dear, 1999), Physiologically Equivalent Temperature (PET) (Höppe, 1999), and Universal Thermal Climate Index (UTCI) (Jendritzky et al., 2012). PMV, a heat balance model initially proposed by Fanger (1970), is more widely used for indoor conditions. SET* was developed by Gagge et al. (1986) based on Gagge’s two-node model. PET based on the Munich energy-balance human body model–MEMI was introduced by Höppe (1999). To cover wider range of outdoor weather conditions, the UTCI index was designed based on Fiala’s multi-node model (Jendritzky et al., 2012).
The existing standards and guidelines have no recommendations on which thermal comfort index is suitable for describing outdoor thermal comfort (Johansson et al., 2014; Fang et al., 2021; Haghshenas et al., 2021; Potchter et al., 2022). The choice of thermal index for outdoor thermal comfort evaluation has become a special research topic. In the Mediterranean climate, Tseliou et al. (2010) examined the ability of three indices, Discomfort index (DI), Cooling Power (CP), and PET, to describe the thermal sensation, illustrating that the performance of the three indices was limited. In an arid climate, Ruiz et al. (2015) demonstrated that there was a high contrast between subjective thermal sensation votes and the prediction results by six indices, including Temperature-Humidity Index (THI), Vinje’s Comfort Index (PE), Thermal Sensation (TS), PMV, PET, and COMFA outdoor thermal comfort models, indicating that all models’ testability was very low (below 25%). Pantavou et al. (2013) assessed the performance of numerous thermal indices to quantify the thermal sensation in Athens, Greece, demonstrating that the majority of the studied indices predicted approximately 35% of the thermal sensation votes. In severe cold area of China, Chen et al. (2020) compared the predictive ability of PET, SET*, and UTCI, demonstrated none of them applicable in predicting thermal perceptions. In cold region of China, Lai et al. (2014a) compared three different thermal comfort indices, PMV, PET, and UTCI, with the actual thermal reaction, proved that the UTCI provided a satisfactory outdoor thermal comfort prediction, while PMV overestimated it. In the hot-summer and cold-winter region of China, Wei et al. (2022) illustrated UTCI is better than PET for outdoor thermal comfort assessment. In Hong Kong, Ng and Cheng (2012) identified that PMV generally overestimated the thermal perception toward the warmer threshold in summer and vice versa in winter, recommended the use of PET as an alternative thermal index.
Residents in different regions have various thermal requirements due to climate adaptation (Lin, 2009). Furthermore, both psychological and physiological differences between ethnicities could influence human thermal perception (Lin, 2009). In addition, none of the mentioned thermal comfort models were built based on Chinese experimental studies. Furthermore, the yearly increase in the duration of hot weather in the humid subtropical areas of China (He et al., 2022; Yang et al., 2022) has a great impact on the use of outdoor space (Huang et al., 2022). Therefore, it is necessary to propose an adaptive model to quantify the correlations between urban microclimate and outdoor thermal sensation in humid subtropical residential areas of China and assess the effects of different design ideas on people’s comfort. Therefore, the performances of different thermal indices for predicting thermal sensation in humid subtropical residential areas of China were evaluated.
2 Material and methods
2.1 Field surveys
2.1.1 Sites
The database of this study was conducted in Guangzhou, China. It has a humid subtropical climate under the Kӧppen climate classification. The monthly mean air temperature varied slightly throughout the year, with a range of 13–29°C (Figure 1), indicating a hot summer and a warm winter. The monthly mean relative humidity was higher, being more than 60% all year.
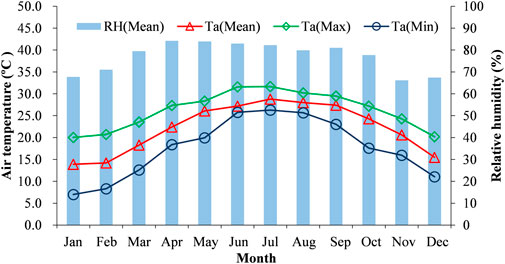
FIGURE 1. Monthly mean/maximum/minimum air temperature and mean relative humidity of Guangzhou based on the meteorological data from China Meteorological Administration and Tsinghua University (2005).
In order to obtain residents’ thermal sensation votes under different urban microclimates, field survey sites were selected to capture a wide range of thermal environment level in humid subtropical residential areas of China. Wind environment, direct solar radiation, reflected solar radiation and long wave radiation were considered comprehensively. Finally, eight sites were selected. The site features are shown in Figure 2. There were different microclimate conditions in the eight survey sites (e.g., shaded, sunlit, windy, windless, etc.). Thus, the observational data covered a wide range of thermal environment that people may encounter in humid subtropical residential areas of China.
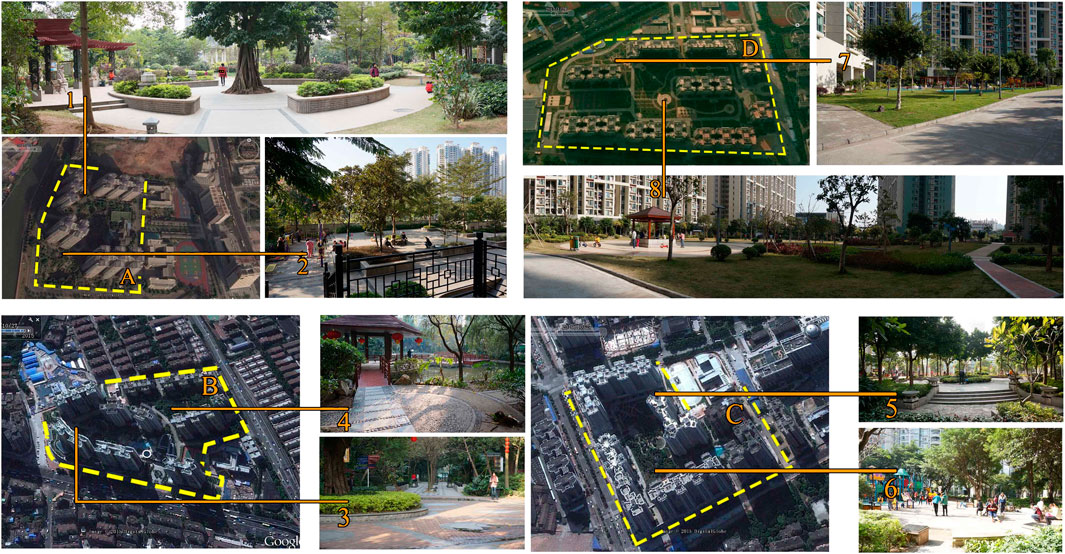
FIGURE 2. Sites configurations. Sites A1, B3, and B4 are shaded and windless; Site C5 is shaded and windy; Sites A2 and D7 are sunlit and windy; Sites C6 and D8 are sunlit and windless.
2.1.2 Questionnaire surveys
To obtain subjects’ thermal comfort conditions in all possible weather conditions appeared in the hot and humid area of China, the questionnaire survey was designed from the cold season to the hot season. Table 1 summarized the questionnaire surveys schedule on 24 days. The questionnaire surveys were performed during the timeframes of 8:00–12:00 and 14:00–18:00 in cold season and shoulder season, and 7:00–12:00 and 15:00–19:00 in hot season, when the outdoor space was commonly used. Each activity site was visited once a day in each season. Two spots were not surveyed in shoulder season because of continuous rainy days, and two sites were surveyed twice in hot season. 1,005 valid questionnaires were obtained in this study: 305 in cold season, 216 in shoulder season, and 484 in hot season. The samples had a good balance of sex ratio (45.3% male and 54.7% female). The age of the survey subjects varied from 8 to 64 years old (mean age of 33.2 years old).
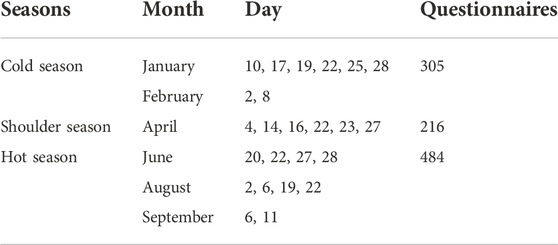
TABLE 1. Surveys schedule.
The questionnaire contained two parts. The first part was the subjects’ personal information covered age, gender, height, weight, clothing worn, activity level, and reasons for visiting a particular place. The second section involved thermal perception related voting contained thermal sensation votes (TSV), thermal comfort votes (TCV), thermal acceptance vote and preference vote. The TSV in this study adopted the 9-point scale (i.e., “very cold” −4; “cold” −3; “cool” −2; “slightly cool” −1; “neutral” 0; “slightly warm” +1; “warm” +2; “hot” +3; “very hot” +4). The TCV was rated on a 4-point scale (i.e., “comfortable” 0; “slightly uncomfortable” +1; “uncomfortable” +2; “very uncomfortable” +3). The conventional 4-point scale (i.e., “clearly acceptable” +1; “just acceptable” +0.01; “just unacceptable” -0.01; “clearly unacceptable” -1) was used for thermal acceptability. The preference vote involved air temperature, relative humid, wind speed, and global radiation and was given on a 3-point scale (i.e., “decrease” −1; “not change” 0; “increase” +1).
2.1.3 Physical measurement
During the questionnaire survey, microclimatic variables (i.e., air temperature (Ta); relative humidity (RH); wind speed (Va); globe temperature (Tg) and global radiation (G)) next to the interviewees were measured. Based on the recommended sensor height for standing subjects in ISO 7726 (ISO 7726, 1998), all instruments were placed at a height of 1.1 m above the ground. The accuracies of Ta sensor (HOBO Pro V2 U23-001), RH sensor (HOBO Pro V2 U23-001), Va sensor (HD32.3), Tg sensor (HD32.3) and G sensor (LP 471 PYRA 02.5) were ± 0.20°C, ± 2.5%, ± 0.15 m/s, ± 0.50°C and ± 5 W/m2, respectively. The ranges and accuracies of the instruments were all in accord with the ISO 7726 standard (ISO 7726, 1998). The Ta and RH sensors were shielded from solar irradiance with forced ventilation. On the measurement day, the thermal environment parameters were acquired at 1 min intervals.
2.2 Selected thermal indices and indices processing
In 2020, Li and Liu (2020) published a literature review article of 123 studies that investigated outdoor thermal comfort in China. The proportions of thermal indices applied in the reviewed publications are shown in Figure 3. The types of indices varied significantly among the studies. The most commonly used index was PET, followed by UTCI and SET*. In some outdoor thermal comfort studies of humid subtropical areas in China, local empirical thermal comfort index (TSVmodel) have been developed through multiple linear regressions between actual thermal sensation votes and some microclimatic variables (Table 2). Therefore, the present study selected PET, SET*, UTCI, and TSVmodel as the comparison indices.
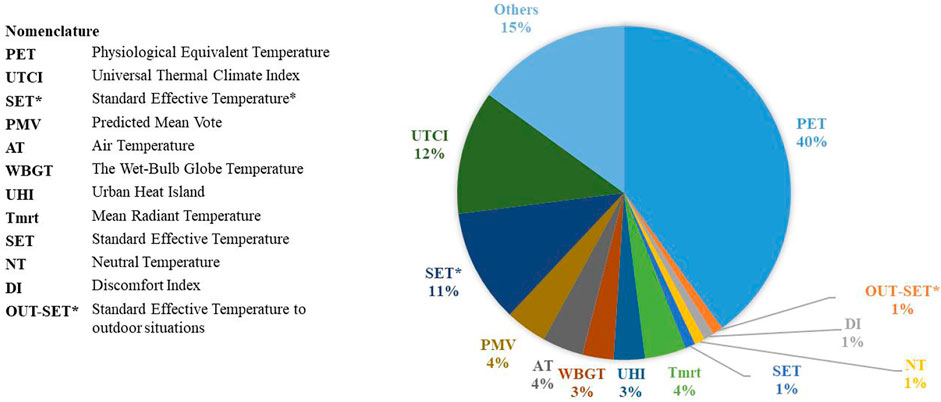
FIGURE 3. Frequency of thermal comfort indices application in outdoor thermal comfort studies of China. *Data from (Li and Liu, 2020)
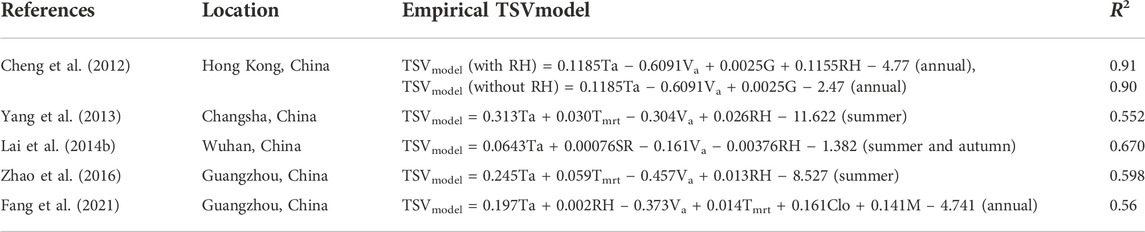
TABLE 2. Thermal comfort regression models in humid subtropical areas of China.
Table 3 shows the selected thermal indices sorted by name and key parameters and the formulas or models for their calculation in the present study. The UTCI was calculated using “UTCI calculator” provided on the www.utci.org website (Bröde et al., 2012). PET was calculated using the RayMan software (Matzarakis et al., 2007). SET* was calculated using MATLAB code. All the thermal indices were calculated using the measured parameters 3-min average, as this was the estimated time for completing a questionnaire. The empirical thermal comfort index based on the annual data was selected as the TSVmodel. The annual TSVmodel in Guangzhou (Fang et al., 2021) was based on the voting of young college students. Therefore, the selected TSVmodels was the empirical formula of Hong Kong (Cheng et al., 2012) located in the same climate zone as Guangzhou. The TSVmodel (with RH) considered four microclimate variables, including air temperature, relative humidity, wind speed, and solar radiation, while the TSVmodel (without RH) considered three microclimate variables, air temperature, wind speed, and solar radiation. The following equation was used to correct the wind speed at 10 m height.
Where: Vm is the wind speed at the desired height (m/s), Va is the measured wind speed (m/s), Hm is the desired height (m), and Ha is the measurement height 1.1 m.
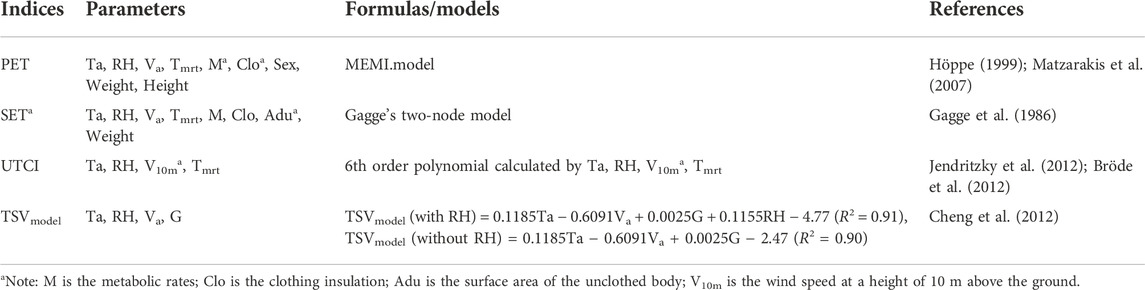
TABLE 3. Thermal indices along with the key parameters and the formulas or the models for their calculation.
The mean radiant temperature (Tmrt) is one of the most important variables for calculating PET, SET*, and UTCI. Tmrt is calculated from the measured globe temperature combined with measurements of wind speed and air temperature according to the following formula (Thorsson et al., 2007):
where Va is the measured wind speed (m/s), Ta is the air temperature (°C), Tg is the globe temperature (°C), D is the globe diameter (m), and ɛ is the globe emissivity.
2.3 Data analysis
2.3.1 Three statistical and two qualitative criteria
Three statistical and two qualitative criteria were selected and established to verify the performance of thermal indices for quantifying outdoor thermal sensations (Monteiro and Alucci, 2006): 1) the coefficient of determination between the thermal comfort indices’ parameters and TSV, 2) the Spearman’s rho correlation coefficient between the thermal comfort indices value and TSV, 3) the percentage of correct predictions, 4) the percentage of thermal comfort indices’ class predictions, and 5) the distribution of thermal comfort indices’ class predictions per class of TSV, assessed by cross-tabulation analysis.
The first coefficient of determination illustrated the possible potential of the model, indicating how well the model variables vary in function with variations in thermal responses. The second correlation verified the sensibility of the indices, showing how well the results of thermal comfort indices vary in function to variations in thermal responses. It has been argued that the coefficient of determination and Spearman’s rho correlation coefficient are often inappropriate or misleading when comparing model-predicted and observed variables (Potchter et al., 2022). The relationship between the coefficient of determination and Spearman’s rho correlation coefficient and model performance was not always consistent. Therefore, other evaluation criteria must be introduced. The last three criteria were selected to indicate the performance of the indices, focusing on the compare of coincidence between the prediction by the selected thermal indices and the actual thermal sensation votes perceived by the interviewees.
2.3.2 Thermal comfort indices’ assessment scales
To apply the last three criteria, assessment scales for thermal comfort indices should be established. Table 4 lists the assessment scales of the selected thermal comfort indices. The assessment scales were established on the basis of earlier comfort researches: reasonable estimate threshold on thermal perception and the neutral temperature of previous studies in humid subtropical areas of China (de Dear and Brager, 1998; Lin and Matzarakis, 2008; Lin et al., 2011; Huang et al., 2016). The neutral PET was 27.17°C (Lin and Matzarakis, 2008), suggesting the neutral range was from 27.17 − 3.00 to 27.17 + 3.00, or simply 24–30°C. Correspondingly, the range of feeling “slightly warm” +1 was obtained through a 6°C increase of the range of “neutral” 0; and “slightly cool” –1 was obtained through a 6°C decrease of the “neutral” 0 range. The neutral SET* values were 28°C and 29.3°C in the cool and hot seasons, respectively (Lin et al., 2011). The SET* assessment scales were calculated based on neutral SET* 29°C. The assessment scales of the UTCI were calculated based on the neutral UTCI 19°C (Huang et al., 2016). Finally, the TSVmodel’s assessment scales were set by the values ± 0.5, ±1.5, and ±2.5.
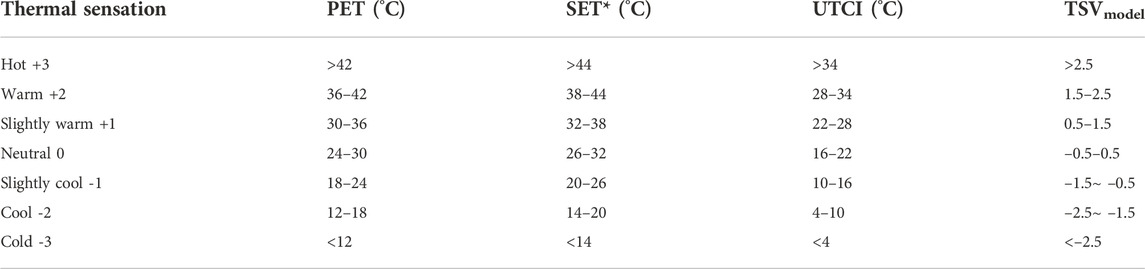
TABLE 4. Assessment scales of selected thermal indices.
The analysis was further performed using IBM SPSS software. All variables presented in the following paragraphs were statistically significant at a confidence level equal to or less than 0.05 (Sig. ≤ 0.05).
3 Results and discussion
3.1 Microclimate conditions
The minimum, maximum, means, and standard deviations of the measured variables (including Ta, RH, Va, and Tmrt) as well as the calculated thermal indices PET, UTCI and SET* were summarized in Table 5. Ta ranged between 14.7 and 38.3°C, which indicates that Guangzhou was climatically characterized by a hot summer and a warm winter. The variations in RH and Tmrt were significant throughout the year, as indicated by their standard deviations, with 17.9% and 7.7, respectively. RH ranged between 15.7 and 99.4% with an average value of 62.6% indicating relatively high humidity during the surveys. The variation in Va was also significant, ranging between 0.0 and 3.9 m/s.
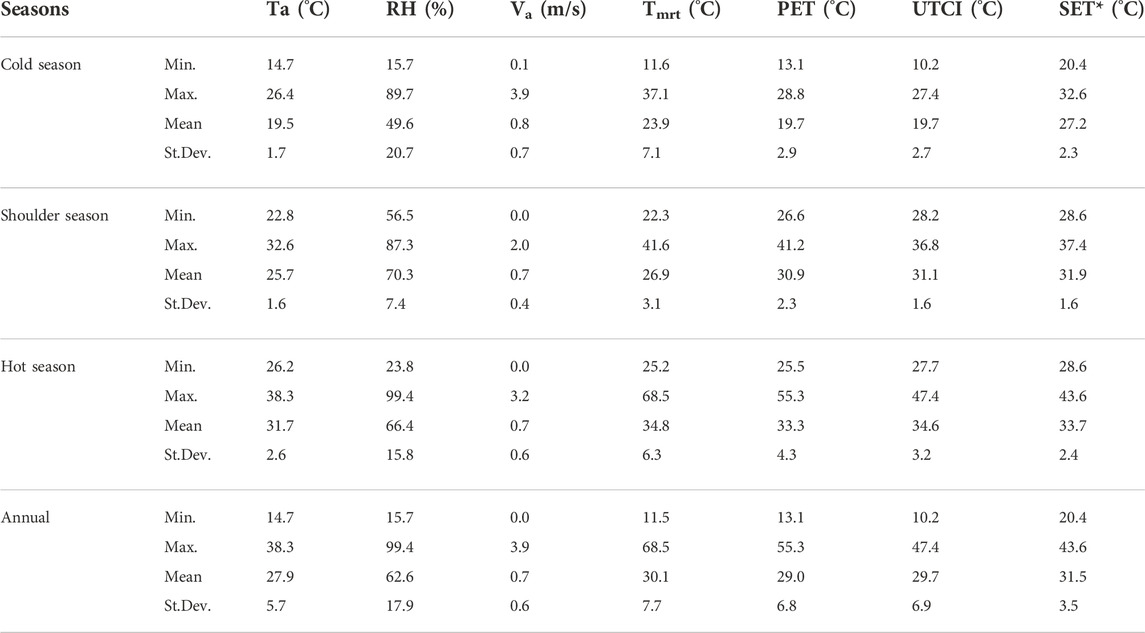
TABLE 5. The statistical results of the microclimate parameters.
3.2 Outdoor thermal sensation
In the present study, the 9-point scale (i.e., “very cold” −4; “cold” −3; “cool” −2; “slightly cool” −1; “neutral” 0; “slightly warm” +1; “warm” +2; “hot” +3; “very hot” +4) of ISO 10551 was used to record thermal sensations, especially extreme hot sensations in the hot season. However, in previous studies in humid subtropical areas of China, in which the assessment scales were established based on, thermal sensation was rated on the ASHRAE 7-point scale (i.e., “cold”−3; “cool”−2; “slightly cool”−1; “neutral” 0; “slightly warm” +1; “warm” +2; “hot” +3). To apply the last three criteria, comparing the prediction by the selected thermal indices with the actual thermal sensation indicated by the interviewees, the extreme categories such as “very hot” +4 and “very cold” −4 which rarely occurred with 4.1% and 0% respectively were merged to the categories of “hot” +3 and “cold” −3, respectively.
Figure 4 shows the frequency distribution of thermal sensation votes. The TSV ranged from “cool” −2 to “hot” +3. The highest frequencies of votes were “neutral” 0 and “hot” +3, with 29% and 38%, respectively. The “slightly warm” +1 and “warm” +2 votes were essentially the same, with 13% and 12%, respectively. While, the “slightly cool” −1 and “cool” −2 votes had few occurrences, for a total of 8%.
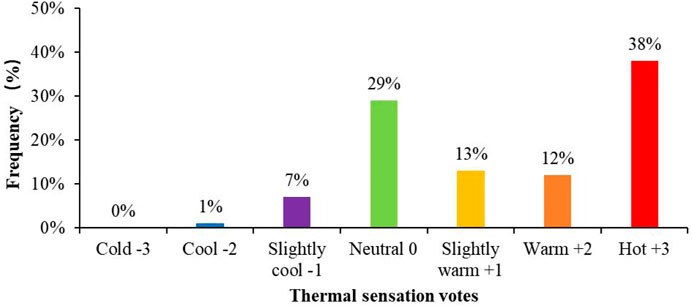
FIGURE 4. Frequency distributions of thermal sensation votes.
3.3 Comparison between selected indices’ prediction and thermal sensation votes
3.3.1 Coefficient of determination and Spearman’s rho correlation coefficient
The first two statistical criteria, the coefficient of determination between the thermal comfort indices’ parameters and TSV and the Spearman’s rho correlation coefficient between the results of the thermal comfort indices and TSV, were estimated, as shown in Table 6. The coefficients of determination were generally higher than Spearman’s rho correlation coefficients. Moreover, strong associations were found between coefficients of determination and Spearman’s rho correlation coefficients, indicating that high coefficients of determination would predict high Spearman’s rho correlation coefficients. This is because both coefficients have the same interpretation of prediction possibilities, and the coefficient of determination shows how well the model parameters vary in function to variations of thermal responses, while the Spearman’s rho correlation coefficient verified how well the results of thermal comfort indices vary in function with variations in thermal responses.
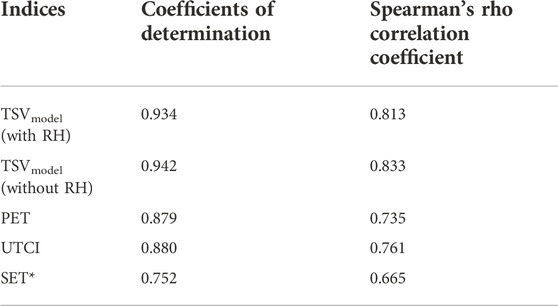
TABLE 6. Coefficient of determination and Spearman’s rho correlation coefficient.
TSVmodel (with RH) and TSVmodel (without RH) showed the highest coefficients, with coefficients of determination of 0.934 and 0.942 and Spearman’s rho correlation coefficient of 0.813 and 0.833, respectively, followed by UTCI and PET, with 0.880 and 0.761, and 0.879 and 0.735, respectively; the lowest was observed in the case of SET* with 0.752 and 0.665.
3.3.2 Percentage of correct predictions and two qualitative criteria
According to the third criterion percentage of correct predictions, UTCI was the most successful index simulating 29.8% of thermal sensation votes (Table 7), followed by the TSVmodel (with RH), TSVmodel (without RH), and SET* simulating approximately 24.5%, while the lowest was observed in PET (16.5%).
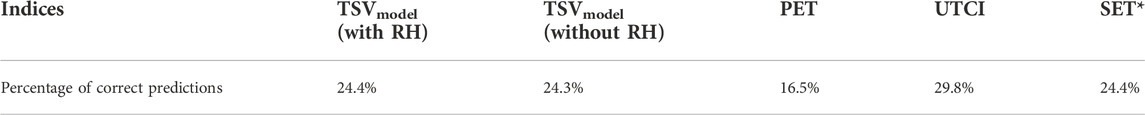
TABLE 7. Percentage of indices’ correct predictions.
The percentage of thermal index class predictions demonstrated significant differences compared with the original TSV, as shown in Figure 5. For all the selected thermal indices, discrepancies were mainly identified in the positive thermal sensation (“slightly warm” +1; “warm” +2; “hot” +3). The frequency of the original “hot” +3 was higher than the predictions of the selected thermal comfort indices, whereas the total frequencies of the original “slightly warm” +1 and “warm” +2 were lower than the predictions of the selected thermal comfort indices. Furthermore, PET overestimated the negative thermal sensation (“cool” −2 and “slightly cool” −1), while SET* overestimated the “neutral” 0. In contrast, UTCI showed better agreement with the primordial votes than the rest of the selected thermal comfort indices, indicating “hot” +3 and “neutral” 0 with 29% and 19%, respectively, compared with the original “hot” +3 with 38% and “neutral” 0 with 29%.
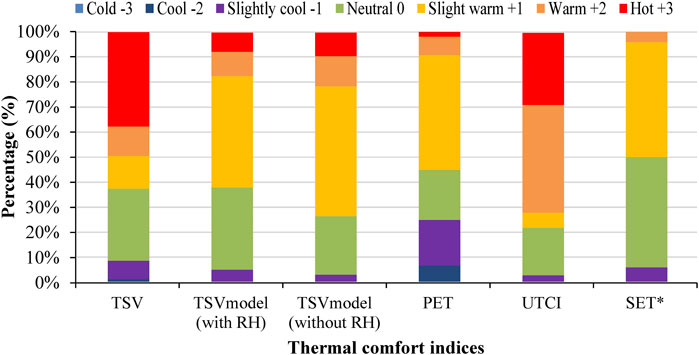
FIGURE 5. Percentage of thermal indices’ class predictions.
Cross-tabulation analysis was used to assess predictive ability of indices considering each class of TSV scale separately. Figure 6 shows the TSV cross-tabulation. The applicability of UTCI was also verified by cross-tabs. Approximately 57% of the UTCI’s predictions were classified correctly as “hot” +3, while great success had also been observed in the case of class “neutral” 0 and “slightly cool” −1, at 40% and 48%, respectively. For the TSVmodel (with RH), TSVmodel (without RH) and PET, predictions were accurate only in the case of “hot” +3. All the SET*predictions were inaccurate.
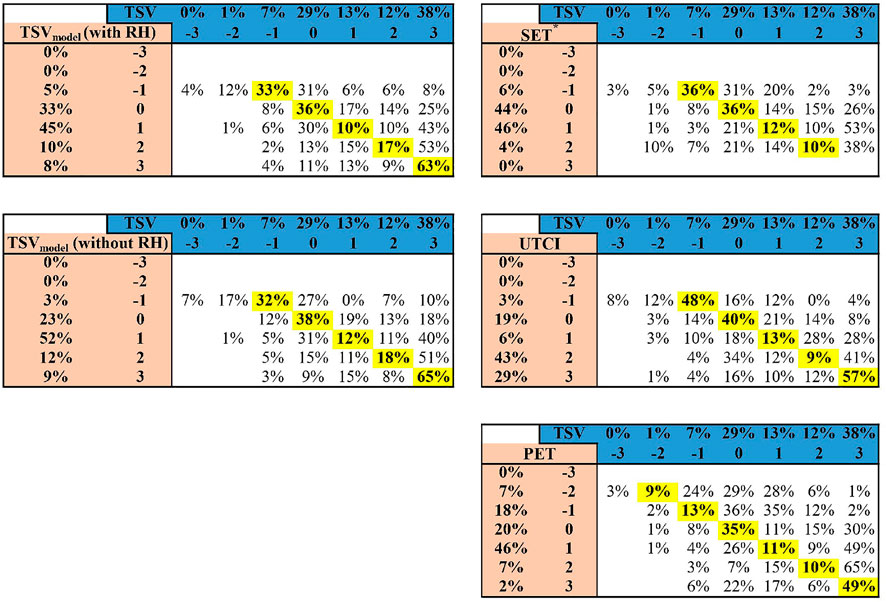
FIGURE 6. Distribution of thermal indices’ class predictions per class of TSV (each row adds to 100%).
3.3.3 Performance assessment
The average Spearman’s rho correlation coefficient was evaluated as approximately 0.60, suggesting a moderate correlation (Willmott, 1982; Pantavou et al., 2013). For the selected thermal comfort indices, all indices correlated well with TSV, with coefficients greater than 0.60. In particular, the same better fits were found for TSVmodel (with RH) and TSVmodel (without RH), with coefficients larger than 0.80. Although all the selected thermal comfort indices had suitable applicability according to the first two statistical criteria, the last three criteria demonstrated limited performance; this proved that the coefficient of determination and the Spearman’s rho correlation coefficient were often inappropriate or misleading when comparing model-predicted and observed variables (Willmott, 1982; Potchter et al., 2022). The relationships between the coefficient of determination and Spearman’s rho correlation coefficient and model performance were not always consistent.
All the selected thermal indices had limited performance in the prediction of thermal sensation because the thermal sensation in the urban microclimate was a complex phenomenon with multiple factors of concern, the microclimate, physiological, psychological, and behaviors (Nikolopoulou et al., 2001; Nikolopoulou and Steemers, 2003; Chen and Ng, 2012). The microclimate in a certain region affects the thermal sensations directly (Chen and Ng, 2012), while psychological and behavioral factors play an important role in the determination of thermal evaluation of inhabitants (Brager and de Dear, 1998; Schweiker et al., 2013). The psychological and behaviors were not taken into consideration in the thermal comfort models of PET, UTCI, and SET*. In contrast, the TSVmodel (with RH) and TSVmodel (without RH) should have better performance because the equations were derived from the survey data implicit of the habits and customs of the residents. The limited performance of the TSVmodel may be due to differences in habits and customs between Guangzhou and Hong Kong. In addition, the TSVmodels were developed based on the multiple linear regressions between the original thermal sensation votes and some local microclimatic parameters. Local microclimatic conditions play an important role in affecting thermal sensations of people (Chen and Ng, 2012). The varied microclimates under different topographic characteristics and urban morphologies led to various thermal sensations.
3.4 Adaptation analysis
The limited performance of the selected indices was examined using the last three criteria. The last three criteria were estimated based on the assessment scales of previous studies in the humid subtropical areas of China. The assessment scales may not have adapted to Guangzhou. A set of difference measures, including the root mean square error (RMSE), systematic error (RMSEs), unsystematic error (RMSEu), and an index of agreement (d), for model evaluation proposed by Willmott (1982) was used to quantitatively evaluate the adaptation of thermal comfort indices’ assessment scales. The RMSE explains the extent of the average difference between the original and prediction. Both RMSEs and RMSEu derived from RMSE, explain how much of the RMSE is systematic in nature and what portion is unsystematic. As for a credible model, the magnitude of RMSEs should close to 0, while the result of RMSEu should approach RMSE. The index of agreement (d) is intended to be a descriptive measure of how a model predicts a variable with high accuracy. The d value of one represents a perfect prediction of the variable.
The difference measures are presented in Table 8. For UTCI, the RMSEs was relatively small, and the RMSEu approached the RMSE, indicating that the UTCI better conforms to the criteria of the systematic error. The d value for UTCI was 0.84, suggesting that the assessment scales of the UTCI reasonably approximated the observed data for this study. For all the other indices, the RMSEs were generally higher than the RMSEu, indicating that the assessment scales did not adapt in Guangzhou. The RMSEu was approximately one owing to the complexity of the outdoor thermal comfort evaluation.
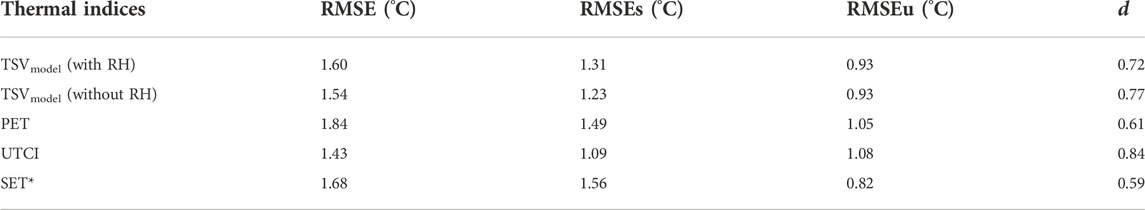
TABLE 8. Quantitative measures of thermal indices’ assessment scales performance with observed data.
4 Conclusion
The present study presented field survey results of outdoor thermal comfort, aiming to propose an adaptive model to quantify the correlations between urban climate and outdoor thermal sensations for humid subtropical residential areas in China. The paper presented the results of field thermal comfort survey focusing on the comparison between the prediction by thermal indices (i.e., PET, UTCI, SET* and TSVmodel) commonly used in China and the actual thermal sensation expressed by interviewees. The main conclusions are as follows:
1. The TSVmodel had a better correlation with TSV, while the UTCI was the most successful index, simulating 29.8% of TSV. The testability of PET and SET* were very low, with the correct predictive ability 16.5% and 24.4%, respectively.
2. For all the selected thermal comfort indices, the percentage of thermal comfort index class predictions demonstrated significant differences compared with the original TSV. In contrast, UTCI showed better agreement with the original, indicating ‘hot’ +3 and ‘neutral’ 0 with 29% and 19%, respectively, compared with the original +3 with 38% and 0 with 29%.
3. For all the indices, the RMSEs were generally higher than the RMSEu, demonstrating that the assessment scales did not adapt to Guangzhou. Therefore, it was necessary to establish the thermal sensation scales of Guangzhou. The RMSEu were approximately one owing to the complexity of the outdoor thermal comfort evaluation.
4. In the selected indices, the UTCI reasonably approximated the observed data for this study and was recommended to assess the outdoor thermal comfort in humid subtropical residentials of China to evaluate the thermal comfort level under different design decisions, thus creating a comfortable urban microclimate.
In our study, UTCI was calculated by ‘UTCI calculator’ provided on the www.utci.org website based on Ta, RH, V10m and Tmrt. The 10 m high wind speed was required to calculate UTCI, as well as the mean radiant temperature (Tmrt) which was derived from RayMan software. The UTCI would be difficult to use in the actual design process in a more convenient way by designers and urban planners. However, we could propose some outdoor thermal comfort design strategies base on evaluation indexes UTCI. The proposed strategies would provide a common basis for the creating guidelines to use in future studies regarding creating a comfortable microclimate in the humid and subtropical residential area of China.
Data availability statement
The original contributions presented in the study are included in the article/supplementary material, further inquiries can be directed to the corresponding authors.
Ethics statement
Ethical review and approval was not required for the study on human participants in accordance with the local legislation and institutional requirements. Written informed consent from the participants was not required to participate in this study in accordance with the national legislation and the institutional requirements.
Author contributions
KL: Conceptualization, methodology, software, validation, formal analysis, investigation, data curation, visualization, writing- original draft preparation, and writing-review and editing. XL: Conceptualization, methodology, visualization, software, writing- original draft preparation, writing-review and editing, and funding acquisition. YB: Conceptualization, resources, software, writing- original draft preparation, writing-review and editing, and funding acquisition.
Funding
This research is supported by the 2022 Guangdong Philosophy and Social Science Foundation (Grant No. GD22XGL02); the National Natural Science Foundation of China (Grant No. 52108011); the Fundamental Research Funds for the Henan Provincial Colleges and Universities in Henan University of Technology (Grant No. 2018QNJH11); Guangzhou Philosophy and Social Science Planning 2022 Annual Project (Grant No. 2022GZQN14); Department of Education of Guangdong Province (Grant No. 2021KTSCX004); Department of Housing and Urban–Rural Development of Guangdong Province (Grant No. 2021-K2-305243); the Fundamental Research Funds for the Central Universities (Grant No. QNMS202211); Science and Technology Program of Guangzhou, China (Grant No. 202102020302); State Key Laboratory of Subtropical Building Science, South China University of Technology (Grant No. 2021ZB16); China Postdoctoral Science Foundation (Grant No. 2021M701249).
Acknowledgments
Special thanks to the cultivation programme for young backbone teachers in Henan University of Technology and the key special projects of science and technology aid economy 2020 of the National Key R&D Program of China.
Conflict of interest
Authors XL and YB were employed by Architectural Design and Research Institute Co., Ltd.
The remaining author declares that the research was conducted in the absence of any commercial or financial relationships that could be construed as a potential conflict of interest.
Publisher’s note
All claims expressed in this article are solely those of the authors and do not necessarily represent those of their affiliated organizations, or those of the publisher, the editors and the reviewers. Any product that may be evaluated in this article, or claim that may be made by its manufacturer, is not guaranteed or endorsed by the publisher.
Abbreviations
PMV, Predicted Mean Vote [-]; SET*, Standard Effective Temperature [°C]; OUT_SET*, Outdoor Standard Effective Temperature [°C]; PET, Physiologically Equivalent Temperature [°C]; UTCI, Universal Thermal Climate Index [°C]; DI, Discomfort index [-]; CP, Cooling Power [W/m2]; THI, Temperature-Humidity Index [°C]; Ts, Thermal Sensation [-]; TSV, Thermal Sensation Votes [-]; TSVmodel, The empirical thermal comfort index [-]; Tmrt, Mean Radiant Temperature [°C]; Adu, Surface area of the unclothed body [m2]; Ta, Air temperature [°C]; RH, Relative humidity [%]; G, Global radiation [W/m2]; Tg, Globe temperature [°C]; D, Globe diameter [m]; ɛ, Globe emissivity [-]; M, Metabolic rates [W]; Clo, Clothing insulation [clo]; RMSE, Root mean square error [°C]; RMSEs, Systematic errors [°C]; RMSEu, Unsystematic errors [°C]; d, Index of agreement [-]; Va, Wind speed at a height of 1.1 m above the ground [m/s]; V10m, Wind speed at a height of 10 m above the ground [m/s].
References
Brager, G. S., and de Dear, R. J. (1998). Thermal adaptation in the built environment: A literature review. Energy Build. 27, 83–96. doi:10.1016/S0378-7788(97)00053-4
Bröde, P., Fiala, D., Błażejczyk, K., Holmér, I., Jendritzky, G., Kampmann, B., et al. (2012). Deriving the operational procedure for the universal thermal climate index (UTCI). Int. J. Biometeorol. 56, 481–494. doi:10.1007/s00484-011-0454-1
Chen, L., and Ng, E. (2012). Outdoor thermal comfort and outdoor activities: A review of research in the past decade. Cities 29, 118–125. doi:10.1016/j.cities.2011.08.006
Chen, X., Gao, L., Xue, P., Du, J., and Liu, J. (2020). Investigation of outdoor thermal sensation and comfort evaluation methods in severe cold area. Sci. Total Environ. 749, 141520. doi:10.1016/j.scitotenv.2020.141520
Cheng, V., Ng, E., Chan, C., and Givoni, B. (2012). Outdoor thermal comfort study in a subtropical climate: A longitudinal study based in Hong Kong. Int. J. Biometeorol. 56, 43–56. doi:10.1007/s00484-010-0396-z
China Bureau of Statistics (2021). Statistical communique of the people’s Republic of China on national economic and social development in 2021. China: Natl. Bur. Stat. Available At: http://www.stats.gov.cn/tjsj/sjjd/202209/t20220929_1888798.html.
China Meteorological Administration and Tsinghua University (2005). Meteorological data for built environmental analysis in China. Beijing: China Architecture & Building Press.
de Dear, R. J., and Brager, G. S. (1998). Developing an adaptive model of thermal comfort and preference. ASHRAE Trans. 104 (1A), 145–167.
Du, W., and Xia, X. (2018). How does urbanization affect ghg emissions? A cross-country panel threshold data analysis. Appl. Energy 229, 872–883. doi:10.1016/j.apenergy.2018.08.050
Fang, Z., Zheng, Z., Feng, X., Shi, D., Lin, Z., and Gao, Y. (2021). Investigation of outdoor thermal comfort prediction models in South China: A case study in Guangzhou. Build. Environ. 188, 107424. doi:10.1016/j.buildenv.2020.107424
Fanger, P. O. (1970). Thermal comfort - analysis and applications in environmental engineering. New York, NY, USA: McGraw-Hill Book Company, 244.
Gagge, A. P., Fobelets, A. P., and Berglund, L. G. (1986). Standard predictive index of human response to the thermal environment. ASHRAE Trans. 92, 709–731.
Haghshenas, M., Hadianpour, M., Matzarakis, A., Mahdavinejad, M., and Ansari, M. (2021). Improving the suitability of selected thermal indices for predicting outdoor thermal sensation in Tehran. Sustain. Cities Soc. 74, 103205. doi:10.1016/j.scs.2021.103205
He, B.-J. (2022). Green building: A comprehensive solution to urban heat. Energy Build. 271, 112306. doi:10.1016/j.enbuild.2022.112306
He, B.-J., Wang, J., Zhu, J., and Qi, J. (2022). Beating the urban heat: Situation, background, impacts and the way forward in China. Renew. Sustain. Energy Rev. 161, 112350. doi:10.1016/j.rser.2022.112350
Höppe, P. (1999). The physiological equivalent temperature - a universal index for the biometeorological assessment of the thermal environment. Int. J. Biometeorology 43 (2), 71–75. doi:10.1007/s004840050118
Huang, H., Li, Y., Zhao, Y., and Zhai, W. (2022). Analysis of the impact of urban summer high temperatures and outdoor activity duration on residents’ emotional health: Taking hostility as an example. Front. Public Health 10, 955077. doi:10.3389/fpubh.2022.955077
Huang, J., Zhou, C., Zhuo, Y., Xu, L., and Jiang, Y. (2016). Outdoor thermal environments and activities in open space: An experiment study in humid subtropical climates. Build. Environ. 103, 238–249. doi:10.1016/j.buildenv.2016.03.029
ISO7726 (1998). Ergonomics of the thermal environment—instruments for measuring physical quantities. Geneva: International Standard Organization.
Jendritzky, G., de Dear, R., and Havenith, G. (2012). UTCI-why another thermal index? Int. J. Biometeorol. 56, 421–428. doi:10.1007/s00484-011-0513-7
Johansson, E., Thorsson, S., Emmanuel, R., and Kruger, E. (2014). Instruments and methods in outdoor thermal comfort studies – The need for standardization. Urban Clim. 10, 346–366. doi:10.1016/j.uclim.2013.12.002
Lai, D. Y., Guo, D. H., Hou, Y. F., Lin, C. Y., and Chen, Q. Y. (2014a). Studies of outdoor thermal comfort in northern China. Build. Environ. 77, 110–118. doi:10.1016/j.buildenv.2014.03.026
Lai, D., Zhou, C., Huang, J., Jiang, Y., Long, Z., and Chen, Q. (2014b). Outdoor space quality: A field study in an urban residential community in central China. Energy Build. 68, 713–720. doi:10.1016/j.enbuild.2013.02.051
Li, B., Guo, W., Liu, X., Zhang, Y., and Caneparo, L. (2022). The third solar decathlon China buildings for achieving carbon neutrality. Buildings 12, 1094. doi:10.3390/buildings12081094
Li, B., Guo, W., Liu, X., Zhang, Y., Russell, P. J., and Schnabel, M. A. (2021). Sustainable passive design for building performance of healthy built environment in the lingnan area. Sustainability 13, 9115. doi:10.3390/su13169115
Li, J., and Liu, N. (2020). The perception, optimization strategies and prospects of outdoor thermal comfort in China: A review. Build. Environ. 170, 106614. doi:10.1016/j.buildenv.2019.106614
Lin, T. P., de Dear, R., and Hwang, R. (2011). Effect of thermal adaptation on seasonal outdoor thermal comfort. Int. J. Climatol. 31, 302–312. doi:10.1002/joc.2120
Lin, T. P., and Matzarakis, A. (2008). Tourism climate and thermal comfort in sun moon lake, taiwan. Int. J. Biometeorol. 52 (4), 281–290. doi:10.1007/s00484-007-0122-7
Lin, T. P. (2009). Thermal perception, adaptation and attendance in a public square in hot and humid regions. Build. Environ. 44, 2017–2026. doi:10.1016/j.buildenv.2009.02.004
Matzarakis, A., Rutz, F., Matzarakis, A., Rutz, F., and Mayer, H. (2007). Modelling radiation fluxes in simple and complex environments—Application of the RayMan model. Int. J. Biometeorol. 51, 323–334. doi:10.1007/s00484-006-0061-8
Monteiro, L., and Alucci, M. P. (2006). “Outdoor thermal comfort: Comparison of results of empirical field research and predictive models simulation,” Louvain-la-Neuve, Belgium .Proceedings of the comfort and energy use in buildings
Ng, E., and Cheng, V. (2012). Urban human thermal comfort in hot and humid Hong Kong. Energy Build. 55, 51–65. doi:10.1016/j.enbuild.2011.09.025
Nikolopoulou, M., Baker, N., and Steemers, K. (2001). Thermal comfort in outdoor urban spaces: Understanding the human parameter. Sol. Energy 70 (3), 227–235. doi:10.1016/S0038-092X(00)00093-1
Nikolopoulou, M., and Steemers, K. (2003). Thermal comfort and psychological adaptation as a guide for designing urban spaces. Energy Build. 35, 95–101. doi:10.1016/S0378-7788(02)00084-1
Pantavou, K. G., Santamouris, M., Asimakopoulos, D., and Theoharatos, G. (2013). Evaluating the performance of bioclimatic indices on quantifying thermal sensation for pedestrians. Adv. Build. Energy Res. 7 (2), 170–185. doi:10.1080/17512549.2013.865557
Pickup, J., and de Dear, R. J. (1999). “An outdoor thermal comfort index (OUT_SET*)—Part I—the model and its assumptions,” (Sydney, 279–283.International congress of biometeorology and international conference on urban climatology.
Potchter, O., Cohen, P., Lin, T.-P., and Matzarakis, A. (2022). A systematic review advocating a framework and benchmarks for assessing outdoor human thermal perception. Sci. Total Environ. 833, 155128. doi:10.1016/j.scitotenv.2022.155128
Ruiz, A., Maria, C., and Erica, N. (2015). Adaptive model for outdoor thermal comfort assessment in an Oasis city of arid climate. Build. Environ. 85, 40–51. doi:10.1016/j.buildenv.2014.11.018
Schweiker, M., Brasche, S., Bischof, W., Hawighorst, M., and Wagner, A. (2013). Explaining the individual processes leading to adaptive comfort: Exploring physiological, behavioural and psychological reactions to thermal stimuli. J. Build. Phys. 36 (4), 438–463. doi:10.1177/1744259112473945
Thorsson, S., Lindberg, F., Eliasson, I., and Holmer, B. (2007). Different methods for estimating the mean radiant temperature in an outdoor urban setting. Int. J. Climatol. 27, 1983–1993. doi:10.1002/joc.1537
Tseliou, A., Tsiros, I. X., Lykoudis, S., and Nikolopoulou, M. (2010). An evaluation of three biometeorological indices for human thermal comfort in urban outdoor areas under real climatic conditions. Build. Environ. 45 (5), 1346–1352. doi:10.1016/j.buildenv.2009.11.009
United Nation (2019). World urbanization prospects: The 2018 revision ST/ESA/SER.A/420 (New York: United Nation.
Wei, D., Yang, L., Bao, Z., Lu, Y., and Yang, H. (2022). Variations in outdoor thermal comfort in an urban park in the hot-summer and cold-winter region of China. Sustain. Cities Soc. 77, 103535. doi:10.1016/j.scs.2021.103535
Willmott, C. J. (1982). Some comments on the evaluation of model performance. Bull. Am. Meteorol. Soc. 63 (11), 1309–1313. doi:10.1175/1520-0477(1982)063<1309:scoteo>2.0.co;2
Yang, J., Xin, J., Zhang, Y., Xiao, X., and Xia, J. C. (2022). Contributions of sea–land breeze and local climate zones to daytime and nighttime heat island intensity. npj Urban Sustain. 2, 12. doi:10.1038/s42949-022-00055-z
Yang, L., Yan, H., and Lam, J. C. (2014). Thermal comfort and building energy consumption implications - a review. Appl. Energy 115, 164–173. doi:10.1016/j.apenergy.2013.10.062
Yang, W., Wong, N. H., and Zhang, G. (2013). A comparative analysis of human thermal conditions in outdoor urban spaces in the summer season in Singapore and Changsha, China. Int. J. Biometeorol. 57 (6), 895–907. doi:10.1007/s00484-012-0616-9
Keywords: humid subtropical area, thermal sensation votes, thermal comfort indices, assessment, performance
Citation: Li K, Liu X and Bao Y (2022) Evaluating the performance of different thermal indices on quantifying outdoor thermal sensation in humid subtropical residential areas of China. Front. Environ. Sci. 10:1071668. doi: 10.3389/fenvs.2022.1071668
Received: 16 October 2022; Accepted: 14 November 2022;
Published: 01 December 2022.
Edited by:
Jun Yang, Northeastern University, ChinaCopyright © 2022 Li, Liu and Bao. This is an open-access article distributed under the terms of the Creative Commons Attribution License (CC BY). The use, distribution or reproduction in other forums is permitted, provided the original author(s) and the copyright owner(s) are credited and that the original publication in this journal is cited, in accordance with accepted academic practice. No use, distribution or reproduction is permitted which does not comply with these terms.
*Correspondence: Xiao Liu, eGlhb2xpdUBzY3V0LmVkdS5jbg==; Ying bao, eWluZ2Jhb3NjdXRAMTI2LmNvbQ==