- 1College of Geography and Remote Sensing Science, Xinjiang University, Urumqi, China
- 2General College Key Laboratory of Smart City and Environmental Modeling, Xinjiang University, Urumqi, China
Xinjiang, located in Northwestern China, is the important production base of various crops with high water consumption. The quantitative contribution of driving factors to crop water consumption has not been investigated in Xinjiang. In this study, the Logarithmic Mean Divisia Index method is used to quantitatively analyze the effect of five factors (population, planting structure, agricultural economics, water intensity, and industrial structure) to crop water consumption during 1989–2018. The results show that 1) crop water consumption has increased from 10.363 to 37.226 billion m3 with a rate of 0.932 billion m3/a in 1989–2018. Its increased trend can be divided into two stages: a slow increase at a rate of 0.425 million m3/a in 1989–2003 and a quick expansion at a rate of 1.310 million m3/a in 2004–2018. 2) The increase of population and agricultural economics both promote crop water consumption, whereas changes in planting structure and water intensity both inhibit crop water consumption. Their contributions are 0.213, 2.068, −0.007, and −0.134 billion m3, respectively. The increased agricultural economics and the decreased water intensity more significantly changed crop water consumption in 2004–2018 than in 1989–2003. 3) The total effects of five factors on crops varied at each stage. All crops (except wheat) have a promoting effect on an increase in crop water consumption with the largest value in cotton (0.378 million m3) in 1989–2003. The effect of the five factors on crops (except soybean and medicago) is positive (1.404 million m3), and the highest value is shown in cotton during 2004–2018. The results illustrate the contribution of the five factors of crop water consumption and provide references for local agricultural water saving in Xinjiang.
Introduction
The global surface temperature in 2011–2020 is 1.09°C warmer than in the period from 1850 to 1900, which is a level not seen since the past 125000 years (IPCC AR6, 2021). The similar warming (0.30°C/10a) has been recorded in the arid Xinjiang of China during 1961–2018 (Yao et al., 2022). During this period, the annual mean precipitation experienced a rapid increasing trend with a rate of 9.9 mm/10a (Chen et al., 2017; Zhang Y. et al., 2022). In the context of warming and wetting climate, regional water resources have been significantly affected in two aspects: 1) regional temperature has increased with high-frequency oscillation in recent decades, which makes the glacier and snow melt and reduces the snowfall rate in the mountains (Chen et al., 2017; Zhang QF. et al., 2022). Observations have shown that the snowfall rate in the Tianshan Mountains of Xinjiang has decreased from 11 to 24% before the 20th century to 9–21% at the beginning of the 21st century, and ∼97.52% of mountain glaciers are in rapid retreat (Chen et al., 2017; Li et al., 2022). 2) The significant rise of temperature has an impact on the patterns of basin production and river flow through changing the characteristics of transport and circulation of water vapor in Xinjiang, which greatly increases the uncertainty of regional water resources at the spatial scale (Yao et al., 2022).
As an important agricultural production base in China, Xinjiang produces 65% of cotton, 56% of sugar beet, 20% of grape, 6% of pear, and 2% of grain (Zhang and Anadon, 2014). The vast planting area makes Xinjiang the base of various agricultural products with high water consumption (Li and Deng, 2021). Agricultural water in Xinjiang has accounted for more than 95% of total water consumption, but also continued to increase because of the expanding planting area after entering the 21st century (Shen et al., 2013; Li et al., 2020). The increasing agricultural water consumption has inevitably reduced the water used for ecology, directly threatening regional ecological security and bringing potential threat to agricultural water use in the future (Fang et al., 2018; Long et al., 2020). Therefore, it is vital to calculate the amount of crop water consumption and to investigate its influencing factors in Xinjiang. Shen et al. (2013) estimated irrigation water demand in the Tarim Basin, Junggar Basin, and Hexi Corridor and found that the total water consumption reached 44.2 billion m3 and irrigation water demand in the Tarim and Junggar basins reached 20.46 billion m3 and 17.22 billion m3, respectively. Wang et al. (2019) pointed out that the irrigation water requirement was 35.9 billion m3 in 2010 and 47.2 billion m3 in 2015 in the Tarim Basin. Li et al. (2020) found the irrigation water consumption in Xinjiang reached 38.99 billion m3 in 2017 and blue water deficit expanded from −11.51 billion m3 in 2004 to +13.26 billion m3 in 2018. The driving factors of agricultural water consumption were also investigated in Xinjiang (Fang et al., 2018; Wang et al., 2019; Zhang et al., 2019, 2020; Li et al., 2020). For example, Fang et al. (2018) proposed the planting structure in the Tarim Basin would lead to the increase rate of crop water requirement as high as 7.1 mm/a, while all climatic factors (wind speed, maximum humidity, sunshine duration, and minimum temperature) would only result in an increased rate of 1.9 mm/a. Li et al. (2020) pointed out that the expansion of the cotton planting area contributed 72.17% to the increase of irrigation water demand, while temperature only contributed 19.28% in Xinjiang.
Although many researchers have calculated crop water consumption based on the water footprint theory and revealed the possible influencing factors in Xinjiang (Fang et al., 2018; Wang et al., 2019; Zhang et al., 2019, 2020; Li et al., 2020), few studies have used the method to calculate the quantitative contribution of each factor to crop water consumption. Logarithmic Mean Divisia Index (LMDI) proposed by Ang (2004, 2005) has the profound theoretical foundation and high adaptability and also has significant advantages of removing residuals, modulating cross-sectional time series of data, and handling non-positive data in decomposition calculations (Gao and Wang, 2007). The LMDI method has been extensively utilized to quantitatively identify the effects of different factors on agricultural water demand in other regions of China (Xu et al., 2015; Zhang et al., 2015; Zhang S.L. et al., 2018; Li et al., 2021; Zhang C.J. et al., 2021), but has not been fully used in Xinjiang.
In this study, we investigated the quantitative contributions of five factors to crop water consumption in the interval of 1989–2018 by decomposing the factors into population, planting structure, agricultural economics, water intensity, and industrial structure via the LMDI method in Xinjiang. Three aspects were carried out in this study. First, the general trend of crop water consumption and the changeable characters of five factors were analyzed during 1989–2018. Second, the LMDI method was applied to quantitatively decompose the effects of the five factors influencing crop water consumption. Third, the effect of each driving factor on 11 crops was analyzed in two stages (1989–2003 and 2004–2018). Our work provides an important link between the selected factors for the water resource studies and provides the forward-looking information for policymakers to improve water use efficiency and alleviate water pressure of agriculture in Xinjiang.
Materials and methods
Study area
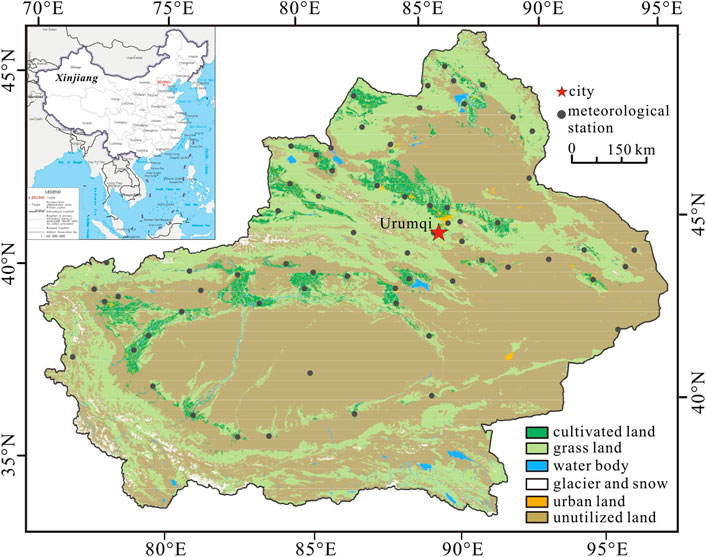
Xinjiang is the largest province in China with an area of about 166 × 104 km2 (Figure 1). The regional mean annual precipitation is less than ∼200 mm, and the mean annual temperature is ∼9.1°C (Li and Deng, 2021). The oases are mainly situated in the piedmont plains, and their water resources primarily result from rivers originating from precipitation and melt water of glacial and snow in the mountainous regions (i.e., Tianshan, Altai, and Kunlun Mountains). The cultivated lands are distributed in the oasis regions. More than 90% of freshwater is used for agricultural irrigation in Xinjiang, which is much higher than the average level of China (Li and Deng, 2021). The primarily planting crops in Xinjiang are cotton, maize, wheat, rice, soybean, oil crops, sugar beet, vegetable, melons, potato, and medicago.
Data description
A total of 66 meteorological stations (Figure 1) for Xinjiang were collected from the China Meteorological Administration (http://data.cma.cn/). The selected parameters include daily maximum temperature, daily minimum temperature, mean daily temperature, mean daily precipitation, wind speed, air pressure, relative humidity, and sunlight duration. The land use/cover data were downloaded from the National Land Use/Cover Dataset (NLCD) and from the Earth System Science Data Sharing Infrastructure of the Chinese Academy of Sciences (http://www.resdc.cn). The NLCD maps (1 km) were produced by the visual interpretation of Landsat Thematic Mapper (TM) images (Yang et al., 2018). The population, crop types, planting areas, crops yields, and regional GDP in 1989–2018 were compiled from the Xinjiang Statistics Yearbook (China).
Decomposition analysis of changes in water footprint
Calculation of water footprint
The water footprint (WF) includes the blue, green, and grey water (Chapagain et al., 2006) and is calculated separately for 11 crops in Xinjiang. The grey water is not included because the amount of fertilizer use for each crop is not getting.
where
To calculate
In Equation 2,
Decomposition analysis of changes in water footprint
The LMDI approach is used to separate the effect of different factors on the changes in crop WF in Xinjiang. The population, planting structure, agricultural economics, water intensity, and industrial structure are selected as the driving factors of crop water consumption. The index decomposition of water consumption (Ang, 2005) is given by
In Equation 6, Wtot is the total change in crop water consumption (m3); GDPi is the real output value of crop i in Xinjiang (Yuan); p represents the rural population in Xinjiang; ADP is the total output value of agriculture, forestry, animal husbandry, and fishery in Xinjiang (Yuan); A is the per capita agricultural output value (Yuan per person); Ii is the percentage of crop i output value to the total agricultural output value (%), representing the adjustment of industrial structure; Ci is the percentage of the output value of crop i to total agricultural output value (%), representing the adjustment of planting structure; and Si is the water consumption divided by the output value of crop (m3/104 Yuan). Equation 7 gives the effect of five factors (WP, WA, WI, WC, and WS) contributing to changes in water consumption over 30 years.
According to the additive decomposition model, the relevant equation for crop water decomposition of Xinjiang can be summarized as follows:
In Equations 8-12, if the effect is a positive value, it means the factors promote crop water use. If the effect is a negative value, it means the factors inhibit crop water use.
Results and discussion
Changes in crop water consumption and their driving factors
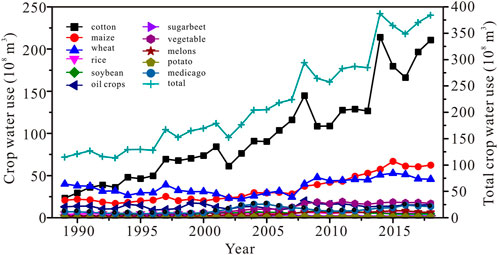
The WF in Xinjiang increased from 10.363 billion m3 to 37.226 billion m3 with a rate of 0.932 billion m3/a during 1989–2018 (Figure 2). The increased WF comes from a growing contribution of
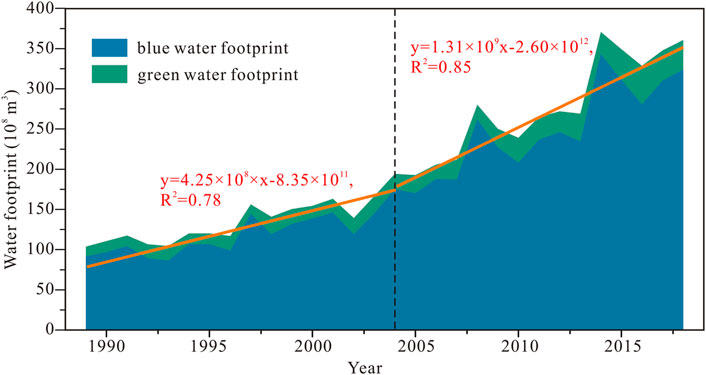
FIGURE 2. Changes in WF of crop in Xinjiang from 1989 to 2018: the overall trend accumulated by blue and green WF.
In terms of water consumption of different crops (Figure 3), the water consumption of cotton is the highest and enhanced significantly from 2.323 billion m3 (20.23%) to 21.063 billion m3 (54.82%), which plays the most important role in increasing crop water consumption during 1989–2018. The second largest increases of water consumption are maize and wheat. Their water consumption increased from 2.074 to 6.245 billion m3 and from 3.997 to 4.564 billion m3, respectively. However, their ratios both decreased from 18.06% to 16.25% for maize and from 34.81% to 11.88% for wheat in the study interval. The changeable portions of water consumption for cotton, maize, and wheat lead to a decrease of other crops (rice, soybean, oil crops, sugar beet, vegetable, melons, potato, and medicago) from 26.91% to 17.04%.
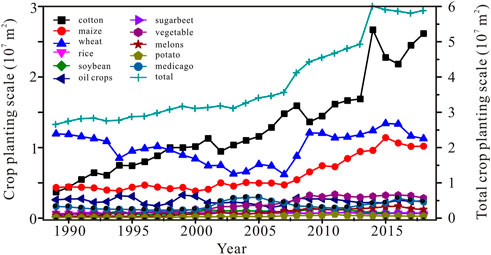
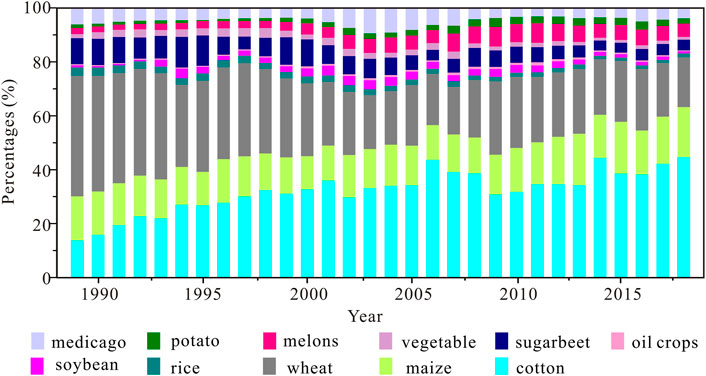
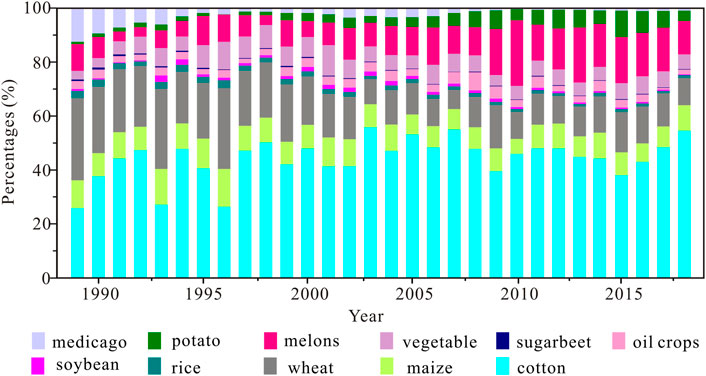
Figure 4 shows the crop planting scale in Xinjiang expanded by 121.42% from 1989 to 2018. Due to the increased needs for cotton and higher benefits for maize and other crops (except oil crops) than that for wheat, more cotton, maize, and other crops have been planted during 1989–2018 in Xinjiang. The planting scales of cotton, maize, and other crops are significantly expanded, while those of wheat and oil crops are slightly reduced. The planting proportion of crops has changed accordingly (Figure 5). The proportion of cotton consistently increased from 13.89% to 44.48% in the study period. The proportion of maize reduced from 16.43% to 13.25% during 1989–2008 and increased from 13.25% to 17.33% during 2008–2018. The proportion of wheat significantly decreased from 45.05% to 19.19% in the study interval. The decreased proportions of other crops from 24.46% to 19.01% are also observed in the study interval. The changes of crop planting scale directly affect the output value of crops (Figure 6). Specifically, the percentage of cotton output shows an increased trend from 26.00% to 54.55% in the study interval, whereas that of maize slightly decreases from 10.31% to 9.46% and that of wheat significantly reduces from 30.30% to 10.01%. The ratio of output of vegetable, melons, and potato increases from 13.87% to 21.56% at the expense of other crops (rice, soybean, oil crops, sugar beet, and medicago).
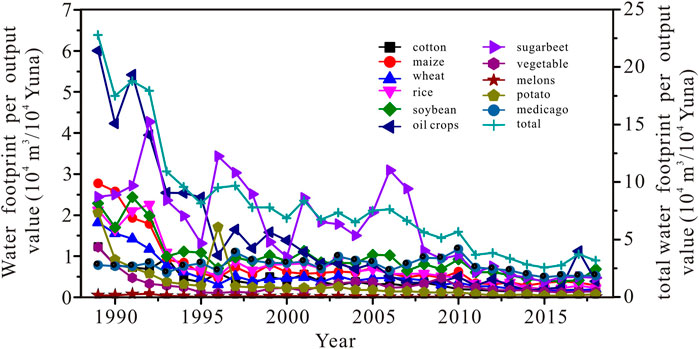
Being different with crop water use and crop planting scale, water footprint per output value (S) of each crop in Xinjiang experiences a decreasing trend during 1989–2018 (Figure 7). The water footprint per output value of sugar beet is the largest and decreases significantly by −80.71%. The biggest drop of water footprint per output value is found in oil crops from 60036.73 m3/104 Yuan to 3888.90 m3/104 Yuan, whereas the smallest reduction of water footprint per output value is observed in potato from 455.01 m3/104 Yuan to 195.88 m3/104 Yuan. The water footprint per output value of Xinjiang quickly decreases from 227925.02 m3/104 Yuan to 65043.19 m3/104 Yuan in 1989–2003 and then is followed by a slowly reduced trend from 75000.64 m3/104 Yuan to 31672.45 m3/104 Yuan in 2004–2018.
Figure 8A shows the rural population (p) in Xinjiang increases from 9.63 million to 13.27 million with a rate of 0.12 million/a during 1989–2018. The obvious decline of population in 2005 should be related with the reform of China’s rural household registration system [the Xinjiang Statistics Yearbook (China)], which caused a part of the rural population to become urban population. The changeable trend of per capita agricultural output value (Ai) is totally similar with that of crop planting scale in the study interval (Figure 8B). The Ai slowly increases from 1172.18 Yuan to 6548.25 Yuan in 1989–2003 and quickly increases from 7972.42 Yuan to 26,511.53 Yuan in 2004–2018. Figure 8C indicates that from 1989 to 1998, the percentage of the crop output value to the total agricultural output value (Ii) slightly increases from 64.29% to 75.91%. From 1998 to 2003, the Ii decreases from 75.91% to 61.53%. In the remaining interval (2004–2018), the Ii keeps a stable level (mean 64.14%).
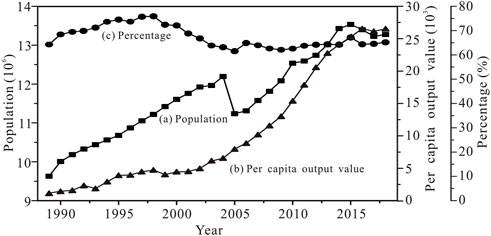
FIGURE 8. Trends of population (Pi), per capita agricultural output value (Ai), and the percentage of crop output value to the total agricultural output value (Ii) in Xinjiang from 1989 to 2018.
Decomposition of the change in crop water consumption during 1989–2018
The quantitative contributions of each driving factor to increases in crop water consumption are shown in Figure 9, and the factors are population (WP), planting structure (WC), agricultural economic (WA), water intensity (WS), and industrial structure (WI). During 1989–2018, the overall trend of crop water consumption presented fluctuating increases by 0.79 billion m3/a in Xinjiang. The population effect results in an increase in crop water consumption of 0.21 billion m3. The agricultural economics is the most important promoting effect on the increase of crop water consumption, and only shows the negative values in 1993, 1999, and 2017. Its contribution and ratio are 2.07 billion m3 and 29.35% with the obvious changes in the study interval. Specifically, the effect of agricultural economics decreases rapidly from 2.47 billion m3 in 1989 to −2.41 billion m3 (the lowest value) in 1999 and then slowly increases to 4.40 billion m3 (the highest value) in 2010 followed by a decreasing trend to 0.54 billion m3 in 2018.
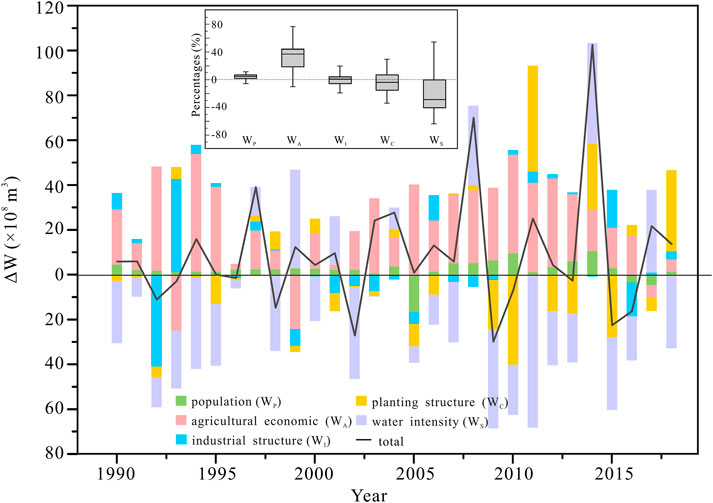
FIGURE 9. Contributions of driving factors to changes in agriculture water use in Xinjiang from1989 to 2018.
The most important inhibitor of crop water consumption is water intensity with an average contribution of −1.21 billion m3. Its total effect on crop water consumption reduction accounts for 14.18% (Figure 9). The planting structure shows an inhibiting effect with a value of −0.13 billion m3 and 2.13%. The inhibition and promotion effect of the industrial structure appears mutually during 1989–2018 and shows an inhibition effect (−0.07 billion m3) on the whole, accounting for 1.02% decrease in crop water consumption.
Decomposition of the change in crop water consumption in two stages
Based on the changeable feature of crop water consumption in Xinjiang during 1989–2018, the study interval is classified into two stages (1989–2003 and 2004–2018). Through the analysis of the LMDI method, the effects of five driving factors for each crop are analyzed in two stages (Figure 10 and Figure 11).
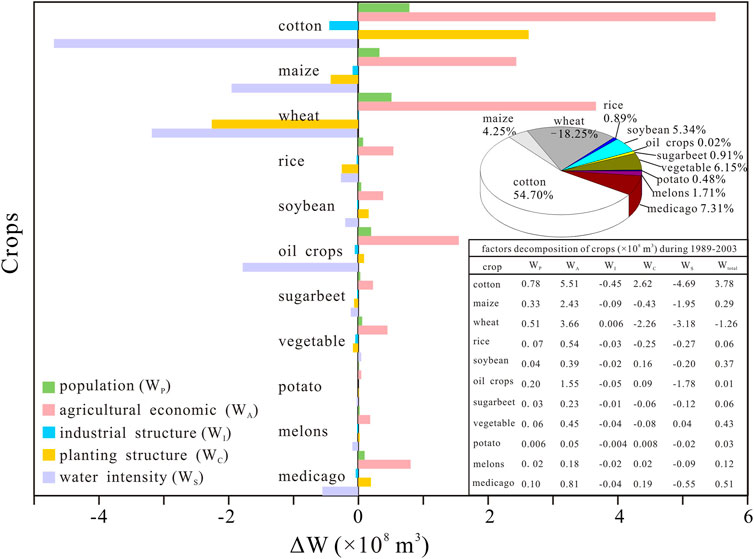
FIGURE 10. Decomposition analysis of changes in WF of different crops from 1989 to 2003. Note: the explored pie chart represents contribution of different crop WF; the table lists the results of LMDI factor decomposition for different crops.
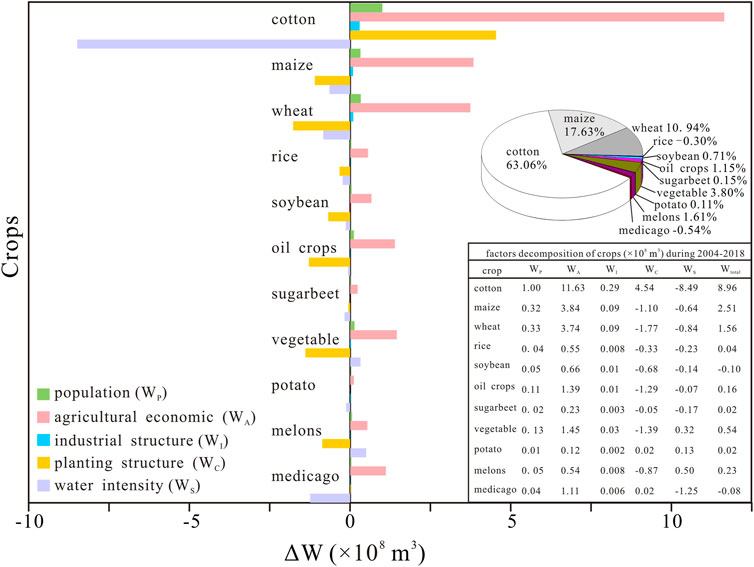
FIGURE 11. Decomposition analysis of changes in WF of different crops from 2004 to 2018. Note: the explored pie chart represents contribution of different crop WF; the table lists the results of LMDI factor decomposition for different crops.
Figure 10 presents the crop water consumption slowly raised from 10.363 billion m3 to 16.661 billion m3 in 1989–2003. According to the result of the LMDI analysis, population and agricultural economics are the main determinations that promote crop water consumption, while planting structure, water intensity, and industrial structure mainly inhibit an increase of crop water consumption in this stage. The effect values of population and agricultural economics are 0.216 and 1.579 billion m3 in this stage, and these two factors show a promoting effect on 11 crops. Cotton, wheat, and maize have the highest effect of population and agricultural economics and their values are 0.078 and 0.551 billion m3 for cotton, 0.051 and 0.366 billion m3 for wheat, 0.043 and 0.243 billion m3 for maize, respectively. The inhibited effects of planting structure, water intensity, and industrial structure are −0.074, -0.106, and -1.176 billion m3, respectively. It should be noted that the three factors have significant different effects on 11 crops in this stage. Specifically, the industrial structure has an inhibitory effect on all crops (except wheat) and the maximum effect is −0.045 billion m3 in cotton. The planting structure shows an inhibitory effect on corn, wheat, rice, sugar beet, and vegetables, and the maximum inhibitory effect is found in wheat (−0.226 billion m3). The promoting effect of planting structure is showed in other crops and the maximum value is 0.262 billion m3 for cotton. The water intensity also plays an inhibitory role on all crops except vegetables and the maximum effect also appeared in cotton with a value of −0.469 billion m3. An intimate calculation of 11 crops indicates that most crops (except wheat: 0.126 million m3 and −18.25%) result in an increase in crop water consumption with the largest value in cotton (0.378 million m3 and 54.70%). To sum up, the combined effects of five factors for 11 crops lead to a slow increase in crop water consumption during 1989–2003.
Figure 11 shows that the crop water consumption in Xinjiang quickly increases by 16.649 million m3 during 2004–2018. A comparison of five driving factors in this interval indicates that population and agricultural economics still promote an increase of crop water consumption. The contribution of population and agricultural economics is 0.211 and 2.525 million m3. The contribution of population in this stage is basically consistent with that in 1989–2003, while the contribution of agricultural economics in 2004–2018 is more significant than that in 1989–2003. Being different with the interval of 1989–2003, the industrial structure in 2004–2018 turns to a promoting factor on crop water consumption and its contribution is 0.055 million m3. The planting structure and water intensity also play an inhabiting factor in 2004–2018. The effect of water intensity (−1.245 billion m3) is higher than that of the planting structure (−0.160 billion m3), both being higher than that in 1989–2003. Therefore, agricultural economics and water intensity of crops play an important role in promoting and inhibiting crop water consumption in Xinjiang. In terms of five effects on 11 crops, population and agricultural economics also have promoting effects on 11 crops. Cotton, maize, and wheat have the highest effects of population and agricultural economics and their effects for three crops are 0.1 and 1.163 billion m3 for cotton, 0.032 and 0.384 billion m3 for maize, 0.033 and 0.374 billion m3 for wheat, respectively. The maximum promoting contribution of industrial structure appears in cotton and its effect is 0.029 billion m3. The inhibitory effects of planting structure and water intensity on crop types are significantly different. In detail, the planting structure only promotes cotton and potato with values of 0.454 billion m3 and 0.002 billion m3, respectively. The planting structure inhibits water consumption for other crops with higher values in wheat (−0.177 billion m3), corn (−0.110 billion m3), oil crops (−0.129 billion m3), and vegetables (−0.139 billion m3). The water intensity has inhibitory effects on other crops (except vegetables and melons) and its effect on other crops (cotton, maize, wheat, rice, soybean, oil crops, sugar beet, potato, and medicago) are −0.849, −0.064, −0.084, −0.023, −0.014, −0.007–0.017, −0.014, and −0.125 billion m3, respectively. The total effect of five driving factors on crops (except soybean and medicago) is positive and the highest value is showed in cotton. These factors lead to a rapid increase of crop water consumption in 2004–2018. We can see from the effects of five driving factors on 11 crops in two stages (1989–2003 and 2004–2018), the most obvious feature is an increased proportion of cotton (54.70%–63.06%) and maize (4.25%–17.63%). Conversely, the proportion of wheat decreases significantly from 18.25% to 10.94% (Figure 10 and Figure 11).
Discussion
Based on the aforementioned analysis, agricultural economics is an important promoting factor for increasing crop water consumption in Xinjiang. Because there is a positive correlation between agricultural GDP and crop water consumption, the rapid growth of agricultural economy will inevitably consume a lot of water resources. Water intensity has a moderate inhibiting effect on crop water consumption, indicating an increase of agricultural machinery input in the study period promotes the rational use of crop water consumption. The effects of agricultural economics and water intensity are more dramatic in 2004–2018 than in 1989–2003 (Figure 9). Population has a promoting effect on crop water consumption in the study period, and the reform of household registration system in China does not affect its effect. The rapid growth of rural population in Xinjiang results in the increasing demand of crops and water in the study interval (Davies and Simonovic, 2011; Xu et al., 2015). The contribution of industrial structure shifts from a moderate inhibiting effect in 1989–2003 to a promoting effect in 2004–2018, which indicate the percentage change of planting industry in the total output value of agriculture, forestry, animal husbandry, and fishery which promotes water resource consumption in Xinjiang. The effect of industrial structure on crop water resources is relatively weak during 1989–2018, being consistent with the similar study in Urumqi city (Zhang et al., 2015). The crop planting structure also has a weak and inhibitory effect on water resource consumption. It means that the crop planting structure is relatively reasonable due to the adjustment of planting area in different prefectures in the condition of expanded planting area of Xinjiang. Overall, the LMDI decomposition approach is proved to be convincing to investigate the driving factors of crop water consumption in Xinjiang during 1989–2018.
Our results are consistent with the similar studies in the Hexi Corridor (Hei, Shiyan, and Shule River) by Han (2017) who found agricultural economics and water intensity significantly promotes and inhibits the increase of agricultural water demand during 1991–2013. The population is the factor that contributes the least absolute value. The industrial structure effect contributed to increasing crop water demand is shown not only in Xinjiang, Shiyang, and the Hei River Basin (Han, 2017) but also in whole China (Li et al., 2021). The effect of crop planting structure contributed to saving crop water in Xinjiang and the Hexi Corridor (Han, 2017), which was confirmed by Li et al. (2021) and Xu et al. (2015) using the LMDI method and Zhang et al. (2012) via the structural decomposition analysis (SDA). Although the crop planting structure had a relatively low contribution to saving water in current studies (Han, 2017; Li et al., 2021), studies have shown that planting structure may be the main driving force for increasing food demand (Kastner et al., 2012) and water demand for agriculture in the future. Therefore, there is great potential to decrease agricultural water demand by adjusting the planting structures converting the crops with high-water consumption into the crops with low-water consumption (Li et al., 2021). In addition, one important shortcoming is shown from the analysis of driving factors of crop water consumption in Xinjiang and other regions of China (Xu et al., 2015; Han, 2017; Li et al., 2021). The LMDI method is mainly based on the correlation analysis and the specific processes of crop water consumption are not clear. Subsequent research should distinguish the respective influence of grain crops and commercial crops on agricultural water consumption to reveal the internal driving factors of agricultural water consumption more comprehensively. The specific content of each driving factors and the related mechanism can be taken into account to further explore the driving factors for agricultural water consumption in Xinjiang (Li et al., 2021).
Conclusion and implication
In this study, we investigated the changeable trend of crop water consumption in 1989–2018 and applied the LMDI method to quantitatively identify the contribution of main factors (population, planting structure, agricultural economics, water intensity, and industrial structure) for 11 crops. The underlying effects on crop water consumption were further explored, and the related results are totally consistent with the actual situation in Xinjiang. Our finding is of significance to water resource management and also proves the LMDI method is effective to quantify contributions of determined factors affecting water consumption of crops in Xinjiang of China.
Considering the agricultural economics promoting the crop water consumption, it is not feasible to reduce crop water consumption by lowering the agricultural GDP. The contribution of industrial structure is not notable. We should pay more attention on the planting structure to reduce crop water consumption. However, its effect is relatively weak in the modern planting structure. The government should take measures to optimize crop planting structure within a reasonable range to slow the increase in crop water consumption. Our results provide a scientific basis for farmer and government management to select the suitable planting crops.
Data availability statement
The raw data supporting the conclusions of this article will be made available by the authors, without undue reservation.
Author contributions
YL and MD designed this study, YL conducted the data calculation and wrote the first draft, YL and MD reviewed and edited the final draft, and all authors contributed to the interpretation of results.
Acknowledgments
The authors thank the reviewers for their valuable comments, which significantly improved the manuscript. They also acknowledge the data support from the National Earth System Science Data Center, National Science and Technology Infrastructure of China (http://www.geodata.cn).
Conflict of interest
The authors declare that the research was conducted in the absence of any commercial or financial relationships that could be construed as a potential conflict of interest.
Publisher’s note
All claims expressed in this article are solely those of the authors and do not necessarily represent those of their affiliated organizations, or those of the publisher, the editors, and the reviewers. Any product that may be evaluated in this article, or claim that may be made by its manufacturer, is not guaranteed or endorsed by the publisher.
References
Allen, R. G., Pereira, L. S., Raes, D., and Smith, M. (1998). Crop evapotranspiration guidelines for computing crop water requirements-FAO irrigation and drainage Paper 56. Rome: Food and Agriculture Organization.
Ang, B. W. (2004). Decomposition analysis for policymaking in energy:. Energy policy 32 (9), 1131–1139. doi:10.1016/s0301-4215(03)00076-4
Ang, B. W. (2005). The LMDI approach to decomposition analysis: A practical guide. Energy policy 33 (7), 867–871. doi:10.1016/j.enpol.2003.10.010
Chapagain, A. K., Hoekstra, A., Savenije, H., and Gautam, R. (2006). The water footprint of cotton consumption: An assessment of the impact of worldwide consumption of cotton products on the water resources in the cotton producing countries. Ecol. Econ. 60, 186–203. doi:10.1016/j.ecolecon.2005.11.027
Chen, Y. N., Li, Z., Fang, G. H., and Deng, H. J. (2017). Impact of climate change on water resources in the tianshan mountians, central asia. Acta Geogr. Sin. 72 (1), 18–26.
Cheng, S., Huang, J., Ji, F., and Lin, L. (2017). Uncertainties of soil moisture in historical simulations and future projections. J. Geophys. Res. Atmos. 122 (4), 2239–2253. doi:10.1002/2016jd025871
Davies, E. G. R., and Simonovic, S. P. (2011). Global water resources modeling with an integrated model of the social economic environmental system. Adv. Water Resour. 34, 684–700. doi:10.1016/j.advwatres.2011.02.010
Fang, G., Chen, Y., and Li, Z. (2018). Variation in agricultural water demand and its attributions in the arid Tarim River Basin. J. Agric. Sci. 156 (3), 301–311. doi:10.1017/s0021859618000357
Gao, Z., and Wang, Y. (2007). The decomposition analysis of change of energy consumption for production in China. Stat. Res. 24 (3), 52–57.
Guo, B., Li, W., Guo, J., and Chen, C. (2015). Risk assessment of regional irrigation water demand and supply in an arid inland river basin of northwestern China. Sustainability 7 (9), 12958–12973. doi:10.3390/su70912958
Han, J. (2017). “A study on the influential factors of water requirement of crops in Hexi region and the optimal distribution of water resources,” (Lanzhou: Lanzhou University). Doctoral dissertation.
Kastner, T., Rivas, M. J. I., Koch, W., and Nonhebel, S. (2012). Global changes in diets and the consequences for land requirements for food. Proc. Natl. Acad. Sci. U. S. A. 109 (18), 6868–6872. doi:10.1073/pnas.1117054109
Li, C., Jiang, T. T., Luan, X. B., Yin, Y. L., Wu, P. T., Wang, Y. B., et al. (2021). Determinants of agricultural water demand in China. J. Clean. Prod. 288, 125508. doi:10.1016/j.jclepro.2020.125508
Li, Y., and Deng, M. J. (2021). Spatiotemporal variations of agricultural water footprint and its economic benefits in Xinjiang, northwestern China. Sci. Rep. 11, 23864. doi:10.1038/s41598-021-03240-9
Li, Y., Sun, F., Chen, Y., Li, B., Fang, G., Duan, W., et al. (2022). The continuing shrinkage of snow cover in High Mountain Asia over the last four decades. Sci. Bull. 67 (20), 2064–2068. doi:10.1016/j.scib.2022.09.012
Li, Y., Wang, H., Chen, Y., Deng, M., Li, Q., Wufu, A., et al. (2020). Estimation of regional irrigation water requirements and water balance in Xinjiang, China during 1995-2017. PeerJ 7, e8243. doi:10.7717/peerj.8243
Long, A., Zhang, P., Hai, Y., Deng, X., Li, J., and Wang, J. (2020). Spatio-temporal variations of crop water footprint and its influencing factors in Xinjiang, China during 1988–2017. Sustainability 12 (22), 9678. doi:10.3390/su12229678
Shen, Y., Li, S., Chen, Y., Qi, Y., and Zhang, S. (2013). Estimation of regional irrigation water requirement and water supply risk in the arid region of Northwestern China 1989–2010. Agric. Water Manag. 128, 55–64. doi:10.1016/j.agwat.2013.06.014
Wang, F., Chen, Y., Li, Z., Fang, G., and Xia, Z. (2019). Assessment of the irrigation water requirement and water supply risk in the Tarim River Basin, Northwest China. Sustainability 11 (18), 4941. doi:10.3390/su11184941
Xu, Y., Huang, K., Yu, Y., and Wang, X. (2015). Changes in water footprint of crop production in beijing from 1978 to 2012: A logarithmic mean divisia index decomposition analysis. J. Clean. Prod. 87, 180–187. doi:10.1016/j.jclepro.2014.08.103
Yang, P., Xia, J., Zhan, C., Mo, X., Chen, X., Hu, S., et al. (2018). Estimation of water consumption for ecosystems based on vegetation interfaces processes model: A case study of the aksu River Basin, northwest China. Sci. Total Environ. 613-614, 186–195. doi:10.1016/j.scitotenv.2017.09.045
Yao, J. Q., Chen, Y. N., Guan, X. F., Zhao, Y., and Mao, W. (2022). Recent climate and hydrological changes in a mountain-basin system in Xinjiang, China. Earth. Sci. Rev. 226, 103957. doi:10.1016/j.earscirev.2022.103957
Zhang, C., and Anadon, L. D. (2014). A multi-regional input–output analysis of domestic virtual water trade and provincial water footprint in China. Ecol. Econ. 100, 159–172. doi:10.1016/j.ecolecon.2014.02.006
Zhang, C., Zhao, Y., Shi, C., and Chiu, Y. H. (2021). Can China achieve its water use peaking in 2030? A scenario analysis based on LMDI and Monte Carlo method. J. Clean. Prod. 278, 123214. doi:10.1016/j.jclepro.2020.123214
Zhang, P., Long, A. H., Hai, Y., Deng, X. Y., Wang, H., and Li, Y. (2020). The spatiotemporal variations and the driving forces of agricultural water consumption in Xinjiang (1988-2015): Based on the statistical analysis of crop water footprint. J. Glaciol. Geocryol. 42 (2). doi:10.7522/j.issn.1000-0240.2018.1058
Zhang, P., Xu, Z., Fan, W., Ren, J., Liu, R., and Dong, X. (2019). Structure dynamics and risk assessment of water-energy-food nexus: A water footprint approach. Sustainability 11 (4), 1187. doi:10.3390/su11041187
Zhang, Q. F., Chen, Y. N., Li, Z., Xiang, Y., and Sun, C. (2022). Recent changes in glaciers in the northern tien Shan, central asia. Remote Sens. 14 (12), 2878. doi:10.3390/rs14122878
Zhang, S., Su, X., Singh, V. P., Ayantobo, O. O., and Xie, J. (2018). Logarithmic mean divisia index (LMDI) decomposition analysis of changes in agricultural water use: A case study of the middle reaches of the heihe River Basin, China. Agric. Water Manag. 208, 422–430. doi:10.1016/j.agwat.2018.06.041
Zhang, Y., An, C. B., Liu, L. Y., Lu, C., and Zhang, W. S. (2022). High-elevation landforms are experiencing more remarkable wetting trends in arid Central Asia. Adv. Clim. Change Res. 13 (4), 489–495. doi:10.1016/j.accre.2022.04.007
Zhang, Y. F., Yang, D. G., Tang, H., and Liu, Y. X. (2015). Analyses of the changing process and influencing factors of water resource utilization in megalopolis of arid area. Water Resour. 42 (5), 712–720. doi:10.1134/s0097807815050176
Keywords: crop water consumption, agricultural water management, Xinjiang, cotton, logarithmic mean divisia index
Citation: Li Y and Deng M (2022) Changes in crop water consumption in Xinjiang of China from 1989 to 2018: A Logarithmic Mean Divisia Index decomposition analysis. Front. Environ. Sci. 10:1069002. doi: 10.3389/fenvs.2022.1069002
Received: 13 October 2022; Accepted: 21 November 2022;
Published: 02 December 2022.
Edited by:
Zengyun Hu, Chinese Academy of Sciences (CAS), ChinaReviewed by:
Junqiang Yao, China Meteorological Administration, ChinaRongqin Zhao, North China University of Water Conservancy and Electric Power, China
Copyright © 2022 Li and Deng. This is an open-access article distributed under the terms of the Creative Commons Attribution License (CC BY). The use, distribution or reproduction in other forums is permitted, provided the original author(s) and the copyright owner(s) are credited and that the original publication in this journal is cited, in accordance with accepted academic practice. No use, distribution or reproduction is permitted which does not comply with these terms.
*Correspondence: Yinbo Li, bHlibzIwMThAMTYzLmNvbQ==
 Yinbo Li
 Mingjiang Deng1,2