 Jing Zhou1
 Li Wu
Li Wu
95% of researchers rate our articles as excellent or good
Learn more about the work of our research integrity team to safeguard the quality of each article we publish.
Find out more
ORIGINAL RESEARCH article
Front. Environ. Sci. , 29 November 2022
Sec. Environmental Informatics and Remote Sensing
Volume 10 - 2022 | https://doi.org/10.3389/fenvs.2022.1068205
This article is part of the Research Topic Meta-Scenario Computation for Social-Geographical Sustainability View all 60 articles
As an important part of urban public infrastructure, urban green space plays an indispensable role in urban development and public physical, mental, and emotional health. By collecting open data such as POI, OSM, and ASTER GDEM and using spatial analysis software such as ARCGIS, QGIS, and Global Mapper, this study conducted thermal analysis of crowd activities, service pressure analysis, and demand evaluation for the layout of park green space in the central urban area of Yuxi City. The results show that there are great differences in the area and spatial layout of the thermal classes of crowd activity. Class II occupies the largest area, accounting for 60.73%, while class V occupies the least area, accounting for 2.04%. The thermal classes of crowd activity decrease from the center of the city to the periphery, and their area increases with the decrease of the thermal classes. With the increase in the level of green space service pressure, the proportion of the area decreased, among which the proportion of grade I was as high as 53.20%, while that of grade V was only 1.89%, which was mainly affected by the spatial location. The demand level and the area of park green space are obviously different, mainly concentrated in the first level, accounting for 69.68% of the total demand, and the large area is scattered in the periphery of the central urban area, followed by the fourth level, accounting for 10.46%. The area of other levels, especially the high level of demand, is less. Comprehensive analysis shows that the service level, type of green space, service pressure, and demand of green space have a strong correlation with the geographical location. In future planning, Yuxi City should combine the population distribution density and land development intensity and carry out reasonable layout and planning of park green space by reducing the low-demand area, increasing the green space area of high-demand area, improving public transportation, and improving accessibility.
Under the background of ecological civilization construction, urban green space has become the current research hotspot (Danilina et al., 2021; Ye et al., 2022). As a basic element of urban green infrastructure, the urban green space system represents urban sustainability (Chen S. S. et al., 2021; Danilina et al., 2021). Urban green space is a green space open to the public, with recreation as the main function and ecology, beautification, and disaster prevention and is also an important part of the urban green space system (Wu et al., 2007; Jordan et al., 2022) and has significant social, ecological, cultural, and economic value (Zhou et al., 2020; Chen D. et al., 2021). Scientific research on the spatial distribution of urban green space services can provide theoretical and data support for evaluating the level and quality of urban services and guiding urban green space planning (Li and Lu, 2021).
The construction and development of urban green space has developed from a single urban park design to a multi-functional urban park system (Li et al., 2008; Chen, 2011). The evaluation index of urban green space has also developed from focusing on the quantity, area, shape, and structure level of urban park and other quantitative indicators (Li and Liu, 2009) to paying more attention to spatial distribution (Xue et al., 2019; Xue et al., 2020b), the visual analysis (Jinwon et al., 2022), and evaluation of the accessibility (Taleai et al., 2014; Tu et al., 2019; Addas, 2022) and the fairness (Tang and Gu, 2015; Wu and Peng, 2015; Kuang et al., 2021) of park services, and the exploratory appraisal beneficial or adverse effect (Mueller et al., 2022). With the wide application of big data in the field of urban planning (Donahue et al., 2018; Gao et al., 2021; Ma et al., 2022), the layout evaluation of urban green space tends to use urban big data for fine research (Zhai et al., 2017; Qi et al., 2018; Han and Wang, 2020), so as to achieve human-centered urban green space system planning.
All the time, the planning and design of urban green space requires first to meet the use requirements of people (Schindler et al., 2022; Wang et al., 2022). In the planning layout, according to the reasonable service radius of “300 m to see the green, 500 m to see the park” (Charlotte et al., 2022), the different types of green space are evenly distributed in the appropriate position in the city, and the service blind area of green space is avoided as far as possible. However, there is a disconnection between planning and reality in the practical application. For example, only the service radius of the planning is considered, but the real travel distance of the residents is ignored (Yoo and Roberts, 2022), or from the perspective of supply, only considering to meet the requirements of the balanced layout of green space, but ignoring the actual use of the residents’ demand and frequency (Monika et al., 2022). At the same time, the relationship between the service capacity of the road traffic network and public transportation system and the layout of urban green space is ignored. According to a series of problems, the stock of high density in the city construction and development background, the city green space layout should be to “revitalize the stock, and optimize increment” as the guidance (Xue et al., 2016), in accordance with the green low carbon and intensive land economical utilization planning (Liu Q. et al., 2021) and development concept, based on the scientific research of big data in the city to explore a new update (Qi et al., 2018; Liu et al., 2022). It promotes the construction of urban green space from an extensive layout emphasizing “quantity” to smart optimization emphasizing both “quantity” and “quality” (Lennon, 2021; Xue et al., 2023), and guides the layout adjustment and function improvement of the different types of green space at macro, medium, and micro-levels. The spatial layout planning of urban green space lags far behind the current needs of efficient development of park green space in terms of refinement and systemization (Bai et al., 2022). The urban big data, especially the urban open data, provide a scientific basis for quantitative research on the precise placement of urban green space and the precise efficiency of resources (Wu and Peng, 2015; Liu et al., 2022). Therefore, it is urgent to explore the optimization path of the spatial layout of urban green space based on the support of urban big data, to construct fine planning, management, and regulation of urban green space and efficient ecological space creation.
Focusing on an ecological environment and livable and harmonious city construction, Yuxi City has proposed several special urban and rural habitat improvement actions and plans in the process of creating a national ecological garden city. The park system planning of Yuxi City is one of the important contents. Using big data such as Point of Interest (POI), outdoor hot spots, and thermal data of crowd activity, this study carried out cluster thermal analysis, park service pressure analysis, and demand analysis to comprehensively evaluate the spatial distribution, service level, and citizens’ demand for urban green spaces. Through the support analysis of urban big data, the optimization mode of the planning and layout structure of the park system in Yuxi City was explored from the analysis of park service demand and service pressure, or accessibility and fairness, to further guide the construction of the urban green space system and improve the ecological environment of human settlements.
According to the information of the Yuxi Housing and Urban-Rural Development Bureau, by the end of 2020, the total area of urban built-up area in the central city of Yuxi is 38.70 km2, covering Hongjiu Road in the north, Dongfang Reservoir in the east, Subi Mountain in the south, and Huixi Road in the west. According to the Yuxi Green Space System Planning (2011–2030), the research scope is comprehensively defined, including Yudai Street, Fenghuang Street, Yuxing Street, and Liqi Street in Hongta District.
The DEM elevation data of the central city of Yuxi (built-up area) (Figure 1) were obtained by using open data and tools (Li et al., 2022) from the web such as Global Mapper, Geospatial Data Cloud, and ArcGIS, and were processed by bid projection conversion, area cropping, and raster output. The vector data of roads (Figure 2), water systems, and park green areas (Figure 3) in the study area were obtained using Open-Source Neighborhood Map (OSM) and used for layout evaluation after coordinate projection conversion and manual calibration.
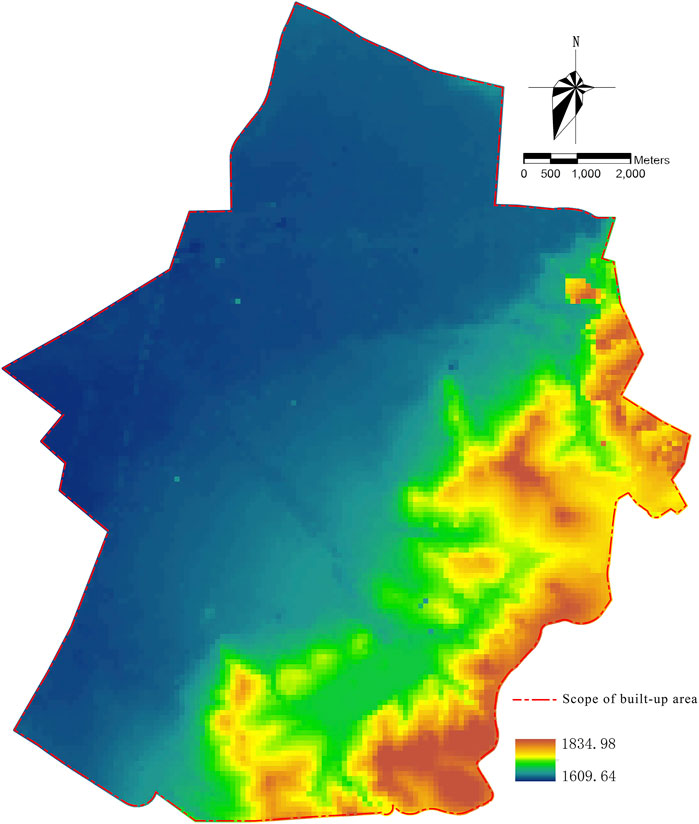
FIGURE 1. The DEM elevation of built-up area in Yuxi City.
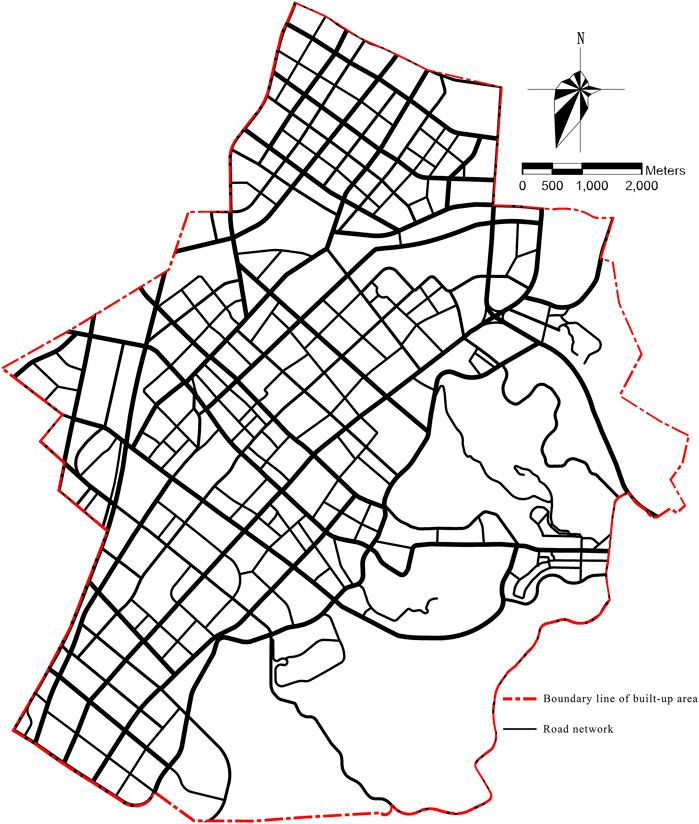
FIGURE 2. Current situation of urban roads in Yuxi City Center.
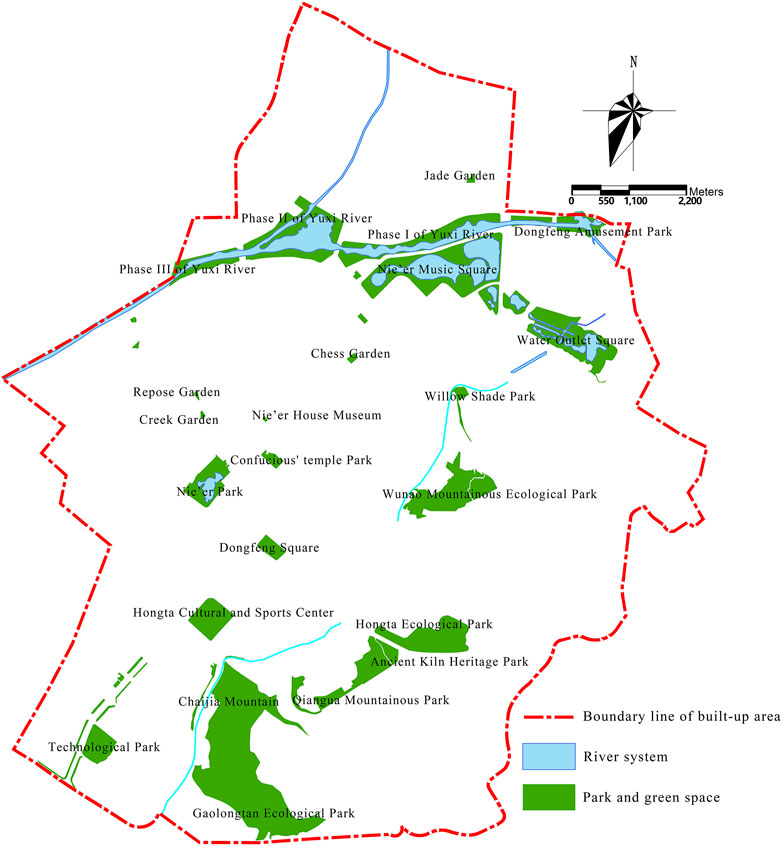
FIGURE 3. Spatial distribution of park and water in Yuxi City Center.
POI data were mainly obtained through urban open-source data. They mainly include 4,575 housing prices, 4,284 catering services, 9,427 shopping facilities, 987 transportation facilities, 1,881 companies and enterprises, 4,081 living services, 561 sports and leisure service facilities, 899 science, education, and culture facilities, 3,740 public service facilities (including medical treatment), and 1,056 residential area data within the study area, a total of 31,491 pieces of data (Table 1).
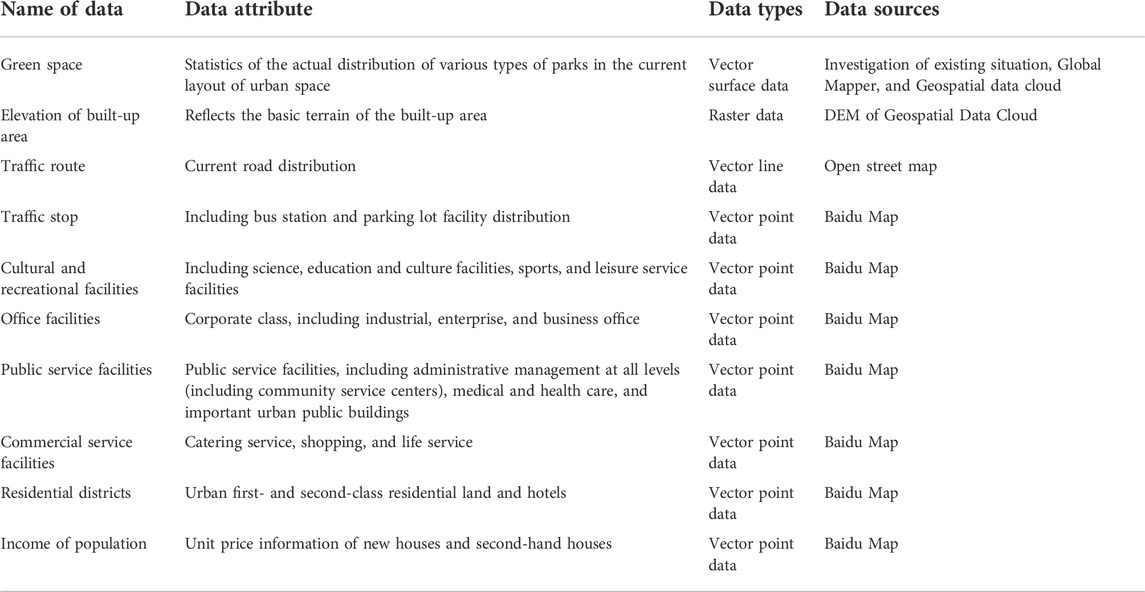
TABLE 1. Description of POI data.
By referring to relevant literature reports (Tu et al., 2020; Liu H. L. et al., 2021; Qin et al., 2021), the influencing factors of various urban areas on people’s activities, especially recreational activities, are divided into three categories: accessibility, population distribution, and social and economic status of people. The obtained data are classified and combined, and seven factors, namely, bus traffic station density, cultural and entertainment facilities, office facilities, public service facilities, commercial service facilities, residential areas, and population income are finally selected. In the POI data obtained, the number of bus stops can reflect the traffic condition and the accessibility of the region. Cultural and entertainment facilities, office facilities, large public facilities, residential areas, and other POIs were selected as direct measurement factors to obtain regional population distribution information. Since the socioeconomic status of the population is difficult to be directly obtained, it is known that the housing price is positively correlated with the socioeconomic ability of the population. Therefore, the differentiation of the socioeconomic status of the population can be obtained by obtaining the housing price information on the Anjuke.
First, the spatial distribution was analyzed for existing parks. The population thermal data processed by QGIS software were collected and input into the green land of the research area. The population thermal data within the green area were clipped, and population spatial distribution data were connected to the green area layer by using the spatial connection tool, which could reflect the spatial distribution of people’s heat toward the park. The area with the highest use density of the park was extracted as the radiation center of the park, and the radiation range of the high-frequency use area of the park was obtained. The distribution characteristics and service scope of the park space in the urban built-up area were analyzed by adding the heatmap of the distribution density of people’s outdoor activities in Yuxi City. Then, the data of the regional points with high density of human flow in the park were extracted for the radiation range analysis, which reflected the spatial distance of the actual service people in the high-frequency use space of the park within the service radius of 500 m. In combination with the hotspots of urban economic vitality, the data of interest points of restaurants, shopping malls, office areas, and residential areas were selected. The density analysis tool of QGIS was used to conduct statistics on the outdoor activities of the urban population and obtain the heatmap analysis of the main activities (Figure 4).
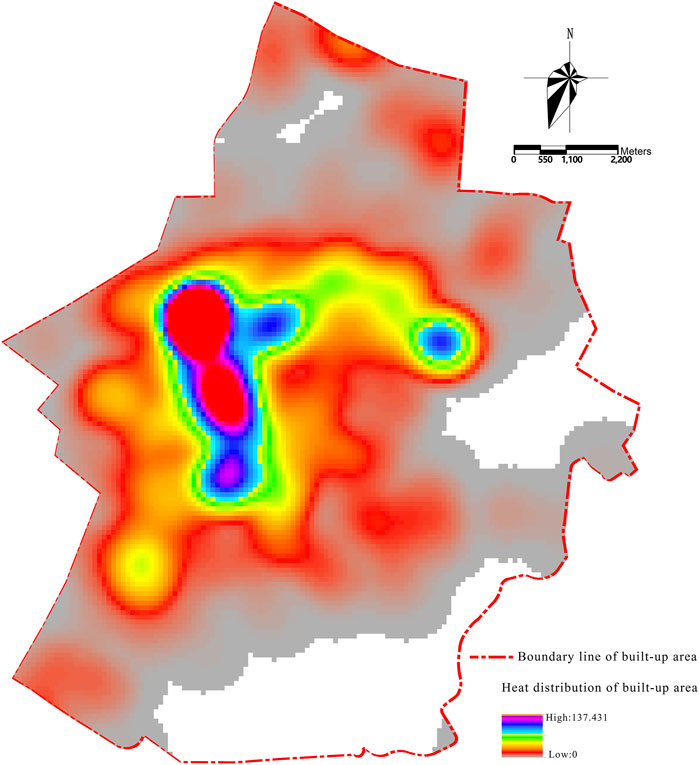
FIGURE 4. Thermal distribution of crowd activity in Yuxi City center.
Second, the service pressure can be quantitatively analyzed by the distribution characteristics and density of the people’s activities within the service range of urban parks. Existing studies have shown that areas with high population activity distribution density do not necessarily have high population density, but often have high demand for urban parks. POIs that are closely related to people’s activities and can reflect the intensity of people’s activities are selected, such as POIs of residential areas, catering, shopping, entertainment, cultural and sports activities, and financial institutions. GIS software was used to spatialize and visualize them, and the existing park locations were further generated into the 500-m service range of each park. Then, the POIs corresponding to the service range of each park and the service pressure figure of green space were obtained (Figure 5). The service pressure is calculated by the following formula:
where U is the service pressure (unit/km2), A is the area of the urban park (km2), and N is the number of POIs within the service range of the urban park (unit).
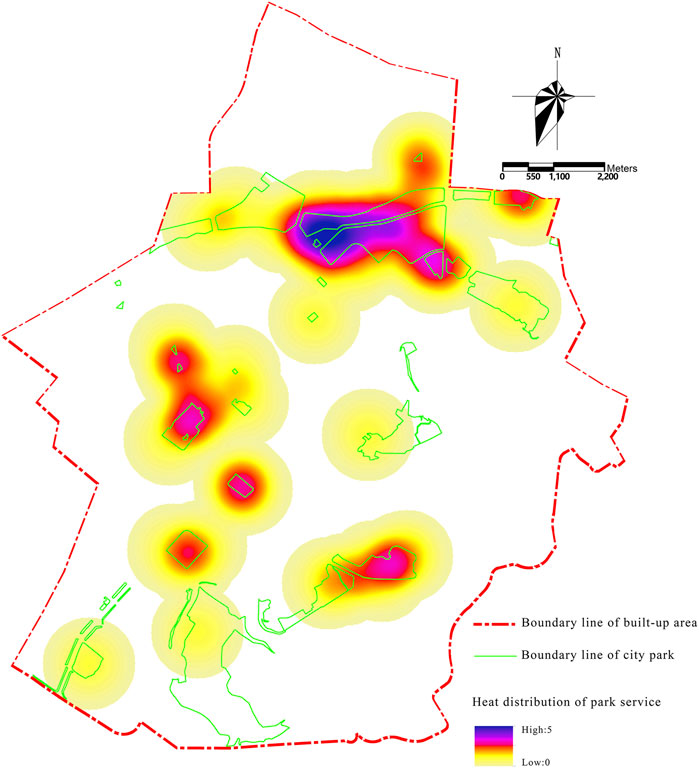
FIGURE 5. Distribution of park service pressure in Yuxi City center.
Third, the demand evaluation of people in different urban spaces for park green space was evaluated. According to the current investigation and reference to relevant studies (Yuan et al., 2021; Zhou et al., 2022), different urban space populations have different needs for park green space. The AHP method is used to determine the corresponding weights of influencing factors. By establishing the hierarchical structure model, constructing the judgment matrix, hierarchical single sorting, calculating the feature vector, consistency testing, and other steps, seven factors, namely, bus station density, cultural and entertainment facilities, office facilities, public service facilities, commercial service facilities, residential areas, and population income were selected. From the three aspects of accessibility, social, and economic status of the population and population distribution, this study evaluates the differences in the needs of people in different urban spaces for green spaces, and establishes a unified data information evaluation table. At the same time, the research area was divided into 30 m × 30 m spatial cell grids, and the grid size kept matching with the accuracy of DEM data (30 m resolution). The collected POI data related to each influencing factor were spatialized and rasterized through the geographic information system, and the raster superposition calculation was carried out according to the weight to obtain the demand evaluation of the park within the research scope (Figure 6).
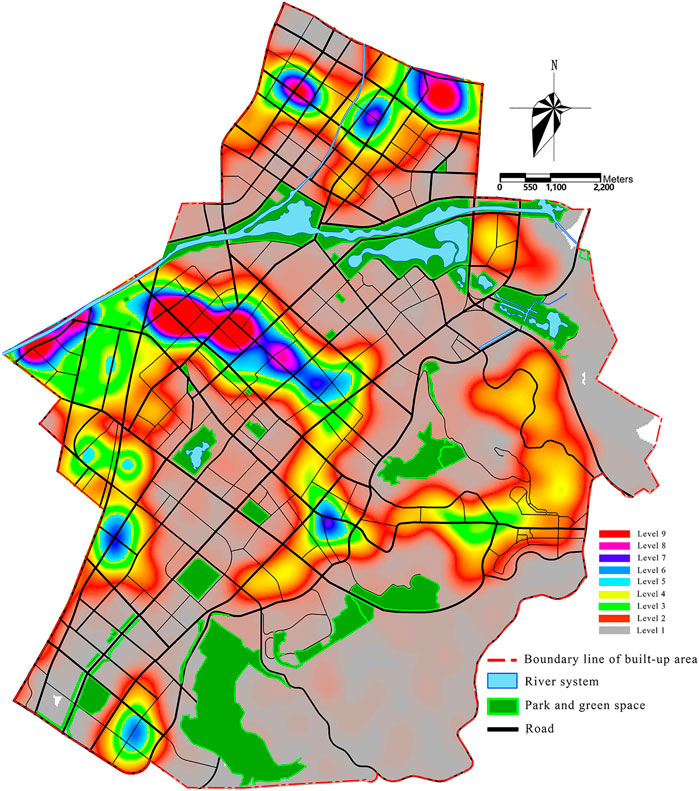
FIGURE 6. Spatial distribution of demand on urban green spaces in Yuxi City Center.
The grid aggregation density analysis tool of QGIS was used to obtain statistics on the urban population’s outgoings and obtain the crowd activity heatmap (Figure 4). On this basis, the thermal area of crowd activities is divided into six levels, and the ArcGIS 10.8 software is used to calculate the thermal area of crowd activities at all levels using a grid calculator. Heat class II of crowd activity occupies the largest area, 9.16 km2, accounting for up to 60.73%, followed by class I, with an area of 2.49 km2, accounting for 16.54%, and the area of class V is the least, only 0.31 km2, accounting for 2.04%. Figure 4shows how the thermal level of crowd activities decreases from the center of the city to the surrounding areas in space, and its area increases with the decrease of the thermal level. However, the farther away the thermal level is from the center of the city after reaching a certain level, the area also decreases, as shown in Figure 4.
After years of construction and development, the central city of Yuxi has gradually formed an overall urban pattern of “one center, two cores, and four clusters,” with the central city as the center and four clusters of Daying Street, Beicheng, Chunhe, and Yanhe in the periphery. As the central area of Hongta District, the central city basically forms a “centralized” overall layout with the old city as the core and gradually expands outward. The three areas included the central area of the old city as the main residential, commercial, and service comprehensive area; the eastern mountain area of tobacco industry production, new industrial park, as the main industrial, college, and secondary education area; and residential comprehensive area, the south and north of the residential, administrative, and commercial area, as the main urban new area.
However, it can be seen from Figure 4 that there are still two problems in Yuxi’s urban green space. The central city green system is not complete. As far as the whole urban area is concerned, a complete urban landscape green space system has not been formed yet, and there is no linear or ribbon-like connection between all kinds of green spaces. Although the background environment of mountains and the countryside around the city is good, it fails to form an organic whole. The combination of greening and urban culture is not high. The green investment in the core areas such as main entrances, urban trunk roads, and existing cultural facilities is insufficient, the theme is not prominent enough, and the cultural connotation is relatively weak. The distribution of public green space is uneven. From the perspective of urban outdoor hotspots, the heat and service pressure of the comprehensive area of living, trade, and service in the central area dominated by the old city are greater than those in other areas, indicating that the utilization rate of green space is higher, and the area of green space is smaller in this region. The plots show that public green space is mainly concentrated in the new urban areas, such as the north and southeast of the built-up area, while the central old city comprehensive area is obviously insufficient, and there is a big gap among all groups. The green space development in this area is difficult, the service radius of green space is insufficient, the building density is high, the traffic is crowded, and the ecological environment quality is declining.
With the help of the service pressure formula, the ratio of the number of POIs within the service range of each park to the park area was calculated, and the service pressure of each park was obtained (Figure 5). By referring to relevant research results and combining the population and facility density of various interest points in Yuxi City, the expert consultation method was adopted to divide the urban park service pressure in the central urban area of Yuxi City into five levels successively. The higher the level, the greater will be the service pressure. As shown in Figure 5, the service pressure level is inversely proportional to the area. The higher the pressure level, the smaller will be the area, and the lower the pressure level, the larger will be the area. The first-level area of service pressure is the largest, which is 7.68 km2, accounting for 53.20% of the total area. The second is grade 2, with an area of 4.15 km2, accounting for 28.75%. The smallest area is grade 5, accounting for only 1.89%, mainly distributed in the northeast of the central urban area (Table 2). Through the service pressure and cluster thermal analysis of the green space usage data in the central city of Yuxi City, it is found that the service level of the green space in the central city of Yuxi is strongly correlated with the type and geographical location of the urban green space (Figure 5).
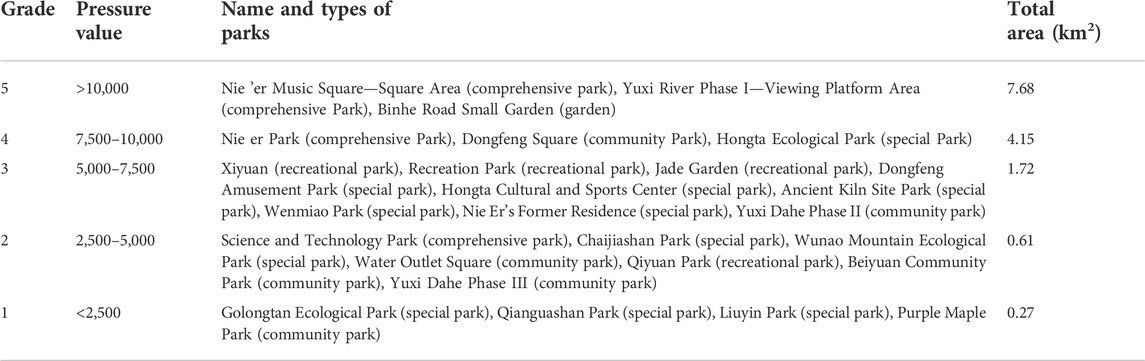
TABLE 2. Area of urban green space service pressure levels in Yuxi City.
Through comprehensive analysis, it is found that the use of comprehensive parks is affected by the type of recreation space, service facilities, and park transportation convenience. These parks are designed with diversified and characteristic recreation spaces and service entertainment facilities suitable for different users. The types of activities are also in line with the characteristics of the times and meet the recreation needs of modern people. For example, Nie Er Park and Nie Er Music Square (Yuhu area) have a large area of open squares, tree-lined walks, children’s playgrounds, beaches, and perfect surrounding commercial facilities.
The use heat and service pressure of special parks are greatly influenced by the attraction of the park theme. We can plan regular events to form characteristic recreation space and popular science education activities to attract many people. For example, the “Lantern Festival” in the landscape belt of the State River, the Memorial Park of Revolutionary Martyrs, the Ancient Kiln Site Park, Nie Er Residence, East Wind Playground, and other popular science and education theme activities have become the cultural symbols of these parks, which effectively enhance the attraction and uniqueness of the special parks. However, there is little correlation between the heat of famous special parks and the number of traffic facilities around them. In recent years, the proportion of floating population in Yuxi City has increased year by year, and foreign tourists occupy a certain proportion in the users of green space. The use of special parks is greatly affected by the popularity. Therefore, the attraction of well-known special parks to outsiders reduces the direct correlation between the use of green space and the convenience of public transport. However, special parks such as Gaolongtan Ecological Park, Qianguashan Park, Liuyin Park, Chaijiashan Mountain Park, and Wunaoshan Ecological Park, which are themed on mountain protection, water restoration, ecological recreation, and sports, are not well-known and mainly serve for the protection and restoration of the city’s ecological environment. Therefore, its entertainment facilities and accessibility are poor, not attractive, and space heat and service pressure are relatively low. Among the influencing factors of the frequency of community parks and street parks, the location of the park and its opening degree were significantly greater than the size of the park. Although the larger the scale is, the more favorable it is for the construction of recreation space, and the usage heat and service pressure are not positively correlated with the size of the park. Although the green spaces beside the streets, such as Triangle Park, Chess Park, and Jade Garden, are small in size, they occupy a favorable position, with a high degree of open use for citizens, convenient transportation links by foot and bicycle, large crowds of people around them, high heat value of outdoor activities, and higher service pressure and use frequency than other green spaces. Although the scale of community parks is relatively large, the use of heat is relatively low and the service pressure is small. Except for the high use rate of a small number of community parks that are open to the public, such as Dongfeng Square and Dongfeng Amusement Park, the service pressure and heat of large community parks, such as Outlet Square and Yuxi Dahe Phase III, are relatively low. Purple Maple Garden is mainly used by residents inside the community, and its location is relatively secluded, with low awareness of openness and public, and the pressure and heat of park service are extremely low. The analysis results are also consistent with the actual use in the survey. However, due to the lack of data on the elders and children in the POI data, the use evaluation of community parks has certain limitations.
The hierarchical structure model is established according to the required evaluation method. When constructing the judgment matrix, the index quantification table was distributed to 20 industry experts. A total of 20 quantified index tables were recovered with a recovery rate of 100%. After hierarchical single sorting, feature vector calculation, consistency test, and other steps, the weight table of impact factors was obtained (Table 3), which was transformed into the score table of the GIS evaluation index (Table 4). The natural breakpoint method is a univariate classification method based on cluster analysis. By calculating data breakpoints between classes to determine a certain number of grades, the difference between classes can be minimized and the difference between classes can be maximized. The main advantage of this method is to distinguish similar values in the data most effectively (Cai et al., 2021). Therefore, the demand evaluation value of park green space was obtained through GIS calculation, and it was divided into nine levels (Figure 6). The ArcGIS 10.8 software was used to obtain statistics on the demand area of green space at all levels, and it was found that the demand for green space in Yuxi City was mainly concentrated in level 1, with an area of 29.62 km2, accounting for 69.68% of the total demand, mainly including the peripheral and sporadic distribution in the central urban area. The next is grade 4, with an area of 4.45 km2, accounting for 10.46%. The third is level 2, with an area of 4.26 km2, accounting for 10.02%. The area of other demand levels is relatively low and has little difference.
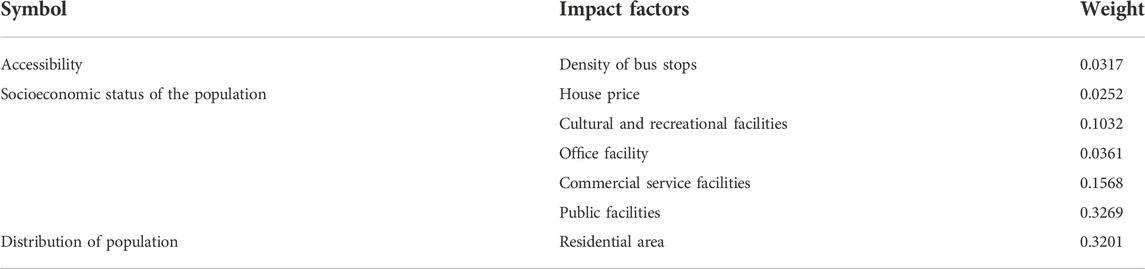
TABLE 3. Weight of the influence factor.
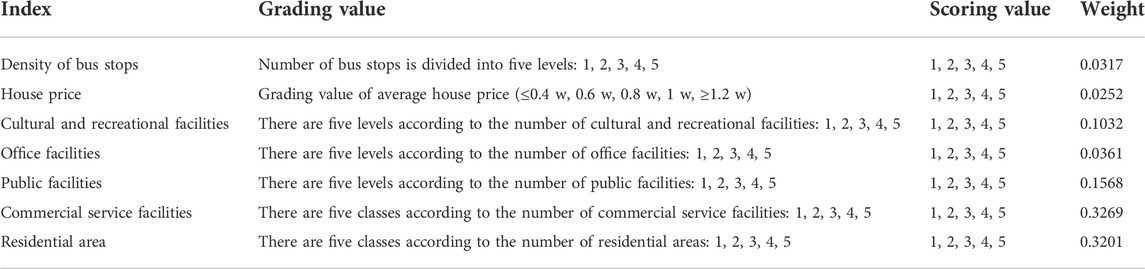
TABLE 4. Index score of GIS evaluation.
As shown in Figure 6, regions with higher demand levels occupy smaller areas, while regions with lower demand levels occupy larger areas. In fact, ideally, the area with a higher rating should have denser and better-served community parks and recreation parks and be closer or more accessible to large regional or city-wide parks. The highest demand for parks in central urban areas is along Yuxing Road, Zhongwei area, to public rental housing. Another high point is the old railway station area and rainbow community, Bailong Road in Liqi Town, Kangjing Road line area, which is also relatively high demand. Most people in Yuxi live and work in this area, which not only brings traffic pressure but also produces high-pressure and high-demand areas in terms of park services (Figure 6).
Urban big data, especially urban open data, provide a scientific basis for quantitative research on the precise placement of urban green space and the precise efficiency of resources (Wu and Peng, 2015; Chen S. S. et al., 2021). Therefore, it is urgent to explore the optimization path of the spatial layout of urban green space based on the support of urban big data (Ahas et al., 2010; Gao et al., 2021), so as to construct fine planning, management and regulation of urban green space, and efficient ecological space creation. Big data have the characteristics of huge data volume, comprehensive data coverage, and complex data types (Xue et al., 2020a; Jinwon et al., 2022; Liu et al., 2022). Therefore, when using big data to conduct relevant research, selecting appropriate data is crucial for the smooth development of the research (Xue et al., 2020b; Sim et al., 2020). This study innovatively used POI data to analyze the intensity of crowd activities and then evaluate and optimize the green space. The data are easy to obtain, the processing is relatively simple, and the results are also easy to visualize and visually present, which can avoid many influences brought by traditional planning, but there are still some problems and challenges.
On one hand, the existing big data acquisition and processing technology in the field of spatial planning is not yet mature, and there are technical blind spots in data validity, redundancy processing, stripping (Liu et al., 2022), and other aspects, and the lack of a perfect data security system (Ahas et al., 2010). At the same time, due to interests and confidentiality, it is difficult to achieve data integration and sharing between government departments and enterprises in a short period of time, which limits the breadth and depth of big data acquisition for planning and compilation (Huang et al., 2021). On the other hand, big data are more scientific in the simulation and analysis of the correlation of factors, but there are still imprecision problems in the study of causes and mechanisms (Zhang L. et al., 2022). How to integrate with traditional data analysis to avoid similar problems needs further exploration. In addition, the existing green space system planning results based on big data are still at the theoretical and methodological level, and a complete technical system has not yet been formed (Zabelskyte et al., 2022). How to promote in the industry to guide practical work and in what form to participate in the national statutory planning system will also become a challenge for future research.
But nonetheless, from the perspective of the data used, compared with the traditional spatial layout model, this study obtains the data of bus station density, housing price, cultural and entertainment facilities, office facilities, commercial service facilities, public facilities, and residential areas based on Baidu Map API, which has higher efficiency, lower cost, and more targeted experimental data. From the perspective of research methods, based on the principle of the original park layout planning, this paper introduces urban open data to quantitatively analyze the service level of urban parks and the evaluation of park green space needs from two aspects, providing a new perspective for the study of the spatial layout of urban green space.
Urban green spaces are a part of the social space and a vital part of the urban landscape and act as an environmental framework of the territory and a factor ensuring a more comfortable environment for humans (Morar et al., 2022). Since 1999, Greenbelt Park (Turf Park), Lotus Pond Park, and Yunxi Park (Triangle Park) have been rebuilt successively in the central city, and green parks such as Dongfeng Square Green Park, Highland Park, and Hongta Cultural and Sports Center have been added. In addition, the green space in front of the People’s Hospital, Yun Yuan, Qin Yuan, Nie Er’s former residence green garden, and other street green spaces are actively built. Nie Er Road, Yuhu Road, and Dongfeng South Road have become the model roads of urban greening. Qianguashan Park, Yuxi River Greenbelt Phase I, II, III Project, and Outlet Ecological Park set off the wave of ecological city construction. Relying on its own natural resources and economic advantages, Daying Street Office has been more prominent in greening work in recent years, and has built green spaces such as Huixi Park, Yuquan Temple Park, and Huilong Ecological Park. After years of efforts, the landscape of Yuxi’s central city has been fundamentally changed, and the green indicators have been greatly improved. It was awarded the title of “Provincial Garden City” in 2006 and “National Garden City” by the Ministry of Housing and Urban-Rural Development in 2010. But for a whole city, the level of construction is inadequate.
At present, Yuxi has started the compilation of Yuxi’s Territorial Space Plan (2020–2035). Therefore, the author hopes to provide some suggestions for the planning of urban green space systems and the overall planning of territorial space from the perspective of citizens’ green space use in the future, to make green space planning more scientific, reasonable, and targeted. The first is to improve public transport and the accessibility of green spaces in parks. There is a strong correlation between the green space of comprehensive parks and the distribution of public transport facilities. In the process of green space system revision, the site selection of new comprehensive parks and other green space types can rely on the location of public transport stations to improve the transportation convenience and accessibility of citizens to green space. By giving full play to the comprehensive functional benefits of urban green space, unified planning and comprehensive arrangement should be carried out.
The second is to reduce high-demand areas by rational layout of park green space. Combined with the aforementioned research results, from the perspective of the types and distribution of green space in central city parks, the distribution of green space in large parks in the north and southeast is relatively concentrated, but the use heat and service pressure are relatively low, and the frequency of green space use is low. Therefore, it is suggested that the existing park should be reconstructed, and the land use attributes should be transformed appropriately and reasonably, to enhance its vitality and attractiveness. At present, the park utilization rate in the comprehensive service area of the central old city is high, the distribution is uneven, and the service pressure is high. To increase the citizens’ green space recreation and leisure activities, it is suggested to appropriately increase some of the conditionally attached green spaces along the street, share the pressure of the high utilization rate of green space, and make up for the current situation of regional green space tension. From the POI data, it can be seen that the spatial distribution and utilization rate of green space in the west of the central city are low, and the main reason is the lack of large comprehensive parks or special parks. Therefore, it is suggested that in the new round of urban general planning revision, appropriate consideration should be given to the conversion of land use types, balancing the distribution and types of green space in each area, so that green space can serve citizens more effectively.
Finally, the recreation space is rationally planned to provide diversified leisure experiences. The main functions of urban green space can be summarized into the following aspects: protecting the urban ecological environment (Slaev et al., 2022), improving urban microclimate (Muluneh and Worku, 2022), disaster prevention and reduction (Isabella et al., 2022), education (Mendoza et al., 2022), recreation (Zhang B. et al., 2022; Zhang S. N. et al., 2022), beautification (a beautiful urban environment is conducive to attracting investment) (Li and Lu, 2021), and so on. These functions are closely related to the life and production of the citizens, and directly affect the sustainable utilization and development of the city. In the process of building green space and transforming the park, the space with low attraction should be transformed to provide a space type more in line with the recreation needs of modern people in combination with the evolution of citizens’ lifestyle.
In this study, the urban open data were used to analyze the service pressure and clustering heat of the existing park green space in Yuxi City, and the influencing factors and research paths of the optimal layout of urban green space were proposed. In terms of research methods, based on the original park layout planning principle, this paper introduces urban open data from two aspects to quantify the evaluation of the urban park service level and urban green space demand, which provides a new perspective for the study of urban green space layout. From the perspective of practice, this study can provide a certain reference for the planning and selection of park green space in Yuxi’s central city and the formulation of relevant policies.
Combined with multi-source and heterogeneous urban open data, the park layout was studied. Community information from different platforms such as Homelink and Anjuke was used for cross-validation to obtain more detailed housing price information and other data, to improve the accuracy of the park service target population positioning experiment. Based on the current road network of the city, combined with the travel data of various transportation modes such as POI of urban public transportation stations, the travel modes and routes of citizens are considered from multiple perspectives, which enhances the objectivity of the experimental data and improves the credibility of the experimental results. The POI data of urban cultural and entertainment facilities, office facilities, commercial service facilities, public facilities, and residential areas obtained from Baidu API have a relatively comprehensive grasp of the spatial and geographical location of the population distribution in the central urban area, which improves the comprehensiveness of the experimental data analysis.
Because of the principle of urban green space layout planning, the following two aspects are further considered. First, the use heat and service pressure of various urban parks are classified according to the nature of park use, to analyze the service level and efficiency of parks. The service level of green space in the central city has strong correlation with the type and geographical location of park green space. The use of the comprehensive park is affected by the type of recreation space, service facilities, and the convenience of the park transportation. The comprehensive benefit and service level of the park are high. The popularity of special parks has little correlation with the distribution number of surrounding traffic facilities, but with the characteristic recreation space and popular science education activities. The location factors of community parks and street parks are obviously greater than the scale factors, so the layout should be combined with the areas with high population distribution density and high land development intensity. Second, the evaluation index and model were constructed through the influence factors of bus station density, housing price, cultural and entertainment facilities, office facilities, commercial service facilities, public facilities, and residential areas, and the evaluation results of urban green space demand were calculated. Through the demand evaluation analysis of park green space, it is concluded that the area with a higher evaluation level should have more dense community parks and street-side green space with a higher service level and be closer or more convenient to regional or city-wide large parks.
The original contributions presented in the study are included in the article/Supplementary Material; further inquiries can be directed to the corresponding author.
JZ and JC contributed to the conception of this study. MY and JC carried out the design and production of some diagrams. JZ and LW contributed significantly to the analysis and manuscript preparation. JZ performed the data analyses and wrote the manuscript. MY and LW helped perform the analysis with constructive discussions. All authors contributed to the manuscript and approved the submitted version.
This study was supported by the National Natural Science Foundation of China (Grant No. 42161041) and the Youth Project of Science and Technology Agency in Yunnan Province (Grant No. 202101BA070001-275).
Author MY was employed by the company of Yunnan Design Institute Group Engineering Investment Co., Ltd.
The remaining authors declare that the research was conducted in the absence of any commercial or financial relationships that could be construed as a potential conflict of interest.
All claims expressed in this article are solely those of the authors and do not necessarily represent those of their affiliated organizations, or those of the publisher, the editors, and the reviewers. Any product that may be evaluated in this article, or claim that may be made by its manufacturer, is not guaranteed or endorsed by the publisher.
Addas, A. (2022). Exploring the pattern of use and accessibility of urban green spaces: Evidence from a coastal desert megacity in Saudi arabia. Environ. Sci. Pollut. Res. 29 (37), 55757–55774. doi:10.1007/S11356-022-19639-4
Ahas, R., Silm, S., Järv, O., Saluveer, E., and Tiru, M. (2010). Using mobile positioning data to model locations meaningful to users of mobile phones. J. Urban Technol. 17 (1), 3–27. doi:10.1080/10630731003597306
Bai, H., Li, Z. W., Guo, H. L., Chen, H. P., and Luo, P. P. (2022). Urban green space planning based on remote sensing and geographic information systems. Remote Sens. 14 (17), 4213. doi:10.3390/RS14174213
Cai, Y. L., Cao, S. S., Du, M. Y., Li, S. F., and Chen, S. S. (2021). Estimation and analysis of driving factors of total AHF in prefecture-level of China. J. Geo-information Sci. 23 (3), 405–418. doi:10.12082/dqxxkx.2021.200097
Charlotte, C., Dagmar, H., Stefan, H., and Dnadja, K. (2022). Urban green space interaction and wellbeing – investigating the experience of international students in berlin during the first COVID-19 lockdown. Urban For. & Urban Green., 127543. doi:10.1016/J.UFUG.2022.127543
Chen, D., Long, X., Li, Z. G., Liao, C., Xie, C. K., and Che, S. Q. (2021a). Exploring the determinants of urban green space utilization based on microblog check-in data in Shanghai, China. Forests 12 (12), 1783. doi:10.3390/F12121783
Chen, S. S., Haase, D., Xue, B., Wellmann, T., and Qureshi, S. (2021b). Integrating quantity and quality to assess urban green space improvement in the Compact City. Land 10 (12), 1367. doi:10.3390/LAND10121367
Chen, Y. S. (2011). Construction and application of suitability evaluation index system for urban park green space. J. Northeast For. Univ. 39 (7), 105–108. doi:10.13759/j.cnki.dlxb.2011.07.025
Danilina, N., Tsurenkova, K., and Berkovich, V. (2021). Evaluating urban green public spaces: The case study of krasnodar region cities, Russia. Sustainability 13 (24), 14059. doi:10.3390/SU132414059
Donahue, M. L., Keeler, B. L., Wood, S. A., Fisher, D. M., Hamstead, Z. A., and McPhearson, T. (2018). Using social media to understand drivers of urban park visitation in the Twin Cities, MN. Landsc. Urban Plan. 175 (5), 1–10. doi:10.1016/j.landurbplan.2018.02.006
Gao, Y. Y., Zhang, X. R., Zhang, Z. Q., and al, e. (2021). Research on urban spatial structure based on double constraints of POI big data and accessibility. Geogr. Geo-Information Sci. 37 (3), 59–64. doi:10.3969/j.issn.1672-0504.2021.03.009
Han, X. L., and Wang, L. H. (2020). Impact of built environmental on the vitality of micro public open space. Planners 36 (9), 64. doi:10.3969/j.issn.1006-0022.2020.09.009
Huang, Y. Y., Lin, T., Zhang, G. Q., Zhu, Y. G., Zeng, Z. W., and Ye, H. (2021). Spatial patterns of urban green space and its actual utilization status in China based on big data analysis. Big Earth Data 5 (3), 391–409. doi:10.1080/20964471.2021.1939990
Isabella, D. M., Claudia, B., Giulia, C. M., Alessandro, C., and Alessandro, P. (2022). Citizens' use of public urban green spaces at the time of the COVID-19 pandemic in Italy. Urban For. Urban Green. 77 (2022), 127739. doi:10.1016/J.UFUG.2022.127739
Jinwon, K., Jerry, L. K., and Brijesh, T. (2022). Visualizing fairness: Distributional equity of urban green spaces for marginalized groups. J. Environ. Plan. Manag. 65 (5), 833–851. doi:10.1080/09640568.2021.1915258
Jordan, P., Hoover, F. A., and Hopton, M. E. (2022). Leveraging ancillary benefits from urban greenspace-a case study of St. Louis, Missouri. Urban Water J. 19 (3), 314–323. doi:10.1080/1573062X.2021.2001544
Kuang, W., Li, S., and Zhou, H. D. (2021). Method of accurately evaluating spatial equity of urban park green space: A case study of haidian District, beijing. J. Huazhong Agric. Univ. 41 (11), 36–44. doi:10.13300/j.cnki.hnlkxb.2022.01.015
Lennon, M. (2021). Green space and the compact city: Planning issues for a 'new normal. Cities Health 5 (1), 212–215. doi:10.1080/23748834.2020.1778843
Li, B., Song, Y., and Yu, K. J. (2008). Evaluation method for measurement of accessibility in urban public green space planning. Acta Sci. Nat. Univ. Pekin. 44 (4), 618–624. doi:10.13209/j.0479-8023.2008.096
Li, K. Y., and Lu, L. (2021). Research on spatial distribution of urban green space service based on POI data: A case study of zhengzhou city, Henan Province. Areal Res. Dev. 40 (6), 75–80. doi:10.3969/j.issn.1003-2363.2021.06.013
Li, W., Wang, H., Zhang, S., Jiang, B., and Young, L. S. (2022). Spatial and temporal evolution of urban green space pattern based on GIS sensors and remote sensing information: Taking xi’an as an example. J. Sensors 2022, 1–8. doi:10.1155/2022/3648880
Li, X. M., and Liu, C. F. (2009). Accessibility and service of Shenyang’s urban parks by network analysis. Acta Ecol. Sin. 29 (3), 1554. doi:10.3321/j.issn:1000-0933.2009.03.054
Liu, H. L., Zheng, T. M., and Nie, J. X. (2021a). On the spatial allocation of the quantity and diversity of basic urban public service facilities: A case study of Wuhan inner city. City Plan. Rev. 45 (2), 84. doi:10.11819/cpr20210211a
Liu, Q., Hou, L., Sana, S., Usman, T., Rabia, R., and Shahla, R. S. (2021b). Perceptions of spatial patterns of visitors in urban green spaces for the sustainability of smart city. Int. J. Distributed Sens. Netw. 17 (8), 155014772110340. doi:10.1177/15501477211034069
Liu, S., Su, C., Yang, R., Zhao, J., Liu, K., Ham, K., et al. (2022). Using crowdsourced big data to unravel urban green space utilization during COVID-19 in Guangzhou, China. Land 11 (7), 990. doi:10.3390/LAND11070990
Ma, Q., Wang, L. X., Gong, X., and Li, K. (2022). Research on the rationality of public toilets spatial layout based on the POI data from the perspective of urban functional area. J. Geo-Information Sci. 24 (1), 50. doi:10.12082/dqxxkx.2022.210331
Mendoza, H., Loureiro, L. R., Gadeyne, S., Lefebvre, W., Vanpoucke, C., and Casas, L. (2022). Urban green spaces and suicide mortality in Belgium (2001-2011): A census-based longitudinal study. Environ. res., 114517. doi:10.1016/J.ENVRES.2022.114517
Monika, O., Michael, D., and Jennifer, D. (2022). Urban greenspace access, uses, and values: A case study of user perceptions in metropolitan ravine parks. Urban For. Urban Green., 127522. doi:10.1016/J.UFUG.2022.127522
Morar, C., Lukić, T., Valjarević, A., Niemets, L., Kostrikov, S., Sehida, K., et al. (2022). Spatiotemporal analysis of urban green areas using change detection: A case study of kharkiv, Ukraine. Front. Environ. Sci. 10 (2022), 823129. doi:10.3389/FENVS.2022.823129
Mueller, W., Milner, J., Loh, M., Vardoulakis, S., and Wilkinson, P. (2022). Exposure to urban greenspace and pathways to respiratory health: An exploratory systematic review. Sci. Total Environ. 829 (2022), 154447. doi:10.1016/J.SCITOTENV.2022.154447
Muluneh, M. G., and Worku, B. B. (2022). Contributions of urban green spaces for climate change mitigation and biodiversity conservation in Dessie city, Northeastern Ethiopia. Urban Clim. 46 (2022), 101294. doi:10.1016/J.UCLIM.2022.101294
Qi, R. H., Yang, W. R., Wang, S. L., Xie, Q. Y., and Wang, Y. J. (2018). Study on evaluation and planning of urban parks based on Baidu POI data. Chin. Landsc. Archit. 34 (3), 32. doi:10.3969/j.issn.1000-6664.2018.03.006
Qin, S. W., Yang, J. Y., Feng, Y. R., and Yan, S. (2021). Spatiotemporal vitality and influencing factors of urban parks based on multi-source data: A case study of nanjing. Chin. Landsc. Archit. 37 (1), 68–73. doi:10.19775/j.cla.2021.01.0068
Schindler, M., Le, T. M., and Caruso, G. (2022). How far do people travel to use urban green space? A comparison of three European cities. Appl. Geogr. 141 (2022), 102673. doi:10.1016/J.APGEOG.2022.102673
Sim, J., Miller, P., and Swarup, S. (2020). Tweeting the high line life: A social media lens on urban green spaces. Sustainability 21 (12), 8895. doi:10.3390/su12218895
Slaev, A. D., Alexander, E. R., Zdravkov, Z., Ivanov, V., and Georgieva, S. (2022). Market tools for the provision of urban green spaces in post-socialist Sofia. Land Use Policy 122 (2022), 106377. doi:10.1016/J.LANDUSEPOL.2022.106377
Taleai, M., Sliuzas, R. V., and Flacke, J. (2014). An integrated framework to evaluate the equity of urban public facilities using spatial multi-criteria analysis. Cities 40, 56–69. doi:10.1016/j.cities.2014.04.006
Tang, Z. L., and Gu, S. (2015). An evaluation of social performance in the distribution of urban parks in the central city of Shanghai: From spatial equity to social equit. Urban Plan. Forum 48 (9), 48–56. doi:10.16361/j.upf.201502001
Tu, X. Y., Huang, G. L., Wu, D. F., and Guo, X. (2020). How do travel distance and park size influence urban park visits? Urban For. Urban Green. 52 (2020), 126689. doi:10.1016/j.ufug.2020.126689
Tu, X. Y., Huang, G. L., and Wu, J. G. (2019). Review of the relationship between urban green space accessibility and human well-being. Acta eco. Sin. 39 (2), 421–431. doi:10.5846/stxb201802030294
Wang, P. W., Han, L. R., and Mei, R. (2022). An impact asymmetry analysis of small urban green space attributes to enhance visitor satisfaction. Int. J. Environ. Res. Public Health 19 (5), 2922. doi:10.3390/ijerph19052922
Wu, D. F., Yang, R., and Liu, H. L. (2007). Minneapolis park system and its water space. Chin. Landsc. Archit. 23 (3), 24. doi:10.3969/j.issn.1000-6664.2007.03.006
Wu, H., and Peng, Z. H. (2015). Application of big data technology in urban planning. City Plan. Rev. 39 (9), 93–99. doi:10.11819/cpr20150916a
Xue, B., Xiao, X., and Li, J. Z. (2020a). Identification method and empirical study of urban industrial spatial relationship based on POI big data: A case of Shenyang city, China. Geogr. Sustain. 1 (2), 152–162. doi:10.1016/j.geosus.2020.06.003
Xue, B., Xiao, X., Li, J. Z., and Xie, X. (2020b). Analysis of spatial economic structure of Northeast China cities based on Points of Interest big data. Sci. Geogr. Sin. 40 (5), 691–700. doi:10.13249/j.cnki.sgs.2020.05.003
Xue, B., Xiao, X., Li, J. Z., Xie, X., Ren, W. X., and Lu, C. P. (2019). POI-based analysis on the affecting factors of property prices' spatial distribution in the traditional industrialarea. Hum. Geogr. 34 (4), 106–114. doi:10.13959/j.issn.1003-2398.2019.04.013
Xue, B., Xiao, X., Li, J. Z., Zhao, B. Y., and Fu, B. (2023). Multi-source data-driven identification of urban functional areas: A case of shenyang, China. Chin. Geogr. Sci. doi:10.1007/s11769-022-1320-2
Xue, B., Zhang, L., Geng, Y., Mitchell, B., and Ren, W. (2016). Extended land use categories in urban brownfield redevelopment of China: Case of Tiexi District, Shenyang of China. J. Urban Plan. Dev. 142 (3), 1. doi:10.1061/(ASCE)UP.1943-5444.0000309
Ye, J., Kang, S. Q., Fu, G. S., Lü, H. Y., Qian, W. Q., and Tang, X. H. (2022). Research progress of urban green space landscape pattern change based on satellite remote sensing. Bull. Surv. Mapp. (3), 23–27. doi:10.13474/j.cnki.11-2246.2022.0071
Yoo, E. h., and Roberts, J. E. (2022). Static home-based versus dynamic mobility-based assessments of exposure to uUrban green space. Urban For. Urban Green., 127528. doi:10.1016/J.UFUG.2022.127528
Yuan, B., Zhou, L., Dang, X., Sun, D., Hu, F., and Mu, H. (2021). Separate and combined effects of 3D building features and urban green space on land surface temperature. J. Environ. Manage. 295, 113116. doi:10.1016/j.jenvman.2021.113116
Zabelskyte, G., Kabisch, N., and Stasiskiene, Z. (2022). Patterns of urban green space use applying social media data: A systematic literature review. Land 11 (2), 238. doi:10.3390/LAND11020238
Zhai, X. J., Sun, X. H., and Sun, Z. Y. (2017). Research on the quantity and distribution characteristics of public cultural facilities in central area of Zibo city based on POI data. J. Shandong Normal Univ. Nat. Sci. 32 (2), 73–79. doi:10.3969/j.issn.1001-4748.2017.02.013
Zhang, B., Xie, Z. X., Hao, L., and Gao, J. X. (2022a). The leisure service and its spatial differences of urban green space in Shanghai. Ecol. Sci. 41 (2), 114–123. doi:10.14108/j.cnki.1008-8873.2022.02.014
Zhang, L., Chen, P. F., and Hui, F. M. (2022b). Refining the accessibility evaluation of urban green spaces with multiple sources of mobility data: A case study in Shenzhen, China. Urban For. Urban Green. 70 (2022), 127550. doi:10.1016/J.UFUG.2022.127550
Zhang, S. N., Li, X. P., Chen, Z. L., and Ou, Y. Y. (2022c). A bibliometric analysis of the study of urban green spaces and health behaviors. Front. Public Health 10 (2022), 1005647. doi:10.3389/FPUBH.2022.1005647
Zhou, L., Yuan, B., Hu, F. N., Wei, C. Z., Dang, X. W., and Sun, D. Q. (2022). Understanding the effects of 2D/3D urban morphology on land surface temperature based on local climate zones. Build. Environ. 208 (2022), 108578. doi:10.1016/j.buildenv.2021.108578
Keywords: urban green space, big data, geoinformation technology, layout evaluation, Yuxi City
Citation: Zhou J, Yang M, Chai J and Wu L (2022) Evaluation on the urban green space layout in the central city of Yuxi based on big data. Front. Environ. Sci. 10:1068205. doi: 10.3389/fenvs.2022.1068205
Received: 12 October 2022; Accepted: 11 November 2022;
Published: 29 November 2022.
Edited by:
Bing Xue, Institute for Advanced Sustainability Studies (IASS), GermanyReviewed by:
Meng Zhang, Xi’an Jiaotong University, ChinaCopyright © 2022 Zhou, Yang, Chai and Wu. This is an open-access article distributed under the terms of the Creative Commons Attribution License (CC BY). The use, distribution or reproduction in other forums is permitted, provided the original author(s) and the copyright owner(s) are credited and that the original publication in this journal is cited, in accordance with accepted academic practice. No use, distribution or reproduction is permitted which does not comply with these terms.
*Correspondence: Li Wu, d3VsaTIwMDlAeXhudS5lZHUuY24=
Disclaimer: All claims expressed in this article are solely those of the authors and do not necessarily represent those of their affiliated organizations, or those of the publisher, the editors and the reviewers. Any product that may be evaluated in this article or claim that may be made by its manufacturer is not guaranteed or endorsed by the publisher.
Research integrity at Frontiers
Learn more about the work of our research integrity team to safeguard the quality of each article we publish.