 Rabnawaz Khan
 Akram Ahmed Noman Alabsi2*
95% of researchers rate our articles as excellent or good
Learn more about the work of our research integrity team to safeguard the quality of each article we publish.
Find out more
ORIGINAL RESEARCH article
Front. Environ. Sci. , 04 January 2023
Sec. Environmental Economics and Management
Volume 10 - 2022 | https://doi.org/10.3389/fenvs.2022.1065634
This article is part of the Research Topic Assessment of Nuclear and Renewable Energy Utilization for Sustainable Economic Growth View all 9 articles
Energy consumption has become a requirement in the modern world, and without it, the economies of developing nations cannot prosper. Consistent economic growth is a challenge for countries of all economic levels, not just the less developed ones. We test the EKC hypothesis by analyzing the relationships between GDP growth, energy consumption, agricultural output, and the consequences of carbon dioxide (CO2) emissions. From 1991 to 2016, we used panel and quantile regression analysis to compare emissions in nine developing countries with those in 13 developed countries. There is the beginning of a reverse U-shaped relationship between agricultural energy use and greenhouse gas emissions. As a result, the verified EKC hypothesis paves the way for a watershed moment in the progress of industrialized nations’ economies. As an added bonus, agricultural results have a positive impact on CO2 emissions from using liquid fuels. It has a negative impact on CO2 emissions by 19.12% and causes a 4.802 percent increase in environmental degradation. Feed cropping, deforestation, biomass burning, and deep soil and cropping also have negative effects on the environment, especially in developing countries. There is a negative correlation between CO2 emissions and economic growth in developing countries and their energy consumption. Although the EKC hypothesis for CO2 emissions was rejected at lower quantiles, it was validated for Qatar, Canada, China, and other high-emitting economies according to the empirical estimation of quantile regression. The findings of this study have important policy implications for reducing carbon dioxide emissions, suggesting that policymakers account for the stage of economic growth currently being experienced when formulating measures to cut energy use and protect the environment. In particular, policies aimed at reducing energy consumption could.
Both in developing and developed nations, the link between economic growth and CO2 emissions remains debatable and doubtful. Economies can use this correlation to develop policies for managing energy consumption and advancing their secure energy resources (Gnangoin et al., 2022; Shahbaz et al., 2022; Tutak and Brodny, 2022; Xia et al., 2022). This study measures countries’ economic growth based on their agricultural sector, cereal yield, renewable energy, manufacturing, and commerce. Quantile regression techniques with panel data have not been studied in this field, despite the fact that a number of recent studies have performed in-depth analyses of the relationship between economic growth and CO2 emissions (Liu et al., 2022a; Raghutla et al., 2022). The current Environmental Kuznets Curve (EKC) theory suggests that economic growth is associated with a decline in environmental effectiveness (Bradley, 2021; Liu et al., 2022b). Consequently, there is less concern for the profound exhaustion of oil or magnesium, and more concern for air quality, global warming, and the divine emanations of mechanical and industrial production.
In addition to the industrial sectors, modern agriculture is a major contributor to greenhouse gas emissions; in many developing countries, agriculture is now the single largest source of CO2 emissions. Particularly unsustainable agricultural practices—such as bush burning, deforestation, and the burning of biomass fuel—account for 21% of the world’s greenhouse gas emissions, and are responsible for the oxidation of organic compounds in soil. Soil organic compounds from cultivated land can mitigate environmental CO2 emissions from agricultural production and modification. In this light, both developing and developed nations need to investigate the connection between rising agricultural output and increasing carbon dioxide emissions (Han et al., 2022). Effects of economic expansion on agricultural output and energy use were analyzed using quantile regression and the EKC hypothesis. On the other hand, agriculture is crucial for reasons like non-oil exports, food security, foreign exchange, etc. plays an important part in a growing economy, as evidenced by its share of total energy consumption, as measured by gross national product per capita, as well as its presence in the manufacturing and commercial sectors (Koondhar et al., 2021; Pakrooh et al., 2021). By expanding and improving its spending on sustainable development, the country can lessen its carbon footprint and make its infrastructure more resilient to climate change (Kocak and Alnour, 2022).
Several concepts related to CO2 emissions have been investigated using the Environmental Kuznets Curve (EKC). Developing countries would be better off following a different growth path than the EKC, which advocates for rapid economic expansion at the expense of environmental sustainability (Balsalobre-Lorente et al., 2021; Beyene, 2022). The U-shaped Environmental Kuznets curve (EKC) shows that environmental degradation is proportional to income, rising as income rises due to agricultural output and falling once income is no longer a constraint (Liu and Lai, 2021). But if trade policies and economic growth are coordinated, the energy sector will benefit. Keeping the economy growing at its current rate is not conducive to protecting the environment (Leal and Marques, 2020). Because of the notorious carbon leakage problem and the embodied carbon emission in exports not contacted in the production-based emission accounting, a significant portion of production in emerging economies goes to satisfy consumption in developed countries (Adnouni et al., 2023).
Because of its reliance on fossil fuels for its energy needs, agriculture is also a major contributor to the greenhouse gas emissions and carbon dioxide emissions of developed economies, accounting for 16.5 billion tonnes of the world’s total agri-food production in 2019 (UN, 2021) Although agricultural output fell by 2% from a decade ago, GHG emissions from farms increased to 582 million metric tons in 2017. Nonetheless, farmers help with CO2 emission confiscation efforts through things like reforestation, wetland restoration, grassland preservation, and the elimination of greenhouse gases (Aguilera et al., 2021). The most important takeaway from this research was identifying issues and CO2 emissions associated with using liquid fuels in the agricultural, industrial, and commercial sectors of both developing and developed nations. In addition, the existing hypothesis and economic factors in the 22 countries influence the income-induced EKC emissions from agriculture. This study hypothesized that developing countries would be more integrated based on a comparison to agriculture production in developed countries. In addition, the liquid consumption of developing (Brazil, Argentina, Mexico, and Malaysia) countries is growing due to agricultural and industrial production, while the intensity level of CO2 emissions in developed (Netherlands, Germany, and Canada) and developing (Russia, Qatar, and Malaysia) countries is higher.
Agricultural goods’ production and consumption trends in developing and developed countries are compared, as are the inputs required to produce these goods. Agricultural output was evaluated across a wide range of cereals, including wheat, rice, maize, and more. From a global perspective, nine developing countries and thirteen developed countries are analyzed for their CO2 emissions and liquid fuel consumption in the agriculture sector, with maize being the most intensively studied crop and grain being the least. Developed countries have a different perspective on emissions and agricultural output (Figure 1). Estimated results for all commodities showed a significant slowdown in the growth rate of cereal production.
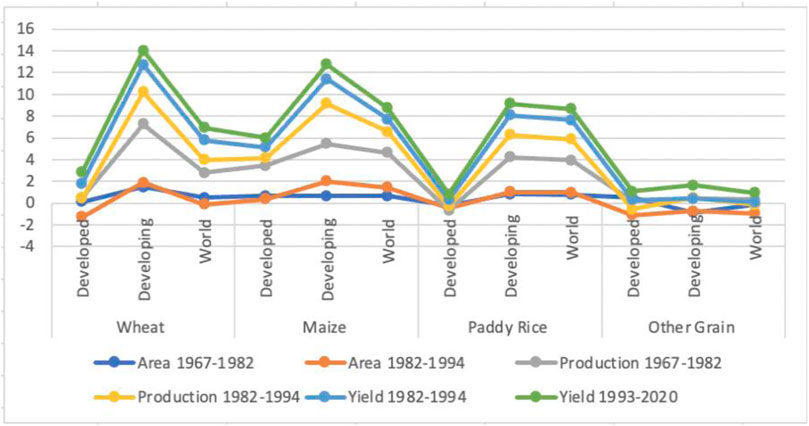
FIGURE 1. Agriculture productions. Sources: http://www.fao.org/3/x9447e07.htm#Notep.
Agriculture and cereal output in both developing and developed nations are also compared. CO2 emissions associated with farming and grain harvesting are shown in Figure 2. Using the estimated values for agriculture (AGR) and cereal (CY), we first calculated the sum of ARG and CY for whole years, and then we divided that number by the total number of developing and developed countries’ sum of ARG and CY value. This allowed us to determine the actual percentage of individual countries in Figures 2, 3, and it allowed us to examine the highest influence of explanatory variables with percentages. The highest combined AGR and CY growth rate is%. China has the highest cereal yield (in kilograms per hectare) among developing countries due to its high value-added agriculture, forestry, and fishing. In addition, 45 percent of agricultural output is the root of 23 percent of C-LF. Furthermore, Turkey has the highest AGR production at 6%, including 2% each of C-LF and C-EM (Yu et al., 2020; Meijian Yang et al., 2021; Le, 2022).
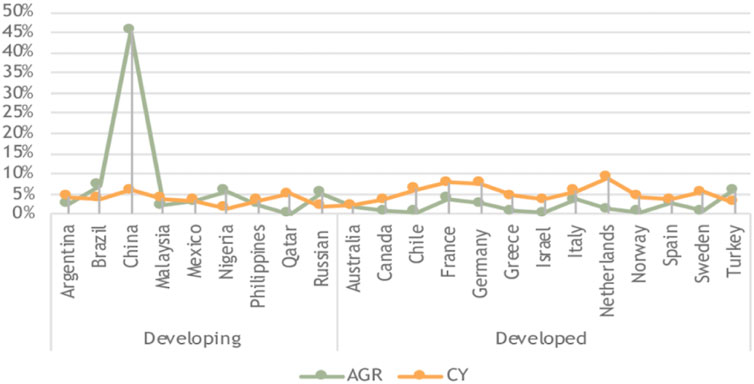
FIGURE 2. Carbon emissions with agriculture and cereal production.
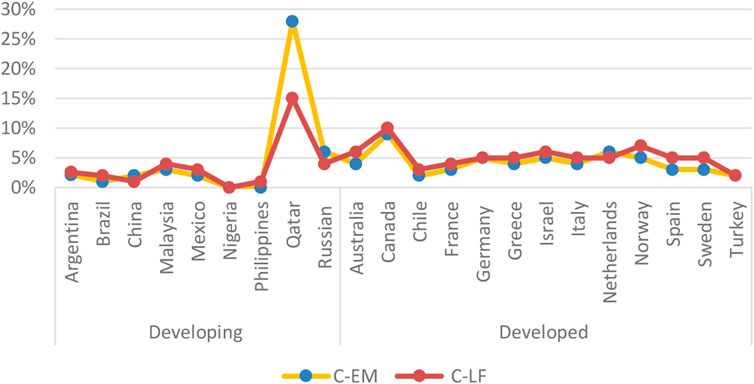
FIGURE 3. CEM of developing and developed countries.
There has been conflicting evidence from previous research on the EKC’s effect on agricultural output. No clear distinction can be made between the CO2 emissions emitted by agriculture production and the emissions stimulated by the various methods of cultivation practice and new mechanical strategies because not enough research has been done to identify and examine the impact of environmental degradation on agriculture, industries, and trade (Gaies et al., 2022; Jiang et al., 2022a; Xu et al., 2022). The EKC development method was refined on the back of a wealth of clean data, an abundance of serious resources, and a massive natural windfall; as a result, it is a model that other developing countries should emulate (Shensi Wang et al., 2021; Chen et al., 2022). The peak energy of intensity theory states that energy rises during industrialization, reaches a peak, and then declines, which is borne out by CO2 emissions and EKC. According to the Sun, a carbon emissions EKC peak occurred due to abnormal economic and development growth only in developing countries (Mardani et al., 2019; Mian Yang et al., 2021; Yirong, 2022).
A portion of the literature investigates the relationship between EKC and national income, and greater environmental quality, as well as their effects on developed and developing nations (Balado-Naves et al., 2018; Balsalobre-Lorente et al., 2021). The EKC starting point revealed an inverted U-shaped relationship between per capita income and energy intensity in developing countries, and the error correction model identified CO2 emissions (Rashid Gill et al., 2018; Ben Cheikh et al., 2021). Examining the study and calculating the Kuznets’ ratio, it was discovered that developed countries tend to have a lower degree of inequality than developing countries (Farooq et al., 2022). That the evidence of the inverted U-hypothesis, concerning the relationship between economic growth and inequality, contradicts the hypothesis. It indicates that income inequality was greater in developing nations than in developed nations, but that after a certain point, economic growth will reduce environmental pressure (Akram et al., 2020; Liu and Lai, 2021; Tenaw and Beyene, 2021).
(Balogh, 2022) Trade agreements were used to verify the effects of reducing emissions on the economy, agricultural production, and climate change (Wu et al., 2021). The findings revealed a hitherto unrecognized consequence of trade: The decrease in greenhouse gas emissions caused by agricultural exports. Agricultural trade has indirect environmental effects on climate change, such as the expansion of export crops leading to deforestation and soil erosion, raising the issue of transportation-related energy use and emissions, and this trade has grown significantly over the past few decades and has experienced annual growth (Muhammad et al., 2020; Wasti and Zaidi, 2020). The impact of agricultural expansion and commerce on greenhouse gas emissions, particularly in emerging and developed countries, is poorly studied despite its significance. It emphasizes the developing world’s role in the global economy and makes suggestions for how climate and trade policymakers in the largest emitter countries might help slow the pace of economic expansion, agricultural, and trade-related CEM emissions (Essandoh et al., 2020; Balogh, 2022). Alternatively, rising economic activity in this economic bloc has a multiplicative effect on environmental deterioration through boosting consumption-based carbon emissions (Ali et al., 2022). This study recommends expanding investment in green innovations and implementing legislation aimed at reducing carbon emissions in the agricultural, industrial, and trade sectors (Huang et al., 2022; Meng et al., 2022).
We examine how agricultural output affects EKC, GDP growth, CO2 emissions, and energy consumption. CEM (C-EM and C-LF) is depicted in Figure 3; as a developing country highest carbon emission is recorded in Qatar, which accounts for 28% of C-EM and 15% of C-LF, while a developed country like Canada accounts for 9% of C-EM and 10% of C-LF (Xu et al., 2019a). The lowest C-EM and C-LF are recorded in Nigeria and Turkey in developing and developed countries (Billig et al., 2019; Hao et al., 2020; Shabani et al., 2021). Due to CO2 spillage issues and the need to enclose CO2 emissions, a sizable portion of the developing world’s economic output is met by the generation sector (Amin et al., 2020; Jiang et al., 2021). In this study, we look at twenty-two different nations and disentangle the growth in CO2 emissions from the expansion of agricultural production and the use of machinery in the field. This implication will aid in shifting the focus of governments and private organizations in both developing and developed nations toward effective measures to curb carbon dioxide (CO2) emissions.
To the best of our information, we found no previous research that used panel data to examine the effects of the EKC hypothesis on agricultural output across 22 countries (9 developing and 13 developed). This paper helps us make sense of the prior research by critiquing a subset of the EKC hypothesis, which holds that there is an inverse U-shaped relationship between national income (after accounting for the effects of agriculture production) and environmental quality in developing and developed countries (Jiang et al., 2021; Ridzuan et al., 2020). As a result, CO emissions will be significantly impacted by policies geared toward globalization, economic growth, agriculture, and the use of renewable energy (Ehigiamusoe and Dogan, 2022). Policymakers in both developing and wealthy countries are given substantial advice based on the study’s findings (Adebayo et al., 2022). In light of the EKC hypothesis, this research seeks to identify important implications for economic and environmental mitigation policies by analyzing the connections between economic growth, agriculture, cereal yield, renewable energy consumption, industries and trade, and CO2 emissions in both developing and developed nations. Additionally, this study uses two distinct technical models to determine the EKC effects, one of which (total CO2 emissions-C-EM) is per endogenous variable, and the other (CO2 emission-C-LF) is by liquid sources.
The following are the most important contributions we made to this study. The primary benefit of these studies is the adoption of the panel and quantile regression model as a robust answer to the problems of agricultural goods, industrial production, industries and trade, and energy efficiency. Second, most of these studies emphasize the smart grid system and renewable energy while fossil energy is the main fuel in economic sectors; most of these studies highlight the smart grid system and renewable energy while fossil energy is the main fuel in economic sectors; and there has been a lack of focus on agriculture products, industries, and trade with energy consumption and CO2 emissions and adjusting prices by using panel quantile regression models. A quantile regression approach, on which to zero in, could help curb the excessive demand. Third, the present study is similar to previous research in that it employs a panel quantile regression approach to identify a correlation between energy consumption and economic expansion. Forth, there are fewer gaps in the literature compared to other studies. While it has already been mentioned that transportation accounts for a significant portion of total CO2 emissions, we also considered agricultural activities as an important source. In addition, the current study is distinct because of its emphasis on energy consumption, its use of a more expansive time frame for precise analysis, and its evaluation of the disparity between CO2 emissions from developing and developed countries’ energy consumption. For CO2 emissions from different countries with non-additive fixed effects (FE) and random effects (RE), a panel quantile regression method is recommended. The study confirms agriculture productivity through the use of policy frameworks that are based on panel estimation (cross-sectional dependence) techniques and focus on keeping and altering the clad environment in countries. This study’s panel quantile regression is novel and essential for foreseeing the development of the agricultural energy market in both developing and developed nations. Fossil energy consumption and economic growth, particularly in the agricultural sector, may be explored further in this study. Furthermore, it aids policymakers in understanding the energy and climate challenges they face. It organizes the structure of this study as follows: Section 2 provides a summary of the relevant literature; Section 3 demonstrates the procedure for collecting data; Section 4 provides an overview of the study’s findings, and Section 5 draws conclusions and makes recommendations.
The years covered by the extracted database (from 1991 to 2010) were chosen at random, and their duration was also affected by the quantity of available data. As a result of data scarcity, we focus on just 22 developing and developed nations across a 25-year span (Boyle, 2022). This study employs two principal regressors drawn from the World Bank data set (WorldBank, 2022) and the Joint Research Centre’s (JRC) report on climate change (2020). The C-LF measure takes into account liquid consumption in addition to food consumption, making it similar to the C-EM measure of tons per person. Previous studies with comparable goals have been used to inform the selection and analysis of C-EM regressors (Kong and Khan, 2019; Nwaka et al., 2020; Xi Chen et al., 2020; Khan, 2021; Usman and Makhdum, 2021; Adekoya et al., 2022; Shah et al., 2022). The maintained C-EM explanatory markers are consistent with prior findings. Table 1 shows the definition and origin of the data.
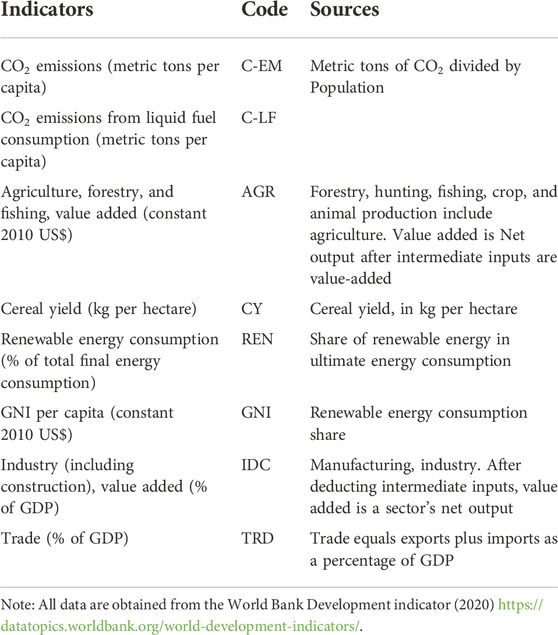
TABLE 1. Indicator definition.
The Human Development Index ranks 25 countries according to their level of social and economic development (HDI). In terms of education, life expectancy, and level of living, countries with HDIs of 0.8 or greater are considered developed. Studying nine low-income (Argentina, Brazil, China, Mexico, Malaysia, Nigeria, Philippines, Qatar, Russian Federation) and thirteen high-income (Australia, Canada, Chile, Germany, France, Greece, Israel, Italy, Netherlands, Norway, Spain, Sweden, and Switzerland) developing and developed countries in terms of environmental pollution (C-EM and C-LF), energy consumption (REN), and economic growth (GNI, IDC, and TRD) within the context of the existing hypothesis of EKC (Khezri et al., 2022). Since the effect of economic development and adaptation on CO2 emissions tends to reverse direction at the tipping point, the EKC hypothesis is gaining importance as a strategy for reducing climate change. Whether or whether there is a correlation between CO2 emissions and economic growth has been the subject of numerous research, with varying results (Shi, 2020). For the reason that agriculture, renewable energy, industry, and trade are all considered when assessing economic growth in both developing and developed nations (Nwaka et al., 2020; Beyene, 2022; Farooq et al., 2022; Rehman et al., 2022).
Since the effect of economic development and adaptation on CO2 emissions tends to reverse direction at the tipping point, the EKC hypothesis is gaining importance as a strategy for reducing climate change (Ridzuan et al., 2020; Nasir et al., 2021). There have been several attempts to test the EKC hypothesis between CO2 emissions and economic growth, but the results have been inconsistent. Because of how important it is to consider agriculture, renewable energy, industry, and trade when assessing the progress of economies in both developing and developed nations (Kong and Khan, 2019; Xi Chen et al., 2020; Khan, 2021; Usman and Makhdum, 2021; Adekoya et al., 2022; Shah et al., 2022). C-LF is the same as C-EM in terms of response variables measured in metric tons per capita, but C-LF also takes into account liquid consumption in different economies. Previous studies with comparable goals have been used to inform the selection and analysis of C-EM regressors. The maintained C-EM explanatory markers are consistent with prior findings. In addition, many studies have attempted to draw a connection between CO2 emissions and economic growth, but their findings have been inconsistent. When factors like agriculture, trade, industry, and renewable energy are addressed, the economic growth of both developing and developed countries can be analyzed (Nwaka et al., 2020; Beyene, 2022; Farooq et al., 2022; Rehman et al., 2022).
In contrast, Explanatory indicators like AGR, CY, REN, GNI, IDC, and TRD can be investigated in depth in panels A and B. Table 1. We compute a set of descriptive statistics for each residual in the dataset. From Table 2, we can see that the Jarque-Bera statistics rule out the normal distribution hypothesis for the AGR, CY, REN, GNI, IDC, and TRD experimental indicators. Furthermore, the log-transformed experimental indicators make the regression coefficient of the exponents easy to grasp. Once the data had been log-transformed to make it more normal, it looked like this. The CEM’s explanatory factors boost precision, and any shift in descriptive power may be monitored. All CEM predictors are employed in both developing and developed nations, with C-LF having the most influence on the mean ARG value (Jiang et al., 2021). The covariance method is applied to the study of bilateral relationships between states. Panel A focuses on one of the key regressors, while Panel B focuses on the other (C-EM and C-LF). Table 3 shows that there is a negative correlation between C-EM and AGR (−0.124) and that there is a negative covariance between C-LF and ARG (−3.377). According to the evidence, both of these correlations are negative. Positive coefficients are also observed in the covariance of (C-EM and C-LF) and (CY, GNI, IDC, and TRD). We first use a standard way to calculate cross-sectional estimators for panel (A and B), and then we completely alter this strategy by employing the stimulating covariance technique. Increases in one indicator have a ripple effect on the others, as shown by the estimated findings in panel A (C-EM, CY, GNI, IDC, and TRD) and panel B (C-LF, AGR, CY, and IDC). Panels A and B always move in the opposite direction when indicator estimates are negative, indicating that the relationship between them is inverse. As a result, low-income groups (LIGs) are the only ones whose CO2 emissions become nonlinear (Jain et al., 2022; Safar, 2022; Wan et al., 2022; Wang and Yuan, 2022). The production of carbon dioxide also seems to be correlated negatively with AGR. Second, we employed a redesigned OLS method that incorporated random and fixed effects as well as quantile regression to compare emerging and developed nations.
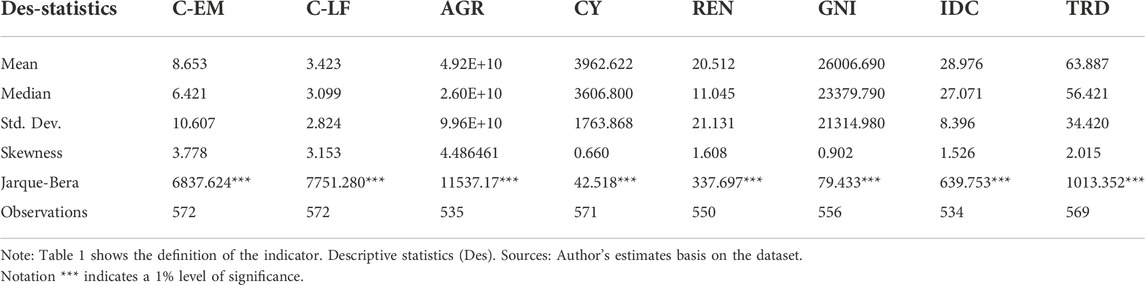
TABLE 2. Summary of descriptive statistics.
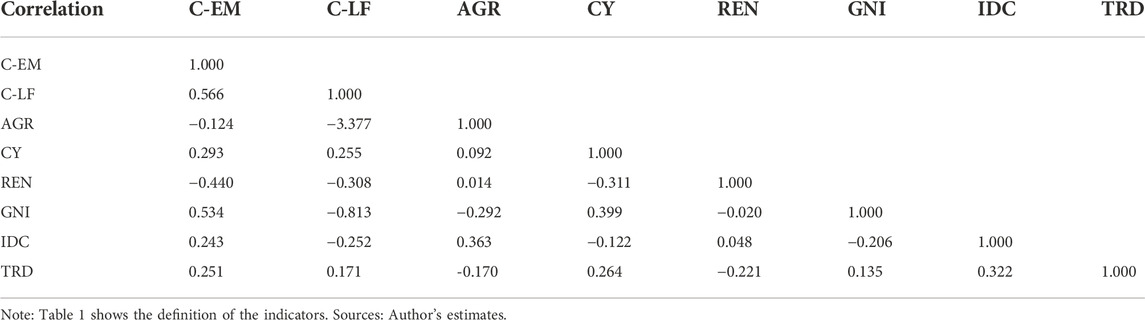
TABLE 3. Covariance analysis.
We initially computed C-EM and C-LF in two panels after calculating descriptive statistics, covariance, and a unit root test for both developing and developed countries as a whole. Following this, we calculated FMOLS, RE, FE, and Quantile regression (QR) for developing and developed nations alike (Table 4). Under the null hypothesis, we show that there is no cross-section dependence between developing and wealthy countries. Specifics of the numerical hypotheses being evaluated, including the total number of cross-sectional observations (234 and 334) and the total number of developing and developed nations (9 and 13, respectively). Furthermore, using the Breusch-Pagan LM test (Baltagi et al., 2012), we find that the estimates for both developing and developed countries, 291.941 and 664.269, are considerably larger than the upper tail of an X2 36 and 78, respectively, and so reject the null of no connection at the usual significance level. The results of the two scaled Breusch-Pagan (LM) tests and the Baltagi et al. (Greene and McKenzie, 2015). bias-adjusted LM tests, as well as the test statistics for the emerging (30.162 and 29.982) and developed (46.939 and 46.679) scenarios, all strongly reject the null at the conventional levels (Halunga et al., 2017).
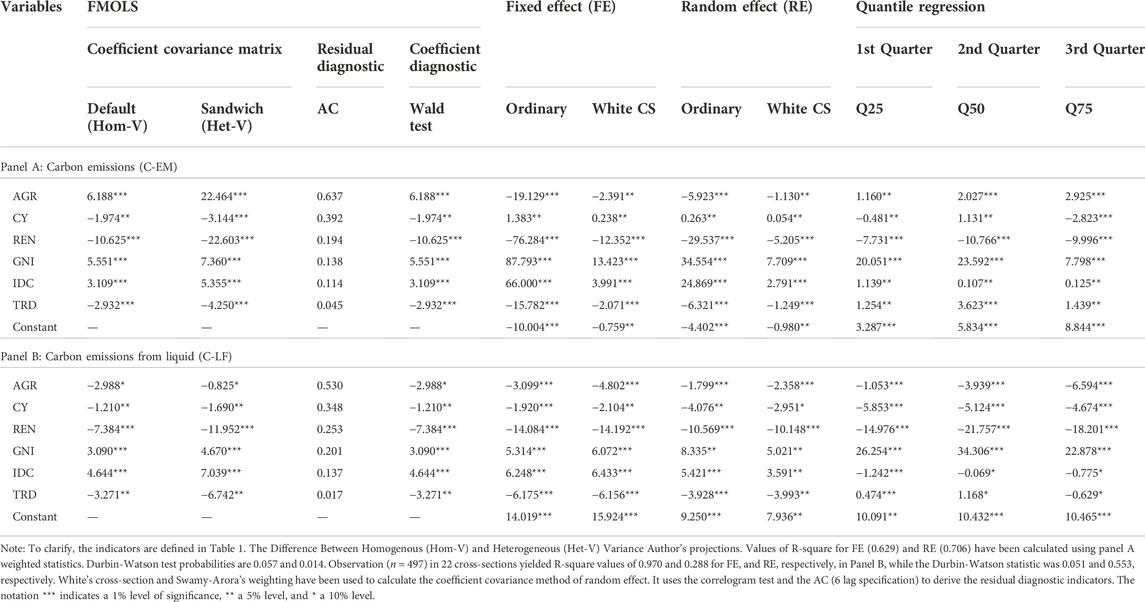
TABLE 4. FMOLS, RE, Random Effect; FE, Fixed Effect; Quantile regression across countries.
In conclusion, the effect of the bias correction on the scaled LM statistic is small when N and T are comparable in magnitude. In contrast, the test statistic value of the Pesaran CD test is much lower than that of the scaled LM test in both developing and developed countries (6.282 and 10.527, respectively), but it still rejects the null at conventional significance levels, suggesting that it may be more useful to focus on these results (Gander, 2013; Dopierała et al., 2022). Thus, we use Fully modified ordinary least squares (FMOLS) together with random effect (RE), fixed effect (EF), and quantile regression (Q25, Q50, and Q75). (Table 4), and we let the numbers for both sets rest overnight for clarity, so that the C-EM and C-LF outcomes would be more representative of underdeveloped and developed countries, respectively (Table 5). Model description as shown below:
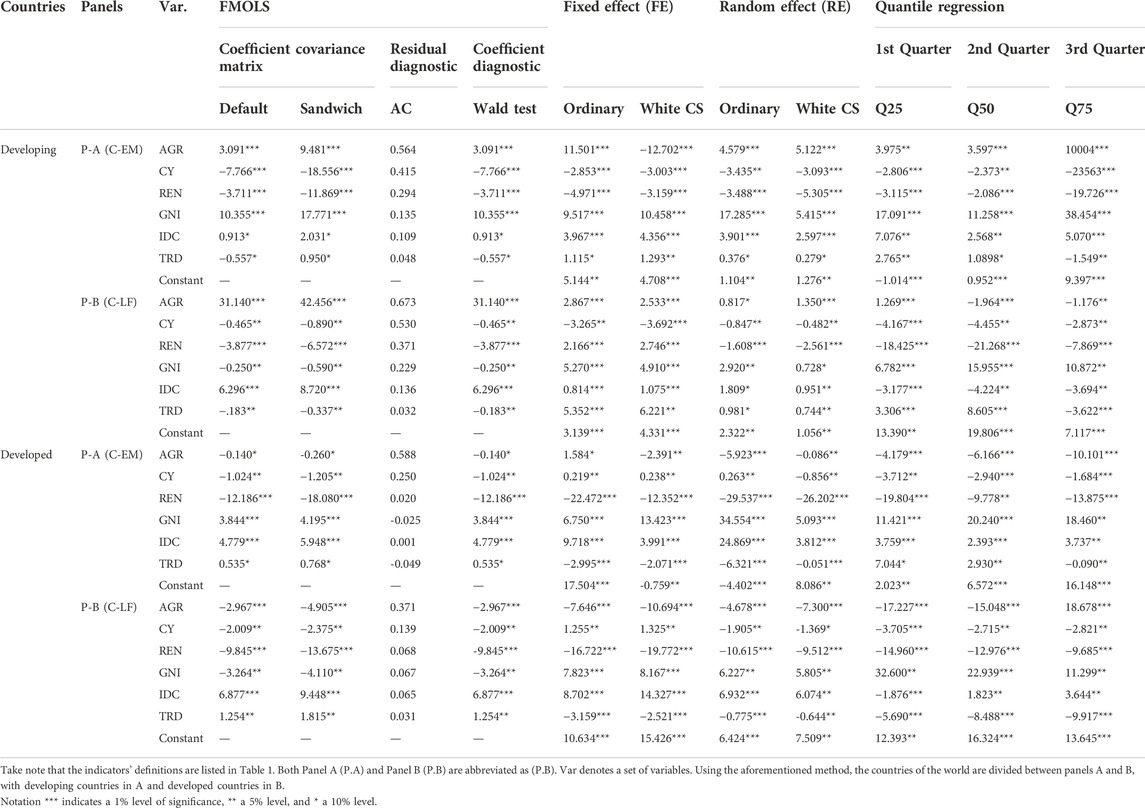
TABLE 5. FMOLS, RE, Random Effect; FE, Fixed Effect, Quantile regression of developing and developed countries.
According to the Environmental Kuznets curve (EKC) model, Eq. 1 looks like this:
The notation,
The coefficients of βs in Eq. 2 capture the effect of covariates on the response indicators (
Based on the study of the conditional mean of analysis (C-EM and C-LF) indicators across countries, with a focus on the condition determinates of CO2 emissions, this model is proposed. Repressors in panels A and B have a linear relationship because of the increasing approach of this model to quantiles. Quantile regression (QR) was utilized to generate neutral estimates in the presence of potential outliers (Hang and Xue, 2020; Xie et al., 2021). The QR method catches CEM elements crucial to both industries since environmental degradation is more severe in underdeveloped countries. More income and secure economics from expansion are more conscientious, and this effect grows with the size of the economy. Accordingly, there may be differences in the heterogeneities across developing and developed economies to environmental degradation. Agriculture plays a significant role in developing economies, and it is crucial to the health of the environment in many areas. This research departs from the standard QR in favor of a panel data framework characterized by non-additive fixed effects and the notion of an inseparable disturbance. Accordingly, the repressors can interact with the fixed effects of both developing and developed countries in this research specification. As a result, the following is the quantile specification for the panel. Increases in prosperity and economic stability lead to greater responsibility, and this trend strengthens as the economy grows (Zhou et al., 2022a). Accordingly, the responses of emerging and developed economies to environmental deterioration may be different due to their respective heterogeneities (Cheng et al., 2021). A healthy economy and environment are both dependent on agriculture. Instead of using a conventional QR, this study adopts a panel data framework with non-additive fixed effects and the concept of an indivisible disturbance, both of which differ from the norm in the QR (Singh and Kannadhasan, 2020). Therefore, in this research specification, the repressors may interact with the fixed effects of both developing and developed nations. Therefore, the panel quantile specification is as follows.
Eq. 3 revealed
In light of the fact that previous studies on regression analysis (Koenker and Bassett, 1978; Koenker, 2004; Siriopoulos and Pomonis, 2009; Nwaka et al., 2020) have found that the predictions of the ordinary least square (OLS) regression method are not valid when their assumption is not met, this study uses the Quantile Regression method to further explore the conditional determinants of CEM in developing and developed countries (JW, 2000). If the variance has a heterogeneous structure, the OLS analysis could not give a good estimate of the B vector. Alternative regression models are required, and quantile regression models, which take into account the heterogeneity structure and quantile structure of the data, can help (Ani, 2013; Lennart et al., 2008). Estimates from quantitative regression models are more resilient and flexible than those from the OLS model (Belaïd et al., 2020; Raghutla et al., 2022; Sun et al., 2022). This is because no assumptions are made about the distribution of the error term it predicts (John, 2009; Ani, 2013). The conditional mean (anticipated mean value) of the response of the dependent variable to the independent variable is used to make predictions in the OLS technique. Quantile regression (Ike et al., 2020; Sun et al., 2022), on the other hand, seeks to estimate not just the median but also the 25th, 75th, and 90th quantiles of the response variable, among others (Iddrisu and Alagidede, 2021; Xu and Lin, 2018).
In the quantile regression, developed by Koenker and Bassett (Koenker and Bassett, 1978) and further enhanced by Koenker and Hallock, the sequence of economic variables is not considered to be regularly distributed (Koenker and Hallock, 2001). Quantile regression is used to create models for certain quantiles in the conditional distribution of the dependent variable (Xu et al., 2019b; Akram et al., 2021; Cheng et al., 2021). Panels A and B employ quantile regression methods to analyze how people of different income levels in developing and wealthy nations see environmental degradation (as measured by AGR, CY, REN, GNI, IDC, and TRD). And last, the panel quantile regression model is represented by Eq. 4.
In Eq. 4, t stands for the year, and i might represent either a developing or developed country. Carbon emissions in low- and high-income countries are reflected in the regressors,
After establishing the unit root and passing the non-stationary test, the indicators in both panels are required to check for cointegration. In this empirical methodology, in what we follow, we start testing all explanatory variables in panel data, in the case of non-stationary, we investigate the long-run prevailing cointegration relationship and investigate their magnitude by long-run stationery. The panel cointegration test with panel unit root test is applied individually on all variables, which allow the serial correlation among cross-section i.e., the so-called second generation test. Therefore, it is essential to estimate the stationary of each explanatory variable by unit root test. The reliability of variables ensures by the four unit root test (Levin et al., 2002) which includes the IPS Augmented test used by cross-sectional. Pesaran (2007) used for panel unit root test and so far panel cointegration estimated error-correction by Westerlund (2007), which both account for possible cross-sectional dependencies for individual explanatory variables (Im et al., 2003).
Whether the panel data processes are stationary or not specifies in the selection of the regression model, if the panel data process is non-stationary, the conformist OLS estimation method would lead and solve a spurious problem in regression. Therefore, it is essential to examine each variable and indicate the stationary level via the unit root test. Four types of determined panel unit root tests ensure the reliability of results, which includes. Thus, according to first-generation tests such as common root-Levin, Lin (LLC), Chu and Breitung, individual Im, Pesaran, shin (IPS), Augmented Dickey-Fuller (ADF), and individual root-Fisher-PP and Hadri have been computed individually from all explanatory variables (Kao, 1995; Pedroni, 2001; Apergis and Payne, 2009). A statistical method (Kao) was used to look into the Padroni panel-test; the results showed that 2.489 with a dynamic residual value; panel B was used with ADF, PP, and rho statistics. The Padroni panel test for cointegration is investigated. By taking into account heterogeneity across countries and over time, as is done in the dimensional approach to statistics, we can calculate an autoregressive coefficient for the estimated residual and conduct a unit root test (Liddle, 2012). Additionally, both developed and developing nations have contributed to the modern series analysis of long-run cointegration relationships. Test results showed that panel A and B models are more likely to contain spurious data if non-stationary indicators were used. Fully Modified Ordinary Least Squares (FMOLS) with a focus on the maximum likelihood method (Choi, 2001; Shaoping Wang et al., 2021) for estimating cointegration regression. Due to the linear trend specification by trend variable assumption, non-stationary estimation uses a triangular system of equations. The trend coefficient for each cross-section was analyzed separately for both developing and developed nations. In addition, the Fisher’s panel cointegration test, a dynamical method that has been extended to Johansen’s causal technique used. All of the Johansen test’s individual statistics, including those used for cointegration estimation, have the same p-value. The cointegration null hypothesis is also rejected.
Panels A and B of Tables 4, 5 display the FMOLS regression and the results for each dependent indicator (C-EM and C-LF, respectively) under both fixed and random influences, respectively. The effect of FE and RE regressions is analyzed and compared using standard error, and the results are stable against the occurrence of cross-sectional influences (Bui et al., 2021; Dong et al., 2022). Fully Modified OLS is used to regulate individual intercepts in the FE estimator. It has improved upon the non-parametric method of observing panel data for properties of heterogeneous serial correlation. Both the FE and the RE demonstrate the FE’s usefulness in relation to the other model. As a result, the FMOLS will be the basis for the analysis as estimated and reported by the FE.
The middle of the output is where you can access the estimated panel coefficients (A and B). The expected Cointegrating Vector (CV) for C-EM and AGR, CY, REN, GNI, IDC, and TRD is defined by the coefficients on these variables. C-EM and C-LF had their standard errors and t-statistics (p-values) tested. First, instead of using the FMOLS transformation, we analyze all of the fit statistics with the raw data. After removing the deterministic components from the experimental indicator and the regressor, the Nonstationary performs standard FMOLS on the pooled sample. According to Default (homogenous variance) and a Sandwich (heterogeneous variance) in the coefficient covariance matrix with d.f., the long-run covariance is calculated for Pooled FMOLS estimation. The indicators in both panels A and B are statistically significant, and their results are not affected by the estimators used.
The results estimated using C-EM and C-LF for both equations in panels A and B reveal some latent pragmatic dynamics. The results of the EKC hypothesis are valid in 22 countries (nine developing and thirteen developed). However, C-LF is more prevalent in developing nations and is utilized in all robust results. The GNI has a positive correlation with the coefficient of the covariance matrix in panel A, which is 5.551. In panel B, however, the GNI results revealed a negative correlation of −0.250. A 1% change in AGR is associated with a 4.802% increase in environmental degradation, indicating that AGR has a positive and significant influence on C-LF. In developing nations, environmental issues are influenced by agricultural activity. Likewise, deforestation for feed crops, burning of biomass, and deep soil agriculture (Abdurrahman et al., 2020; Dong et al., 2022; Hao et al., 2020). According to the research presented here, the agricultural sector’s reliance on fossil fuels will have disastrous consequences in the 21st century unless steps are taken to lessen this reliance (Gnangoin et al., 2022), such as the introduction of new systems and technologies recycling basic nutrients and organics and the establishment of a recycling society that can guarantee sufficient food production regardless of fluctuations in fossil fuel availability (Mardani et al., 2019). The alternative influence of the C-EM measure of environmental degradation demonstrates that the AGR indicator has a negative relationship. This means that a 1% change in AGR reduces carbon emissions by 19.12% of total emissions. The results indicate that it does not imply a reduction in overall carbon emissions in developing and developed nations, but rather a reduction in mechanization-induced emissions from agriculture (Rabnawaz, 2021). Agriculture exports may also imply that the industrial sector (IDC) in developing and developed economies is fuel-intensive (Shahzad et al., 2020). Across developing and developed economies, the inverted U-shape is observed. Nonetheless, this may imply that developing economies are focused on economic growth rather than ecological quality in the short-term and long-term effects of sustainable environment techniques.
Adopting renewable energy (REN) mitigates environmental degradation using both CEM and industrial revolution indicators. The high consumption in developing countries, however, degrades environmental safeguards by increasing the C-LF. In both panels, the TRD openness decreased. Furthermore, the value added to industries (IDC), with developing countries (Brazil, Mexico, and Russia) recording high trade values and developed countries (Spain and Canada) recording low IDC. A 1% change in trade openness decreased C-EM and C-LF by 15.78% and 6.17%, respectively. These outcomes revealed the economic structure and nature of international trade in developing and developed economies (Jiao et al., 2020; Kicińska and Wikar, 2021; Zhou et al., 2022b).
Despite the fit that Durbin-Watson FE (0.057) and RE Coefficient Restriction (CR)/Wald test estimated output results with a CV of (1,-1) and Coefficient Restrictions (CR) with “C (1) = 0. t-statistics (p-value) estimates suggest that we do not accept the panel A and B null hypothesis that the coefficient value of the co-integrating regressor is equal to 1 under linear restriction. The estimated result of t-statistics (p-value) is around 0.000, indicating that we rejected the null hypothesis of the panel (A and B) that the coefficient value of the co-integrating regressor is equal to 1 with linear restriction. At lag 6, d.f. = 6, the residual diagnostic value of Akaike AC’s [−2(l/T)+2k/T] is estimated (reporting the Correlogram-Q-statistics). Panels A and B both have p-values below 0.05 (at 0.045 for the TRD and 0.032), indicating that the residuals are random noise and permitting us to reject the null hypothesis; this holds true for lags 1 through 6. Fixed Effects (FE) and Random Effects (RE) models were used to estimate the pool equation. Regressors (AGR, CY, REN, GNI, IDC, and TRD) and only cross-sectional identifiers (for the FE) are used to analyze a regressing model (panels A and B) in both the FE and RE. We delve deeper into the default coefficient covariance and White cross-section analysis. The default and White cross-section are used to evaluate the Coefficient Standard Errors (CSE) and the Robust Coefficient Covariance (RCC). It is the cross-sectional, periodic, and idiosyncratic error components of S.D and Rho in FE and RE that constitute the Effects Specification (ES). Rho, or intraclass correlation, reveals the fraction of variation in a regressor.
When it comes to estimating the median response, the least absolute deviation (LAD) estimator that best fits the bill is the quantile regression (QR) estimator. When compared to conditional mean analysis, conditional distribution analysis is a more in-depth method. In panels A and B, the first, second, and third quartiles are displayed. The model’s 25th, 50th, and 75th percentile response indicators are affected by the regressors. A strong distributional assumption is not necessitated by the QR method. The focus here is on a robust method (RM) for creating such connections. Panels A and B contain the results of the explanatory indicators, and their findings are discussed here. In Tables 4, 5, we also show the 25th, 50th, and 75th percentile values for the diverse factors that contribute to environmental degraders. This variation in quantiles between developing and developed countries’ determinants of environmental degradation is reflected in the conditional determinants estimate of panels A and B’s equations. The effect of AGR on C-EM and C-LF is highly variable and statistically significant at the Q25, Q50, and Q75 quartile in the total equations presented in panels A and B. Consequently, AGR is associated with environmental degradation and using the 25th, 50th, and 75th quartiles of real income, we can see how this variable affects C-EM and C-LF. There, the EKC worked particularly well at Q50 and Q75 but only moderately well at Q25, proving its validity. The quantile results for C-LF consumption show that, despite the greatest influence and having a significant pollution abatement effect, all indicators, with the exception of CY and IDC in Q50, where the cereal yield and industries association have a little low effect, are presented in Figure 2.
Canada, Qatar, Russia, and the Netherlands are among the top Q50 countries in terms of per-capita carbon emissions, and the effect of real income in these developing and developed economies is consistent with the inverted U-shaped pattern Kuznets Curve (EKC) hypothesis (Mehmood Mirza et al., 2022). The descriptive statistics shown in Figure 3 indicate that both Canada and Qatar are among the top carbon emitters among both developed and developing nations. Nigeria, the Philippines, Brazil, Chile, and Argentina all had results that supported the EKC theory. This includes countries like France, Italy, Norway, and Germany. As quantile-based mean estimators, AGR, REN, and TRD all show nearly identical influences.
Panels A and B of Figure 4 show the intensity level of CEM as determined by the EKC curve. On the x-axis, you can see developing and developed nations over time, from 1991 to 2016. 2016 in China is where the highest AGR was predicted to occur, with C-EM and C-LF levels predicted to be -0.3 and −0.6, respectively. Because China is a developing nation, it has modified its agricultural technology and decreased its intensity. With the exception of China, all other developing countries (including Qatar, Malaysia, Nigeria, and the Russian Federation) exhibit a high-intensity level in AGR, CY, TRD, and especially IDC. Similar to Qatar, 2003 saw the highest intensity, estimated at 7.7, while 2016 saw the lowest, at 0.3, for C-LF. The highest C-EM value was also recorded in 2002. However, the developed countries have a significantly lower level of intensity in AGR, TRD, CY, and REN than developing nations like Turkey, Sweden, Norway, etc.
FIGURE 4. Consequences of CEM and economic growth in panels A and B.
The quintile decomposition analysis for CEM emissions reveals that unidentified factors outside of the research model contribute to the carbon emissions gap between LIG and HIG as a result of different developing and developed economic structures and environmental policy frameworks. Nonetheless, C-LF and C-EM are disproportionately high in comparison to observed economic factors and agriculture. Table 4 shows the results of an FMOLS, FE, RE, and cross-country quantile regression (Q25, Q50, and Q75) analysis for all 22 countries, including nine developing and 13 developed nations, with panels A and B providing separate elaboration on the existence of the EKC hypothesis in terms of CEM. Panel A shows a positive effect for AGR, GNI, and IDC, while panel B shows a favorable effect for GNI, and IDC. Based on the projected results, it seems that a 1 percent shift in an explanatory indicator has a far larger impact on C-EM than C-LF. Results for nine developing nations and 13 developed countries are shown in Table 5. Estimates imply that developing countries have a greater degree of similarity in their growth plans and C-EM shifts (Farooq et al., 2022). Assumptions used in the EKC model of CEM are valid for low-income nations, but their predicted outcomes fall short of the achievements of high-income countries. Further explanation of the empirical investigation of environmental degradation caused by agricultural output, economic growth, trade openness, renewable energy, industry, and implications of trade follows.
1) United Nations Food and Agriculture Organization (FAO) research shows that emissions from forestry, agriculture, and fisheries have increased in the last 50 years and are projected to increase by 30% by 2050. As developing and developed countries increase their energy demands, CO2 emissions continue to rise and have reached a record high for the fourth consecutive year (Rapier, 2020). Consider that Asia is home to only 4.3 billion people or 60% of the world’s population. Table 5 reveals that the current EKC hypothesis predicts that AGR and GNI have the greatest impact on attitude in panel A, whereas the least optimistic estimates are seen in panel B, which represents emerging countries. In addition, the CEM emissions per capita in developing countries are currently greater than double those in developed nations due to the percent population growth in these regions. Concerning AGR, Brazil and Malaysia for panel A and China and Qatar for panel B had the highest CO2 emissions intensity. To be more ecologically sound, CEM must strike a balance between mechanization and inappropriate cultivation practices that call for greater additives and accuracy (Jiandong Chen et al., 2020; Munir et al., 2020). The EKC-high effect of AGR output is positive for all Q25, Q50, and Q75 in China, Qatar, and Malaysia in panels A and B. High intensity is shown in Turkey, Germany, and Greece (all developed countries) in Panel A, and in France, Italy, and Turkey (all developed countries) in Panel B. Low- and high-income rural and urban farmers are still needed, especially in developing and developed nations. This inference may explain why there is a range in the impact of agriculture on CO2 emissions.
2) The EKC hypothesis for CEM does not hold for developing countries, and the estimated results do not correspond to what high-income economies have accomplished. However, empirical estimation of quantile regression revealed that the EKC hypothesis for CEM holds true for higher emission quantiles, where the EKC hypothesis was confirmed for Qatar, Canada, and China as the highest emitting economies among developing and developed nations (B. Xu and Lin, 2020).
3) Table 5 shows that the REN, and GNI, of developing nations like Argentina, Mexico, China, and Nigeria, as well as developed countries like Germany, France, Italy, and the Netherland, have a significant impact on the EKC hypothesis for C-EM. Comparing the developed nations of Germany, Italy, and Sweden to the developing nations of Brazil, Qatar, and Nigeria, C-LF reveals the existence of the EKC hypothesis in all six countries. By comparing the emission rates of developing and developed countries, we find that the EKC hypothesis for C-EM and C-LF holds true for higher emissions, with the EKC hypothesis verified for Qatar, Italy, and China (Xu and Lin, 2020). Moreover, it shows that environmental policy formulation has occurred in both high and low economies and that the heterogeneity of gaseous and solid fuel use between countries can have a substantial impact on emissions (Wada et al., 2021).
4) Quantile estimates show that the obtained results at Q25 are decidedly non-standard and favorable in both panels, even though the renewable energy is consistently negative in both panels A and B. Long-term economic growth in developing countries is positively correlated with renewable energy, while the cost of renewable energy is negatively correlated with C-EM and C-LM. As a result, renewable energy interacts with carbon emissions from the use of liquid fuel to boost economic growth and social progress in both developing and developed nations. Panel B’s result, however, is more consistent because it detects a negative dynamic in CO2 emissions and holds up well across different means of estimation (Omri and Belaïd, 2021). The value added by industries has a positive and statistically significant impact on both panels A and B.
5) It is possible that developing economies’ industrial sectors are weaker than those of developed economies, according to these estimates. When looking at quantile Q25, the effect of C-LF becomes more significant (p < 1), indicating that developing countries’ energy consumption rises along with technological advancement (Hu et al., 2021). The industrial revolution has been crucial to the expansion of the global economy. Liquid carbon emissions have an impact on economies, as shown by the negative effect of trade in Q25–75 in panel B. Coefficients for various economic activities reveal that the effects of agriculture and international trade are supported by more robust statistical evidence than those involving any particular economic sector (Nasir et al., 2021).
Evidence from both developing and developed nations suggests that high labor productivity in regions with a low average landholding per farmer requires the use of a greater quantity of fossil energy per unit of output than does the case in regions with a high average landholding per farmer, where the same result can be achieved using a relatively smaller quantity of fossil energy per unit of output, particularly in developing nations (Li and Haneklaus, 2021). However, it has lower labor productivity because its member nations have less abundant land resources. However, despite using less fossil fuel per unit of output than developed nations, countries with high populations have the lowest rates of labor productivity. A higher rate of labor productivity appears to necessitate a higher rate of fossil energy inputs per unit of output generated when the amount of available land per farmer decreases (Jiang et al., 2022b; Sharno and Hiloidhari, 2022). From this vantage point, it would appear that the use of fossil energy per unit of production is greater for a technical path driven by land scarcity and based mostly on land-saving procedures than for a technical path driven by labor scarcity and based primarily on labor-saving inputs (Li and Haneklaus, 2022).
It appears that there is a tradeoff between the amount of land available and the amount of energy used in agricultural production, given a particular level of labor productivity. Nonetheless, the data seems to back the theory that in developing countries, the cost of agricultural production in terms of fossil energy use is higher when a land constraint is involved relative to the population than when a labor force constraint is involved (Yoon, 2022). Any gain in agricultural output due to “emancipation” from a lack of farmland comes with a higher “biophysical cost” of food production, in the sense that more fossil fuel is needed to create the same amount of food. This also means a greater reliance on stored energy. Another “biophysical cost” associated with feeding the world might be thought of in these words (Wang, 2022). Massive input use has a negative effect on the environment, as shown by previous research. Soil erosion, depletion of water tables, reduction of biodiversity at the ecosystem level, and degradation of genetic variation in the species of cultivated plants can all result from the oversimplification of agroecosystems through the widespread adoption of monocultures (Behroozeh et al., 2022). With the measurement of land productivity, the output energy to input energy ratio becomes an environmental loading indicator (Zheng et al., 2022). The intensity with which agricultural practices impact natural ecological processes can be measured, for example, by measuring the amount of exosmotic energy applied per hectare of agroecosystem (Koondhar et al., 2021).
As a result, the trend in the development of comprehensive energy systems in both developing and developed countries is toward the integrated energy system of agricultural electrification, which combines the integrated energy system and rural electrification based on the rural distribution network (Cheng et al., 2022). Energy efficiency, mechanical stability, and electronic intelligence are three directions in which agricultural machinery is headed. Further, this model improves the industry’s positive effects on the environment and society (Işık et al., 2021). It has great potential as a tool for achieving carbon neutrality in agricultural output on a local scale. To effectively lower carbon emissions from agricultural production, alternative energy sources should be used to replace conventional fossil fuels (Wu et al., 2021). To that end, the trend in the development of comprehensive energy systems in both developing and developed countries is toward the integrated energy system of agricultural electrification, which combines the integrated energy system and rural electrification on the basis of the rural distribution network (Ike et al., 2020). Energy efficiency, steadiness, and smart technology are unavoidable directions for the evolution of agricultural machinery (Dong et al., 2020). The economic benefits of the sector, as well as its positive social and environmental effects, can all be enhanced by adopting this idea. In the future, it could be an essential resource for reaching carbon neutrality in agricultural output on a regional scale. Reduced use of conventional fossil fuels and increased use of alternative energy sources would result in considerable reductions in agricultural carbon emissions.
Impacts on agriculture (AGR), cereal yield (CY), renewable energy consumption (REN), gross national product (GNP), industrial output (IDC), and international trade (TRD) are analyzed for both developing and developed nations. Using sinusoidal data from 22 to nine developing and 13 developed countries, it examines environmental degradation from two sources of CEM (C-EM and C-LF) from 1991 to 2016. This research used panel quantile decomposition methods with FMOLS to examine the gap in CO2 emissions between low (LIG) and high (HIG) economies, as well as the relationship between AGR and economic factors at varying income and CO2 emitter levels. As the estimated results show, there is a wide range of factors that contribute to environmental quality across both developing and developed countries, from those with high to those with low levels of CO2 emissions. These recommendations are presented as an expected result of the aforementioned. To begin, the developed (France, Italy, and Spain) and selected (China, Brazil, and Nigeria) countries must eliminate crude agricultural practices caused by land fragmentation. In addition, the increased production of agricultural goods and the widespread practice of burning brush have debilitating ecological consequences. More farming needs to be done in developing nations, both in terms of cultivating techniques and applying new sustainable methods. Second, the government in developing countries should be given the authority and the means to implement strategies to prevent and reduce the risk of CO2 emissions in urban areas. In addition, the ongoing evolution of eco-friendly practices that safeguard soil, cut greenhouse gas emissions, and lessen energy use.
Third, the AgriCare conservative agriculture approach, based on strip cropping and no-till farming, needs to be introduced to developing countries along with improved precision agriculture techniques. In addition, expanding populations and booming economies are major contributors to rising levels of carbon dioxide in the atmosphere. In this scenario, the effects of widespread technological adoption on carbon emission reduction are outweighed by population and economic growth. In this study, we find that the developed world is cutting back on carbon emissions thanks to the countervailing effects of technology and nuclear power plants on their use of oil and other energy sources, while the impact of alternative energy sources on the consumption patterns of developing nations is significant but in flux. Human activity cannot be discounted as a significant contributor to global warming’s onset at an earlier stage in the industrial revolution and economic development. Nonrenewable fossil fuels are the primary source of carbon emissions; depending on their abundance characteristics, oil, gas, coal, and nuclear all contribute differently to temperature rise in industrialized nations.
More importantly, both the private and public sectors are committed to fostering positive change in agriculture via natural methods and advancing more sustainable economic models. In fourth place, it is important to promote the adaptation of renewable energy innovations in underdeveloped nations, as well as the use of energy-saving practices and all-natural strategies for preventing and reversing environmental degradation. It would make the switch to a cleaner industrial economy in developing countries possible. To solve the fundamental issues of low industrial capacity, food shortage, and unsustainable manufacturing practices, agricultural and industrial products in both developing and developed countries should be stable. Furthermore, 22 countries, both developed and developing, may gain social stability and employment opportunities as a result of modernized technologies. As a final goal of our research, we hope to encourage developed countries to take environmental protection measures by using environmental performance as a test case for the EKC hypothesis in future studies.
There are caveats to this study. First, the HDI provides a comparative economic and social development map of the world’s 25 most populous countries. HDIs of 0.8 or greater indicate development in terms of life expectancy, education, and level of living, as mentioned in the methodology section. However, not all 25 nations were included in the analysis due to a lack of data. Second, the study covers a period of time that is now more than 7 years past (from 1991 to 2016), so its results may not apply to similar situations in the future. Though the data is outdated, the investigated connections may still be robust. We point you in a few different directions to further your exploration of this topic. From an academic point of view, we propose to include other variables (such as manufacturing industries, fossil fuel energy use, degree of enforcement, cost of access to renewable energy sources, etc.) to see if these additional variables further influence the analyzed connections. The generalizability of our results to more recent crises is a potential area for future study. If implemented, it would measure how much of an effect agricultural subsidy program in developing nations have on global carbon emissions. The most significant agricultural sectors in both developing and developed countries should be analyzed to determine how agricultural land-use change contributes to emissions.
Globalization-oriented policies have had a sizable effect on agriculture, which is increasingly important in both developing and developed countries as shown by the results of the present study. Researchers in the future may include various types of energy and health infrastructure variables (as regressors) and ecological footprint (as regress) in their models. However, there are many interconnected aspects of energy consumption, such as the interplay between fossil fuels, renewable resources, clean technology, and new energy sources, as well as the connections between these elements and energy production and energy policy. The next steps of our research will involve developing a grey prediction model for the energy system that takes into account a wider range of influences. This article’s empirical findings should be double-checked using other methods, such as the decoupling approaches with Gann principles and/or the GMM model of analysis, which may be recommended for future study. To the best of our knowledge, the few existing apps for quantile unit root and cointegration tests for time series do not include analysis for evaluating quantiles in panels. Panel quantile unit root tests and cointegration tests may be performed in further research by creating an algorithm that takes into account data structure at the lower tail, the median tail, and the upper tail, or at different threshold regimes for each cross-section in panel data (Adnouni et al., 2023).
The datasets presented in this study can be found in online repositories. The names of the repository/repositories and accession number(s) can be found in the article/Supplementary Material.
The RK: Conceptualization, writing—review & editing, methodology, writing—original draft, Formal analysis, Data curation, software and supervision, drafting of the work, validation and revising, interpretation of data, AA: Designing of the work, Investigation, Validation and review, IM: validation and investigation.
The author responds to insightful advice and is extremely appreciative of the instructors for all the encouragement and guidance they have given. The educational opportunities provided by the Fujian University of Technology are gratefully acknowledged. National Social Science Foundation of China (22BGL007), Fujian Zhi-lian-yun Supply Chain Technology and Economy Integration Service Platform from the Fujian Association for Science and Technology, the Fujian-Kenya Silk Road Cloud Joint R&D Center (2021D021) from Fujian Provincial Department of Science and Technology, the Fujian Social Sciences Federation Planning Project (FJ2021Z006), and General program of Fujian Natural Science Foundation (2022J01941). Talent Building Fund (Social Sciences), E21/E2100108, Beta decoupling relationship between CO2 emissions by GDP, energy consumption, electricity production, value-added industries, and population in China. Furthermore, he is grateful to his loved ones for their support as he pursues his goal of earning a doctorate. He cannot ignore the value of the disabled student who, in the name of success, is willing to sacrifice anything, including their feelings, in order to succeed. He knows that love is the one that holds him up and gives him the energy to keep going
The author declares that the research was conducted in the absence of any commercial or financial relationships that could be construed as a potential conflict of interest.
All claims expressed in this article are solely those of the authors and do not necessarily represent those of their affiliated organizations, or those of the publisher, the editors and the reviewers. Any product that may be evaluated in this article, or claim that may be made by its manufacturer, is not guaranteed or endorsed by the publisher.
The Supplementary Material for this article can be found online at: https://www.frontiersin.org/articles/10.3389/fenvs.2022.1065634/full#supplementary-material
Abdurrahman, M. I., Chaki, S., and Saini, G. (2020). Stubble burning: Effects on health & environment, regulations and management practices. Environ. Adv. 2, 100011. doi:10.1016/j.envadv.2020.100011
Adebayo, T. S., Awosusi, A. A., Rjoub, H., Agyekum, E. B., and Kirikkaleli, D. (2022). The influence of renewable energy usage on consumption-based carbon emissions in MINT economies. Heliyon 8 (2), e08941. doi:10.1016/j.heliyon.2022.e08941
Adekoya, O. B., Ajayi, G. E., Suhrab, M., and Oliyide, J. A. (2022). How critical are resource rents, agriculture, growth, and renewable energy to environmental degradation in the resource-rich african countries? The role of institutional quality. Energy Policy 164, 112888. doi:10.1016/j.enpol.2022.112888
Adnouni, M., Jiang, L., Zhang, X. J., Zhang, L. Z., Pathare, P. B., and Roskilly, A. P. (2023). Computational modelling for decarbonised drying of agricultural products: Sustainable processes, energy efficiency, and quality improvement. J. Food Eng. 338, 111247. doi:10.1016/j.jfoodeng.2022.111247
Aguilera, E., Reyes-Palomo, C., Díaz-Gaona, C., Sanz-Cobena, A., Smith, P., García-Laureano, R., et al. (2021). Greenhouse gas emissions from Mediterranean agriculture: Evidence of unbalanced research efforts and knowledge gaps. Glob. Environ. Change 69, 102319. doi:10.1016/j.gloenvcha.2021.102319
Akram, R., Chen, F., Khalid, F., Ye, Z., and Majeed, M. T. (2020). Heterogeneous effects of energy efficiency and renewable energy on carbon emissions: Evidence from developing countries. J. Clean. Prod. 247, 119122. doi:10.1016/j.jclepro.2019.119122
Akram, R., Chen, F., Khalid, F., Huang, G., and Irfan, M. (2021). Heterogeneous effects of energy efficiency and renewable energy on economic growth of brics countries: A fixed effect panel quantile regression analysis. Energy 215, 119019. doi:10.1016/j.energy.2020.119019
Ali, U., Guo, Q., Kartal, M. T., Nurgazina, Z., Khan, Z. A., and Sharif, A. (2022). The impact of renewable and non-renewable energy consumption on carbon emission intensity in China: Fresh evidence from novel dynamic ARDL simulations. J. Environ. Manag. 320, 115782. doi:10.1016/j.jenvman.2022.115782
Amin, A., Dogan, E., and Khan, Z. (2020). The impacts of different proxies for financialization on carbon emissions in top-ten emitter countries. Sci. Total Environ. 740, 140127. doi:10.1016/j.scitotenv.2020.140127
Anser, M. K., Usman, M., Godil, D. I., Shabbir, M. S., Sharif, A., Tabash, M. I., et al. (2021). Does globalization affect the green economy and environment? The relationship between energy consumption, carbon dioxide emissions, and economic growth. Environ. Sci. Pollut. Res. 28 (37), 51105–51118. doi:10.1007/s11356-021-14243-4
Apergis, N., and Payne, J. E. (2009). Energy consumption and economic growth in Central America: Evidence from a panel cointegration and error correction model. Energy Econ. 31 (2), 211–216. doi:10.1016/j.eneco.2008.09.002
Balado-Naves, R., Baños-Pino, J. F., and Mayor, M. (2018). Do countries influence neighbouring pollution? A spatial analysis of the EKC for CO2 emissions. Energy Policy 123, 266–279. doi:10.1016/j.enpol.2018.08.059
Balogh, J. M. (2022). The impacts of agricultural development and trade on CO2 emissions? Evidence from the non-European union countries. Environ. Sci. Policy 137, 99–108. doi:10.1016/j.envsci.2022.08.012
Balsalobre-Lorente, D., Driha, O. M., Leitão, N. C., and Murshed, M. (2021). The carbon dioxide neutralizing effect of energy innovation on international tourism in EU-5 countries under the prism of the EKC hypothesis. J. Environ. Manag. 298, 113513. doi:10.1016/j.jenvman.2021.113513
Baltagi, B. H., Feng, Q., and Kao, C. (2012). A Lagrange Multiplier test for cross-sectional dependence in a fixed effects panel data model. J. Econ. 170 (1), 164–177. doi:10.1016/j.jeconom.2012.04.004
Behroozeh, S., Hayati, D., and Karami, E. (2022). Determining and validating criteria to measure energy consumption sustainability in agricultural greenhouses. Technol. Forecast. Soc. Change 185, 122077. doi:10.1016/j.techfore.2022.122077
Belaïd, F., Youssef, A. B., and Lazaric, N. (2020). Scrutinizing the direct rebound effect for French households using quantile regression and data from an original survey. Ecol. Econ. 176, 106755. doi:10.1016/j.ecolecon.2020.106755
Ben Cheikh, N., Ben Zaied, Y., and Chevallier, J. (2021). On the nonlinear relationship between energy use and CO2 emissions within an EKC framework: Evidence from panel smooth transition regression in the MENA region. Res. Int. Bus. Finance 55, 101331. doi:10.1016/j.ribaf.2020.101331
Beyene, S. D. (2022). Human activities and environmental quality: Evidence beyond the conventional EKC hypothesis. Heliyon 8, e10756. doi:10.1016/j.heliyon.2022.e10756
Billig, E., Decker, M., Benzinger, W., Ketelsen, F., Pfeifer, P., Peters, R., et al. (2019). Non-fossil CO2 recycling—the technical potential for the present and future utilization for fuels in Germany. J. CO2 Util. 30, 130–141. doi:10.1016/j.jcou.2019.01.012
Boyle, M. J. V. V. (2022). Top 25 developed and developing countries. New York, NY: THE INVESTOPEDIA TEAM.
Bradley, P. (2021). An institutional economics framework to explore sustainable production and consumption. Sustain. Prod. Consum. 27, 1317–1339. doi:10.1016/j.spc.2021.02.035
Bui, Q., Wang, Z., Zhang, B., Le, H. P., and Vu, K. D. (2021). Revisiting the biomass energy-economic growth linkage of brics countries: A panel quantile regression with fixed effects approach. J. Clean. Prod. 316, 128382. doi:10.1016/j.jclepro.2021.128382
Chen, J., Huang, S., and Ajaz, T. (2022). Natural resources management and technological innovation under EKC framework: A glimmer of hope for sustainable environment in newly industrialized countries. Resour. Policy 79, 103016. doi:10.1016/j.resourpol.2022.103016
Cheng, C., Ren, X., Dong, K., Dong, X., and Wang, Z. (2021). How does technological innovation mitigate CO2 emissions in OECD countries? Heterogeneous analysis using panel quantile regression. J. Environ. Manag. 280, 111818. doi:10.1016/j.jenvman.2020.111818
Cheng, S., Wang, P., Chen, B., and Fan, W. (2022). Decoupling and decomposition analysis of CO2 emissions from government spending in China. Energy 243, 122741. doi:10.1016/j.energy.2021.122741
Choi, I. (2001). Unit root tests for panel data. J. Int. Money Finance 20 (2), 249–272. doi:10.1016/S0261-5606(00)00048-6
Dong, B., Ma, X., Zhang, Z., Zhang, H., Chen, R., Song, Y., et al. (2020). Carbon emissions, the industrial structure and economic growth: Evidence from heterogeneous industries in China. Environ. Pollut. 262, 114322. doi:10.1016/j.envpol.2020.114322
Dong, F., Li, Y., Gao, Y., Zhu, J., Qin, C., and Zhang, X. (2022). Energy transition and carbon neutrality: Exploring the non-linear impact of renewable energy development on carbon emission efficiency in developed countries. Resour. Conservation Recycl. 177, 106002. doi:10.1016/j.resconrec.2021.106002
Dopierała, Ł., Mosionek-Schweda, M., Laskowicz, T., and Ilczuk, D. (2022). Financial performance of renewable energy producers: A panel data analysis from the baltic sea region. Energy Rep. 8, 11492–11503. doi:10.1016/j.egyr.2022.09.009
Ehigiamusoe, K. U., and Dogan, E. (2022). The role of interaction effect between renewable energy consumption and real income in carbon emissions: Evidence from low-income countries. Renew. Sustain. Energy Rev. 154, 111883. doi:10.1016/j.rser.2021.111883
Essandoh, O. K., Islam, M., and Kakinaka, M. (2020). Linking international trade and foreign direct investment to CO2 emissions: Any differences between developed and developing countries? Sci. Total Environ. 712, 136437. doi:10.1016/j.scitotenv.2019.136437
Farooq, S., Ozturk, I., Majeed, M. T., and Akram, R. (2022). Globalization and CO2 emissions in the presence of EKC: A global panel data analysis. Gondwana Res. 106, 367–378. doi:10.1016/j.gr.2022.02.002
Gaies, B., Nakhli, M. S., and Sahut, J.-M. (2022). What are the effects of economic globalization on CO2 emissions in MENA countries? Econ. Model. 116, 106022. doi:10.1016/j.econmod.2022.106022
Gander, J. P. (2013). Integrating bank profit and risk-avoidance decisions for selected European countries: A micro–macro analysis. Econ. Model. 31, 717–722. doi:10.1016/j.econmod.2013.01.014
Gnangoin, T. Y., Kassi, D. F., Edjoukou, A. J.-R., Kongrong, O., and Yuqing, D. (2022). Renewable energy, non-renewable energy, economic growth and CO2 emissions in the newly emerging market economies: The moderating role of human capital. Front. Environ. Sci. 10, 7721. doi:10.3389/fenvs.2022.1017721
Gozgor, G., Lau, C. K. M., and Lu, Z. (2018). Energy consumption and economic growth: New evidence from the OECD countries. Energy 153, 27–34. doi:10.1016/j.energy.2018.03.158
Greene, W., and McKenzie, C. (2015). An LM test based on generalized residuals for random effects in a nonlinear model. Econ. Lett. 127, 47–50. doi:10.1016/j.econlet.2014.12.031
Halunga, A. G., Orme, C. D., and Yamagata, T. (2017). A heteroskedasticity robust Breusch–Pagan test for Contemporaneous correlation in dynamic panel data models. J. Econ. 198 (2), 209–230. doi:10.1016/j.jeconom.2016.12.005
Han, J., Yang, Q., and Zhang, L. (2022). What are the priorities for improving the cleanliness of energy consumption in rural China? Urbanisation advancement or agriculture development? Energy Sustain. Dev. 70, 106–114. doi:10.1016/j.esd.2022.07.011
Hang, Y., and Xue, W. (2020). The asymmetric effects of monetary policy on the business cycle: Evidence from the panel smoothed quantile regression model. Econ. Lett. 195, 109450. doi:10.1016/j.econlet.2020.109450
Hao, P.-F., Qiu, C.-W., Ding, G., Vincze, E., Zhang, G., Zhang, Y., et al. (2020). Agriculture organic wastes fermentation CO2 enrichment in greenhouse and the fermentation residues improve growth, yield and fruit quality in tomato. J. Clean. Prod. 275, 123885. doi:10.1016/j.jclepro.2020.123885
Hu, J., Yan, S., and Wang, L. (2021). Efficiency and convergence of China’s export trade embodied carbon emissions. Chin. J. Popul. Resour. Environ. 19 (2), 133–142. doi:10.1016/j.cjpre.2021.12.015
Huang, W., Genaro Reivan Ortiz, G., Kuo, Y.-L., Maneengam, A., Nassani, A. A., and Haffar, M. (2022). The Non-linear impact of renewable energy and trade on Consumption-based carbon emissions. Fuel 324, 124423. doi:10.1016/j.fuel.2022.124423
Iddrisu, A.-A., and Alagidede, I. P. (2021). Heterogeneous provincial prices and monetary policy in south Africa: A wavelet-based quantile regression analysis. Cent. Bank. Rev. 21 (3), 87–103. doi:10.1016/j.cbrev.2021.06.001
Ike, G. N., Usman, O., and Sarkodie, S. A. (2020). Testing the role of oil production in the environmental Kuznets curve of oil producing countries: New insights from Method of Moments Quantile Regression. Sci. Total Environ. 711, 135208. doi:10.1016/j.scitotenv.2019.135208
Im, K. S., Pesaran, M. H., and Shin, Y. (2003). Testing for unit roots in heterogeneous panels. J. Econ. 115 (1), 53–74. doi:10.1016/s0304-4076(03)00092-7
Işık, C., Ahmad, M., Ongan, S., Ozdemir, D., Irfan, M., and Alvarado, R. (2021). Convergence analysis of the ecological footprint: Theory and empirical evidence from the USMCA countries. Environ. Sci. Pollut. Res. 28 (25), 32648–32659. doi:10.1007/s11356-021-12993-9
Jain, D., Bhatnagar, S., and Sachdeva, K. (2022). Impact of degrading air quality on mode choice and emissions – study of ten global cities. World Dev. Sustain. 1, 100002. doi:10.1016/j.wds.2022.100002
Jiandong Chen, J., Xian, Q., Zhou, J., and Li, D. (2020). Impact of income inequality on CO2 emissions in G20 countries. J. Environ. Manag. 271, 110987. doi:10.1016/j.jenvman.2020.110987
Jiang, Q., Khattak, S. I., and Rahman, Z. U. (2021). Measuring the simultaneous effects of electricity consumption and production on carbon dioxide emissions (CO2e) in China: New evidence from an EKC-based assessment. Energy 229, 120616. doi:10.1016/j.energy.2021.120616
Jiang, Q., Rahman, Z. U., Zhang, X., Guo, Z., and Xie, Q. (2022a). An assessment of the impact of natural resources, energy, institutional quality, and financial development on CO2 emissions: Evidence from the B&R nations. Resour. Policy 76, 102716. doi:10.1016/j.resourpol.2022.102716
Jiang, Z., Rahman Mahmud, A., Maneengam, A., Nassani, A. A., Haffar, M., and The Cong, P. (2022b). Non linear effect of Biomass, fossil fuels and renewable energy usage on the economic Growth: Managing sustainable development through energy sector. Fuel 326, 124943. doi:10.1016/j.fuel.2022.124943
Jiao, C., Chen, L., Sun, C., Jiang, Y., Zhai, L., Liu, H., et al. (2020). Evaluating national ecological risk of agricultural pesticides from 2004 to 2017 in China. Environ. Pollut. 259, 113778. doi:10.1016/j.envpol.2019.113778
John Oo, N. E. (2009). Quantile regression analysis as a robust alternative to ordinary least squares. Sci. Afr. 8 (2), 61–65. doi:10.14419/ijasp.v3i2.4686
Jw, O. (2000). Prediction in multiple regression. Pract. Assess. Res. Eval. 7 (2). doi:10.7275/7j20-gg86
Kao C, C. B. (1995). On the estimation and inference of a cointegrated regression in panel data when the cross-section and time-series dimensions are compa- rable. New York, NY: Syracuse University:Department of Economics.
Khan, R. (2021). Beta decoupling relationship between CO2 emissions by GDP, energy consumption, electricity production, value-added industries, and population in China. PLoS ONE 16, 02494444–e249522. doi:10.1371/journal.pone.0249444
Khezri, M., Heshmati, A., and Khodaei, M. (2022). Environmental implications of economic complexity and its role in determining how renewable energies affect CO2 emissions. Appl. Energy 306, 117948. doi:10.1016/j.apenergy.2021.117948
Kicińska, A., and Wikar, J. (2021). Ecological risk associated with agricultural production in soils contaminated by the activities of the metal ore mining and processing industry - example from southern Poland. Soil Tillage Res. 205, 104817. doi:10.1016/j.still.2020.104817
Kocak, E., and Alnour, M. (2022). Energy R&D expenditure, bioethanol consumption, and greenhouse gas emissions in the United States: Non-linear analysis and political implications. J. Clean. Prod. 374, 133887. doi:10.1016/j.jclepro.2022.133887
Koenker, R., and Bassett, G. (1978). Regression quantiles. Econometrica 46 (1), 33–50. doi:10.2307/1913643
Koenker, R., and Hallock, K. F. (2001). Quantile regression. J. Econ. Perspect. 15 (4), 143–156. doi:10.1257/jep.15.4.143
Koenker, R. (2004). Quantile regression for longitudinal data. J. Multivar. Analysis 91 (1), 74–89. doi:10.1016/j.jmva.2004.05.006
Kong, Y. S., and Khan, R. (2019). To examine environmental pollution by economic growth and their impact in an environmental Kuznets curve (EKC) among developed and developing countries. PLoS ONE 14 (3), e0209532. doi:10.1371/journal.pone.0209532
Koondhar, M. A., Udemba, E. N., Cheng, Y., Khan, Z. A., Koondhar, M. A., Batool, M., et al. (2021). Asymmetric causality among carbon emission from agriculture, energy consumption, fertilizer, and cereal food production – a nonlinear analysis for Pakistan. Sustain. Energy Technol. Assessments 45, 101099. doi:10.1016/j.seta.2021.101099
Le, T. H. (2022). Connectedness between nonrenewable and renewable energy consumption, economic growth and CO2 emission in Vietnam: New evidence from a wavelet analysis. Renew. Energy 195, 442–454. doi:10.1016/j.renene.2022.05.083
Leal, P. H., and Marques, A. C. (2020). Rediscovering the EKC hypothesis for the 20 highest CO2 emitters among OECD countries by level of globalization. Int. Econ. 164, 36–47. doi:10.1016/j.inteco.2020.07.001
Lennart, E., Johan, T., and Svante, W. (2008). “PLS-trees in data mining and clustering,” in Dynacentrix.
Levin, A., Lin, C.-F., and Chu, C.-S. J. (2002). Unit root tests in panel data: Asymptotic and finite-sample properties. J. Econ. 108, 1–24. doi:10.1016/s0304-4076(01)00098-7
Li, B., and Haneklaus, N. (2021). The role of renewable energy, fossil fuel consumption, urbanization and economic growth on CO2 emissions in China. Energy Rep. 7, 783–791. doi:10.1016/j.egyr.2021.09.194
Li, B., and Haneklaus, N. (2022). The role of clean energy, fossil fuel consumption and trade openness for carbon neutrality in China. Energy Rep. 8, 1090–1098. doi:10.1016/j.egyr.2022.02.092
Liddle, B. (2012). The importance of energy quality in energy intensive manufacturing: Evidence from panel cointegration and panel FMOLS. Energy Econ. 34 (6), 1819–1825. doi:10.1016/j.eneco.2012.07.013
Liu, Y., and Lai, X. (2021). EKC and carbon footprint of cross-border waste transfer: Evidence from 134 countries. Ecol. Indic. 129, 107961. doi:10.1016/j.ecolind.2021.107961
Liu, H., Anwar, A., Razzaq, A., and Yang, L. (2022a). The key role of renewable energy consumption, technological innovation and institutional quality in formulating the SDG policies for emerging economies: Evidence from quantile regression. Energy Rep. 8, 11810–11824. doi:10.1016/j.egyr.2022.08.231
Liu, Z., Qiu, C., and Zhu, L. (2022b). Dynamic role of green energy efficiency and climate technologies in realizing environmental sustainability: Fresh insights from China. Front. Environ. Sci. 10, 908470. doi:10.3389/fenvs.2022.908470
Mardani, A., Streimikiene, D., Cavallaro, F., Loganathan, N., and Khoshnoudi, M. (2019). Carbon dioxide (CO2) emissions and economic growth: A systematic review of two decades of research from 1995 to 2017. Sci. Total Environ. 649, 31–49. doi:10.1016/j.scitotenv.2018.08.229
Mehmood Mirza, F., Sinha, A., Rehman Khan, J., Kalugina, O. A., and Wasif Zafar, M. (2022). Impact of energy efficiency on CO2 Emissions: Empirical evidence from developing countries. Gondwana Res. 106, 64–77. doi:10.1016/j.gr.2021.11.017
Meijian Yang, M., Wang, G., Lazin, R., Shen, X., and Anagnostou, E. (2021). Impact of planting time soil moisture on cereal crop yield in the upper blue nile basin: A novel insight towards agricultural water management. Agric. Water Manag. 243, 106430. doi:10.1016/j.agwat.2020.106430
Meng, Y., Wu, H., Wang, Y., and Duan, Y. (2022). International trade diversification, green innovation, and consumption-based carbon emissions: The role of renewable energy for sustainable development in BRICST countries. Renew. Energy 198, 1243–1253. doi:10.1016/j.renene.2022.08.045
Mian Yang, M., Wang, E.-Z., and Hou, Y. (2021). The relationship between manufacturing growth and CO2 emissions: Does renewable energy consumption matter? Energy 232, 121032. doi:10.1016/j.energy.2021.121032
Muhammad, S., Long, X., Salman, M., and Dauda, L. (2020). Effect of urbanization and international trade on CO2 emissions across 65 belt and road initiative countries. Energy 196, 117102. doi:10.1016/j.energy.2020.117102
Munir, Q., Lean, H. H., and Smyth, R. (2020). CO2 emissions, energy consumption and economic growth in the ASEAN-5 countries: A cross-sectional dependence approach. Energy Econ. 85, 104571. doi:10.1016/j.eneco.2019.104571
Nasir, M. A., Canh, N. P., and Lan Le, T. N. (2021). Environmental degradation & role of financialisation, economic development, industrialisation and trade liberalisation. J. Environ. Manag. 277, 111471. doi:10.1016/j.jenvman.2020.111471
Nwaka, I. D., Nwogu, M. U., Uma, K. E., and Ike, G. N. (2020). Agricultural production and CO2 emissions from two sources in the ECOWAS region: New insights from quantile regression and decomposition analysis. Sci. Total Environ. 748, 141329. doi:10.1016/j.scitotenv.2020.141329
Omri, A., and Belaïd, F. (2021). Does renewable energy modulate the negative effect of environmental issues on the socio-economic welfare? J. Environ. Manag. 278, 111483. doi:10.1016/j.jenvman.2020.111483
Pakrooh, P., Nematian, J., Pishbahar, E., and Hayati, B. (2021). Reforming energy prices to achieve sustainable energy consumption in the agriculture sector of Iran’s provinces: Using game approach. J. Clean. Prod. 293, 126146. doi:10.1016/j.jclepro.2021.126146
Pedroni, P. (2001). “Fullymodified OLS for heterogeneous cointegrated panels,” in Nonstationary panels, panel cointegration, and dynamic panels (Emerald Group Publishing Limited).
Rabnawaz, K. (2021). Beta decoupling relationship between CO2 emissions by GDP, energy consumption, electricity production, value-added industries, and population in China. PLoS ONE 16 (4), e0249444. doi:10.1371/journal.pone.0249444
Raghutla, C., Padmagirisan, P., Sakthivel, P., Chittedi, K. R., and Mishra, S. (2022). The effect of renewable energy consumption on ecological footprint in N-11 countries: Evidence from Panel Quantile Regression Approach. Renew. Energy 197, 125–137. doi:10.1016/j.renene.2022.07.100
Rapier, R. (2020). Why curbing carbon dioxide emissisons poses such A challenge. A challenge. from https.
Rashid Gill, A., Viswanathan, K. K., and Hassan, S. (2018). The Environmental Kuznets Curve (EKC) and the environmental problem of the day. Renew. Sustain. Energy Rev. 81, 1636–1642. doi:10.1016/j.rser.2017.05.247
Rehman, A., Alam, M. M., Alvarado, R., Işık, C., Ahmad, F., Cismas, L. M., et al. (2022). Carbonization and agricultural productivity in Bhutan: Investigating the impact of crops production, fertilizer usage, and employment on CO2 emissions. J. Clean. Prod. 375, 134178. doi:10.1016/j.jclepro.2022.134178
Ridzuan, N. H. A. M., Marwan, N. F., Khalid, N., Ali, M. H., and Tseng, M.-L. (2020). Effects of agriculture, renewable energy, and economic growth on carbon dioxide emissions: Evidence of the environmental Kuznets curve. Resour. Conservation Recycl. 160, 104879. doi:10.1016/j.resconrec.2020.104879
Safar, W. (2022). Income inequality and CO2 emissions in France: Does income inequality indicator matter? J. Clean. Prod. 370, 133457. doi:10.1016/j.jclepro.2022.133457
Shabani, E., Hayati, B., Pishbahar, E., Ghorbani, M. A., and Ghahremanzadeh, M. (2021). A novel approach to predict CO2 emission in the agriculture sector of Iran based on Inclusive Multiple Model. J. Clean. Prod. 279, 123708. doi:10.1016/j.jclepro.2020.123708
Shah, M. I., AbdulKareem, H. K. K., khan, Z., and Abbas, S. (2022). Examining the agriculture induced Environmental Kuznets Curve hypothesis in BRICS economies: The role of renewable energy as a moderator. Renew. Energy 198, 343–351. doi:10.1016/j.renene.2022.08.052
Shahbaz, M., Nwani, C., Bekun, F. V., Gyamfi, B. A., and Agozie, D. Q. (2022). Discerning the role of renewable energy and energy efficiency in finding the path to cleaner consumption and production patterns: New insights from developing economies. Energy 260, 124951. doi:10.1016/j.energy.2022.124951
Shahzad, U., Ferraz, D., Doğan, B., and Aparecida do Nascimento Rebelatto, D. (2020). Export product diversification and CO2 emissions: Contextual evidences from developing and developed economies. J. Clean. Prod. 276, 124146. doi:10.1016/j.jclepro.2020.124146
Shaoping Wang, S., Li, Y., and Wen, K. (2021). Recursive adjusted unit root tests under non-stationary volatility. Econ. Lett. 205, 109941. doi:10.1016/j.econlet.2021.109941
Sharno, M. A., and Hiloidhari, M. (2022). Life cycle carbon, energy, water, and landuse footprints of agricultural residue-based biojet fuel in Bangladesh. Bioresour. Technol. Rep. 20, 101234. doi:10.1016/j.biteb.2022.101234
Shensi Wang, S., Fu, K., Sun, X., Zhang, Z., Li, S., and Jin, L. (2021). Hierarchical-aware relation rotational knowledge graph embedding for link prediction. Neurocomputing 458, 259–270. doi:10.1016/j.neucom.2021.05.093
Shi, C. (2020). Decoupling analysis and peak prediction of carbon emission based on decoupling theory. Sustain. Comput. Inf. Syst. 28, 100424. doi:10.1016/j.suscom.2020.100424
Singh, B. P., and Kannadhasan, M. (2020). Corruption and capital structure in emerging markets: A panel quantile regression approach. J. Behav. Exp. Finance 28, 100417. doi:10.1016/j.jbef.2020.100417
Siriopoulos, C., and Pomonis, G. (2009). Selecting strategies to foster economists’ critical thinking skills: A quantile regression approach. Int. Rev. Econ. Educ. 8 (1), 106–131. doi:10.1016/S1477-3880(15)30076-1
Sun, Y., Bao, Q., Siao-Yun, W., Islam, M., and Razzaq, A. (2022). Renewable energy transition and environmental sustainability through economic complexity in BRICS countries: Fresh insights from novel Method of Moments Quantile regression. Renew. Energy 184, 1165–1176. doi:10.1016/j.renene.2021.12.003
Tenaw, D., and Beyene, A. D. (2021). Environmental sustainability and economic development in sub-saharan africa: A modified EKC hypothesis. Renew. Sustain. Energy Rev. 143, 110897. doi:10.1016/j.rser.2021.110897
Tutak, M., and Brodny, J. (2022). Renewable energy consumption in economic sectors in the EU-27. The impact on economics, environment and conventional energy sources. A 20-year perspective. J. Clean. Prod. 345, 131076. doi:10.1016/j.jclepro.2022.131076
Usman, M., and Makhdum, M. S. A. (2021). What abates ecological footprint in BRICS-T region? Exploring the influence of renewable energy, non-renewable energy, agriculture, forest area and financial development. Renew. Energy 179, 12–28. doi:10.1016/j.renene.2021.07.014
Wada, I., Faizulayev, A., and Victor Bekun, F. (2021). Exploring the role of conventional energy consumption on environmental quality in Brazil: Evidence from cointegration and conditional causality. Gondwana Res. 98, 244–256. doi:10.1016/j.gr.2021.06.009
Wan, G., Wang, C., Wang, J., and Zhang, X. (2022). The income inequality-CO2 emissions nexus: Transmission mechanisms. Ecol. Econ. 195, 107360. doi:10.1016/j.ecolecon.2022.107360
Wang, H. (2022). Role of environmental degradation and energy use for agricultural economic growth: Sustainable implications based on ARDL estimation. Environ. Technol. Innovation 25, 102028. doi:10.1016/j.eti.2021.102028
Wang, J., and Yuan, R. (2022). Inequality in urban and rural household CO2 emissions of China between income groups and across consumption categories. Environ. Impact Assess. Rev. 94, 106738. doi:10.1016/j.eiar.2022.106738
Wasti, S. K. A., and Zaidi, S. W. (2020). An empirical investigation between CO2 emission, energy consumption, trade liberalization and economic growth: A case of Kuwait. J. Build. Eng. 28, 101104. doi:10.1016/j.jobe.2019.101104
WorldBank (2022). All data are obtained from the World Bank Development indicator (2020). New York, NY: WorldBank. Available at: https://datatopics.worldbank.org/world-development-indicators/.
Wu, R., Wang, J., Wang, S., and Feng, K. (2021). The drivers of declining CO2 emissions trends in developed nations using an extended stirpat model: A historical and prospective analysis. Renew. Sustain. Energy Rev. 149, 111328. doi:10.1016/j.rser.2021.111328
Wu, R., and Xie, Z. (2020). Identifying the impacts of income inequality on CO2 emissions: Empirical evidences from OECD countries and non-OECD countries. J. Clean. Prod. 277, 123858. doi:10.1016/j.jclepro.2020.123858
Xi Chen, X., Shuai, C., Zhang, Y., and Wu, Y. (2020). Decomposition of energy consumption and its decoupling with economic growth in the global agricultural industry. Environ. Impact Assess. Rev. 81, 106364. doi:10.1016/j.eiar.2019.106364
Xia, W., Apergis, N., Bashir, M. F., Ghosh, S., Doğan, B., and Shahzad, U. (2022). Investigating the role of globalization, and energy consumption for environmental externalities: Empirical evidence from developed and developing economies. Renew. Energy 183, 219–228. doi:10.1016/j.renene.2021.10.084
Xie, Z., Wu, R., and Wang, S. (2021). How technological progress affects the carbon emission efficiency? Evidence from national panel quantile regression. J. Clean. Prod. 307, 127133. doi:10.1016/j.jclepro.2021.127133
Xu, B., and Lin, B. (2018). Investigating the differences in CO2 emissions in the transport sector across Chinese provinces: Evidence from a quantile regression model. J. Clean. Prod. 175, 109–122. doi:10.1016/j.jclepro.2017.12.022
Xu, B., and Lin, B. (2020). Investigating drivers of CO2 emission in China’s heavy industry: A quantile regression analysis. Energy 206, 118159. doi:10.1016/j.energy.2020.118159
Xu, G., Schwarz, P., and Yang, H. (2019a). Determining China’s CO2 emissions peak with a dynamic nonlinear artificial neural network approach and scenario analysis. Energy Policy 128, 752–762. doi:10.1016/j.enpol.2019.01.058
Xu, X., Xu, Z., Chen, L., and Li, C. (2019b). How does industrial waste gas emission affect health care expenditure in different regions of China: An application of bayesian quantile regression. Int. J. Environ. Res. Public Health 16 (15), 2748. doi:10.3390/ijerph16152748
Xu, D., Sheraz, M., Hassan, A., Sinha, A., and Ullah, S. (2022). Financial development, renewable energy and CO2 emission in G7 countries: New evidence from non-linear and asymmetric analysis. Energy Econ. 109, 105994. doi:10.1016/j.eneco.2022.105994
Yirong, Q. (2022). Does environmental policy stringency reduce CO2 emissions? Evidence from high-polluted economies. J. Clean. Prod. 341, 130648. doi:10.1016/j.jclepro.2022.130648
Yoon, S.-M. (2022). On the interdependence between biofuel, fossil fuel and agricultural food prices: Evidence from quantile tests. Renew. Energy 199, 536–545. doi:10.1016/j.renene.2022.08.136
Yu, Y., Jiang, T., Li, S., Li, X., and Gao, D. (2020). Energy-related CO2 emissions and structural emissions’ reduction in China’s agriculture: An input–output perspective. J. Clean. Prod. 276, 124169. doi:10.1016/j.jclepro.2020.124169
Zheng, J., Wu, Z., Sharma, R., and Lv, H. (2022). Adaptive decision model of product team organization pattern for extracting new energy from agricultural waste. Sustain. Energy Technol. Assessments 53, 102352. doi:10.1016/j.seta.2022.102352
Zhou, X., Wang, J., Wang, H., and Lin, J. (2022a). Panel semiparametric quantile regression neural network for electricity consumption forecasting. Ecol. Inf. 67, 101489. doi:10.1016/j.ecoinf.2021.101489
Zhou, Y., Jiang, D., Ding, D., Wu, Y., Wei, J., Kong, L., et al. (2022b). Ecological-health risks assessment and source apportionment of heavy metals in agricultural soils around a super-sized lead-zinc smelter with a long production history, in China. Environ. Pollut. 307, 119487. doi:10.1016/j.envpol.2022.119487
Keywords: agriculture production, environmental Kuznets curve (EKC), economic growth, CO2 emissions, energy consumption
Citation: Khan R, Alabsi AAN and Muda I (2023) Comparing the effects of agricultural intensification on CO2 emissions and energy consumption in developing and developed countries. Front. Environ. Sci. 10:1065634. doi: 10.3389/fenvs.2022.1065634
Received: 10 October 2022; Accepted: 17 November 2022;
Published: 04 January 2023.
Edited by:
Daniel Balsalobre-Lorente, University of Castilla-La Mancha, SpainReviewed by:
Magdalena Radulescu, University of Pitesti, RomaniaCopyright © 2023 Khan, Alabsi and Muda. This is an open-access article distributed under the terms of the Creative Commons Attribution License (CC BY). The use, distribution or reproduction in other forums is permitted, provided the original author(s) and the copyright owner(s) are credited and that the original publication in this journal is cited, in accordance with accepted academic practice. No use, distribution or reproduction is permitted which does not comply with these terms.
*Correspondence: Rabnawaz Khan, a2hhbi1yYWJAb3V0bG9vay5jb20=; Akram Ahmed Noman Alabsi, QWxhYnNpQWtyYW1AZmp1dC5lZHUuY24=
Disclaimer: All claims expressed in this article are solely those of the authors and do not necessarily represent those of their affiliated organizations, or those of the publisher, the editors and the reviewers. Any product that may be evaluated in this article or claim that may be made by its manufacturer is not guaranteed or endorsed by the publisher.
Research integrity at Frontiers
Learn more about the work of our research integrity team to safeguard the quality of each article we publish.