 Honghong Dong1,2†
 Qing Huang
 Qian Zhang
 Ning Li
95% of researchers rate our articles as excellent or good
Learn more about the work of our research integrity team to safeguard the quality of each article we publish.
Find out more
ORIGINAL RESEARCH article
Front. Environ. Sci. , 18 November 2022
Sec. Environmental Economics and Management
Volume 10 - 2022 | https://doi.org/10.3389/fenvs.2022.1065140
This article is part of the Research Topic Resources and Environmental Management for Green Development View all 26 articles
Land use change is one of the crucial factors affecting carbon emissions. The continuously increasing CO2 and global warming have raised concerns about carbon emission reduction in the process of urbanization. In this research, the Markov and multi-objective optimization models were conducted to predict the demands for land use in Nanjing in 2030 and 2060 under the natural growth (NG) and minimum carbon emission (MCE) scenarios to coordinate the needs of economic development, ecological protection and food security as well as the target of carbon emissions reduction in the future. The spatial distribution of land use simulated by the FLUS (Future Land Use Simulation) model was used to evaluate the effects of future land use on carbon emissions. The results showed that 1) The demands for each type of land use in the NG scenario were significantly different from those in the MCE scenario. Considering the goals of food security and ecological protection in the future, the total amount of cultivated land would not decrease in the MCE scenario, and the area of construction land was significantly smaller than that in the NG scenario. 2) The carbon emissions of Nanjing under the MCE scenario would decrease by 3.94 and 11.80 million tons in 2030 and 2060, respectively, accounting for 9.97% and 27.17% of the total carbon emissions. The optimization of land use patterns can effectively reduce carbon emissions in the process of urbanization.
The continuous increase in global CO2 concentrations and the resulting climate warming have become one of the most severe challenges faced by human society in the 21st century (Tigchelaar et al., 2018). Under the Paris Agreement on climate change, various countries pledged to keep global warming well below 2°C and preferably to 1.5°C compared to pre-industrial levels (Park et al., 2018). The Chinese government announced that China would strive to reach its CO2 emissions peak by 2030 and achieve carbon neutrality by 2060. Thus, how to reduce carbon emissions has become a main focus of Chinese government.
Land is the carrier of major anthropogenic carbon emissions, and land use effects on carbon emission differ significantly (Chuai et al., 2015b). Land use transitions among different types affect anthropogenic carbon emissions. Previous studies have shown that the cumulative carbon emissions from land use change since 1959 accounted for 19% of global anthropogenic carbon emissions (Friedlingstein et al., 2020). The reasonable planning and layout of limited land resources and the optimization of land use structure can effectively reduce carbon emissions and promote the coordinated development of the socio-economy and eco-environment (Xiao et al., 2007; Chuai et al., 2015a; Wang and Han, 2021). Therefore, research on the carbon emission effects of land use change is of great strategic significance for controlling carbon emissions to achieve carbon neutrality goals.
Land use/land cover change is an important component of global environmental change, land use change simulation plays a key role in analyzing the impacts of land use change for a wide variety of socioeconomic and ecological processes (Liang et al., 2021; Houghton et al., 2012). The cellular automata (CA) model has distinct advantages in dynamically simulating nonlinear complex geospatial systems (Liu et al., 2017; Liang et al., 2021) and has been widely used in the simulation of land use change. Many studies have focused on the transformation rules and parameter optimization of the CA model. The methods have been developed from heuristic or linear methods (e.g., logistic regression (Mirbagheri and Alimohammadi, 2017), grey model (Li and Yeh, 2000)) to intelligent or nonlinear methods (e.g., ant colony algorithm (Liu et al., 2007), ensemble Kalman filter (Zhang et al., 2015), machine learning (Morshed et al., 2022). These studies mainly focus on the simulation of the expansion of construction land and aims to analyze the sprawl of the city. In recent years, the CA model not only was developed to be able to simulate changes of different kinds of land use but also greatly improved the accuracy of simulation by combining with the intelligent algorithm (Li et al., 2017; Liu et al., 2017). As one of the most typical representative of CA model, the FLUS model (Future Land Use Simulation) showed high adaptability in simulating future land use under different scenarios through continuous model improvement (Liang et al., 2018a; Liang et al., 2018b; Liu et al., 2018) and has been widely used in the simulation of land use change (Liang et al., 2018a; Liang et al., 2018b; Zhang D. et al, 2020a; Chen et al., 2020; Liao et al., 2020).
However, less consideration has been given to ecological protection and food security in the simulation of land use change in previous studies (Verburg et al., 2002; Pijanowski et al., 2006; Schaldach et al., 2011). In the context of global greenhouse gas emissions control and China’s carbon peak and carbon neutrality goals, how to optimize future land use structure and layout while considering the balance among economic development, ecological protection and food security has become an urgent problem for effectively reducing carbon emissions.
Urbanization level is highly correlated with land use change. Urban expansion necessarily occupy other land use spaces, which results in large amounts of carbon emissions. Since the 1980s, both domestic and international studies have begun to focus on the carbon emission effect of land use change and have found that land use change is one of the dominant factors changing the total amount of CO2 in the air (Campbell et al., 2000; Watson et al., 2000; Ali and Nitivattananon, 2012). Many studies indicated that the carbon emission effects of land use had remarkable differences from urban (Hutyra et al., 2011; Zhao et al., 2014), regional (Chuai et al., 2016; Li et al., 2020), and national (Leite et al., 2012) to global (Houghton et al., 2012) scales. For example, Zhao et al. (Zhao et al., 2014) explored the optimization of land use structure by using linear programming approach in order to form a low-carbon land use pattern. Cui et al. (Cui et al., 2018) found that the increase in urban land in the Yangtze River Delta urban agglomeration in the past 20 years contributed to approximately half of the total urban carbon emissions. Lai et al. (Lai et al., 2016) considered that the increase in the total amount of carbon emissions in China during 1990–2010 was mainly due to land use conversions among different types. However, current studies have mainly focused on the carbon emission effects of land use structure change, and the effects of different land use transfers spatially are still unclear. The optimization of the layout and structure of future land use and its carbon emission effects still need further research.
In this study, we used both the Markov model and the multi-objective optimization model to forecast the land use demands in Nanjing in 2030 and 2060, and the FLUS model was employed to spatially allocate the land use in the natural growth (NG) and minimum carbon emission (MCE) scenarios. We investigated the differences in land use changes between the two scenarios and quantitatively evaluated the carbon emission effects of land use patterns in the two scenarios. Our results highlight challenges in using the multi-objective optimization model to coordinate the needs of future urban expansion in the constraints of food security, ecological protection and economic development. Additionally, this research provides some possible paths for urban expansion with minimal carbon emissions for the cities of China in the future.
The study area of Nanjing, Jiangsu Province, with a total land area of approximately 6,587.02 square kilometres, is located at 118°22”∼119°14″E, 31°14”∼32°37″N. It is an important intersection zone between the Yangtze River economic belt and the “Belt and Road”, which has an important strategic position (Figure 1). According to the data in the Nanjing Statistical Yearbook (http://tjj.nanjing.gov.cn/), Nanjing had a resident population of 9,319,700 and a gross regional product of 148.18 billion CNY in late 2020. And the urbanization rate of Nanjing has increased from 78.5% in 2010 to 86.8% in 2020, Continued reduction of cropland and expansion of construction land in this region have gradually increased the pressure on resources and the environment.
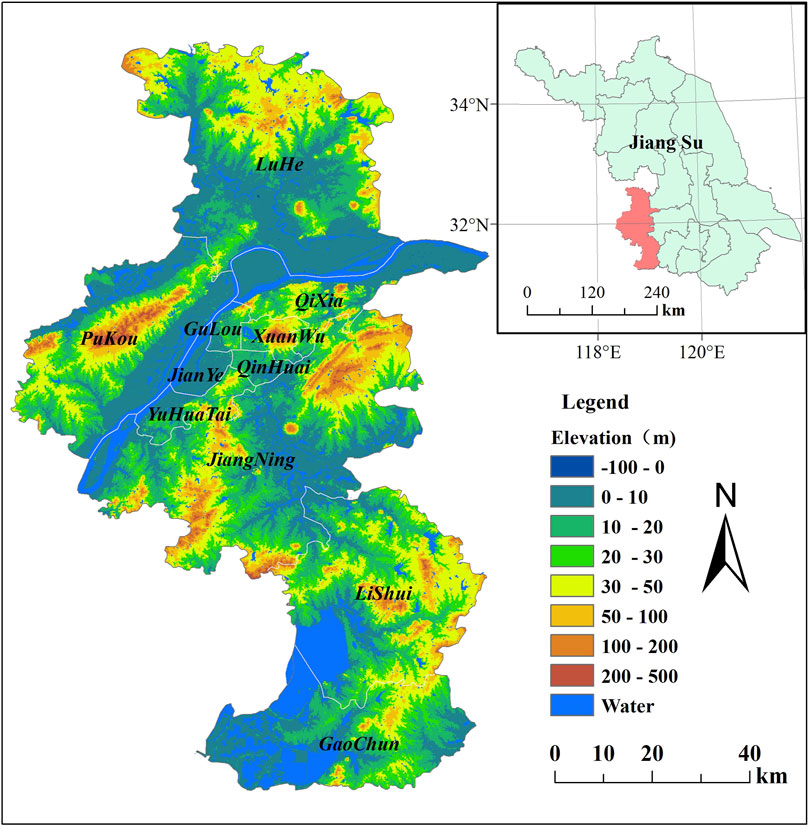
FIGURE 1. The geographic location of Nanjing in Jiangsu province.
The FLUS model used in this paper was driven by land use data, driving factor data (including topography, transportation data, etc.) and socioeconomic data. The land use data were interpreted from Landsat TM/ETM remote sensing images and obtained from the Resource and Environmental Science Data Center (https://www.resdc.cn/) and were reclassified into seven land use types: cultivated land, woodland, grassland, waters, urban construction land, rural residential land, and unutilized land. The area of each land use type is shown in Figure 2. The transportation factor data were the distances to major roads (including railroads, highways, national roads, provincial roads, and county roads) and distances to city, district, and county centres, which were calculated using Euclidean distance. Other driving factors included topographical factor data, e.g., elevation, slope and aspect, and population density data. The elevation data were obtained from the Geospatial Data Cloud (http://www.gscloud.cn/), and the slope and aspect data were generated by using terrain analysis tools. The spatial distribution data of population density were obtained from World Pop (https://www.worldpop.org/), and the gridded dataset was generated by remotely-sensed data and geospatial data using Random Forest model. All data were mapped to the interval (0, 1) by the normalization method.
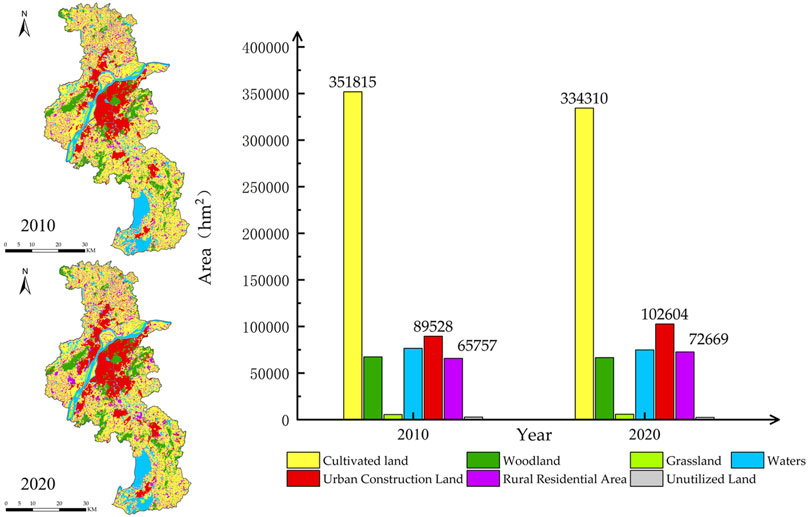
FIGURE 2. The area of each land use type in 2010 and 2020.
In this paper, future urban development scenarios were set up as the natural growth scenario (NG) and the multi-objective collaborative minimum carbon emission scenario (MCE). The Markov model was used in the NG scenario to predict future land use demands based on the trend of the historical period. The multi-objective optimization model was used in the MCE scenario to predict future land use demands under the constraints of food security, ecological protection, and economic development, and the minimization of carbon emissions was used as the objective function to balance different land use demands. Then, the FLUS model was used to simulate the spatial distribution of land use in 2030 and 2060 based on the areas of each land use type under the NG and MCE scenarios. The flowchart of the methods in this study is illustrated in Figure 3.
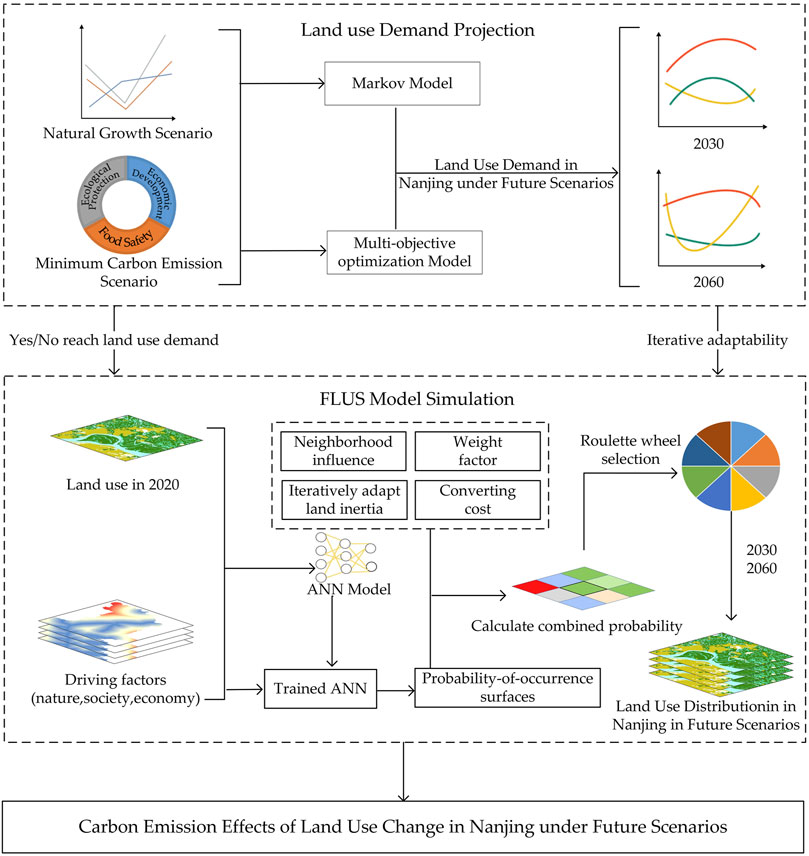
FIGURE 3. The flowchart of methods in this study.
The Markov model, i.e., the Markov chain (Oliveira Barros et al., 2018), based on probability theory, was used to simulate future land use changes in a stochastic state (that is, a shift with a certain probability from one period to another), and this state was related only to the present and not related to the past and future. This model is fit for predicting long-term trends and has been widely used to simulate future land use change (Iacono et al., 2015; Durmusoglu and Akın Tanrıöver, 2017). The probability transfer matrix is the key to this model. The mathematical formulas are as follows:
where
The multi-objective optimization model was used to predict the future land use demand in Nanjing by considering the constraints of multi-objective demands for food security, ecological protection, and economic development and the minimization of carbon emissions. This model was expressed in mathematical Formula (3), and the optimal solution was obtained when the value of variable xi met the requirement of the extreme values of the objective function F(X):
The area of seven land use types (i.e., cultivated land X1, woodland X2, grassland X3, urban construction land X4, rural residential land X5, water X6, and unused land X7) were selected as the decision variables. The multi-objective demands on land use of food security, ecological protection, and economic development were set as the constraints, and the minimization of carbon emissions was used to construct the objective function.
(1) Total land area constraint. According to the spatial distribution data of land use in Nanjing in 2010 and 2020, the total land area was approximately 659,051.37 ha. The sum of the land areas of all types should be equal to the total area, which should be unchanged under future scenarios. The constraint equation of the total land area is as follows:
(2) Cultivated land demand constraint. Considering the demands of land use for food security, the amount of cultivated land in Nanjing should not be reduced in the future. Therefore, the amount of cultivated land in 2020 (334,310.49 ha) was set as the lower limit of the cultivated land demand. Generally, the increment of cultivated land derived from the consolidation of rural settlements and the reclamation of abandoned industrial and mining land was offset by the occupation of urban construction land. The net increase in cultivated land was mainly derived from the development of unused land. Therefore, from the perspective of maximizing the supplementation of cultivated land, assuming all the unused land would be converted to cultivated land in future scenarios, the summed area of cultivated land and unused land was set as the upper limit of the cultivated land demand. The constraint equation of cultivated land area in Nanjing is as follows:
(3) Woodland demand constraint. In view of the demand for land use for ecological protection, the amount of woodland in Nanjing should not be reduced in the future. Therefore, the amount of woodland in 2020 (66,464.37 ha) was set as the lower limit of the woodland demand. To match the requirements in carrying out greening programs and enhancing the carbon absorption capacity of ecosystems, which was outlined in the 14th Five-Year Plan (2021–2025) and the Long-Range Objectives through the year 2035 for Nanjing, there should be an increase in the area of woodland in the future. Considering the increased potential of woodland derived from the construction of ecological corridors along the Yangtze River shoreline and traffic arteries and vegetation restoration of mining areas, the average growth rate of the woodland area is expected to be 0.3% in future years, and this value was used as the upper limit of the woodland demand. The constraint equation of woodland area in Nanjing is as follows:
(4) Grassland demand constraint. The grassland area of Nanjing in 2020 was 5,809.14 ha, accounting for only 0.88% of the total land area. Meanwhile, there was a smaller-magnitude change in the grassland area during 2010–2020, with an average annual change rate ranging from −0.09% to 1.37%. According to the abovementioned change rate range of grassland area, the constraint equation of grassland demand in Nanjing was established as follows:
(5) Urban construction land demand constraint. With the development of economy, Nanjing should not shrink in size in the future as the capital of Jiangsu Province and the mega-city in the Yangtze River Delta, the current size should be the minimum area of urban construction land in the future. We extrapolated the demand for urban construction land in Nanjing in the future based on the urban resident population and the per capita urban construction land use standards (see Supplementary Table S1). The time series data of the resident population size and urbanization rate in Nanjing from 2000 to 2020, as well as the trend extrapolation method and logistic model were used to predicate the resident population (10.93 million) and urbanization rate (90%) of Nanjing in 2030. And then the urban resident population (multiply of resident population and urbanization rate) was calculated to be 9.837 million in 2030 in Nanjing. According to the per capita urban construction land area (112.38 m2 per capita) in Nanjing in 2020 and the Urban Land Classification and Planning Construction Land Standard (GB50137-2011), the magnitude of the per capita urban construction land area should reduce by −15 m2 for the increasing of resident population. Combined with the above calculation and the ratio of urban construction land, the constraint equation for the urban construction land was established as follows:
(6) Rural residential land demand constraint. With the progress of urbanization, a large number of rural populations shift to cities and towns, and there should be a declining trend of rural residential land. The future demand for rural residential land in Nanjing was also extrapolated based on the future rural resident population and the expected per capita rural residential land. Using the above predicted resident population and urbanization rate, we obtained the rural resident population of Nanjing in 2030 (1.093 million). To meet the requirements of new-type urbanization and land use intensification, the rural residential land area and per capita rural residential land in Nanjing should be decreased with the decrease in the rural population. The per capita rural residential land was set to decrease by 10% in 2030, which was used to identify the lower limit of the rural residential land demand. The amount of rural residential land in 2020 (72,669.15 ha) was set as the upper limit, and then the constraint equation of rural residential land was as follows:
(7) Water demand constraint. The water area of Nanjing in 2020 was 74,768.04 ha, and it had an average annual decrease rate of 0.23% during 2010–2020. The decrease in water was mainly due to the transfer of rural ponds to other lands, but the amount of water change was small. Then, assuming that the future water change would be consistent with the historic change trend, the water area extrapolated by the average annual decrease rate was set as the lower limit, and the water area in 2020 was set as the upper limit of water demand. The constraint equation of the Nanjing water demand was established as follows:
Research on the carbon emission intensity of different land use types has been extensively conducted at the national (Lai, 2010), regional (Chuai et al., 2015b), and urban (Zhao et al., 2013) scales, and related results are shown in Table 1. The values of carbon emission intensity of the different land use types used in the manuscript mainly referenced the results of Zhao et al. (2013) for considering the differences in carbon emission intensity of land use in different regions. Due to the differences in land use classification systems, the carbon emission intensity of urban construction land might be overestimated when incorporating other construction land, such as transportation, into urban construction land. Therefore, the weighted average method was used to adjust the carbon emission intensity of urban construction land. The carbon emission intensity parameters of different land use types in Nanjing are given in Table 1.
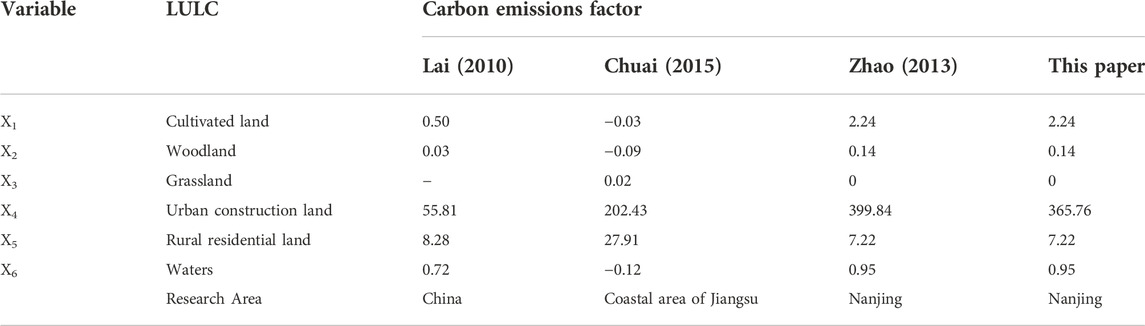
TABLE 1. Carbon emission parameters of different land use patterns (t/hectare).
Based on the parameters of carbon emissions of each land use type, the objective function of carbon emission minimization in multi-objective collaboration was constructed as follows:
Where F is the sum of total carbon emissions generated by different land use types, and X1, X2... X6 are the demand of different land uses. This model was solved by LINGO (Linear Interactive and General Optimizer), an interactive linear and general optimization solver that is widely used to solve linear, nonlinear, and integer optimization models.
In the manuscript, the FLUS model was used to simulate the future spatial distribution of land use in Nanjing, which was improved based on the CA model by Liu et al. (2017). This model considers the effects of human activities and natural factors and can be applied to simulate the spatial changes in land use under historical and future scenarios (Li et al., 2011; Liu et al., 2017; Liu et al., 2018). Based on the spatial distribution of land use and driving factor data in the baseline period (2010, 2020), the backpropagation artificial neural network algorithm (BP-ANN) was employed in the FLUS model to calculate the suitability probabilities of various land types and then to transfer land use types by the roulette method (Zhang et al., 2022). The main calculation modules of the FLUS model are as follows.
(1) BP-ANN-based suitability probability calculation
The ANN algorithm consists of the input and the implicit and output layers and can be formulated as follows:
where
The sum of suitability probabilities for all types of land use in the BP-ANN algorithm was 1, i.e.,
The training samples were randomly selected by ANN. The sampling proportion was set to 20%, and the number of hidden layers was empirically set to 12. The suitability probabilities of different land use types were obtained by inputting the normalization of all driver factor raster data into the FLUS model.
(2) Self-adaptive inertia and competition mechanism
The core of the self-adaptive inertia mechanism in the FLUS model is the inertia coefficient, which is adjusted based on the differences between the actual distribution and the expected demand of different land uses to achieve the predetermined targets of the amount of land use. The formula was defined as follows:
where
After calculating the total suitability probability in the ANN model, each land use type was allocated to each cell through several iterations of the CA model. The overall conversion probability in the occupied cells of a specific land type was estimated by using the following equation:
where
where
In this study, a 3 × 3 window-based neighbourhood was used, and the number of iterations was set to 300. The parameters of the neighbourhood factors of each land type outlined in Table 2 were set based on the future development trend.
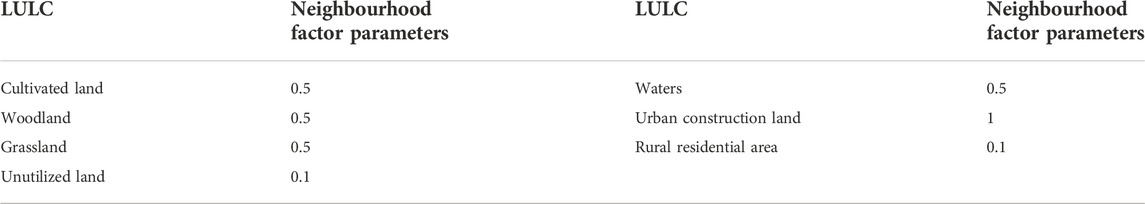
TABLE 2. Neighbourhood factor parameters in FLUS model.
Kappa coefficients were used to verify the simulation accuracy by comparing the actual distributions of land use in 2020 with the simulated results with 2010 as the base year. The expression of Kappa was as follows:
where
The FLUS model simulated spatial distributions of land use in Nanjing in 2020 by using 2010 as the base year, and the results were verified against the actual situation for accuracy. The comparative results indicated that the simulated spatial distributions of land use had good agreement with the actual situation, with a high simulation accuracy of 0.91 (shown in Figure 4), which met the needs of land use simulation. Additionally, the conversions of cropland to urban construction land and rural residential land were the two main transfer paths (shown in Table 3), of which the simulation errors compare with the actual situations were 9.25% and 9.54%, respectively. The FLUS model had good adaptability in this study.
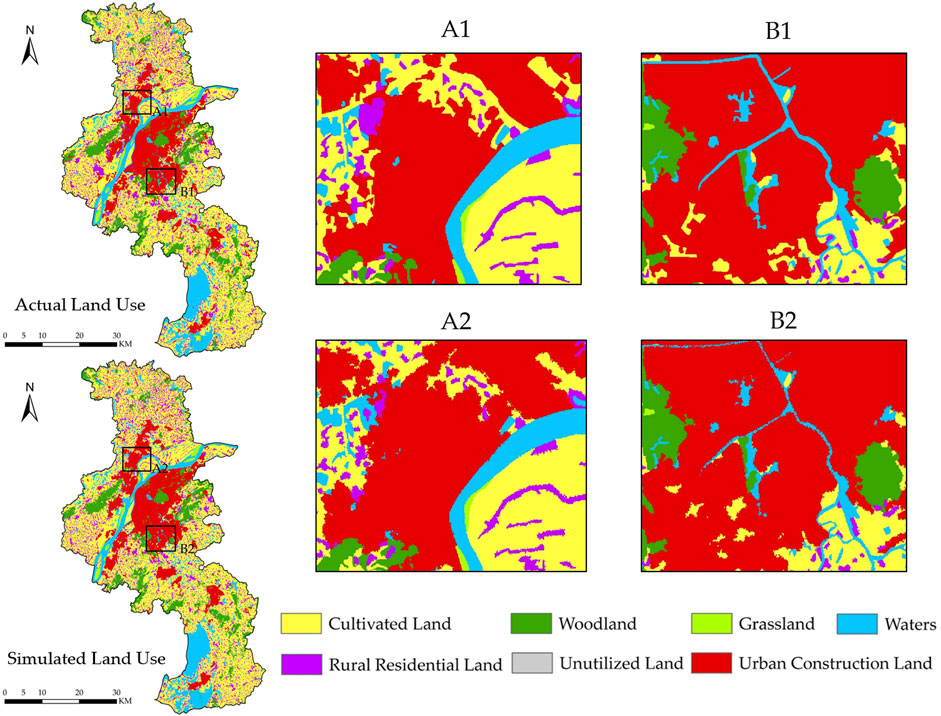
FIGURE 4. Actual and simulated land use patterns in Nanjing in 2020. (A,B) represent their respective regions; (A1, A2) represent the actual and simulated land use patterns in region (A); and (B1, B2) represent the actual and simulated land use patterns in region (B).
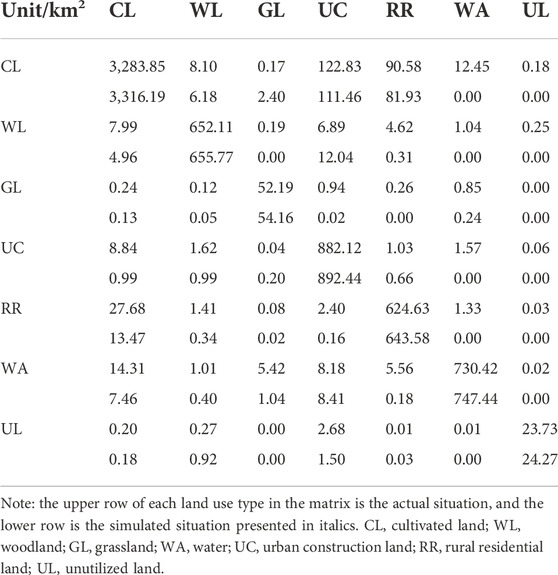
TABLE 3. Transition matrix of land use types in Nanjing from 2010 to 2020.
The demand for type of land use in Nanjing in 2030 and 2060 in the NG scenario was significantly different from that in the MCE scenario, as shown in Figure 5 and Table 4. In the NG scenario, compared with 2020, the area of cultivated land decreased by 4.76% and 16.74%, whereas the area of urban construction land increased by 11.94% and 43.42%, and the area of rural residential land increased by 8.41% and 28.10% in 2030 and 2060, respectively. In the MCE scenario, the area of cultivated land decrease less than 1%, the rural residential land also decreased by 5.45% and 18.40%, and the urban construction land increased slightly by 1.53% and 12.28% in 2030 and 2060, respectively.
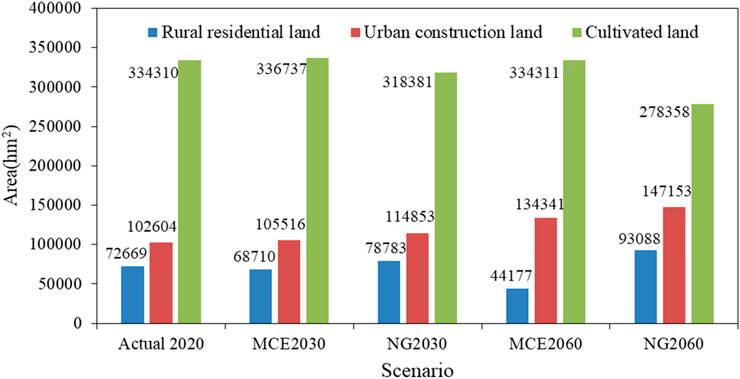
FIGURE 5. The demand for each land use type in Nanjing in 2030 and 2060 under future scenarios (hectare).

TABLE 4. The area of land use of each type in Nanjing under future scenarios (hectare).
Based on the actual situation of land use and driving factor data in 2020 and the predicted land use of each type in the NG and MCE scenarios, the respective spatial distributions of land use in Nanjing in 2030 and 2060 simulated by the FLUS model are shown in Figure 6. Although the land use patterns in the NG and MCE scenarios were approximately similar, the scale of construction land expansion in the NG scenario was larger than that in the MCE scenario. Additionally, there were some differences in the method of construction land expansion in the two scenarios, as shown in Figure 7. In the NG scenario, the urban construction land expanded outward along the current urban boundary, resulting in the occupation of a large amount of cultivated land. In contrast, in the MCE scenario, the expansion of urban construction land mainly came from the scattered rural residential land surrounding the urban boundary.
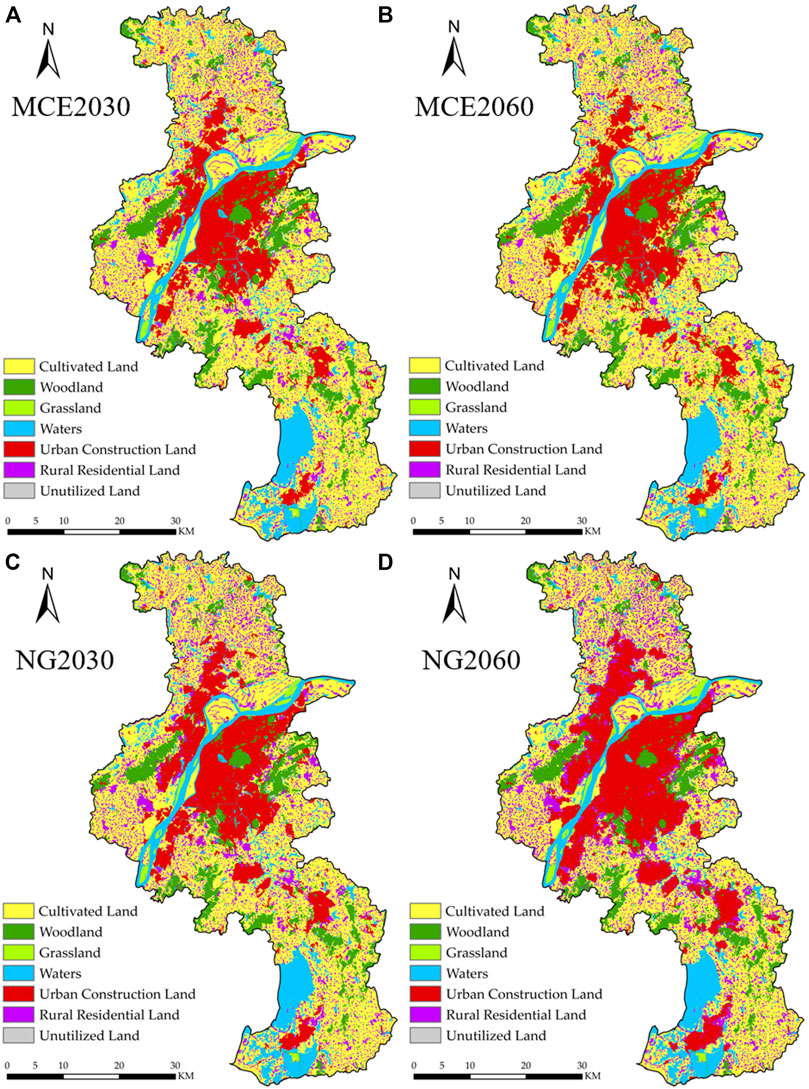
FIGURE 6. Spatial distribution of land use in Nanjing in 2030 (A,C) and 2060 (B,D) in the NG (C,D) and MCE (A,B) scenarios.
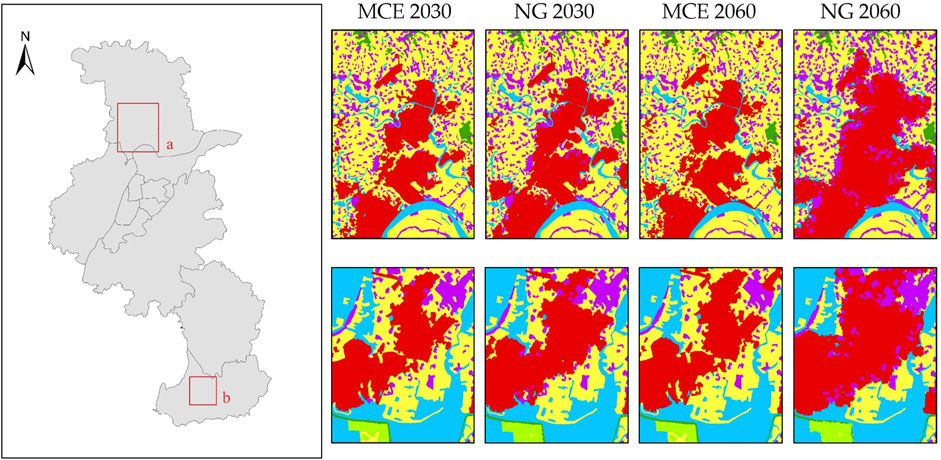
FIGURE 7. Two enlarged views of land use simulation in 2030 and 2060 in the NG and MCE scenarios.
According to the actual spatial distribution of land use in 2020 and the simulated spatial distribution of land use in 2030 and 2060 in the NG and MCE scenarios, Sankey diagrams of the land transfer matrix of Nanjing in 2020–2030 and 2020–2060 in the two scenarios were established, as shown in Figure 8. Overall, the land use structure of Nanjing in future scenarios was relatively stable. The area of cultivated land was the largest, accounting for approximately 50%–51% of the total land area, and the area of urban construction land was the second largest, accounting for approximately 15%–17%. The proportions of rural residential land, water and woodland were all approximately 10%, and the area of grassland and unused land was relatively small.
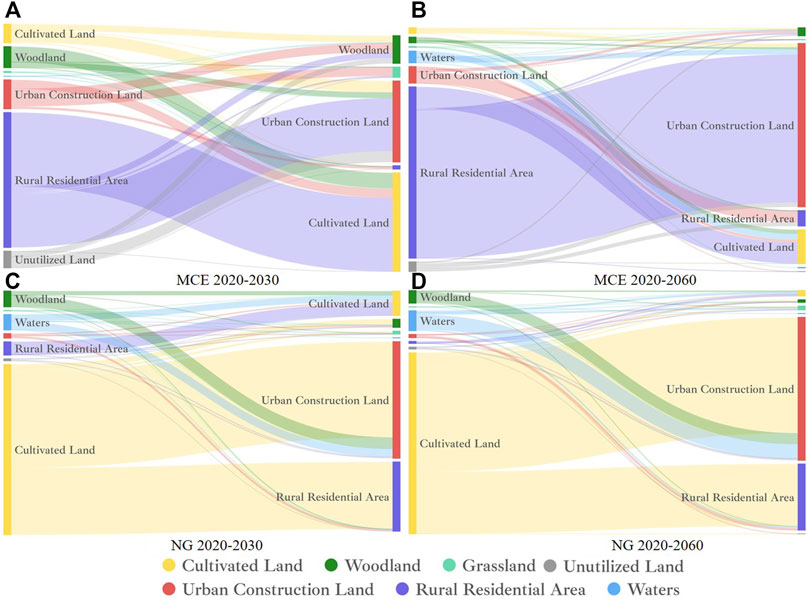
FIGURE 8. Sankey diagrams of land transfer matrix of Nanjing during 2020–2030 (A,C) and 2020–2060 (B,D) in the NG (C,D) and MCE scenarios (A,B).
However, the transfer paths of land use in Nanjing in the different scenarios differed significantly. In the MCE scenario, the conversions of rural residential land, cultivated land, and unutilized land to urban construction land were the main paths of land use transfer from 2020 to 2030, where rural residential land transfer accounted for 65.66% of the total area transferred to urban construction land. Furthermore, during the period 2020–2060, the conversion of rural residential land to urban construction land was the more dominant path of land use transfer, with a proportion of 90.71% of the total area transferred to urban construction land. Additionally, the interconversions between cultivated land, rural residential land and waters were very active. Compared with the MCE scenario, the interconversions between different land use types were remarkably different in the NG scenario because no constraints were set on land use change. The significant characteristics of land use transfer in the NG scenario were that the area of cultivated land decreased considerably due to the urban construction land expansion, and a large area of woodland was also converted to urban construction land.
The carbon emission effects of land use in Nanjing in 2030 and 2060 using the coefficients of carbon emissions of each land use type are shown in Table 5. Under the NG scenario, the carbon emissions from land use in Nanjing in 2030 and 2060 were 43,410,600 tons and 55,239,200 tons, respectively, where the carbon emissions from urban construction land were the largest, up to 42,008,700 tons and 53,822,700 tons in 2030 and 2060, respectively, accounting for 96.77% and 97.43% of the total carbon emissions. The carbon emissions generated by woodland were minimal, with amounts of 9,200 tons and 8,900 tons in 2030 and 2060, respectively. In contrast, under the MCE scenario, the carbon emissions of land use in Nanjing in 2030 and 2060 were 39,472,800 tons and 43,437,500 tons, respectively, where urban construction land was still the land use type with the largest carbon emissions, with amounts of 38,100,800 tons and 42,136,600 tons in 2030 and 2060, accounting for 96.52% and 97.01% of the total carbon emissions.
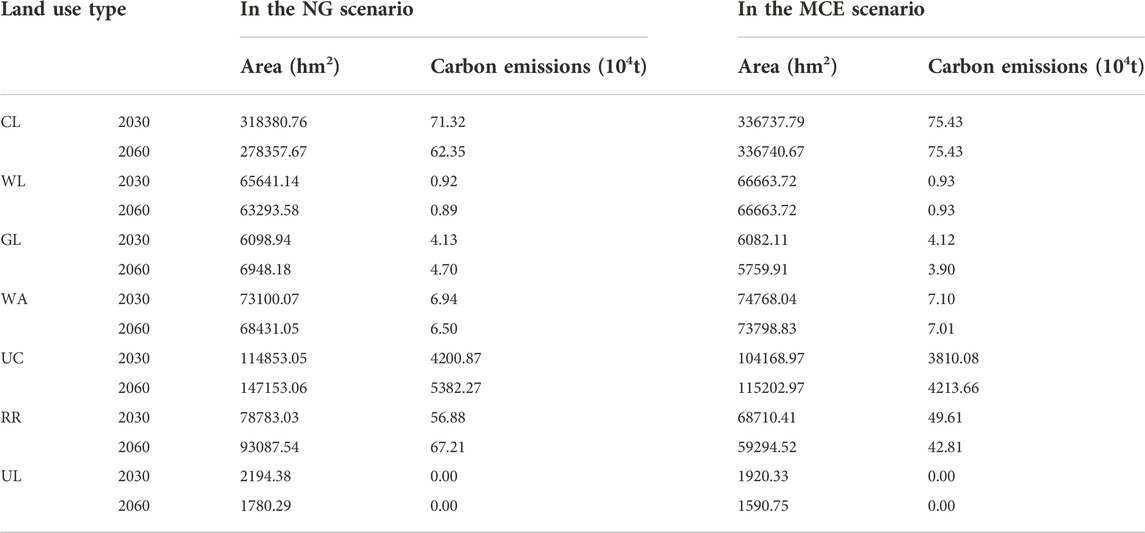
TABLE 5. Carbon emissions from different land uses in Nanjing in 2030 and 2060 under different scenarios.
Although the proportion of carbon emissions from urban construction land to total carbon emissions did not change significantly under the two scenarios, the total carbon emissions in the MCE scenario in 2060 increased by only 3,964,700 tons compared to that in 2030, while that in the NG scenario increased by 11,814,000 tons. The total carbon emissions from urban construction land in Nanjing in 2030 and 2060 in the MCE scenario were 3,937,800 tons and 11,801,700 tons less than those in the NG scenario, respectively.
The carbon emissions effects of different land use transfers in Nanjing in 2030 and 2060 under the NG and MCE scenarios are shown in Tables 6, 7. In the MCE scenario, the carbon emissions from land use change in Nanjing by 2030 increased slightly, where the carbon emissions from the conversion of rural residential land to urban construction land were approximately 574,500 tons. By 2060, the increment of carbon emissions from the conversion of rural residential land to urban construction reach 4,564,800 tons. In contrast, the main land use type transferred to urban construction land in the NG scenario was cultivated land, from which the increment of carbon emissions reached 3.801 million tons and 13.4262 million tons in 2030 and 2060, respectively.
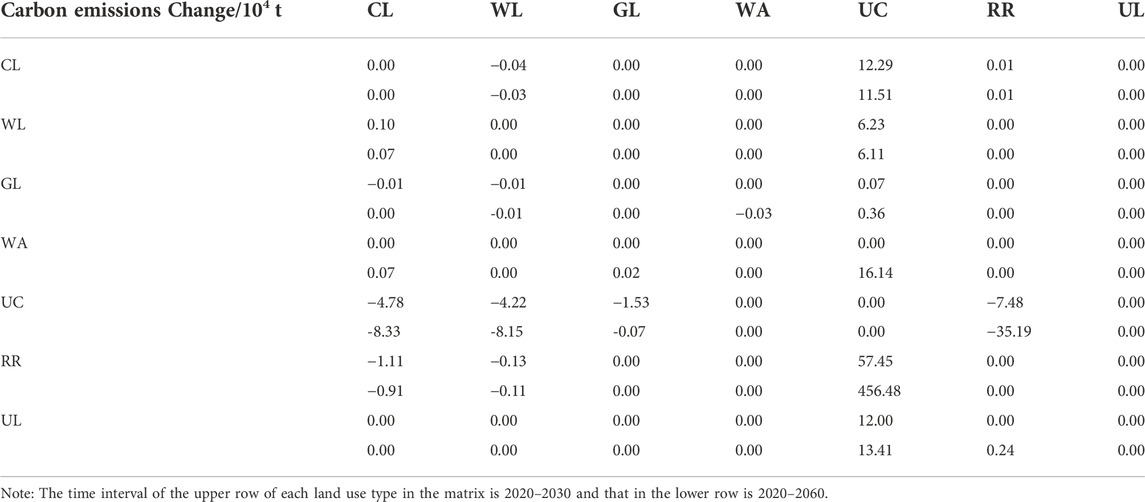
TABLE 6. Carbon emissions of land use change in Nanjing during the periods of 2020–2030 and 2020–2060 under the MCE scenario.
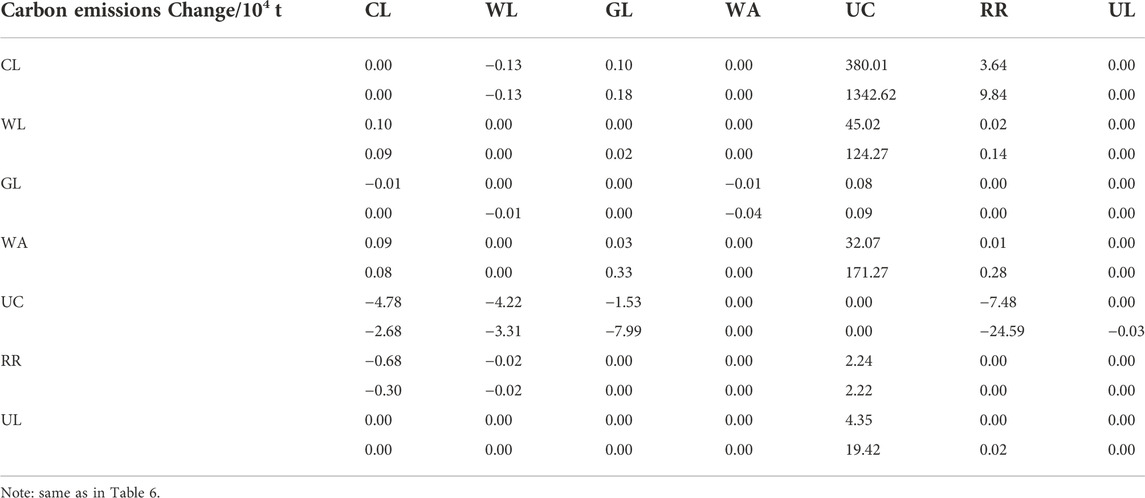
TABLE 7. Carbon emissions of land use change in Nanjing during the periods of 2020–2030 and 2020–2060 under the NG scenario.
The simulated structure and spatial distributions of land use in Nanjing in 2030 and 2060 showed that the urban construction land and rural residential land continued to increase and the cultivated land decrease considerably in the NG scenario, whereas in the MCE scenario, the cultivated land was protected effectively due to the constraint of land use in food security, the growth of urban construction land was slower and the rural residential land did not increase instead decrease. Additionally, in the NG scenario the expansion of urban construction land mainly came from the conversion of cultivated land and woodland, whereas in the MCE the expansion of urban construction land mainly came from rural residential land and the cultivated land changed slightly. Compared with in the NG scenario, the demand for each type of land use in the MCE scenario contributed more to the coordination of economic development with resource conservation and environmental protection to meet the needs of sustainable development.
The areas of cultivated land, woodland, water, and unused land in Nanjing during 2010–2020, showed decreasing trends to different degrees, while the areas of urban construction land, rural residential land and grassland showed increasing trends. In the past 10 years, China has experienced rapid urbanization, and the conversion of cultivated land to urban construction land has been the main path of urbanization development. However, with the proposal of the food security strategy, the protection of cultivated land protection is strengthening, so the probability of the conversion of cultivated land to other land types should decrease in the future. Additionally, according to the requirements of new-type urbanization and land use intensification, the area of rural residential land in Nanjing should significantly decrease in the future. Furthermore, with the enhancement of environmental protection and the carbon neutral target, woodland, as one of the most important carbon sinks in terrestrial ecosystems, should gradually increase. For above reasons, it is unlikely to predict the future land use based on the change trend of the past 10 years, which was inconsistent with the future goals of food security and ecological protection, and the predicted land use in the MCE scenario was more reasonable. And the carbon emissions of land use in the MCE scenario could be effectively reduced in the future.
In this paper, the Markov model and the multi-objective optimization model were used to predict the future land use demand in Nanjing under the NG and MCE scenarios, respectively, and the FLUS model was used to simulate the spatial distribution of land use in Nanjing under the two scenarios in 2030 and 2060. Based on the above results, the carbon emissions effects of land use changes under the different scenarios were analysed, and the following conclusions were obtained.
(1) Nanjing has experienced rapid urbanization in the past 10 years, and a large amount of cultivated land has been converted to urban construction land during this period. The area of cultivated land predicted in the NG scenario continued to decrease, and the area of urban construction land and rural residential land continued to increase, which was inconsistent with sustainable development goals, including food security and ecological protection. The estimation of land use demand based on the multi-objective optimization method can balance the needs of future urban development under the constraints of food security, ecological protection, and economic development. Under this condition, the cultivated land was protected, and the expansion scale of construction land was effectively controlled.
(2) The total carbon emissions from land use change in Nanjing predicted in the MCE scenario were much less than those in the NG scenario. Thus, the optimization of land use structure and spatial distribution can effectively reduce carbon emissions in future economic development and is an important path to help achieve the carbon peaking and carbon neutrality goals of China (Figure 1).
The original contributions presented in the study are included in the article/Supplementary Material, further inquiries can be directed to the corresponding author.
QH, HD, and FZ contributed to conception and design of the study. HD, GL, and JC organized the database. QH, FZ, HD, and XL performed the statistical analysis. QH and JC performed the visualization. QH and HD wrote the first draft of the manuscript. QH, FZ, XL, QZ, and NL wrote review and editing. All authors contributed to manuscript revision, read, and approved the submitted version.
This study was funded by the National Natural Science Foundation of China (Grant no. 41871334), the Natural Science Foundation of Jiangsu Province (Grant number. BK20201121), the Key Subject of Ecology of Jiangsu Province (Grant number. SJYH202202), and the Natural Science Foundation of Nanjing Xiaozhuang University (Grant number. 2020NXY15).
We really appreciate the editors and anonymous reviewers for their meaningful comments for improving our manuscript.
The authors declare that the research was conducted in the absence of any commercial or financial relationships that could be construed as a potential conflict of interest.
All claims expressed in this article are solely those of the authors and do not necessarily represent those of their affiliated organizations, or those of the publisher, the editors and the reviewers. Any product that may be evaluated in this article, or claim that may be made by its manufacturer, is not guaranteed or endorsed by the publisher.
The Supplementary Material for this article can be found online at: https://www.frontiersin.org/articles/10.3389/fenvs.2022.1065140/full#supplementary-material
Ali, G., and Nitivattananon, V. (2012). Exercising multidisciplinary approach to assess interrelationship between energy use, carbon emission and land use change in a metropolitan city of Pakistan. Renew. Sustain. Energy Rev. 16, 775–786. doi:10.1016/j.rser.2011.09.003
Campbell, C., Zentner, R., Liang, B.-C., Roloff, G., Gregorich, E., and Blomert, B. (2000). Organic C accumulation in soil over 30 years in semiarid southwestern Saskatchewan–effect of crop rotations and fertilizers. Can. J. Soil Sci. 80, 179–192. doi:10.4141/s99-028
Cao, S., Jin, X. B., Yang, X. H., Sun, R., Liu, J., Han, B., et al. (2019). Coupled MOP and GeoSOS-FLUS models research on optimization of land use structure and layout in Jintan district. J. Nat. Resour. (in Chinese) 34 (06), 1171–1185. doi:10.31497/zrzyxb.20190604
Chen, G., Li, X., Liu, X., Chen, Y., Liang, X., Leng, J., et al. (2020). Global projections of future urban land expansion under shared socioeconomic pathways. Nat. Commun. 11, 537. doi:10.1038/s41467-020-14386-x
Chuai, X., Huang, X., Lu, Q., Zhang, M., Zhao, R., and Lu, J. (2015a). Spatiotemporal changes of built-up land expansion and carbon emissions caused by the Chinese construction industry. Environ. Sci. Technol. 49 (21), 13021–13030. doi:10.1021/acs.est.5b01732
Chuai, X., Huang, X., Wang, W., Zhao, R., Zhang, M., and Wu, C. (2015b). Land use, total carbon emissions change and low carbon land management in Coastal Jiangsu, China. Journal of Cleaner Production 103, 77–86. doi:10.1016/j.jclepro.2014.03.046
Chuai, X., Huang, X., Qi, X., Li, J., Zuo, T., Lu, Q., et al. (2016). A preliminary study of the carbon emissions reduction effects of land use control. Sci. Rep. 6, 36901–36908. doi:10.1038/srep36901
Cui, Y., Li, L., Chen, L., Zhang, Y., Cheng, L., Zhou, X., et al. (2018). Land-use carbon emissions estimation for the Yangtze River Delta urban agglomeration using 1994–2016 Landsat image data. Remote Sensing 10 (9), 1334. doi:10.3390/rs10091334
Durmusoglu, Z. O., and Akın Tanrıöver, A. (2017). Modelling land use/cover change in Lake Mogan and surroundings using CA-Markov chain Analysis. J. Environ. Biol. 38, 981–989. doi:10.22438/jeb/38/5(si)/gm-15
Friedlingstein, P., O'sullivan, M., Jones, M. W., Andrew, R. M., Hauck, J., Olsen, A., et al. (2020). Global carbon budget 2020. Earth Syst. Sci. Data 12, 3269–3340. doi:10.5194/essd-12-3269-2020
Houghton, R. A., House, J. I., Pongratz, J., van der Werf, G. R., DeFries, R. S., Hansen, M. C., et al. (2012). Carbon emissions from land use and land-cover change. Biogeosciences 9, 5125–5142. doi:10.5194/bg-9-5125-2012
Hutyra, L. R., Yoon, B., Hepinstall-Cymerman, J., and Alberti, M. (2011). Carbon consequences of land cover change and expansion of urban lands: A case study in the seattle metropolitan region. Landscape and Urban Planning 103, 83–93. doi:10.1016/j.landurbplan.2011.06.004
Iacono, M., Levinson, D., El-Geneidy, A., and Wasfi, R. A. (2015). A Markov chain model of land use change. TeMA Journal of Land Use, Mobility and Environment 8 (3), 263–276. doi:10.6092/1970-9870/2985
Lai, L. (2010). Carbon emission effect of land use in China. Nanjing: Nanjing University. (in Chinese).
Lai, L., Huang, X., Yang, H., Chuai, X., Zhang, M., Zhong, T., et al. (2016). Carbon emissions from land-use change and management in China between 1990 and 2010. Sci. Adv. 2, e1601063. doi:10.1126/sciadv.1601063
Leite, C. C., Costa, M. H., Soares-Filho, B. S., and de Barros Viana Hissa, L. (2012). Historical land use change and associated carbon emissions in Brazil from 1940 to 1995. Global Biogeochem. Cycles 26 (2), 4133. doi:10.1029/2011gb004133
Li, X., Chen, Y., Liu, X., Li, D., and He, J. (2011). Concepts, methodologies, and tools of an integrated geographical simulation and optimization system. International Journal of Geographical Information Science 25 (4), 633–655. doi:10.1080/13658816.2010.496370
Li, X., Chen, G., Liu, X., Liang, X., Wang, S., Chen, Y., et al. (2017). A new global land-use and land-cover change product at a 1-km resolution for 2010 to 2100 based on human–environment interactions. Annals of the American Association of Geographers 107 (5), 1040–1059. doi:10.1080/24694452.2017.1303357
Li, J., Gong, J., Guldmann, J.-M., Li, S., and Zhu, J. (2020). Carbon dynamics in the northeastern qinghai–Tibetan plateau from 1990 to 2030 using Landsat land use/cover change data. Remote Sensing 12 (3), 528. doi:10.3390/rs12030528
Li, X., and Yeh, A. G.-O. (2000). Modelling sustainable urban development by the integration of constrained cellular automata and GIS. International journal of geographical information science 14, 131–152. doi:10.1080/136588100240886
Liang, X., Liu, X., Li, X., Chen, Y., Tian, H., and Yao, Y. (2018a). Delineating multi-scenario urban growth boundaries with a CA-based FLUS model and morphological method. Landscape and Urban Planning 177, 47–63. doi:10.1016/j.landurbplan.2018.04.016
Liang, X., Liu, X., Li, D., Zhao, H., and Chen, G. (2018b). Urban growth simulation by incorporating planning policies into a CA-based future land-use simulation model. International Journal of Geographical Information Science 32 (11), 2294–2316. doi:10.1080/13658816.2018.1502441
Liang, X., Guan, Q., Clarke, K. C., Chen, G., Guo, S., and Yao, Y. (2021). Mixed-cell cellular automata: A new approach for simulating the spatio-temporal dynamics of mixed land use structures. Landscape and Urban Planning 205, 103960. doi:10.1016/j.landurbplan.2020.103960
Liao, W., Liu, X., Xu, X., Chen, G., Liang, X., Zhang, H., et al. (2020). Projections of land use changes under the plant functional type classification in different SSP-RCP scenarios in China. Science Bulletin 65 (22), 1935–1947. doi:10.1016/j.scib.2020.07.014
Liu, X., Li, X., Yeh, A. G.-O., He, J., and Tao, J. (2007). Discovery of transition rules for geographical cellular automata by using ant colony optimization. Science in China Series D Earth Sciences 50, 1578–1588. doi:10.1007/s11430-007-0083-z
Liu, X., Liang, X., Li, X., Xu, X., Ou, J., Chen, Y., et al. (2017). A future land use simulation model (FLUS) for simulating multiple land use scenarios by coupling human and natural effects. Landscape and Urban Planning 168, 94–116. doi:10.1016/j.landurbplan.2017.09.019
Liu, X., Hu, G., Ai, B., Li, X., Tian, G., Chen, Y., et al. (2018). Simulating urban dynamics in China using a gradient cellular automata model based on S-shaped curve evolution characteristics. International Journal of Geographical Information Science 32 (1), 73–101. doi:10.1080/13658816.2017.1376065
Mirbagheri, B., and Alimohammadi, A. (2017). Improving urban cellular automata performance by integrating global and geographically weighted logistic regression models. Transactions in GIS 21 (6), 1280–1297. doi:10.1111/tgis.12278
Morshed, S. R., Fattah, M. A., Haque, M. N., and Morshed, S. Y. (2022). Future ecosystem service value modeling with land cover dynamics by using machine learning based Artificial Neural Network model for Jashore city, Bangladesh. Physics and Chemistry of the Earth, Parts a/b/c 126, 103021. doi:10.1016/j.pce.2021.103021
Oliveira Barros, K., Ribeiro, C. A. A. S., Marcatti, G. E., Lorenzon, A. S., Martins de Castro, N. L., Domingues, G. F., et al. (2018). Markov chains and cellular automata to predict environments subject to desertification. Journal of Environmental Management 225, 160–167. doi:10.1016/j.jenvman.2018.07.064
Park, C. E., Jeong, S. J., Joshi, M., Osborn, T. J., Ho, C. H., Piao, S., et al. (2018). Keeping global warming within 1.5° C constrains emergence of aridification. Nat. Clim. Chang. 8 (1), 70–74. doi:10.1038/s41558-017-0034-4
Pijanowski, B. C., Alexandridis, K. T., and Mueller, D. (2006). Modelling urbanization patterns in two diverse regions of the world. Journal of Land Use Science 1 (2-4), 83–108. doi:10.1080/17474230601058310
Schaldach, R., Alcamo, J., Koch, J., Kolking, C., Lapola, D. M., Schungel, J., et al. (2011). An integrated approach to modelling land-use change on continental and global scales. Environmental Modelling & Software 26 (8), 1041–1051. doi:10.1016/j.envsoft.2011.02.013
Tigchelaar, M., Battisti, D. S., Naylor, R. L., and Ray, D. K. (2018). Future warming increases probability of globally synchronized maize production shocks. Proc. Natl. Acad. Sci. U. S. A. 115 (26), 6644–6649. doi:10.1073/pnas.1718031115
Verburg, P. H., Soepboer, W., Veldkamp, A., Limpiada, R., Espaldon, V., and Mastura, S. S. (2002). Modeling the spatial dynamics of regional land use: The CLUE-S model. Environmental management 30 (3), 391–405. doi:10.1007/s00267-002-2630-x
Wang, G., Han, Q., and de vries, B. (2021). The multi-objective spatial optimization of urban land use based on low-carbon city planning. Ecological Indicators 125, 107540. doi:10.1016/j.ecolind.2021.107540
Watson, R. T., Noble, I. R., Bolin, B., Ravindranath, N., Verardo, D. J., and Dokken, D. J. (2000). Land use, land-use change and forestry: A special report of the intergovernmental panel on climate change. Cambridge University Press.
Xiao, N., Bennett, D. A., and Armstrong, M. P. (2007). Interactive evolutionary approaches to multiobjective spatial decision making: A synthetic review. Computers, Environment and Urban Systems 31 (3), 232–252. doi:10.1016/j.compenvurbsys.2006.08.001
Zhang, Y., Li, X., Liu, X., and Qiao, J. (2015). Self-modifying CA model using dual ensemble Kalman filter for simulating urban land-use changes. International Journal of Geographical Information Science 29, 1612–1631. doi:10.1080/13658816.2015.1037305
Zhang, D., Liu, X., Lin, Z., Zhang, X., and Zhang, H. (2020a). The delineation of urban growth boundaries in complex ecological environment areas by using cellular automata and a dual-environmental evaluation. Journal of Cleaner Production 256, 120361. doi:10.1016/j.jclepro.2020.120361
Zhang, X. R., Li, A. N., Nan, X., Lei, G. B., and Wang, C. B. (2020b). Multi-scenario simulation of land use change along China-Pakistan Economic Corridor through coupling FLUS model with SD model. Journal of Geo-information Science. (in Chinese)22 (12), 2393–2409. doi:10.12082/dqxxkx.2020.190618
Zhang, J. D., Mei, Z. X., Lv, J. H., and Chen, J. Z. (2022). Simulating multiple land use scenarios based on the FLUS model considering spatial autocorrelation. Journal of Geo-information Science (in Chinese) 22 (3), 531–542. doi:10.12082/dqxxkx.2020.190359
Zhao, R. Q., Huang, X. J., Zhong, T. Y., and Chuai, X. W. (2013). Carbon effect evaluation and low-carbon optimization of regional land use. Transactions of the Chinese Society of Agricultural Engineering (in Chinese) 29 (17), 220–229. doi:10.3969/j.issn.1002-6819.2013.17.029
Keywords: carbon emissions, land use change, FLUS model, multi-objective optimization model, Markov model
Citation: Dong H, Huang Q, Zhang F, Lu X, Zhang Q, Cao J, Gen L and Li N (2022) Path of carbon emission reduction through land use pattern optimization under future scenario of multi-objective coordination. Front. Environ. Sci. 10:1065140. doi: 10.3389/fenvs.2022.1065140
Received: 09 October 2022; Accepted: 31 October 2022;
Published: 18 November 2022.
Edited by:
Xiaowei Chuai, Nanjing University, ChinaReviewed by:
Mingzhu He, Peking University, ChinaCopyright © 2022 Dong, Huang, Zhang, Lu, Zhang, Cao, Gen and Li. This is an open-access article distributed under the terms of the Creative Commons Attribution License (CC BY). The use, distribution or reproduction in other forums is permitted, provided the original author(s) and the copyright owner(s) are credited and that the original publication in this journal is cited, in accordance with accepted academic practice. No use, distribution or reproduction is permitted which does not comply with these terms.
*Correspondence: Qing Huang, aHVhbmdxaW5nQG5qeHpjLmVkdS5jbg==
†These authors have contributed equally to this work
Disclaimer: All claims expressed in this article are solely those of the authors and do not necessarily represent those of their affiliated organizations, or those of the publisher, the editors and the reviewers. Any product that may be evaluated in this article or claim that may be made by its manufacturer is not guaranteed or endorsed by the publisher.
Research integrity at Frontiers
Learn more about the work of our research integrity team to safeguard the quality of each article we publish.