 Sabine Fritz
 Sebastian Aust2
 Tobias Sauter
- 1Geography Department, Humboldt-Universität zu Berlin, Berlin, Germany
- 2Flughafen Berlin Brandenburg GmbH, Berlin, Germany
Airports contribute substantially to ultrafine particle (UFP; <100 nm) concentrations on a local scale. These UFPs, which derive mainly from combustion processes, are generated during take-off and landing of aircraft, during aircraft movements on the tarmac, when engines and turbines are started, and by vehicles transporting goods and people on the airfield. UFPs are considered particularly harmful to human health as their small size enables them to pass far into the human body. This study investigates the extent to which particle number concentrations (PNCs) sized 7–2,000 nm respond to the cessation of air traffic due to the closure of a major airport. PNCs and wind data were monitored with a 5 s resolution at one location on the airfield of Berlin-Tegel Airport (TXL). The station was located 600 –640 m east of the runways and thus downwind of the runways for the predominant wind direction. Observations took place 24 h per day every day for about 3 weeks before and 3 weeks after the closure of the airport. During the measurement campaign, a total of 2,507 take-offs and landings took place. Including all wind directions, this study shows 30 %–40% lower PNCs on average, 2.5-fold lower maximum values as well as a 3-fold lower PNC spread after the closure of the airport. These differences are evident only during the day with active flight operations, and not during the nighttime flight ban. Downwind of the airfield, differences are even higher. After the closure of the airport, average PNCs drop by 70%, maxima by 85%, and variability is reduced by almost 90%. 70% lower and 30% less frequent PNC peaks occur downwind of the airport after flight operations are discontinued. This unique natural experiment allows for relatively clear conclusions about the relevance of airport operations on PNCs in the airfield area. The measurements carried out before and after the closure allow a direct comparison of the PNCs during airport operations and without any. Thus, our study reveals the change in UFP concentration that can be achieved through a reduction in flight operations.
Introduction
Airports are key for our globalised world—they connect people, economies, and countries and promote cultural, political and knowledge exchange. Despite the added social value, there are justified concerns about aviation in the context of anthropogenic climate change and local air pollution (Grobler et al., 2019; Riley et al., 2021; IPCC, 2022). For several years, scientists and citizens have been concerned with the dispersion of ultrafine particles (UFPs) in the vicinity of airports and the associated health risks for local residents and employees (He et al., 2020; Lammers et al., 2020; Bendtsen et al., 2021). Ultrafine particles are associated with negative effects on both mortality and morbidity (HEI, 2013; Ohlwein et al., 2019; WHO, 2021). Most airport-related studies investigate the exposure of airport employees engaged in ground-based operations on the airfield (Targino et al., 2017; Marcias et al., 2019; Lecca et al., 2021) and the dispersion of UFPs into the surroundings (Keuken et al., 2015; Hudda et al., 2018; Riley et al., 2021). The results show an effect of airports on the particle number concentration (PNC) in their vicinity (Fritz et al., 2022; Hudda et al., 2022). Specifically, PNC depends on the number of flight operations, background concentrations, and the prevailing wind direction. Additional emitters such as road traffic also contribute to airborne particle number concentrations in the surrounding area (Masiol et al., 2017; Fritz et al., 2021; Tremper et al., 2022). On the airfield itself, ground-based operations, taxiing as well as landing and take-off operations (LTO) contribute to UFP emissions (Hsu et al., 2012; Keuken et al., 2015; Lorentz et al., 2021). Starting or landing aircraft cause short but very high concentration peaks (Stacey et al., 2021; Hudda et al., 2022).
In 2020, the largest airport in Germany’s capital, Berlin-Tegel Airport (TXL), was relocated from the north of the city 26 km to the south. This provided a unique opportunity to measure PNCs on the airfield of TXL before and after it was closed. Due to the COVID-19 pandemic conditions, flight operations did not take place at full capacity even before the relocation. The number of flights dropped to about 25 %–30% of the usual amount of air traffic in autumn. On the one hand, this allowed our study an in-depth analysis of individual flight impacts. On the other hand, this implies that the PNC values do not represent situations with regular flight activities at TXL.
This study analyses the impact of the closure of TXL on PNCs on the airfield. PNC was measured at a fixed location on the airfield 3 weeks before and 3 weeks after the closure of the airport. As a first step, we compare average, minimum, and maximum PNCs as well as their standard deviation before and after the closure of TXL, including variations of PNCs with different wind directions. Secondly, we contrast changes of PNCs due to the cessation of flight operations with wind from either the direction of the airfield or the nearby road network. We expect road traffic to be the second major emitter of UFPs in the immediate vicinity of the monitoring station and contrast its contribution with that of the airport. Finally, we examine changes in the number and duration of short-term PNC peaks as well as their average and maximum PNCs.
Methods
Study site
This study took place on the TXL airfield at the time of the airport closure in autumn 2020. Due to the COVID-19 pandemic, in 2020 only about 25% of passengers and 60% of cargo was handled in comparison to activities in 2019 (FBB, 2021). This corresponded to about 57,536 commercial flights at TXL in the year of the study (FBB, 2021). Observations were carried out in the east of TXL between 20 October 2020 14:44 LT and 3 December 2020 03:03 LT. TXL was closed on 8 November with the last flight starting at about 15:00 (FBB, 2021). The centre of TXL is at 13.29° E and 52.56° N. There are two east-west orientated runways about 260 m apart from each other (Figure 1). In the eastern half of the airfield, a motorway carrying 40,000 vehicles per day runs in a north-south direction (Senate Department for Urban Development and the Environment Berlin, 2017). As shown in Figure 1 (green rectangle), the motorway passes through a tunnel (850 m long) that runs under the eastern part of the airfield. North-east of the airfield there are several roads including the motorway access road.
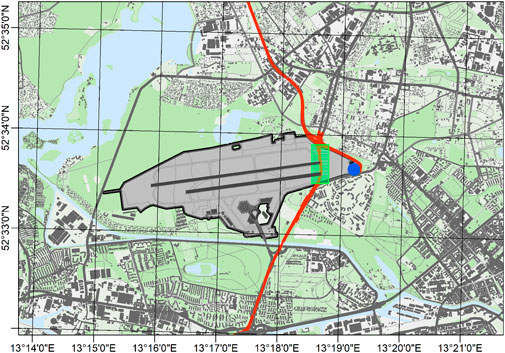
FIGURE 1. Study site: The monitoring site was located east of the runways (blue dot) of Berlin-Tegel Airport (grey area). The motorway (A111; red line) that crosses the airfield from north to south in the east of the runways leads underground through a tunnel (area of the green rectangle). Data basis: Environmental Atlas Berlin.
We recorded PNCs and meteorological parameters east of the southern runway (Figure 1), 2.2 km from the centre of the airport, 600 m from the easternmost part of the southern and 640 m from the easternmost part of the northern runway.
Data sets
We recorded PNCs with a butanol-based Grimm EDM465 UFPC condensation particle counter (CPC). The device included the pre-installed 1 m sampling pipe coated with a nafion membrane for isothermal humidity extraction and a 2 µm precipitator at the sampling head (GRIMM, 2013). We measured the meteorological variables with a Lufft WS600-UMB weather monitor. Both monitors collected measurements every 5 s (response time of CPC). The manufacturer of the CPC specifies the particle size in a range between 7 nm (with a 50% counting efficiency) and 2,000 nm. PNCs of up to 150,000 # cm−3 are provided in a single count mode, larger concentrations up to 107 # cm−3 in photometric mode with an accuracy of 5% or 10% respectively. The air inlet was at 1.5 m above the ground. The weather sensor recorded wind direction with an uncertainty of <3° for wind speeds of >1.0 m s−1 and wind speed with ±0.3 ms−1 or ±3% at the height of the CPC at 1.3 m above the ground.
Flight data was provided by Flughafen Berlin Brandenburg GmbH. It includes the actual time of arrival or departure, the time of arrival at or departure from the parking position, whether the aircraft was arriving or departing, the runway used, and whether the aircraft took off or landed towards the east or west. We classified the time of aircraft movement between parking position and runway as taxiing time. Data on aircraft movements were included from 20.10.2020 14:00:00, 45 min prior to the start of the PNC observations. This includes 2,507 flights in total with 1,261 departures and 1,246 landings. Both runways had about the same load with 1,244 aircraft on the northern runway and 1,263 flights on the southern one. 96% of the flights departed to the west or landed from the east of the airfield. Out of those aircraft, starting planes accelerated their engines about 700 m from the monitoring site while landing aircraft passed right over the site. Due to a night flight restriction, only night mail flights were allowed between 23:00 and 6:00 as well as delayed take-offs and landings until midnight. Within the observation period, 23 out of 2,507 flights took place during this restricted time window.
Data quality and processing
The CPC is calibrated on a yearly basis by the manufacturer and was additionally compared against a reference device in the 2 weeks prior to the measurement campaign. We checked and maintained the CPC bi-weekly during the campaign. Due to the time change, we deleted the data between 2:00 and 3:00 daylight saving time. Due to hardware issues, we rejected data between 15.11.2020 02:15:00 and 18.11.2020 11:14:55. We set wind direction data at times with the wind speed exactly zero to a missing value.
To contrast changes before and after the closure of TXL, we differentiate between day and night. We defined hours between 6:00 and 23:00 as “day,” since those were the hours with active flight activities during airport operations. We refer to times between 23:00 and 6:00 as “night,” since these were the hours with night time flight restrictions.
For hypothesis test statistics, we use *** for highly significant p-values of
For the comparison of situations with the monitoring site being downwind of either the airport or the roads, we define the lee as the sector ±45° of the wind direction. We did not see any significant differences in PNCs for different sized wind sectors–i.e., ±10°, ±20°, and ±45°. We chose the ±45° sector in accordance with Keuken et al. (2012). Thus, we consider the CPC downwind of the airport for wind directions 215◦–305° and downwind of the motorway access road for wind directions 0◦–90°.
For the PNC peak analysis, we first calculate local maxima within a 5 min time span. Then, we define daily outliers according to the definition of Tukey (1977) as
with Q3 being the 75 percentile, Q1 the 25 percentile, and (Q3 − Q1) the interquartile range (IQR). We then combine successive outliers of at least two observations into one group of outliers. When outlier groups coincide with local maxima, we consider them PNC peaks. The calculated number of peaks is standardised by the length of the measurement period. We recorded 316,381 5-s observations before and 388,772 after the closure of TXL. Thus, we adjusted the number of peaks before the closure of TXL by a factor of 1.22881. Peak length [s] is calculated as the duration of consecutive PNCs classified as both local maximum and outliers before observations dropped below peak levels again.
Results
Comparison of particle number concentrations before and after the closure of TXL
Mean PNCs during the day are significantly lower after the closure of the airport than before (Table 1). As expected, the decline is more pronounced in the mean (41%) than in the median (29%). During times of night flight restrictions, however, there is no clear decrease in PNCs.
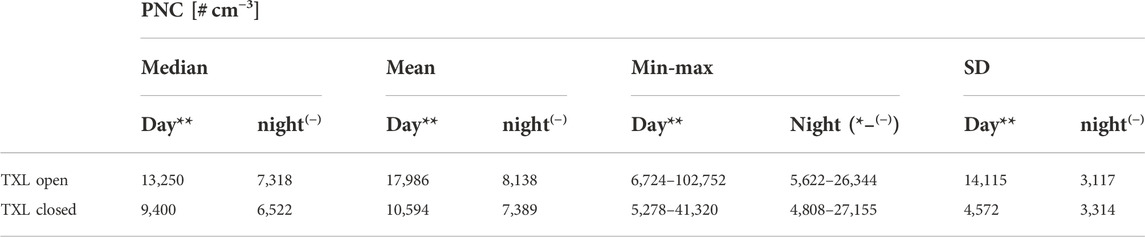
TABLE 1. Means of hourly PNCs (day/night) for the times before and after the closure of TXL. Nighttime flight restrictions occurred between 23:00 and 06:00. Asterisks show p-values for unequal variances t-tests of PNCs before and after the closure of TXL (p-value
Short-term PNC maxima of more than 100,000 # cm−3 are frequent during daytime before the airport closed (Figure 2). Yet, these peaks cannot be identified on all measurement days. After the closure, peaks are both of a lower magnitude and frequency. During active flight operations, maxima are 2.5-fold higher and the standard deviation (SD) 3-fold larger than after the closure (Table 1).

FIGURE 2. PNC observations for the periods before and after the closure of TXL.
The most common wind direction during the 6-week study period was southwest (Figure 3), which also has the highest wind speeds. Mean wind speeds before (1.5 ms−1) and after the closure of TXL (1.3 ms−1) are quite similar. Average wind speeds of less than 1.5 ms−1 are likely due to the low height of the anemometer (1.3 m). The wind roses show differences in the measurement frequency of the wind directions for the two periods that are relevant for further analyses. We consider these frequency differences by either normalising the wind direction segments or by visualising or stating the different sample sizes in the figures.
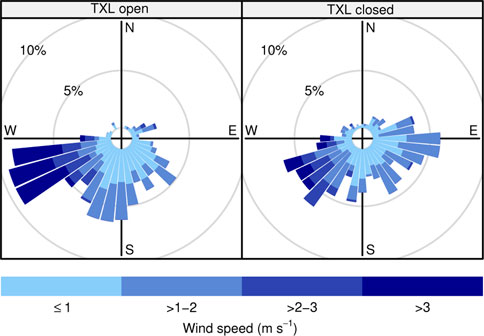
FIGURE 3. Wind roses for the PNC observation periods before and after the closure of TXL. Roses are calculated with wind direction angles of 10°.
Pollution roses for the periods before and after the closure of TXL show only slight differences in the average and minimum PNC; however during winds from the airfield (i.e., from the west) the mean concentrations decrease (Figure 4). The maximum and the spread of PNCs are substantially lower after the closure of the airport for wind directions from the airport. In general, maximum concentrations of more than 100,000 # cm−3 are less frequent after the cessation of air traffic. When such maxima do occur, they are associated with westerly or southwesterly winds. Because north winds rarely occurred, we cannot draw reliable conclusions about changes due to the airport closure for this wind direction.
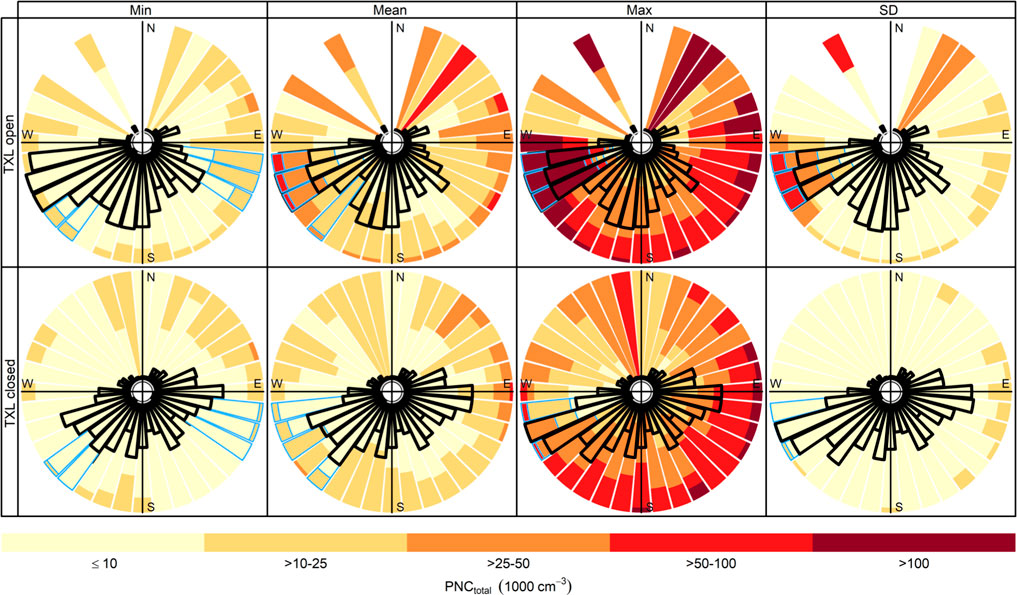
FIGURE 4. Pollutant roses before and after TXL closed. The colour scale shows observed hourly PNCs normalised per wind direction to account for their different frequency of occurrence. The black outline shows the frequency of the observed wind direction during the periods. The blue outline and separation lines highlight angles with highly significant changes of PNC (p-value
Impact of airfield and motorway access road
To separate the effects of road traffic from those of airport operations, we contrasted PNCs for winds both from the direction of the airport and the motorway with winds from any other direction. We excluded data during the times of flight restrictions of 23:00 until 6:00.
For wind from the direction of the airfield (Figure 5, left, Supplementary Table S1), all statistical measures show a significant reduction of PNC after the closure of the airport (mean, max, SD: ***; min: **). While minimum PNCs drop only slightly by 21% on average, mean PNCs decrease by 68%, maximum PNCs by 85% and the spread in PNC by 89%. For wind from all other wind directions, only the minimum (***) and mean (**) PNCs decrease significantly, but by a smaller degree of 24% and 17% respectively. The maximum PNC and the standard deviation do not change significantly for wind from directions other than the airport.
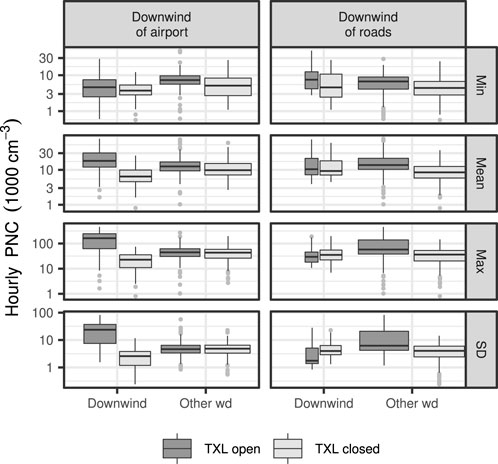
FIGURE 5. PNC before and after the closure of TXL. Comparison of PNCs in the lee of the runways (wind directions 215◦–305°) and roads (wind directions 0◦–90°) and those with wind from other directions. Only data included for the times between 6:00 and 23:00. Box widths are proportional to the square-roots of the number of observations in the groups.
With the CPC downwind of the motorway access road and road network, none of the statistical measures shows relevant changes in PNCs in comparison before and after the cessation of flight operations (Figure 5, right). However, when excluding the downwind sector of the roads from the analysis, all statistical measures have higher PNCs before the closure than afterwards (p-values
Changes in peak concentrations
One of the most obvious changes due to the closure of TXL are the differences in the number, magnitude and length of PNC peaks (Figure 6, Supplementary Table S2). Their number decreases from 1,149 to 1,029 with wind from the airfield, which corresponds to a decrease of 30%*** when normalised to the different length of the measurement period before and after closure. Their mean peak length decreases from 58 s to 22 s***. Average PNCs of peaks decrease by almost 70%*** and the maximum values drop by 70%***.
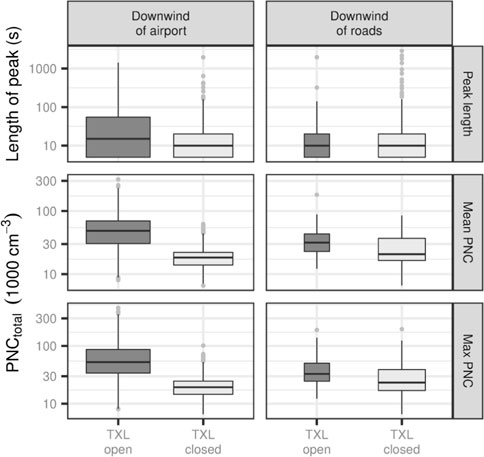
FIGURE 6. Peaks length as well as average and maximum PNC of peaks before and after the closure of TXL. Comparison of concentrations downwind of the airfield (left) and roads (right). Box widths are proportional to the square-roots of the number of observations in the groups.
With wind from the direction of the motorway access road and road network, the number of peaks increases 2.8-fold*** after the cessation of flight operations with no significant change in their lengths (Figure 6, Supplementary Table S2). The average PNC peaks decrease by 30%*** and the maximum peak concentrations by 25%***. With the closure of the airport, the impact of the roads on PNC becomes more pronounced, as the effect is no longer masked by the much higher peaks caused by flight operations. Although road traffic also causes particularly high PNCs for short periods, the peaks are generally much lower than those caused by air traffic.
Discussion
This study is unique in that we were able to monitor both immediately before and immediately after the closure of a major airport and thus assess its impact on PNCs. To classify the effect of the airport, we tested three hypotheses:
• Changes in PNC after the closure of TXL were only expected at times with active flight operations (6:00–23:00). No noticeable changes should occur at the time of night flight restrictions.
• Significant changes in PNC should be visible with wind from the direction of the airfield, but not with wind from the direction of other UFP sources such as road traffic.
• Furthermore, after the closure of TXL, extreme PNC peaks typical for air traffic should occur less frequently and maxima from the direction of the roads should increase in relevance.
We were able to confirm these hypotheses on the basis of our measurement data.Our study shows an average PNC decline of 30 %–40% between 6:00 and 23:00 after the closure of Berlin-Tegel Airport independent of wind direction. Our results are comparable to Masiol et al. (2017), who calculated a 30% contribution of London Heathrow (LHR) airport to total PNC in the vicinity. The observed contribution of the airport to total PNC is higher at LHR and TXL than for London Gatwick Airport (17%) (Tremper et al., 2022) or Venice airport (20%) (Masiol et al., 2016).
With wind from the direction of TXL, we found a mean PNC drop by about 70% after flight operations ended. This corresponds well with e.g., a 77% increase of PNC downwind from Amsterdam Airport Schiphol, shown by Keuken et al. (2015). However, Keuken et al. (2015) report a 3-fold higher PNC 7 km and 20% elevated PNC at 40 km from Amsterdam Airport Schiphol. Hudda et al. (2018) show a 1.7-fold increase of PNC in the lee of Logan International Airport at 4–6 km distance and Hudda et al. (2014) a 4- to 5-fold increase at 8 –10 km distance. The size of the airport, the associated number of flights, and the size and engines of the aircraft all cause variation in PNC emissions (i.e., Hsu et al., 2012; Stacey et al., 2021). Also, the distance of the measuring points to the airport, the size of the included downwind sector and the associated background or chosen reference concentration affect the percentage of PNCs attributed to the airport in absolute PNCs (i.e., Fritz et al., 2022; Hsu et al., 2012). Hudda et al. (2022) contrasted changes in PNC due to a 225 m shortening of the runway at Santa Monica Airport (CA; United States). They observed a 70% reduction of PNCs after the modification, which they attribute to the reduction in air traffic, the change in fleet composition and the longer distance to the measurement station. This shows the difficulty of attributing a change in PNC to just one changing parameter. As a result of the runway shortening, the contribution of the airport on PNC in the vicinity of the airfield can no longer be distinguished from other sources (Hudda et al., 2022).
By comparing the PNCs before and after the closure of the airport and by analysing wind direction-dependent PNCs, we were able to assess the impact of the airport on air quality. Our measurements during the closure of the airport allowed for a direct attribution of changes in PNCs to flight operations. In contrast, during the ongoing operation of an airport, it is possible, for example, to assign particles or emissions to an airport by including different particle sizes (Masiol et al., 2016; Psanis et al., 2017), other air quality parameters like black carbon (Keuken et al., 2012; Austin et al., 2021) or chemical analyses of the collected particles (Ungeheuer et al., 2021). The impact of an airport on PNCs can furthermore be contrasted from other UFP sources statistically, by including regression analyses (i.e., Hsu et al., 2012; Fritz et al., 2022), k-means clustering or positive matrix factorisation (PMF) (Masiol et al., 2017; Tremper et al., 2022) and principal component analyses (Austin et al., 2021). By simultaneously analysing situations that should not be affected by the closure of the airport, we have ensured that the differences in PNCs between the times before and after the closure are not due to meteorological variations or other contributing factors. Neither the comparison of PNCs during night times from 23:00 to 6:00 nor PNCs from the direction of the motorway access road show significant changes in concentrations before and after the cessation of flight operations.
However, road traffic takes over the role of the dominant PNC source in the vicinity of the airfield after flight operations stop. After the relocation of TXL, wind from the direction of the motorway is associated with a one-third increase in mean PNC during the day (6:00 to 23:00) in comparison to PNCs with wind from other directions. This does not mean, however, that road traffic increases. Its impact is now statistically increased as the extreme outliers caused by air traffic are absent and the arithmetic mean decreases accordingly. Consequently, the relative importance of road traffic as a UFP source is increasing.
High peaks caused by airport operation, especially LTO activities, have also been detected by Psanis et al. (2017); Westerdahl et al. (2008); Zhu et al. (2011). Studies like Stacey et al. (2021) and Hudda et al. (2022) associate individual aircraft movements with temporary peaks of several times the background concentration. Similarly, we frequently recorded peaks of more than 100,000 # cm−3 during times of active flight operations. Concentration peaks with wind from the airport were twice as high than those in the lee of the motorway. After the closure of TXL, outliers were still recorded, however, maxima with wind from the direction of the airfield (22,000 # cm−3 on average) were even lower than those from the direction of the motorway (29,000 # cm−3). Thus, the closure of the airport is not only reflected in a general decrease of PNCs, but also in the reduction of short-term extreme values. Both declines are relevant for any subsequent exposure assessments of people in the surrounding area.
In this study, we focus on the change in PNCs in the east of the airfield before and after the closure of the airport to determine the impact of air traffic on both temporally very short and constant UFP concentrations. Due to the location of the measurements, we cannot draw conclusions about the exposure of either airport personnel and travellers or the resident population. UFPs are spatially highly variable due to transformation processes such as nucleation, coagulation and condensation of particles as well as dispersion processes and mixing of air masses due to turbulence (Kumar et al., 2011; Birmili et al., 2013; Lawal et al., 2022). Further dispersion and exposure studies are needed for such an assessment. It stands to reason, though, that the exposure of residents living in the vicinity of the airport has been reduced as a result of the closure.
Summary and conclusion
In the unique opportunity of a closing major airport in Germany’s capital, this study monitored UFP concentrations on the airfield of TXL before and after its closure. During a 6-week campaign, we measured airborne PNCs to identify differences before and after the cessation of air traffic and to therefore assess the impact of airport operations on air quality.
We observe a significant decrease of PNCs after the closure of TXL. The hourly mean PNCs dropped by 41%, and the maximum concentrations from 102,800 # cm−3 to 41,300 # cm−3. We detected these differences only during the day, as these were the times when aircraft movements took place during airport operations. With wind from the airport, these changes are even more pronounced: Average PNCs dropped by 70% and maximum PNCs by 85% after the closure of the airport. We cannot find statistically significant changes for wind from the direction of the motorway. With TXL airport still active, the highest and most frequent PNC peaks were detected with wind from the airport. After the closure, peaks from the same wind directions were even a third lower than those in the lee of the motorway. Due to the absence of airport emissions after TXL closed down, the relative contribution of the motorway to the total PNC increases both continuously and in the number of short-term maximum concentrations.
Due to the restrictions on air traffic caused by the COVID-19 pandemic, the study was conducted with considerably less flights than usual. Accordingly, we cannot draw any conclusions about the extent of PNC during regular airport operations. A simple extrapolation of PNC based on the otherwise higher number of aircraft movements is not justified due to the multitude of variables that have an impact on the dispersion and transformation of aircraft emissions. However, the results of our study are a strong indicator of the impact of air traffic on UFP concentrations in the direct vicinity of the airfield. The acquired data set can be the basis for further studies, including dispersion modelling to estimate the effect of the closure on the neighbouring residential areas and thus on the exposure of the population living and working in the close by to bridge the gap to health impacts.
Data availability statement
The datasets presented in this study can be found in online repositories. The names of the repository/repositories and accession number(s) can be found below: The datasets generated for this study can be found at Zenodo [https://doi.org/10.5281/zenodo.7143369].
Author contributions
SF: Conceptualisation, methodology, formal analysis, data processing and evaluation, writing—original draft, visualisation, project administration, funding acquisition. SA: Resources, on-site device maintenance and dismantling. TS: Resources, data evaluation, supervision, writing—review and editing.
Funding
This study was supported by the German Federal Ministry of Education and Research (BMBF) under grant FKZ 01LP 1912B (Urban Climate under Change, Phase II, Module 3DO + M). The article processing charge was funded by the Deutsche Forschungsgemeinschaft (DFG, German Research Foundation)—491192747 and the Open Access Publication Fund of Humboldt-Universität zu Berlin.
Acknowledgments
The authors would like to express their gratitude to Lars Glaser of Flughafen Berlin Brandenburg GmbH, who provided the technical infrastructure on the TXL airfield for the operation of the measuring device. We acknowledge Marie Rolf of Humboldt-Universität zu Berlin for the in-depth proofreading of the manuscript. We would like to acknowledge the editor and reviewers for their contribution to the improvement of the manuscript.
Conflict of interest
SA is employed by Flughafen Berlin Brandenburg GmbH.
The remaining authors declare that the research was conducted in the absence of any commercial or financial relationships that could be construed as a potential conflict of interest.
Publisher’s note
All claims expressed in this article are solely those of the authors and do not necessarily represent those of their affiliated organizations, or those of the publisher, the editors and the reviewers. Any product that may be evaluated in this article, or claim that may be made by its manufacturer, is not guaranteed or endorsed by the publisher.
Supplementary material
The Supplementary Material for this article can be found online at: https://www.frontiersin.org/articles/10.3389/fenvs.2022.1061584/full#supplementary-material
References
Austin, E., Xiang, J., Gould, T. R., Shirai, J. H., Yun, S., Yost, M. G., et al. (2021). Distinct ultrafine particle profiles associated with aircraft and roadway traffic. Environ. Sci. Technol. 55, 2847–2858. doi:10.1021/acs.est.0c05933
Bendtsen, K. M., Bengtsen, E., Saber, A. T., and Vogel, U. (2021). A review of health effects associated with exposure to jet engine emissions in and around airports. Environ. Health 20, 10. doi:10.1186/s12940-020-00690-y
Birmili, W., Tomsche, L., Sonntag, A., Opelt, C., Weinhold, K., Nordmann, S., et al. (2013). Variability of aerosol particles in the urban atmosphere of dresden (Germany): Effects of spatial scale and particle size. metz. 22, 195–211. doi:10.1127/0941-2948/2013/0395
Fritz, S., Grusdat, F., Sharkey, R., and Schneider, C. (2022). Impact of airport operations and road traffic on the particle number concentration in the vicinity of a suburban airport. Front. Environ. Sci. 10, 887493. doi:10.3389/fenvs.2022.887493
Fritz, S., Schubert, S., and Schneider, C. (2021). Measurements of spatial variability of sub-micron particle number concentrations perpendicular to a main road in a built-up area. metz. 30, 315–331. doi:10.1127/metz/2021/1058
Grimm, (2013). Edm 465 UFPC: Ultra fine particle counter (ainring, Germany. Germany: GRIMM Aerosol Technik GmbH & Co. KG.
Grobler, C., Wolfe, P. J., Dasadhikari, K., Dedoussi, I. C., Allroggen, F., Speth, R. L., et al. (2019). Marginal climate and air quality costs of aviation emissions. Environ. Res. Lett. 14, 114031. doi:10.1088/1748-9326/ab4942
He, R.-W., Gerlofs-Nijland, M. E., Boere, J., Fokkens, P., Leseman, D., Janssen, N. A. H., et al. (2020). Comparative toxicity of ultrafine particles around a major airport in human bronchial epithelial (Calu-3) cell model at the air-liquid interface. Toxicol. vitro 68, 104950. doi:10.1016/j.tiv.2020.104950
HEI, (2013), Understanding the health effects of ambient ultrafine particles, HEI review panel on ultrafine particles. Boston, MA: Health Effects Institute. HEI Perspectives 3.
Hsu, H.-H., Adamkiewicz, G., Andres Houseman, E., Vallarino, J., Melly, S. J., Wayson, R. L., et al. (2012). The relationship between aviation activities and ultrafine particulate matter concentrations near a mid-sized airport. Atmos. Environ. 50, 328–337. doi:10.1016/j.atmosenv.2011.12.002
Hudda, N., Fruin, S., and Durant, J. L. (2022). Substantial near-field air quality improvements at a general aviation airport following a runway shortening. Environ. Sci. Technol. 56, 6988–6995. doi:10.1021/acs.est.1c06765
Hudda, N., Gould, T., Hartin, K., Larson, T. V., and Fruin, S. A. (2014). Emissions from an international airport increase particle number concentrations 4-fold at 10 km downwind. Environ. Sci. Technol. 48, 6628–6635. doi:10.1021/es5001566
Hudda, N., Simon, M. C., Zamore, W., and Durant, J. L. (2018). Aviation-related impacts on ultrafine particle number concentrations outside and inside residences near an airport. Environ. Sci. Technol. 52, 1765–1772. doi:10.1021/acs.est.7b05593
IPCC (2022). Climate change 2022: Mitigation of climate change. Contribution of Working Group III to the Sixth Assessment Report of the Intergovernmental Panel on Climate Change.
Keuken, M. P., Henzing, J. S., Zandveld, P., van den Elshout, S., and Karl, M. (2012). Dispersion of particle numbers and elemental carbon from road traffic, a harbour and an airstrip in The Netherlands. Atmos. Environ. 54, 320–327. doi:10.1016/j.atmosenv.2012.01.012
Keuken, M. P., Moerman, M., Zandveld, P., Henzing, J. S., and Hoek, G. (2015). Total and size-resolved particle number and black carbon concentrations in urban areas near Schiphol airport (The Netherlands). Atmos. Environ. 104, 132–142. doi:10.1016/j.atmosenv.2015.01.015
Kumar, P., Ketzel, M., Vardoulakis, S., Pirjola, L., and Britter, R. (2011). Dynamics and dispersion modelling of nanoparticles from road traffic in the urban atmospheric environment—A review. J. Aerosol Sci. 42, 580–603. doi:10.1016/j.jaerosci.2011.06.001
Lammers, A., Janssen, N. A. H., Boere, A. J. F., Berger, M., Longo, C., Vijverberg, S. J. H., et al. (2020). Effects of short-term exposures to ultrafine particles near an airport in healthy subjects. Environ. Int. 141, 105779. doi:10.1016/j.envint.2020.105779
Lawal, A. S., Russell, A. G., and Kaiser, J. (2022). Assessment of airport-related emissions and their impact on air quality in atlanta, ga, using cmaq and tropomi. Environ. Sci. Technol. 56, 98–108. doi:10.1021/acs.est.1c03388
Lecca, L. I., Marcias, G., Uras, M., Meloni, F., Mucci, N., Larese Filon, F., et al. (2021). Response of the cardiac autonomic control to exposure to nanoparticles and noise: A cross-sectional study of airport ground staff. Int. J. Environ. Res. Public Health 18, 2507. doi:10.3390/ijerph18052507
Lorentz, H., Schmidt, W., Hellebrandt, P., Ketzel, M., Jakobs, H., and Janicke, U. (2021). “Einfluss eines Großflughafens auf zeitliche und räumliche Verteilungen der Außenluftkonzentrationen von Ultrafeinstaub < 100 nm, um die potentielle Belastung in der Nähe zu beschreiben - unter Einbeziehung weiterer Luftschadstoffe (Ruß, Stickoxide und Feinstaub (PM2,5 und PM10). No. 14/2021,” in Texte (Dessau-Roßlau: Umweltbundesamt) (Germany: umweltbundesamt).
Marcias, G., Casula, M., Uras, M., Falqui, A., Miozzi, E., Sogne, E., et al. (2019). Occupational fine/ultrafine particles and noise exposure in aircraft personnel operating in airport taxiway. Environments 6, 35. doi:10.3390/environments6030035
Masiol, M., Harrison, R. M., Vu, T. V., and Beddows, D. C. S. (2017). Sources of sub-micrometre particles near a major international airport. Atmos. Chem. Phys. 17, 12379–12403. doi:10.5194/acp-17-12379-2017
Masiol, M., Vu, T. V., Beddows, D. C., and Harrison, R. M. (2016). Source apportionment of wide range particle size spectra and black carbon collected at the airport of venice (Italy). Atmos. Environ. 139, 56–74. doi:10.1016/j.atmosenv.2016.05.018
Ohlwein, S., Kappeler, R., Kutlar Joss, M., Künzli, N., and Hoffmann, B. (2019). Health effects of ultrafine particles: A systematic literature review update of epidemiological evidence. Int. J. Public Health 64, 547–559. doi:10.1007/s00038-019-01202-7
Psanis, C., Triantafyllou, E., Giamarelou, M., Manousakas, M., Eleftheriadis, K., and Biskos, G. (2017). Particulate matter pollution from aviation-related activity at a small airport of the Aegean Sea Insular Region. Sci. Total Environ. 596-597, 187–193. doi:10.1016/j.scitotenv.2017.04.078
Riley, K., Cook, R., Carr, E., and Manning, B. (2021). A systematic review of the impact of commercial aircraft activity on air quality near airports. City Environ. Interact. 11, 100066. doi:10.1016/j.cacint.2021.100066
Senate Department for Urban Development and the Environment Berlin (2017). Berlin environmental atlas, 07.01 traffic volumes. Berlin: SenStadtUm.
Stacey, B., Harrison, R. M., and Pope, F. D. (2021). Evaluation of aircraft emissions at London Heathrow airport. Atmos. Environ. 254, 118226. doi:10.1016/j.atmosenv.2021.118226
Targino, A. C., Lo Machado, B. F., and Krecl, P. (2017). Concentrations and personal exposure to black carbon particles at airports and on commercial flights. Transp. Res. Part D Transp. Environ. 52, 128–138. doi:10.1016/j.trd.2017.03.003
Tremper, A. H., Jephcote, C., Gulliver, J., Hibbs, L., Green, D. C., Font, A., et al. (2022). Sources of particle number concentration and noise near London Gatwick Airport. Environ. Int. 161, 107092. doi:10.1016/j.envint.2022.107092
Ungeheuer, F., van Pinxteren, D., and Vogel, A. L. (2021). Identification and source attribution of organic compounds in ultrafine particles near frankfurt international airport. Atmos. Chem. Phys. 21, 3763–3775. doi:10.5194/acp-21-3763-2021
Westerdahl, D., Fruin, S. A., Fine, P. L., and Sioutas, C. (2008). The Los Angeles International Airport as a source of ultrafine particles and other pollutants to nearby communities. Atmos. Environ. 42, 3143–3155. doi:10.1016/j.atmosenv.2007.09.006
Who, (2021). WHO global air quality guidelines: Particulate matter (PM2.5 and PM10), ozone, nitrogen dioxide, sulfur dioxide and carbon monoxide. Bonn, Germany: World Health Organization and WHO European Centre for Environment and Health.
Keywords: ultrafine particles, airport emission, air quality, particle number concentration, particle dispersion, peak concentration, impact of airport
Citation: Fritz S, Aust S and Sauter T (2022) Impact of the closure of Berlin-Tegel Airport on ultrafine particle number concentrations on the airfield. Front. Environ. Sci. 10:1061584. doi: 10.3389/fenvs.2022.1061584
Received: 04 October 2022; Accepted: 11 November 2022;
Published: 30 November 2022.
Edited by:
Rui Li, Tsinghua University, ChinaReviewed by:
Mohamed F. Yassin, Kuwait Institute for Scientific Research, KuwaitTao Wang, Fudan University, China
Manfred Neuberger, Medical University of Vienna, Austria
John Durant, Tufts University, United States
Copyright © 2022 Fritz, Aust and Sauter. This is an open-access article distributed under the terms of the Creative Commons Attribution License (CC BY). The use, distribution or reproduction in other forums is permitted, provided the original author(s) and the copyright owner(s) are credited and that the original publication in this journal is cited, in accordance with accepted academic practice. No use, distribution or reproduction is permitted which does not comply with these terms.
*Correspondence: Sabine Fritz, c2FiaW5lLmZyaXR6QGdlby5odS1iZXJsaW4uZGU=