- 1High Institute of Agronomic Science of Chott Mariem, Department of Engineering and Landscape Planning, Sousse University, Sousse, Tunisia
- 2National Agronomic Institute of Tunis, Carthage University, Mahrajène, Tunisia
- 3UMR Médiations, Sorbonne University, Paris, France
The Green and Blue Infrastructure (GBI) is a new approach for dealing with biodiversity conservation based on maintaining the ecological networks by ensuring the survival of animal and plant species. GBI is considered a new public policy to avoid the loss of biodiversity by preserving landscape connectivity and protecting natural habitats from fragmentation. Countries including the United States, Canada, the United Kingdom, Italy, Portugal, Japan, China, Brazil, and Turkey are seeking to integrate this concept into their environmental policies. This study proposed a methodology to design a GBI at a regional scale applied to the Sousse region in Tunisia. Two main approaches were used. The first was based on identifying three reference species marked by different dispersal distances. The second applied GIS spatial analysis using the buffer model to help assess the ecological connectivity. The methodology developed comprises five steps. In the first step, a forest habitat sub-frame, a semi-open habitat sub-frame, and a wetland sub-frame were determined from a detailed land-use map. Then, different biodiversity reservoirs were identified. In the third step, buffers varying between 200, 250, and 300 m depending on the dispersal distance of the reference species (Cape hare, North African Hedgehog, and Marbled Teal) were applied around the reservoirs to identify zones of potential connections between them. Next, buffers were also applied to detect fragmentation zones along road networks and built-up areas. Finally, the ecological corridors were mapped from the overlay between zones of potential connections and the fragmentation map. The result was the creation of a GBI of the Sousse region with reservoirs of biodiversity and ecological corridors connecting them. This methodological approach and the characterization of the Sousse city GBI map represent the first innovative research applied in Tunisia. This prototype can be a reference for other local or regional spaces, contributing toward realizing a national GBI and promoting sustainable projects.
Introduction
Research on ecological network design and planning approaches has promoted the development and construction of Green infrastructure around the world. Green infrastructure is defined as networks of green corridors connecting parks, nature reserves, cultural features, or historic sites (Little 1990; Fábos, 1995). Ahern (2002) reported its use for linear areas that are planned, developed, and managed for ecological, recreational, cultural, and esthetic purposes, according to the needs for sustainable development.
Initially, the concept included a very landscaped and esthetic vision; it gradually turned to a very ecologist vision and later became a tool for sustainable land use planning (Searns 1995). Historically, Green infrastructure originated with the beautification work of large cities in the 19th century (New York, Paris, and London) by landscape architects Frederick Law Olmsted (1822–1903) and Jean-Claude Nicolas Forestier (1861–1930). Their work resulted in the establishment of a network of urban green spaces that improved the living environments of inhabitants and the proper functioning of the cities.
Worldwide, many countries have applied this concept in their national strategies, including the United States (Zube 1995; Cook 2002), Canada (Hobden et al., 2004), the United Kingdom (Turner 2006), Italy (Toccolini et al., 2006), Portugal (Ribeiro 1998; Andresen et al., 2004; Pena et al., 2010), Japan (Asakawa et al., 2004), China (Chang et al., 2012), Brazil (Giordano and Riedel, 2008), Turkey (Kurdoğlu and Kurdoğlu 2010; Akpinar 2016), and Egypt (Mahmoud and El Sayed 2011).
Progressively, the blue component started appearing in the ecological network and the notion of Green and Blue infrastructure (GBI) was established. As its name implies, it comprises two components, a green component and a blue one. The green component includes natural or semi-natural areas that are important for biodiversity preservation, including all or a part of the protected areas, and the ecological corridors connecting them. The blue component includes water courses or parts of them or canals, as well as wetlands. Opdam et al. (2006) designated the term ecological network as “a set of ecosystems linked together by flows of organisms in a spatially coherent set, interacting with the landscape matrix.” However, Burel & Baudry (1999) argued that a lack of connectivity can lead to a significant decline in the biodiversity of an area. Hence, the fragmentation of territories, and subsequently of landscapes, threatens biological diversity by splitting and reducing the living spaces of species (Debray 2011). Bennett & Wit (2001) concluded that ecological networks have two main objectives: the preservation of ecosystem functionality and the protection of biodiversity from the impact of human activities while promoting sustainable development. Therefore, the GBI is structured as an ecological network, whose conceptual model is a patch-corridor-matrix composed of habitat tasks distributed over a landscape matrix and connected by ecological corridors (Jongman et al., 2004). In addition, conceptualizing such a network requires different stages, the first of which consists of setting conservation objectives; choosing target species and environments; and determining the linking sub-frames, biodiversity reservoirs, and corridors while considering the effects of anthropogenic disturbances.
Ecological networks are now developed and constructed using advanced technologies, including remote sensing (Taylor et al., 2007; Pena et al., 2010), the Geographic Information System (GIS) (Miller et al., 1998; Teng et al., 2011; Linglart et al., 2016), landscape metric analysis (Giordano and Riebel 2008; Kong et al., 2010), and least-cost path analysis (Teng et al., 2011; Tomczyk and Ewertowski 2013; Etherington 2016).
Corridors are linear areas of land, strips of land, or vegetation that differ from the surrounding landscape matrix (Forman & Godron 1986; Barett & Bohlen 1991). They are useful for the dispersal of organisms in landscapes (Inglis and Underwood 1992) as they structurally connect two habitat cores (Kindlmann and Burel 2008). Different methods are used to identify corridors by applying visual analysis (Duchesne et al., 1998) or geomatics tools such as dilatation erosion (Amsallem et al., 2010; Spaggiari et al., 2010), permeability of environments (Berthoud et al., 2004), core density (Sordello et al., 2017), and graph theory (Saura and Pascual-Hortal 2007; Dale and Fortin 2010; Godet and Clauzel 2021). Methods using geomatics processing under the GIS are considered exact science since they are based on equations and calculated indexes; moreover, these automatic treatments are applicable at any scale. However, the method of visual interpretation is sometimes difficult to apply given the scale and large area of the study regions. Therefore, the present study applied the dilation erosion method based on GIS tools.
Different ecological networks have been developed in the Mediterranean region. In Egypt, Mahmoud and El-Sayed (2011) proposed a method to maintain ecological balance and organize the urban green areas in El-Sadat city using GIS techniques. A few years later, Akpinar (2016) defined six factors to evaluate the perceptions and user preferences in urban greenways, in which Turkish people reported that urban greenways are more than a luxury and provide important health, recreational, and leisure activities. In Tunisia, Boussema et al. (2018) examined the development of green spaces through urban planning documents or specific programs to determine the role of GBI in Tunisian environmental policy. While applications focused on this concept have been adopted, a proper methodological approach for planning strategies is lacking. Therefore, the main objectives of the present study were to 1) propose a methodology for mapping GBI at a regional level and 2) strengthen local and regional connectivity.
Study area
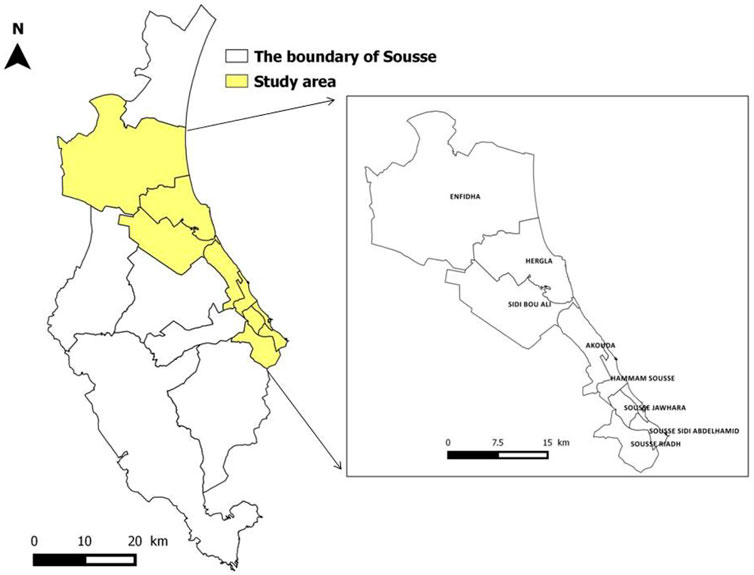
The study area was located in the Sousse governorate in the Tunisian Sahel, a coastal semi-arid region. The study area is 2308 km2 and has a population of 416 330 (INS, 2017) in nine delegations: Sousse Sidi Abdel Hamid, Sousse Riadh, Sousse Medina, Sousse Jawhara, Hammam Sousse, Akouda, Sidi BouAli, Hergla, and Enfidha (Figure 1). The area is characterized by a semi-arid climate, belonging to the lower semi-arid bioclimatic stage of the lower northern steppes. The summer period is hot and dry, while the winter period is characterized by its relatively cooler temperatures, humidity, and irregular precipitation. The annual average rainfall in this region is approximately 200 mm, and the annual average temperature is approximately 18.6°C. The Sousse region is marked by economic, environmental, ecological, and cultural importance. It also provides a diversity of landscapes, including forest, coastline, rural, urban, industrial, and natural; hence, it is rich in flora and fauna (Boussema and Khebour Allouche, 2020). This spatial delimitation was selected first due to the availability of digital information and the richness of the environments marking this area and second because it is a territorial management unit in which a GBI could be established and the decision-makers act at the level of the delegations.
Data used
Land use
The INFOTEL Database (DB) 2017 was modified after it was obtained from the National Centre for Mapping and Remote Sensing (IFPN) and a digital agriculture map of (CRDA, 2009) was used. The mapping data were exploited as part of a GIS, and specific information was extracted from each database and then crossed to obtain information on the different types of land use. The INFOTEL DB 2017 contains a series of information corresponding to the distribution and extent of forests, reforestation, vegetation type, etc. (IFPN, 2010). The DB of the agriculture map of the Sousse region produced in 2009 represents the most recent digital version available. It includes information in the form of vector layers related to data on land use and water courses, as well as data related to anthropogenic elements such as infrastructure and urbanized areas (CRDA, 2009). This information allows the identification of the main areas of forests, grasslands, wetlands, etc. The different databases used were crossed and compared to produce a complete map of the study area (Table 1).
Reference species
The approach used to identify the reference species was based on the ecological requirements of these species and their movement capacities associated with the ecological quality of the environments (Bergès et al., 2010; Fu et al., 2010). The first objective is to identify the spatial relationships between the home ranges specific to a species (Foltête et al., 2012; Bourgeois et al., 2017). For this method, species data are used for their intrinsic conservation values and a distinction is made between emblematic, heritage, remarkable, and threatened species.
Based on the International Union for Conservation of Nature's Red List of Threatened Species (IUCN, 2020) and inventories and observations from the General Directory of Forests (GDF), three representative species, Cape hare (Lepus capensis), North African hedgehog (Atelerix algirus), and marbled teal (Marmaronetta angustirostris) were selected for the forest, semi-open, and wetland habitat subframes, respectively. The Cape hare is listed by the IUCN Red List as a minor concern (Villafuerte and Delibes-Mateos 2019). However, it is threatened by urbanization, increased hunting, intensive agriculture, and increased pesticide use (Delibes-Mateos et al., 2010). Amori et al. (2008) reported that the hedgehog is listed in Appendix II of the Berne Convention and Appendix IV of the European Union Directive on Habitats and Species. Increased roadways and habitat loss are the most severe threats for this species in Tunisia. The marbled teal is suited to wetlands in semi-arid regions (Green and Silva 2000) and breeds in dry steppes areas (Green 1993). It is legally preserved in Tunisia and is inscribed on the IUCN Red List as critically endangered (Bird Life International, 2017).
Methodology
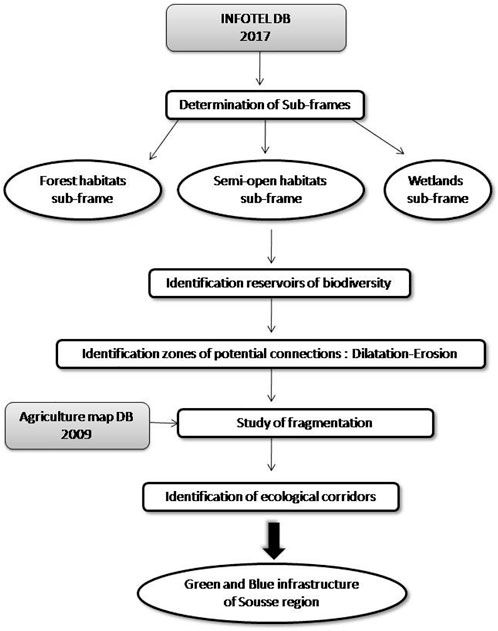
The species-based approach used in the present study allows the development of an ecological network based on the identification of reference species (Bergès et al., 2010; Foltête et al., 2012; Bourgeois et al., 2017). Therefore, the mapping of this network is based on the characteristics of these selected species (habitat, dispersal, movement, reproduction, etc.), whose dispersal distances are crucial for the determination of ecological corridors. For that, a GIS-based ecological connectivity assessment using the buffer model via the tool “variable distance buffer” was performed in a process called dilatation–erosion treatment. Figure 2 shows the flowchart of the methodology, which comprised five steps. The first step was based on the analysis of the landscape and the determination of sub-frames. The second step was the identification of biodiversity reservoirs. The third step applied the dilatation–erosion treatment to identify zones of potential connections. The fourth step performed a study of fragmentation by considering the effects of ecological disturbance. Finally, the ecological corridors were obtained and, in turn, the GBI was defined. This study used ArcGis® 10.1 and Quantum GIS® 2.2 software.
Identification of sub-frames
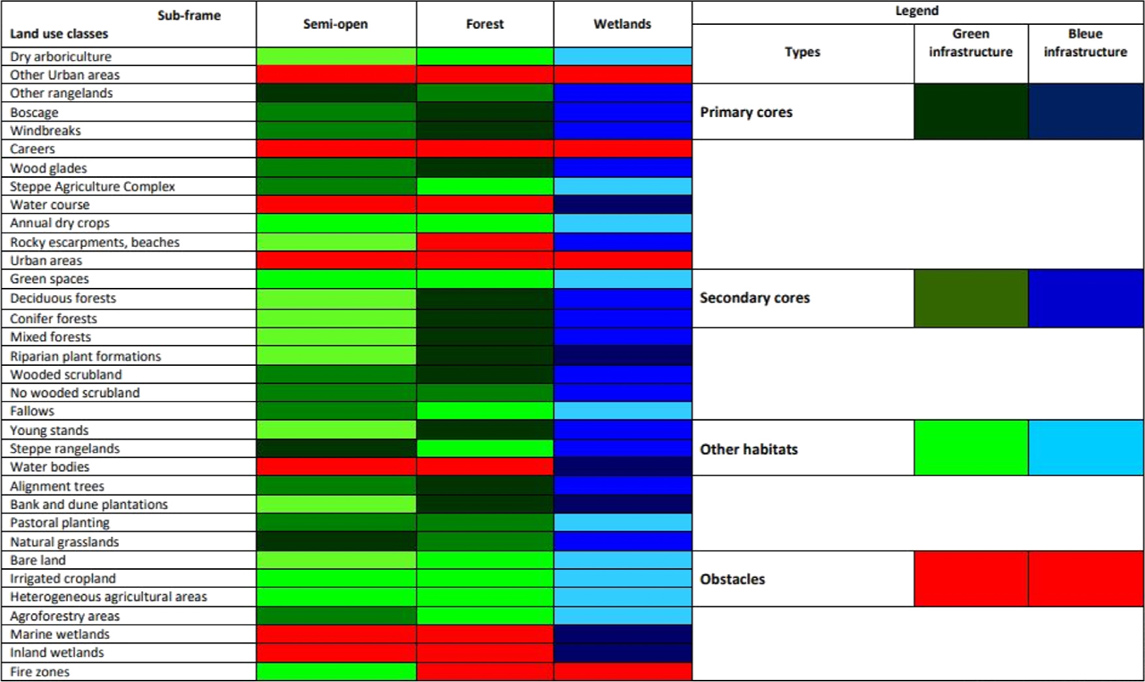
Based on the different land use classes, three sub-frames were identified: a forest habitat sub-frame, a semi-open habitat sub-frame, and a wetland sub-frame (Table 2).
Identification of biodiversity reservoirs
Reservoir identification is based on defining for each sub-frame core habitats (primary and secondary cores) and favorable areas for species movement or reproduction (other habitats), as well as unfavorable areas (obstacles) that represent barriers to species movement (Liénard and Clergeau 2011; Locquet and Clauzel 2018). These identifications were carried out in the present study in consultation with local experts on the behavior of the species in the study area to qualifying environments as more or less favorable to the local representative fauna. Table 3 shows the result of the classification of the different land use classes of the (IFPN, 2010) vector layer in terms of primary cores, secondary cores, other habitats, and obstacles. For example, the primary core was represented by natural grasslands for the semi-open habitat sub-frame; by mixed forests for the forest habitat sub-frame; and by marine wetlands for the wetland habitat sub-frame. The secondary core was represented by non-wooded scrubland for the forest habitat sub-frame, boscage for the semi-open sub-frame, and deciduous forest for the wetland sub-frame.
Identification of zones of potential connections
Principle of the method
This step involved applying the dilatation–erosion treatment to identify potential corridors for each sub-frame in two steps: dilatation followed by erosion. Dilatation is the application of a positive buffer zone around primary and secondary cores to highlight potential connections between these environments; in contrast, erosion is the application of a negative buffer zone of the same width (Amsallem et al., 2010). The buffer zone thickness considers the theoretical dispersal distance of the target species living in the sub-frame (Bernier and Théau 2013). This is the distance that a species can travel for breeding, feeding, and resting. It is the distance at which a species can move from its birthplace to settle in another site and reproduce. The application of this method makes it possible to distinguish habitats connected in the buffer zone for use by the target species, as well as unconnected habitats located outside the buffer zone and therefore not usable by the target species. The first step in this process is specifying the dispersal distance for each species according to the available information to establish the thicknesses of the buffer zones that will be applied to each sub-frame, as well as the declining natural environments.
Accuracy of the dispersal distance for each species
This distance was defined for each species and each sub-frame based on the bibliographic data and from experts. However, the dispersal distances in the literature were sometimes difficult to establish because they can be based on the vital territory of the species or adapted to the morphology of a study territory. Thus, these values were generally a compromise between the dispersion values from the literature (Table 4) and the necessary adaptations to the different types of environments in the study areas associated with each species (Table 5). Therefore, the distances were selected based on those that most closely matched the elements of local knowledge.
Based on the literature, the distances that seemed closest to the specificities of the study area were 1000 m for the hare, 400 m for the hedgehog, and 500 m for the teal. Given the local specificities and the severity of the environment in our region, we defined smaller dispersion distances than those indicated in the literature. Table 5 lists these distances.
Study of fragmentation
After identifying the two main components of an ecological network (reservoirs and corridors), it is useful to identify barriers and sources of anthropogenic pressures that may affect its functionality. The implementation of an ecological network will not necessarily achieve the conservation objectives if no mitigation measures are applied to curb the impact of the major obstacles present in the landscape (Beier et al., 2008). Generally, there are two types of obstacles: natural (large waterways, mountains, cliffs, etc.) and artificial (urbanization, linear transport infrastructure, etc.). Spaggiari et al. (2010) suggested that the conflict between ecological continuities and the elements of fragmentation makes it possible to analyze their functionality to identify breaks in continuity and to locate “conflict zones.” These areas correspond to the specific meeting points between road and rail networks that fragment the territory and the main current or required ecological continuities (Amsallem et al., 2010).
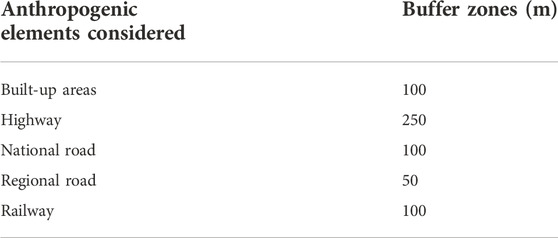
The main obstacles to the movement of species in the present study were urbanization and the terrestrial transport network. Once the sources of anthropogenic fragmentation are identified, the disruptive elements can be mapped with more or less broad buffers depending on the disturbance effect generated (Beier et al., 2008). The ecological disturbance zone is a buffer zone surrounding infrastructures that disrupt ecological continuity, beyond which species can live in safety. The width of the distances of the buffer zones was selected in this study based on the widths used within the framework of the “Ecological network of the Massif Central” (CEMAGREF 2011) and “Implementation of a GBI in the Bouches-du-Rhône” (CETE 2012) projects. Different widths were also tested to best adapt these areas of ecological disturbance to the study area. As Table 6 shows, the determined areas were 250 m around highways; 100 m in built-up areas, national roads, and railways; and 50 m for regional roads. The distance to the highways was the greatest, given the high speed of travel that kills species such as hare and hedgehog. The sections of railway present in the territory are not fully fenced and do not present significant rail traffic in the region, which leaves room for fauna to move, hence the allocation of a distance of only 100 m. These spaces have been widened, which should be taken into consideration when mapping ecological corridors.
Identification of ecological corridors
Mapping ecological networks consists of crossing the sub-frames with the obstacle layers to highlight the existing points of conflict. It is important to check the land use on the potential connection areas revealed during the erosion step and to subtract from them the zones if it is impassable by fauna. In our case, and since the study area was large, the hypothesis was that the ecological corridors would be identified as potential areas of movement at a regional scale. Finally, the combination of the three sub-frames formed the potential GBI of the Sousse region.
Results
Sub-frames in the Sousse region
Three sub-frames were identified: the forest habitat sub-frame comprised three types of forests (deciduous, conifer, and mixed) and shrub plantations such as boscage, windbreaks, wood glades, wooded scrubland, young stands, and alignment trees. The semi-open habitat sub-frame contained steppe rangelands and grasslands. The wetland sub-frame included water courses, water bodies, riparian plant formations, and marine and inland wetlands.
Reservoirs of biodiversity in the Sousse region
Biodiversity reservoirs are the main element of the ecological network and the cores of habitat characteristics for each species. Their identification was initially based on determining the existing regulatory environments for each sub-frame. Next, the primary, secondary, and other habitats favorable to the reference species were defined as described previously (Table 3).
Existing regulatory environments in the Sousse region
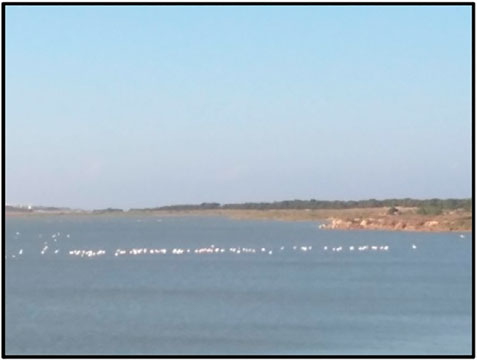
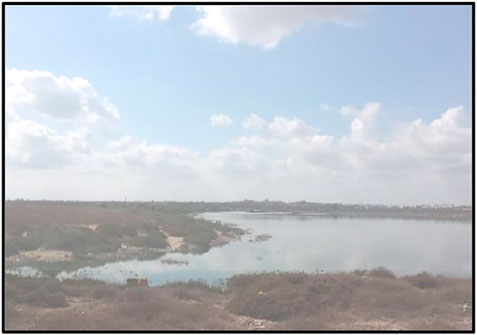
The protected and sensitive areas in the forest habitat sub-frame of the Sousse region included the forest of El Madfoun (Figure 3), which is a sensitive site and which aims to be a nature reserve, according to the GDF (2018). Although the semi-open habitat sub-frame does not have any protected reserves or sites, it is rich in habitat cores. The wetland sub-frame included three sites, including the sebkha of Halq El Minjel (Figure 4), which is a protected site and of national and international importance as an Important Bird Area and a Ramsar site since 2011 (Boussema et al., 2020a). The sebkha Assat Ejriba and sebkha of Sousse (Figure 5) are also considered sensitive sites given their ecological richness and their important hydrological roles.
Reservoirs of the forest habitat sub-frame
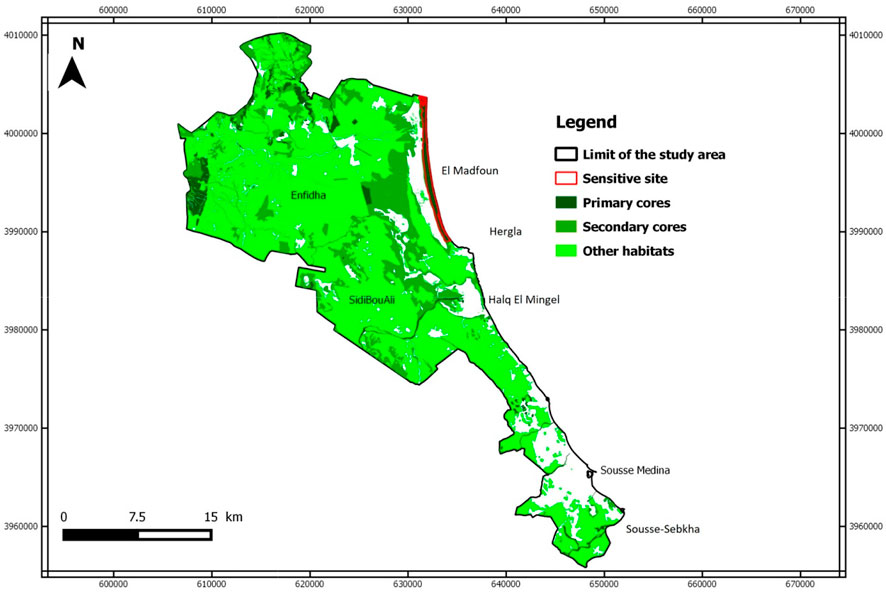
Figure 6 shows that the territory is marked by sparse forest in the forest habitat sub-frame. The primary cores are sparked and distributed on the north and northwest sides, mainly the forests located in Enfidha known as Ain M'Dhaker and Ain Rahma. The reservoirs of biodiversity were small and fragmented and concentrated in the north and northwest areas. Since they have small areas, the limited size of these habitats contributed only slightly to the remarkable biodiversity and does not guarantee the long-term viability of their populations.
Reservoirs of the semi-open habitat sub-frame
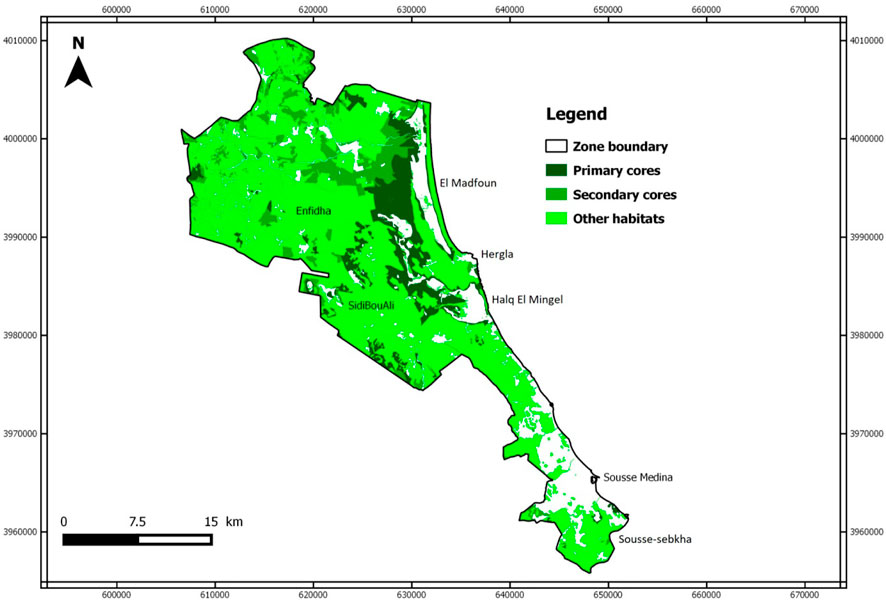
The primary cores were condensed in the middle, whereas the secondary cores were condensed in the north and the northwest near to primary cores. The primary and secondary cores of the semi-open habitat sub-frame were well-distributed over the territory, with middle dominance for primary cores. Indeed, these cores were numerous, occupying important surfaces and revealing an interesting network. Although this sub-frame was characterized by its rich core habitats, it has no protected sites (Figure 7).
Reservoirs of the wetland habitat sub-frame
The primary core consisted of water courses and bodies, wetlands (marine and inland), and riparian forests. There are two marine wetlands: Sebkha Halq El Mingel in the Hergla delegation and Sebkha Assat Ejriba in the Enfidha delegation. The only inland wetland is Sebkha Sousse, which lies south of Sousse city. The watercourses are temporary and seasonal, mainly located in the north and northwest. Ripisylves are plant formations along more or less perennial watercourses that are effective ecological corridors essential for maintaining larger-scale biodiversity. The secondary cores were numerous, located in the north, northwest, and middle near the primary cores. The choice of wetland sub-frame corresponded to the importance of issues related to the maintenance of biodiversity habitats and the close link with the Blue infrastructure. In our case, the Blue infrastructure was represented entirely by the wetland sub-frame (Figure 8).
Highlighting potential connections
Since the width of the buffer was equal to the dispersal distance of the target species living in the sub-frame, distances of 200 m, 250 m, and 300 m were chosen for the forest habitat, semi-open habitat, and wetland sub-frames, respectively. The application of a buffer zone from a positive distance followed by a buffer zone from a negative distance to the reservoirs of biodiversity for each sub-frame was used to reveal zones of probable connection between them.
Forest habitat sub-frame
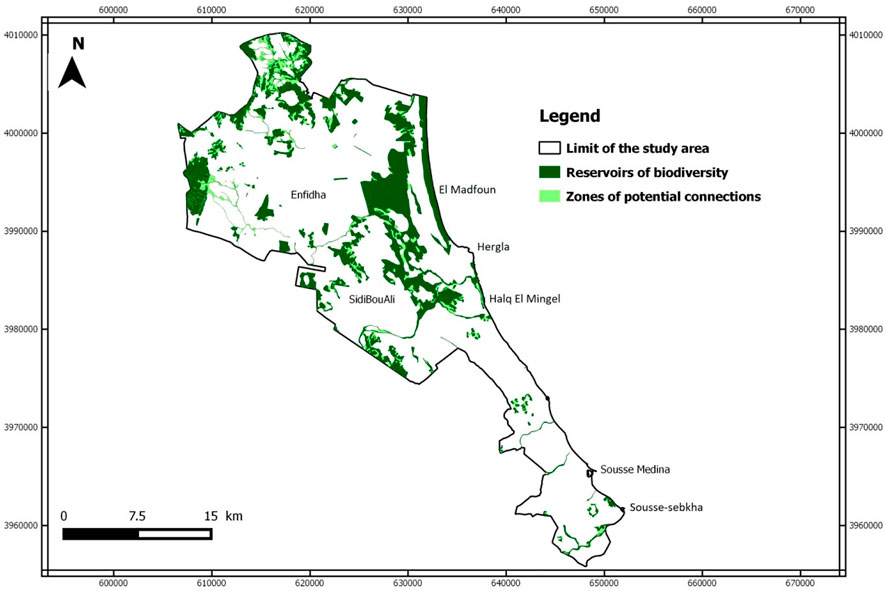
A dilatation equal to 200 m was carried out for the biodiversity cores (primary and secondary) of the forest sub-frame, followed by erosion with the same distance to reveal areas of potential movement of the hare. The resulting map (Figure 9) shows intermediate tasks (light green) between the different reservoirs of biodiversity (dark green). It is important to note that only the spaces that interconnect two already separated biodiversity cores support the tracing of travel axes.
Semi-open habitat sub-frame
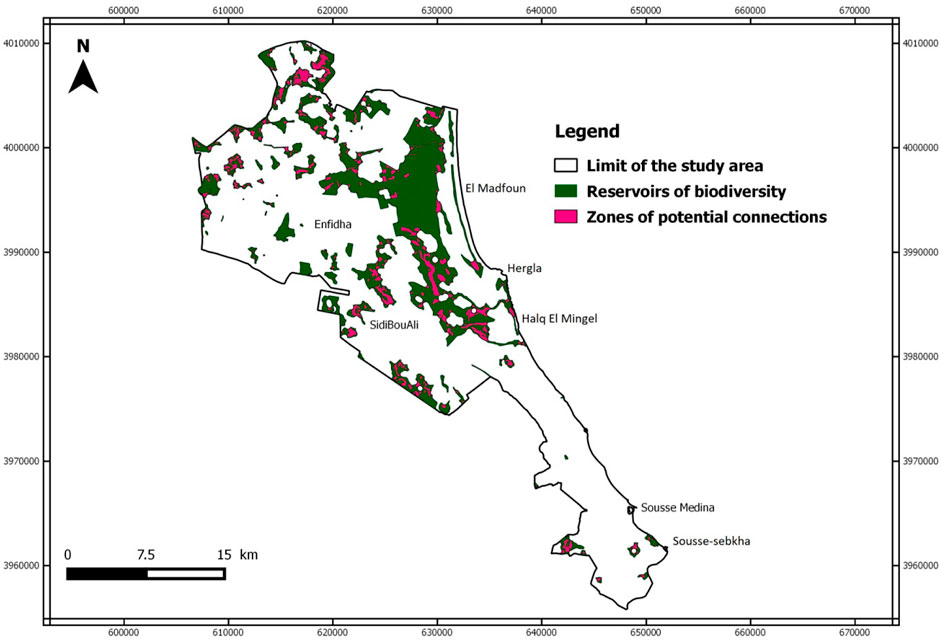
Figure 10 is the map of potential connections resulting from the erosion step with a distance of 250 m, showing intermediate tasks (pink) between biodiversity reservoirs (dark green). These are the areas of potential connections where the hedgehog may move. The potential connection zones are scattered throughout the study area since the reservoirs of the semi-open habitats sub-frame occupy a large part.
Wetland habitat sub-frame
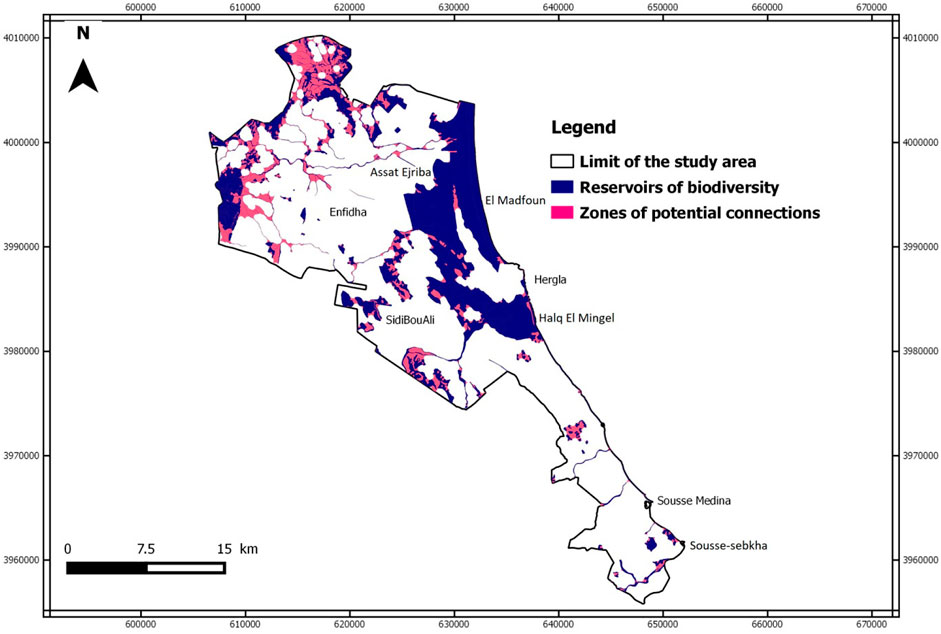
The biodiversity reservoirs of the wetland sub-frame are composed mainly of sebkhas and water courses. The latter are also considered biodiversity cores and corridors due to their connector role. Hence, the wetland sub-frame is mostly based on water courses. A 300-m buffer zone interconnects almost all biodiversity reservoirs. This distance around watercourses highlights the potential ecological functionality of the rivers and associated environments such as riparian forests. Figure 11 shows that the potential connection areas established at the water course level are narrower than those for the rest of the primary and secondary cores of the wetland habitat sub-frame. The remaining reservoirs showed small interstitial areas.
Therefore, it is important to verify the type of land use in the movement zones revealed during the erosion step and to subtract from them the zones where the type of land use is considered blocked by the animal. Hence, the next step is the study of territory fragmentation.
Fragmentation analysis of the Sousse region
The various disruptions and barriers to the continuity of the ecological network must be analyzed to highlight the potential corridors. Two major sources of fragmentation were identified in the present study: urban areas and linear transport infrastructures. As Figure 12 shows, the urban fabric is present in gray patches throughout the territory and occupies 15% of the total area. The most remarkable major urban task is that of downtown Sousse, the largest city in the region, with other smaller tasks corresponding to other cities. These small towns showed a discontinuous urban fabric; this suburbanization has begun to demolish vast agricultural lands and lead to settlement in the forests. These urban areas have a particularly important negative impact because they have large areas without vegetation, allow little circulation of species, and cause significant development. The coastal regions faced issues related to fragmentation by urbanization, especially on the coastal side.
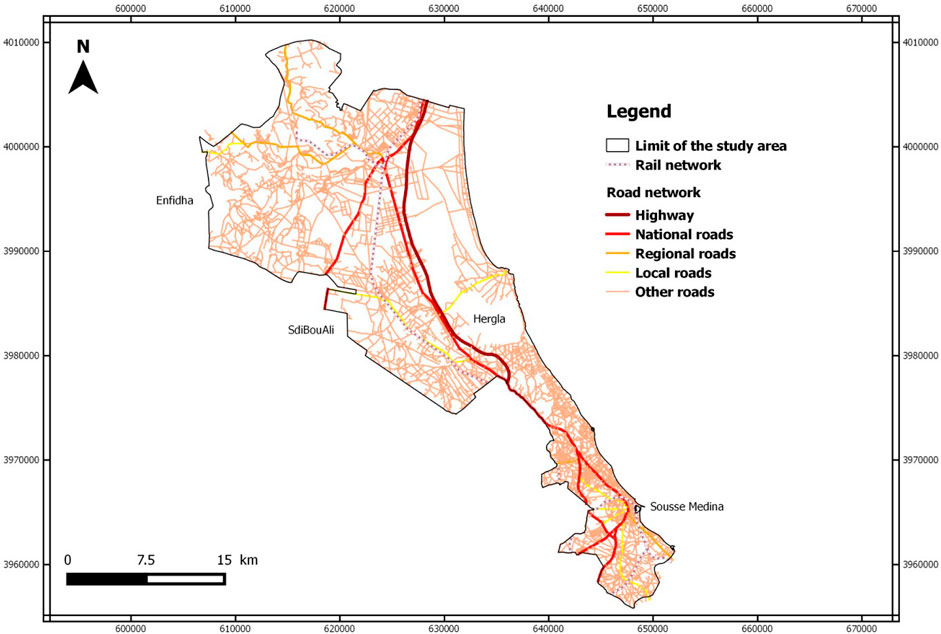
Figure 13 shows that the road network is dense and pervasive throughout the region of Sousse. Its impact is significant on biodiversity in terms of stopping or even blocking species movement. However, the mapping was limited to highway A1 and the national and regional roads. The rail network is a conventional line and not a high-speed line and crosses the study territory from south to north, with negative impacts on the mobility of terrestrial and avifauna species.
Ecological corridors in the Sousse region
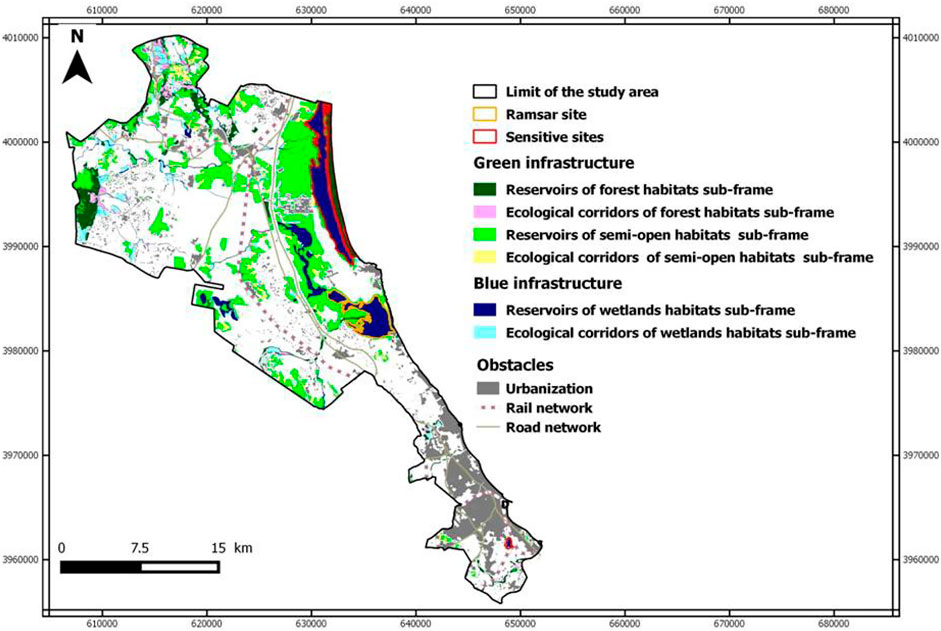
The synthesis map (Figure 14) highlighted the biodiversity reservoirs (represented by primary and secondary cores) and the main ecological links between them. Thus, it translated the stakes of the target species: the hare for the forest sub-frame, the hedgehog for the semi-open sub-frame, and the teal for the wetland sub-frame. The overlay of the main obstacles (urbanization and terrestrial transport network) to the movement of biodiversity with reservoirs and areas of potential connectivity revealed potential ecological corridors. For the Green infrastructure, the functional forest ecological corridors were concentrated mainly in the north and northwest regions instead of the forest cores, while the functional semi-open corridors were distributed in most of the study area, specifically in the northern and middle areas. This resulted in a good distribution of biodiversity reservoirs in this sub-frame with middle dominance for primary cores. For the Blue infrastructure, the functional ecological corridors were mainly presented by the water courses; which were both reservoirs and corridors (dual role).
Discussion
Baris et al. (2010) suggested the importance of enhancing the research and implementation of ecological network planning. This concept is based primarily on ecological research involving the survival of wildlife species in fragmented landscapes (Ahern 1995). The acceleration of urbanization in the Sousse region has resulted in the fragmentation of landscapes, deterioration of ecosystems, and loss of natural habitats and habitat structures (Boussema et al., 2020b). The species approach used in the present study was based both on target species and cross-reference with different sets of data comprising land cover and major obstacles. However, the application of dilatation–erosion treatment has its strengths and weaknesses. It is easily implemented, and the results are quickly generated (AuthorAnonymous et al., 2010). These results can be considered to represent structural connectivity, as the network highlights more than the specificities of the species (Avon and Bergès 2014). Although the width of the buffer is chosen according to the known dispersal distance of the species, this method reasons at the scale of the habitat task and its vicinity but not at the level of the overall landscape. The disadvantage of this method is that it does not consider the nature of the environments, particularly their resistance to the dispersal of species; i.e., the functional connectivity (Loquet and Clauzel 2018). However, this methodological choice appeared to be more operational based on the objectives of the present study to identify areas with elements favorable to biodiversity to target in the implementation of specific development actions at local and regional scales. Recently, Boussema et al. (2022) proposed a supra-regional connection to promote biodiversity conservation in the Sousse region with neighboring regions, which presents a new tool for space structuration and sustainable development at a supra-regional scale.
Conclusion
Preserving biodiversity and natural habitats in this region requires planning, designing, and managing the GBI. The spatial organization of the constituent environments of the Sousse region has resulted in eight main types of habitats: forests, shrub plantations, grasslands, rangelands, water courses, water bodies, ripisylves, and wetlands. The compilation of these environments has allowed the formation of three pioneering sub-frames of GBI, namely, forest habitats, semi-open habitats, and wetland sub-frames. However, the semi-open sub-frame is dominated by its constituent environments, occupying 30% of the study area, due to the adaptation of this open landscape to the semi-arid climate. Research on the animal species present in the study area, their distribution, their characteristics, and their vulnerability revealed three representative species for these types of environments: the Cape hare for the forest habitat sub-frame, the North African hedgehog for the semi-open habitat sub-frame, and marbled teal for the wetland sub-frame. Therefore, the GBI was mapped according to the characteristics of these selected species, which are crucial in the choice of dispersal distances for the determination of ecological corridors. To map these ecological corridors, the dilation–erosion method was applied to each sub-frame in two steps: dilation followed by erosion. This method revealed areas of potential connection within each sub-frame. Moreover, it is important to verify the land use in the travel areas revealed during the application of the erosion step and to subtract from them areas where the type of land use is considered impassable by the animal. Consequently, a study on the fragmentation of terrestrial obstacles was conducted. The identified obstacles stemmed from urbanization and terrestrial transport network, namely, the rail and road networks. The compilation of the results of the three sub-frames formed a potential GBI of the Sousse region, hence the objective of the present study.
This study successfully developed a method taken for the development of GBI in the Sousse region and represents the first innovative research applied in Tunisia. This network comprises natural and semi-natural environments whose green and blue components interact through the ecological corridors created. Subsequently, the fauna and floristic species will be able to live in biotic interactions and harmony and the inhabitants will be able to take advantage of nature in the city, thus creating a real socio-ecological balance. This ecological network is a concrete example that could evolve toward a reproducible prototype for other regions. The integration of GBI in planning documents and development plans should be a part of a decision-making perspective in public policies for sustainable landscapes. Moreover, the implementation described here should provide concrete steps to bring together as many partners and stakeholders as possible.
Data availability statement
The original contributions presented in the study are included in the article/Supplementary Material, Further inquiries can be directed to the corresponding author.
Author contributions
All authors listed have made substantial, direct, and intellectual contributions to the work and approved it for publication.
Conflict of interest
The authors declare that the research was conducted in the absence of any commercial or financial relationships that could be construed as a potential conflict of interest.
Publisher’s note
All claims expressed in this article are solely those of the authors and do not necessarily represent those of their affiliated organizations, or those of the publisher, the editors, and the reviewers. Any product that may be evaluated in this article, or claim that may be made by its manufacturer, is not guaranteed or endorsed by the publisher.
References
Ahern, J. (1995). Greenways as a planning strategy. Landsc. Urban Plan. 33 (1-3), 131–155. doi:10.1016/0169-2046(95)02039-v
Ahern, J. (2002). Greenways as strategic landscape planning: Theory and application. Netherlands: Dissertation Wageningen University, 179.
Akpinar, A. (2016). Factors influencing the use of urban greenways: A case study of aydin. Turk. Urban For. Urban Green. 16, 123–131. doi:10.1016/j.ufug.2016.02.004
Amori, G., Hutterer, R., Kryštufek, B., Yigit, N., Mitsain, G., and Palomo, L. J. (2008). Liste rouge de l'UICN des espèces menacées 2008. Atelerix algirus, 13. doi:10.2305/IUCN.UK.2008.RLTS.T27926A9481697
Amsallem, J., Deshayes, M., and Bonnevialle, M. (2010). Analyse comparative de méthodes d'élaboration de trames vertes et bleues nationales et régionales. Sci. Eaux Territ. 03, 40–45. doi:10.3917/set.003.0040
Andresen, T., De Aguiar, F-B., and José, C-M. (2004). The alto douro WineRegiongreenway. Landsc. Urban Plan. 68 (2-3), 289–303. doi:10.1016/S0169-2046(03)00156-7
Asakawa, S., Yoshida, K., and Yabe, K. (2004). Perceptions of urban stream corridors within the greenway system of Sapporo Japan. Landsc. Urban Plan. 68, 167–182. doi:10.1016/S0169-2046(03)00158-0
Avon, C., and Bergès, L. (2014). Outils pour l’analyse de la connectivité des habitas. Aix-en-Provence, France: Irstea, Projet J Diacofor Convention cadre Irstea MEDDE DEB, 34.
Barett, G. W., and Bohlen, P. J. (1991). Landscape ecology. Dans: Hudson landscape linkages and biodiversity. Washington, DC, USA: Island Press, 149–161.
Baris, M. E., Erdogan, E., Dilaver, Z., and Arslan, M. (2010). Greenways and the urban form: City of ankara, Turkey. Biotechnol. Biotechnol. Equip. 24 (1), 1657–1664. doi:10.2478/v10133-010-0022-6
Bauge, S. (2013). “Development of a transposable method for setting up a green and blue infrastructure at the local level: Experimentation in eleven municipalities of the avesnois regional natural park,”. Internship report (Gradignan, France: National School of Agronomic Sciences of Bordeaux Aquitaine), 133.
Beier, P., Majka, D. R., and Spencer, W. D. (2008). Forks in the road : Choices in procedures for designing wildland linkages. Conserv. Biol. 22 (4), 836–851. doi:10.1111/j.1523-1739.2008.00942.x
Bennett, G., and Wit, P. (2001). The development and application of ecological networks, a review of proposals, plans and programmes. Amsterda, Netherlands: IUCN/AIDEnvironment, 132.
Bergès, L., Roche, P., and Avon, C. (2010). Corridors écologiques et conservation de la biodiversité, intérêts et limites pour la mise en place de la Trame verte et bleue. Sci. Eaux Territ. 3, 34–39. doi:10.3917/set.003.0034, no.
Bernier, A., and Théau, J. (2013). Modelling ecological networks and impacts of methodological choices on their spatial configuration: Case analysis in the eastern townships (quebec, Canada). vertigo 13 (2), 32. doi:10.4000/vertigo.14105
Berthoud, G., Righetti, A., and Lebeau, R. P. (2004). “Réseau écologique national REN : Rapport final, Office fédéral de l’environnement,”. des forêts et du paysage (Berne, Switzerland: Cahier de l’environnement), 132.373
Bourgeois, M., Cossard, O., and Fressard, M. (2017). Mesurer et spatialiser la connectivité pour modéliser les changements des systèmes environnementaux :Approches comparées en écologie du paysage et en géomorphologie. geomorphologie 23 (4), 289–308. doi:10.4000/geomorphologie.11895
Bird Life International (2017). "Marmaronetta angustirostris," in The IUCN red list of threatened species. https://www.iucnredlist.org/species/22680339/110054350 (Accessed Janvier 10, 2020).
Bousemma, S., KhebourAllouche, F., Saidaine, I., Mechmech, Y., and Bettaieb, T. (2018). State of the art of greenway concept application in Tunisian green policy: A case study of an urban landscape in Sousse city. Int. J. Environ. Geoinformatics 5 (1), 36–50. doi:10.30897/ijegeo.353818
Boussema, S., KhebourAllouche, F., Bekaoui, A., Khalifa, Y., and M’Sadak, H. (2020b). Using Google Earth™ and Geographical Information System data as method to detect urban sprawl and green spaces for better well being: Case of a coastal landscape. Int. J. Res. Granthaalayah. 8 (9), 266–276. doi:10.29121/granthaalayah.v8.i9.2020.1524
Boussema, S., KhebourAllouche, F., and Chaabane, B. (2020a). Tools and indicators for integrated wetland monitoring : Case of Hergla wetland-Tunisia. Eur. Acad. Res. 8 (6), 3230–3245. http://www.euacademic.org/UploadArticle/4516.pdf.
Boussema, S., Cohen, M., and Khebour Allouche, F. (2022). Promoting Biodiversity conservation with Supra-regional connections. Case study of a Mediterranean region, Tunisia. Int. J. Res. Granthaalayah. 10 (8), 1–10. doi:10.29121/granthaalayah.v10.i8.2022.4723
Boussema, S., and Khebour Allouche, (2020). Methodology of land use mapping to landscape typology applied to the Enfidha region, Tunisia. Int. J. Innovation Sci. Res. 52 (1), 8–19. http://ijisr.issr-journals.org/abstract.php?article=IJISR-20-257-11.
Burel, F., and Baudry, J. (1999). Écologie du paysage. Concepts, méthodes et applications. Paris, France: Éditions Tec & Doc., 359
Cemagref, (2011). Methodological note: Fragmentation analysis. Center for the Study of Agricultural Machinery and Rural Water and Forest Engineering, 18Central ecological grid: An ecological grid of the Massif with extension towards the pyrenees. Montpellier-France, 18.
Cete, (2012). Implementation of the green and blue infrastructure in the bouches-du-rhône: Establishment of a methodological note. France: Center for Technical Studies of Mediterranean Equipment, 66.
Chang, Q., Li, X., Huang, X., and Wu, J. (2012). A GIS-based green infrastructure planning for sustainable urban land use and spatial development. Procedia Environ. Sci. 12, 491–498. doi:10.1016/j.proenv.2012.01.308
Cook, E. A. (2002). Landscape structure indices for assessing urban ecological networks. Landsc. Urban Plan. 58 (2-4), 269–280. doi:10.1016/s0169-2046(01)00226-2
Crda, (2009). Agriculture map of Sousse. Tunisia: Regional Commission for Agricultural Development of Sousse, 42.
Dale, M. R. T., and Fortin, M. J. (2010). From graphs to spatial graphs. Annu. Rev. Ecol. Evol. Syst. 41, 21–38. doi:10.1146/annurev-ecolsys-102209-144718
Debray, A. (2011). La notion de réseau écologique en France : Construction scientifique, appropriation par les politiques publiques et traduction territoriale. Vertigo- Rev. électronique Sci. l’environnement. Available at: http://journals.openedition.org/vertigo/10687 (Accessed November 29, 2022).
Delibes-Mateos, M., Farfán, M. A., Oliveros, J., and Vargas, J. M. (2010). Land-use changes as a critical factor for long-term wild rabbit conservation in the Iberian Peninsula. Environ. Conserv. 37, 169–176. doi:10.1017/s0376892910000214
Doncaster, C. P., Carlo, R., and Paul, C. D, J. (2008). Field test for environmental correlates of dispersal in hedgehogs Erinaceus europaeus. J. Animal Ecol. 70 (1), 33–46. doi:10.1111/j.1365-2656.2001.00471.x
Dreal Corse, (2014). Realization of a mapping identification study of the green and blue infrastructure of corsica. Office of the Environment of Corsica, 124.
Duchesne, S., Bélanger, L., Grenier, M., and Hone, F. (1998). Guide de conservation des corridors forestiers en milieu agricole. Serv. Can. de Faune (région du Québec) Fondation Les oiseleurs du Québec, 60.
É, François, Amsallem, J., and Deshayes, M. (2010). L'intégration du principe de continuité écologique dans les schémas de cohérence territoriale (SCOT) : Analyse de 21 expériences de SCOT. Sci. Eaux Territ. 3 (3), 110–115. doi:10.3917/set.003.0110
Etherington, T. R. (2016). Least-cost modelling and landscape ecology: Concepts, applications, and opportunities. Curr. Landsc. Ecol. Rep. 1, 40–53. doi:10.1007/s40823-016-0006-9
Fábos, J. G. (1995). Introduction and overview: The greenway movement, uses and potentials of greenways. Landsc. Urban Plan. 33 (1-3), 1–13. doi:10.1016/0169-2046(95)02035-r
Foltête, J. C., Clauzel, C., Girardet, X., Tournant, P., and Vuidel, G. (2012). La modélisation des réseaux écologiques par les graphes paysagers. Méthodes et outils. Rev. Int. Géomatique 22 (4), 641–658. doi:10.3166/rig.22.641-658
Fu, W., Liu, S., Degloria, D. D., and Dong, S. (2010). Characterizing the fragmentation–barrier effect of road networks on landscape connectivity: A case study in xishuangbanna, southwest China. Landsc. Urban Plan. 95, 122–129. doi:10.1016/j.landurbplan.2009.12.009
Garnero, V., and Lebrun, J. (2006). Operation "network landes" of the territory of the P.N.R. Oise pays de France. 1st phase: Definition of the network and development of a first action plan. Document n°2 General state Knowl. - Conservatory Nat. Sites Picardy 2, 66.
Gdf, (2018). Identification form of El Madfoun forest. France: Genaral Directory of Forests of Sousse region, 13.
Giordano, L. D. C., and Riedel, P. S. (2008). Multi-criteria spatial decision analysis fordemarcation of greenway: A case study of the city of rio claro, sao paulo, Brazil. Landsc. Urban Plan. 84, 301–311. doi:10.1016/j.landurbplan.2007.09.006
Godet, C., and Clauzel, C. (2021). Comparison of landscape graph modelling methods for analysing pond network connectivity. Landsc. Ecol. 36 (3), 735–748. doi:10.1007/s10980-020-01164-9
Green, A. J., and Selva, N. (2000). The diet of post-breeding marbled teal marmaronetta angustirostris and mallard Anas platyrhynchos in the goksu delta, Turkey. Revue d'Ecologie (La Terre Vie) 55 (2), 161–169.
Green, A. J. (1993). The status and conservation of the Marbled Teal Marmaronetta angustirostris. Slimbridge, U.K: International Waterfowl and Wetlands Research Bureau.
Hobden, D. W., Laughton, G. E., and Morgan, K. E. (2004). Green space borders, a tangible benefit?Evidence from four neighbourhoods in Surrey, British Colum-bia. Land Use Policy 21 (2), 129–138. doi:10.1016/j.landusepol.2003.10.002
IUCN (2020). Red list of threatned species, international union for conservation of nature. www.iucnredlist.org (Accessed June 02, 2020).
Ifpn, (2010). Results of the second national forestry and pastoral inventory. Tunisia: National Centre for Mapping and Remote Sensing, 171.
Inglis, G., and Underwood, A. J. (1992). Comments on some designs proposed for experiments on the biological importance of corridors. Conserv. Biol. 6, 581–586. doi:10.1046/j.1523-1739.1992.06040581.x
Ins, (2017). Monthly statistical bulletin (december 2017). Tunisia: National Institute of Statistics Tunisia, 15.
Jongman, R. H. G., Kulvik, M., and Kristiansen, I. (2004). European ecological networks and greenways. Landsc. Urban Plan. 68 (2-3), 305–319. doi:10.1016/s0169-2046(03)00163-4
Kindlmann, P., and Burel, F. (2008). Connectivity measures: A review. Landsc. Ecol. 23, 879–890. doi:10.1007/s10980-008-9245-4
Kong, F., Yin, H., Nakagoshi, N., and Zong, Y. (2010). Urban green space network development for biodiversity conservation: Identification based on graph theory and gravity modeling. Landsc. Urban Plan. 95, 16–27. doi:10.1016/j.landurbplan.2009.11.001
Kurdoğlu, O., and Kurdoğlu, B. C. (2010). Determining recreational, scenic, and historical-cultural potentials of landscape features along a segment of the ancient Silk Road using factor analyzing. Environ. Monit. Assess. 170 (1-4), 99–116. doi:10.1007/s10661-009-1219-8
Liénard, S., and Clergeau, P. (2011). Trame Verte et Bleue : Utilisation des cartes d’occupation du sol pour une première approche qualitative de la biodiversité. cybergeo, 519. doi:10.4000/cybergeo.23494
Linglart, M., Morin, S., Paris, M., and Clergeau, P. (2016). implementation methodology of an urban green network: The case of an urban association, plaine commune. Cybergeo. Eur. J. Geogr.. doi:10.4000/cybergeo.27713
Locquet, A., and Clauzel, C. (2018). Identification et caractérisation de la trame verte et bleue du PNR des Ardennes : Comparaison des approches par habitat et par perméabilité des milieux. cybergeo. doi:10.4000/cybergeo.29864
Mahmoud, A. H. A., and El-Sayed, M. A. (2011). Development of sustainable urban green areas in Egyptian new cities: The caseof El-Sadat city. Landsc. Urban Plan. 101, 157–170. doi:10.1016/j.landurbplan.2011.02.008
Miller, W., Collins, M. G., Steiner, F. R., and Cook, E. (1998). An approach for greenway suitability analysis. Landsc. Urban Plan. 42, 91–105. doi:10.1016/s0169-2046(98)00080-2
Opdam, P., Steingröver, E., and Rooij, S. V. (2006). Ecological networks : A spatial concept for multi-actor planning of sustainable landscapes. Landsc. Urban Plan. 75 (3-4), 322–332. doi:10.1016/j.landurbplan.2005.02.015
Pena, S. B., Abreu, M. M., Teles, R., and Espirito-Santo, M. D. (2010). A methodology for creating greenways through multidisciplinary sustainable landscape planning. J. Environ. Manag. 91 (4), 970–983. doi:10.1016/j.jenvman.2009.12.004
Ribeiro, L. F. (1998). “The cultural landscape and the uniqueness of place,” in A greenway heritage network for landscape conservation (Lisbon, Portuga: scholarworks).
Sarrias, F. (2014). Reflection on the establishment of the green and blue infrastructure in greater dijon. Internship report. Bourgogne, France: Agro SUP Dijon, University of Burgundy, 56.
Saura, S., and Pascual-Hortal, L. (2007). A new habitat availability index to integrate connectivity in landscape conservation planning: Comparison with existing indices and application to a case study. Landsc. Urban Plan. 82, 91–103. doi:10.1016/j.landurbplan.2007.03.005
Searns, R. M. (1995). The evolution of greenways as an adaptive urban landscapeform. Landsc. Urban Plan. 33, 65–80. doi:10.1016/0169-2046(94)02014-7
Sordello, R., Billon, L., Amsallem, J., and &Vanpeene, S. (2017). “Technical and scientific report on the development of regional ecological coherence Schemes.Methods for identifying the components of TVB,” (France: TVB Resource Center), 104.
Spaggiari, J., Ichter, J., and Lefeuvre, J. C. (2010). Mise au point d’une méthode d’identification des continuités écologiques dans le Grand Sud de la Nouvelle-Calédonie. Rapport Synthèse Bibliogr. Propos. d’une démarche, 74.
Taylor, J. J., Brown, D. G., and Larsen, L. (2007). Preserving natural features: A GIS-based evaluation of a local open-space ordinance. Landsc. Urban Plan. 82, 1–16. doi:10.1016/j.landurbplan.2007.01.013
Teng, M., Wu, C., Zhou, Z., Lord, E., and Zheng, Z. (2011). Multipurpose greenway planning for changing cities: A framework integrating priorities and a least-cost path model. Landsc. Urban Plan. 103, 1–14. doi:10.1016/j.landurbplan.2011.05.007
Toccolini, A., Fumagalli, N., and Senes, G. (2006). Greenways planning in Italy: The lambro river valley greenways system. Landsc. Urban Plan. 76 (1-4), 98–111. doi:10.1016/j.landurbplan.2004.09.038
Tomczyk, A. M., and Ewertowski, M. (2013). Planning of recreational trails in protected areas: Application of regression tree analysis and geographic information systems. Appl. Geogr. 40, 129–139. doi:10.1016/j.apgeog.2013.02.004
Turner, T. (2006). Greenway planning in britain: Recent work and future plans. Landsc. Urban Plan. 76 (1-4), 240–251. doi:10.1016/j.landurbplan.2004.09.035
Villafuerte, R., and Delibes-Mateos, M. (2019). Liste rouge de l'UICN des espèces menacées 2019. Oryctolagus Cuniculus. doi:10.2305/IUCN.UK.2019-3
Keywords: green and blue infrastructure, design, biodiversity, ecological network, buffer, semi-arid region
Citation: Bel Fekih Boussema S, Cohen M and Khebour Allouche F (2022) Green and blue infrastructure design in a semi-arid region. Front. Environ. Sci. 10:1061256. doi: 10.3389/fenvs.2022.1061256
Received: 04 October 2022; Accepted: 17 November 2022;
Published: 12 December 2022.
Edited by:
Cecilia Arnaiz Schmitz, Universidad Complutense de Madrid, SpainReviewed by:
Voltaire Alvarado Peterson, University of Concepcion, ChileMiguel Alfonso Ortega-Huerta, National Autonomous University of Mexico, Mexico
Copyright © 2022 Bel Fekih Boussema, Cohen and Khebour Allouche. This is an open-access article distributed under the terms of the Creative Commons Attribution License (CC BY). The use, distribution or reproduction in other forums is permitted, provided the original author(s) and the copyright owner(s) are credited and that the original publication in this journal is cited, in accordance with accepted academic practice. No use, distribution or reproduction is permitted which does not comply with these terms.
*Correspondence: Safa Bel Fekih Boussema, YmVsZmVraWhzYWZhQGdtYWlsLmNvbQ==
 Safa Bel Fekih Boussema
 Marianne Cohen
 Faiza Khebour Allouche