
95% of researchers rate our articles as excellent or good
Learn more about the work of our research integrity team to safeguard the quality of each article we publish.
Find out more
ORIGINAL RESEARCH article
Front. Environ. Sci. , 06 January 2023
Sec. Environmental Economics and Management
Volume 10 - 2022 | https://doi.org/10.3389/fenvs.2022.1061128
This article is part of the Research Topic Green Process Innovation in Circular Economy for Sustainable Development View all 13 articles
 Speranta Camelia Pirciog1‡
 Adriana Grigorescu2,3*†
 Cristina Lincaru1†Florin Marius Popa4
 Ewa Lazarczyk Carlson5
 Hallur Thor Sigurdarson5
Globalization and the Fourth Industrial Revolution or Industry 4.0 act as shocks on regional labor markets and regional economies. The presence of a digital economy has high spillover effects on regional development, job creation, economic resilience, and sustainability; furthermore, it valuates eco-innovation and the clean economy. We believe that the process of digital transformation has a robust impact on the green and clean aspects of the entire economy. The consistency of high digital-intensive (HDI) sectors can be evaluated through high digital-intensive employment, human resources, and technological infrastructure, as these are the main pillars of digital transformation. The shift-share analysis method (SSM) is used in this study on employment growth during 2008–2018 for the EU27, the United Kingdom, and Norway, combined with a second stage of exploratory spatial data analysis (ESDA). The findings on national growth, industrial mix, and competitiveness are presented in GIS mapping system considering the Local Indicators of Spatial Association (LISA) technique at the NUTS2 level. This approach allows us to determine the clustering level of high digital-intensive employment and sectors, resilience based on connectivity and eco-innovation, and the regional potential of digital transformation. Policymakers and political or governmental decision-makers could consider the results of the present study as the starting point for developing and implementing their policies for a sustainable green regional economy and determine the emerging area patches that need to be stimulated.
With globalization and the Fourth Industrial Revolution (Industry 4.0), new opportunities, disruptions, and polarization are being shaped within and between economies and societies (Schwab, 2019). This new wave has changed value creation and capture in an increasingly digital global economy. The 2008 economic and financial crisis shattered predictions concerning job growth, structural development, business models, regional policies, and even socio-economic paradigms (van Dijk and Edzes, 2016).
Digital transformation is accelerating radical innovations (new technologies including artificial intelligence, automation, 3D printing, sensors, robotics) and adoption across the entire global economy. This process is leading to dramatic disruptions in employment, offering a unique and challenging perspective on regional transformation (De Propris and Bailey, 2020). At the same time, digital transformation is impacting the green economy (Xue C. et al., 2022) and the circular economy (Ilić et al., 2022), such as the impact of innovation and digital transformation on renewable energy management (Xiaole and Piscunova, 2022) or the digitalization of Ukrainian companies to shift to a green economy (Moroz and Dyma, 2020) both of which highlight the role of public policies in implementing new sustainable business models.
A key indicator of digital transformation is the development of sectors characterized by high digital-intensive (HDI) (Calvino et al., 2018; OECD, 2019). Between 2006 and 2016, 55 million net jobs were created across the G20 countries (OECD, 2020), largely across low or medium digital-intensive sectors. We believe that demand fluctuations in human resources provide insights into the HDI sector. This study aims to understand fluctuations in European employment in the HDI sectors during the period 2008–2018 at the NUTS-2 level.1
We analyzed the HDI sector (transport equipment, ICT services, legal and accounting, R&D, advertising, and marketing, except finance and insurance) at the regional level using Eurostat data (sbs_r_nuts06_r2). The shift-share analysis (SSM) technique, which is descriptive rather than explanatory, is used to analyze the components of the HDI sector’s employment growth: national share and industry mix and local shift components (Jackson and Haynes, 2020). Consistent with several other authors (Matlaba et al., 2012; Ruault and Schaeffer, 2020), we used exploratory spatial data analysis (ESDA) to display the spatial correlation of industry-mix and competitive effects, as proposed by Anselin (2010), Anselin (2019). The structural dissimilarity analysis performed in ArcGis PRO functions as an arbitrary clustering tool to correct SSM errors (Gallea, 2019). McHarg (1971) overlays the region’s estimated urbanization profile based on population density over the sector’s employment growth maps, showing the degree of competitive advantage, relative specialization, and the level of endogenous effect on digital-intensive sectors.
This study provides a better understanding of regional labor market behavior and the synchronized adoption of radical innovation technologies for the digital economy within existing measurement frameworks (OECD, 2020). This study also focuses on measuring digital transformation, new economic geography, and agglomeration, considering the evolutionary theory framework.
Regions with agglomerations in HDI sectors are globally more connected and competitive. Smart Specialization and Industry 4.0 policies are strongly linked; however, new policy approaches such as Opportunities and Challenges for Regional Innovation Policy (Foray, 2014), Revitalizing Lagging Regions (Barzotto et al., 2020), and Regional Transformations Opportunities (De Propris and Bailey, 2020) are not yet completely exploited in the literature. Major policy issues, outlined by Fischer and Njikamp (1987), regarding the modernization of labor market policies according to the new spatially segmented labor market profiles, spatial inequalities in terms of job quality and the high risk of unemployment, new coordination methods of labor supply and demand, and changes in job structure must be approached from a regional perspective, connectivity, and clustering.
This research is based on the following statement: “One of the most intriguing questions in economic geography is why some regional economies manage to renew themselves, whereas others remain locked in decline” (Hassink, 2010). In response, our research question is: Why did employment grow or decline in high digital-intensive (HDI) sectors during the period 2008–2018 in the EU region? Correspondingly, this research focuses on understanding EU employment changes in the HDI sectors during 2008–2018.
This paper is structured as follows. In Section 2, we provide a review of the existing literature. Section 3 focuses on the methodology, and Section 4 presents discusses the results. Section 5 concludes the paper, including study limitations and theoretical and practical contributions. We also articulate further developments in research and provide guidelines for policymakers.
The contribution of the paper is to provide, using the GIS mapping system a spatial perspectives of HDI sectors in the regions of the European Countries and the potential to be used for the circular economy. There are two ways of solving the main challenges of nowadays: cutting-closing-destroying the existing facilities that are inappropriate and hearts the environment or changing-renewing-shifting to smart solutions. The paper comes with a proposal of using the HDI sectors and the digital transformation to generate innovative business based on skilled personnel and high technology. The policymakers and business managers should explore the characteristics of their location, shown by the maps, and decide accordingly, from scaling the investments, push on or pull off public strategies or policies, human resources management, talents attraction and so on.
Béné et al. (2016) reviewed the limits of the concept of resilience within the framework of development. According to the authors, resilience is a central point in ecology, related to the circular economy, green economy, climate change, and urban planning. Resilience can improve life conditions but it cannot reduce poverty. After critical analysis, Hassink (2010) concluded that the contribution of regional resilience to adaptability is relatively limited. Béné et al. (2016) stated that the most important value of resilience is its integrative role, as it facilitates various disparate practices to either contribute toward a common goal or support each other. Scott (2013) discusses the concept of resilience from two perspectives: an equilibrium (or bounce-back) approach considering the return to a previous stage, and an evolutionary (or bounce-forward) approach that seeks a step forward. Chapple and Lester (2007), p.2 defined regional resilience as the ability of regions to face challenges. They propose two frameworks, that is, “creating a new equilibrium” and “reversing path dependency,” considering the new economy, new trends in information technology, and knowledge-intensive industries as the key drivers of international competitiveness.
Reggiani (2013) refers to resilience as the speed at which a network returns to its equilibrium after a shock and the capacity to absorb these shocks, whereas vulnerability analysis refers to the propagation of shocks within a network. According to Modica and Reggiani (2014), resilience is the capacity of a system to react to disruptions and return to the initial stage. Modica et al. (2018) selected definitions of resilience: a) the capacity to recover from a shock (“engineering resilience” (Pimm, 1984); b) the capacity to resist a shock “ecological resilience” (Holling, 1973); c) the ability to adapt after a shock “adaptive resilience” (Martin, 2012), or to develop new growth paths (Boschma, 2015). Modica et al. (2019) distinguish resilience from the concept of vulnerability, as the former is understood as the capacity to face a shock and the latter as the potential for harm as shocks.
One author’s original contribution is the determination of the extent of urbanization of regions, as a measure of connectivity, in the sense of Boschma (2005), as areas of data sharing, which reflect the “size of the technological or cognitive proximity.” We used the criterion of population density threshold after a preliminary analysis (Jonard et al., 2009) and alternative criteria such as “the share of number of households in rural areas greater than 50%” and “DEGURBA the degree of urbanization in 2018.”
A gap identified is an understanding on the resilience of the spatial labor market and its implications for economic geography, arguing that this can become an emerging area of research. The contribution of the actual research is addressing the gap by offering a spatial view of the HDI sector (smart jobs) and the link with the circular economy. The resilience has to be understood as a complex mechanism with smart components that are significantly influence the other. Using de economic geography, our findings are presenting the regions specific growth and our findings offer a very easy to understand picture of the evolution and the development at the regional development, showing the impact of HDI sectors on the circular economy implementation. Based on the type of the region the public policies could be adjusted and the public spending more efficient used. More than this, the proposed model can be replicate for other elements involved in economic resilience and picturing the regions stage.
The labeling of urban or rural dichotomist regions allows us to identify external agglomeration economies. Marshallian urbanization, Jacobian economists and Morettian externalities consideration are presented below.
Marshallian economies (technical externalities) or localized economies benefit from neighborhoods with companies from the HDI sector. Several authors (Feser, 2002; Henderson, 2003) have pointed out that Marshallian externalities arise from three sources: labor market pooling, creation of specialized suppliers, and the emergence of knowledge spillovers.
Jacobian externalities are external economies stemming from a variety of sectors (Jacobs, 1961, Jacobs, 1969) The expected benefit, according to Frenken et al. (2007), from Jacobian externalities is employment growth as a result of achieving radical processed innovations finalized with new products that are associated with new skills, new employment opportunities, and new markets. The authors pointed out that a variety of activities in the city are more important than urban density.
Morettian externalities (Tertiary Human Capital Spillover): High human capital has a spillover effect on a city economy (Moretti, 2003). The magnitude of human capital spillover is an important issue for the education policy, for attracting new talent in the region, as it increases productivity and voters’ participation and curbs crime and violent behavior (Moretti, 2004).
In our analysis, the unit of spatial analysis is represented by the region’s NUTS2 (nomenclature of territorial units for statistics), which represents an area of interest with its own behavior, not necessarily identical or in trend with the national one. Correspondence between NUTS and LAU (national/local administrative units) levels, updated in 2020, indicates 242 regions for the EU27, 41 regions for the United Kingdom, and 7 regions for Norway. The total number of regions stands at 290. Of these, 285 regions were covered by valid data provided by Eurostat.
Digital transformation (DT) is characterized by Antikainen et al. (2018) as a key factor for a circular economy and specific business models. The authors show that digitalization upholds the circular economy model contributing to the rapid closing of the circle of nature-product-nature by increasing the process efficiency, optimizing access to resources, and diminishing waste. We consider the main channels of digital transformation action as: Information provided about materials, processes, technologies, qualified labor, customers, logistics, costs, and marketing and information related to ICT applications, robotics, artificial intelligence AI integration on production processes, cleaning waste or obliteration of remains, and reintegration into nature.
Jensen (2021) emphasized that a digital backbone, created at the global level with the contribution of all the involved factors could support the circular economy and the business models for a new global landscape. This will facilitate information sharing across industries and best practices. Without digital transformation, the circular economy paradigm and practice will remain as individual projects and progress will be slow. Nowadays, the rush of time can be surpassed only through the path offered by digitalization. Without digitalization as an accelerator, circular business models will have less impact on improving the environment and economic growth.
Organizations and businesses must become fully digital (to create a genuinely global circular economy Jensen (2022). By providing a complete overview of their supply chain, digital businesses can minimize environmental degradation while boosting profits and competitiveness.
Digital transformation is considered a necessary tool to advance the move from a linear economy to a circular economy. Riesener et al. (2019) investigate how the transformation can occur and present recommendations for manufacturing companies on how digitalization can shift toward the circular economy principles. The transformation to the circular economy with the help of digital transformation occurs through three stages: micro-, meso-, and macro-levels (Trevisan et al., 2021). At the level of a single company, that is, micro-level, the circular economy is a business model innovation and processes related to monitoring, controlling, optimization, and automation (Porter and Heppelmann, 2014; Nasiri et al., 2017; Ingemarsdotter et al., 2019; Pieroni et al., 2019; Neligan et al., 2022). The meso level describes the connection between a company and its environment, where the circular economy has been employed to enhance the productivity and efficiency of resources (Kristoffersen et al., 2020). The use of digital transformation for the circular economy at the macro level is defined as actions impacting large areas, such as cities (Ghisellini et al., 2016). The presence of HDI sectors indicates a high propensity for the location to build a functional and efficient circular economic ecosystem.
This study contributes to one of the three research areas identified by Trevisan et al. (2021) by focusing on the link between the Fourth Industrial Revolution and the circular economy. The importance of digital transformation in guiding the shift toward a circular economy is understood as the location problem of sectors characterized by HDI.
In this study, sectors with HDI were defined following Calvino et al. (2018) and OECD (2019) and in accordance with the Methodological Framework for Measuring Digital Transformation (OECD, 2020). A total of 208 variables describing 14 two-digit CAEN sectors were used (C29, C30, J61, J62, J63, M69, M70, M71, M72, M73, M74, M75, N77–N82, and S95) covering 290 regions from 29 countries (EU27 + UK + NO). The data are from different sources, mainly the Eurostat (statistical office of the European Union) (for details, see Appendix 1). The HDI sector was determined by aggregating it into eight sub-sectors: C29–30, J61, J62–63, M69–70–71, M72, M73–74–75, N, and S95. The missing or undercutting values for HDI employment for one-digit sectors were calculated by replacing the completion of the gaps in SPSS with the TREND function for the available series of number of terms in the period 2008–2018.
Selting and Loveridge (1992) defined the shift-share method (SSM) as a technique for decomposing employment patterns into expected (share) and differential (shift) components. For SSM analysis, they used spatial heterogeneities at the national and regional levels and examined the lateral variations in growth (i.e., the case of two regions with similar economic structures but with different growth performance) and investigate one industry performance level differentiated by region.
The SSM decomposes regional changes in employment growth during a period into the following components: national growth, industrial mix, and competitive effects.
E = employment level; i = number of sectors or industries in a region or nation (i = 1,2,..., s); j = the number of regions in a geographical area (j = 1,2,...r); Eij = employment in ith sector in jth region; ∆Eij = Change in employment in a certain industry (i) from region (j) during period [t-1: t];
The national growth effect is the “amount that total regional employment would have grown if it grew at precisely the same rate as total employment in the nation as a whole” (Stilwell, 1969). Regional industries grow at an approximate rate of national industries, unless the region has a comparative advantage or disadvantage (Bishop and Simpson, 1972; Selting and Loveridge, 1992).
Regions differ by their economic structures and performance. The sectoral pattern is specific to each region in terms of growth rate relative to the national average. In the SSM, the Industry Mix Effect dimension describes regional variations in industrial composition. Selting and Loveridge (1992) define industry mix as: “the amount of growth attributable to differences in the sectorial makeup of the region versus that of the nation. The summation of industry mixes over each industry in the region, IM0, provides a total industry mix effect for all sectors in the region. A positive total industry mix implies that the region specializes in industries that are experiencing greater growth than the overall national average. A negative total industry mix means that a region has higher-than-average proportions of people employed in industries that are sluggish relative to the average growth of all national industries.”
eio = the percentage change in nationwide employment for industry i;
Selting and Loveridge (1992) stated that the deviation from the total growth of an industry in a specific region that does not belong to the national growth effect or industry mix is the result of a competitive effect. This residual is the “shift” from the expected growth of the region if it follows the same rates as the national growth and industry mix.
The assumptions of SSM are also mentioned by Bishop and Simpson (1972), who state that the comparative advantage or disadvantage of a region results from the growth of regional economies that differ from the national rate. A positive effect is the faster growth of a specific industry in the analyzed region [Stevens and Moore, 1980, cited by Selting and Loveridge (1992)]. The national growth effect and industry mix partially cover employment growth, and the residual effect, or the competitive effect, can be explained by various factors unique to each region.
Fothergill and Gudgin (1979) presume that criticism of the SSM results partly from unrealistic expectations and the revealing capacity of differential components. In comparison, Selting and Loveridge (1992) identify the main limitation of the SSM, that is, the method describes if the regional conditions encourage or discourage economic growth but does not explain the reasons. They admit that the reasons for the shift-share competitive effects (otherwise called the endogenous growth effect) could be attributed to various factors, but the SSM cannot explain the factors working in each region.
eij = percentage change in employment in industry i, region j relative to the base year.
The sum of the national growth effect and the industry mix (NE0j + IM0j) is collectively called the region’s proportion/share of growth or the region’s exogenous growth effect. Together, national growth and industry mix reflect the potential growth that can occur if all regional industries follow the national trend (Selting and Loveridge, 1992).
From the ESDA techniques, we use the choropleth map, which represents the counterpart of the histogram of values/attributes for discrete spatial units with an associate color palette (Anselin, 2002). The maps use geocoded data, and we represent the variables using five classes of natural break (Jenks) classification. This classification technique is an optimization method for choropleth maps, minimizing variations in each group, applied in ArcGIS desktop 9.3. (ArcGIS 9.2. Desktop Help, 2008). In the first step, we analyze the pattern of SSM results for HDI following McHarg (1971), who overlays the region’s degree of urbanization profile driven by population density over the HDI-calculated variables. In the second step, we mapped the clusters to apply the Local Moran’s I that is identified with the Local Indicators of Spatial Association (LISA) technique. With this technique, we can find out if the identified pattern is random or clustered (Anselin, 2002). We applied the queen contiguity weight rule of the first order. Moran’s I spatial autocorrelation statistic is a cross-product statistic with inference based on permutation estimation (Anselin, 2002), knowing that a Moran’s index value near +1.0 indicates clustering, while an index value near −1.0 indicates dispersion.
At the national level, HDI sectors can stimulate employment and job creation, and this has been confirmed over the last decade. During the analyzed period 2008–2018, the findings show that the HDI sectors increased the employment, acts as growth engine and stimulate the smart jobs creation. The HDI sector increased the employment rate to 24.5%, nearly 2.5 times higher than the employment rate for the non-agricultural sectors, which was at 9.6%. Most of the analyzed non-agricultural and non-HDI sectors had low employment growth rates. The HDI growth engine was the J62–63 sector—IT services and other information—with an employment growth rate of 57%, more than double that of the HDI sector. Sector N: administrative and assistance activities, was above the HDI, Sectors M69–71: legal and accounting activities, M72: scientific research and development, and M73–75: advertising and market research, and other commercial services have values slightly (max 4pp) lower than the HDI average but higher than 20%, confirming the positive impact of digitization on employment in these sectors. At the regional level, the average rate of increase in employment in the HDI (2008–2018) is 29.8%, the urban environment achieves, on average, HDI employment growth rates higher than HDI in rural areas. In the HDI sector, the urban-rural gap is half that of the total employment (12.3 pp). The average employment growth rate during the period 2008–2018 in the HDI sector at NUTS 2 level higher than the average rates of total regional average employment in urban areas, and higher than the average employment rates in rural areas. Employment in the HDI has significant growth potential in rural areas.
Regardless of the country, the only sector with average growth rates of positive employment at the regional level in the period 2008–2018 was J62–63 (i.e., information services sector in rural regions).
Spatial distribution of the employment growth component due to the national component presents a center-periphery model concentrated predominantly in urban regions, as illustrated in Figure 1 and validated in Figure 2. In addition, these labor markets present the characteristics of Marshallian economies through neighborhood benefits. Based on ESDA analysis, applying Jenkins classification with 10 classes, marking the “0” manually, we identified 23 “champions,” respectively, in the regions with NEi > 19,049 people (red and deep red), as in Table 1.
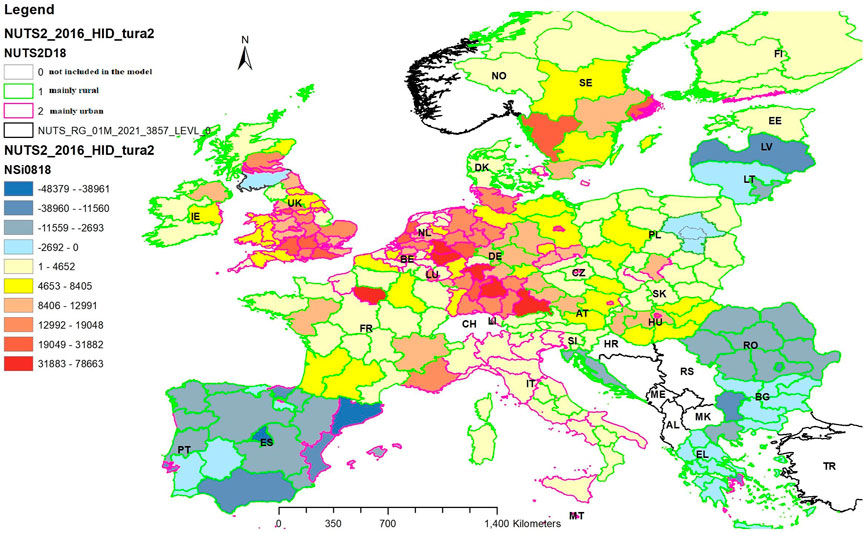
FIGURE 1. Change in Employment in high digital-intensive (HDI) sectors due to National Trends/National Growth Effect in the EU27 + UK + NO during 2008–2018 at the regional level.
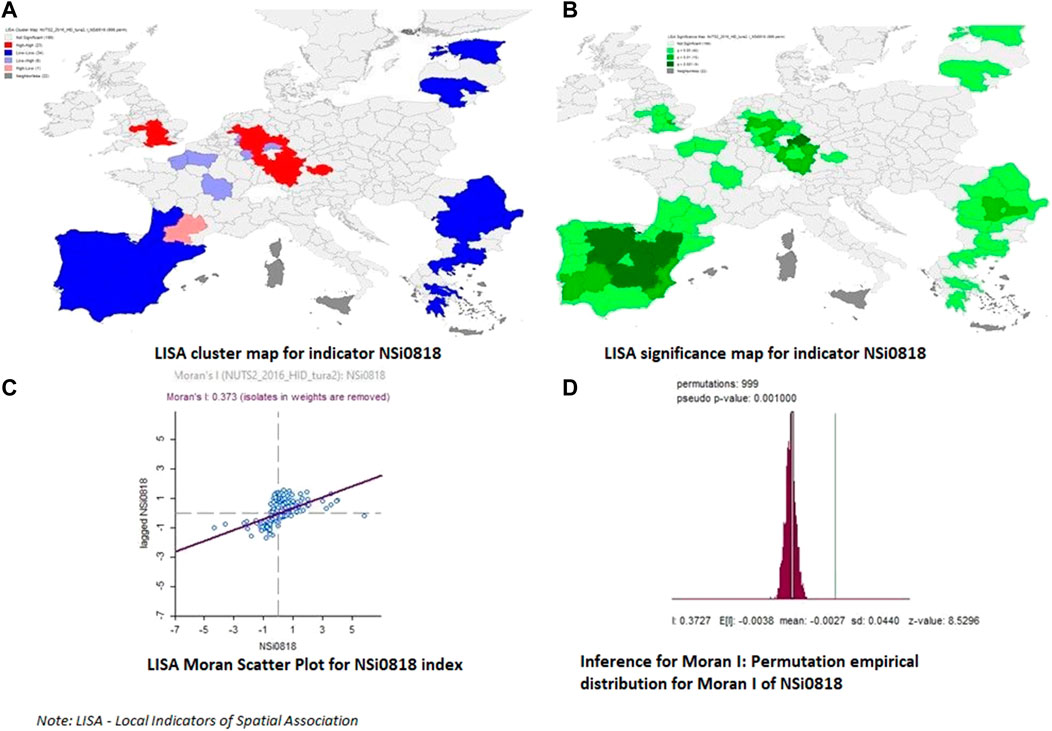
FIGURE 2. Local Indicators of Spatial Association (LISA) maps for regional NEi: High-High (HH) cluster identification, significance level, Moran I index, and its characteristics at 999 permutations.
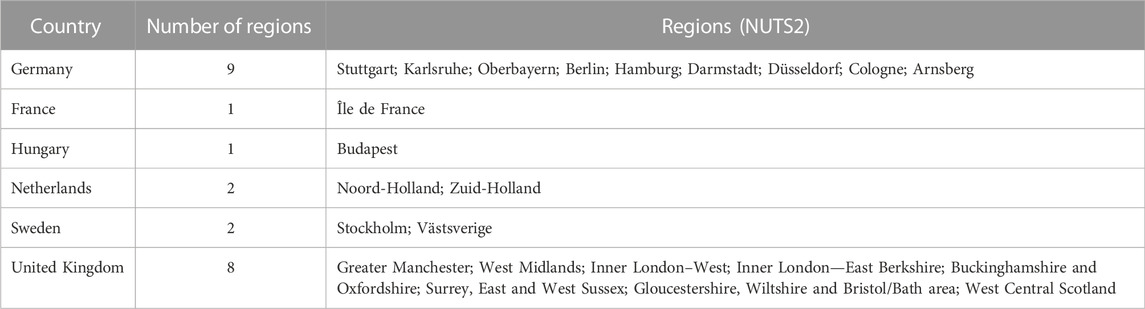
TABLE 1. High-high (HH) regions benefiting from the National Share/National Growth Effect.
The model covers 226 regions out of a total 290 regions. Romania does not have regions with NEi > 0, and also the other EU27 countries: Bulgaria (BG), Greece (EL), Spain (ES), Croatia (HR), Latvia (LV), and Portugal (PT).
The analysis of High-High (HH) clusters and extreme values (Moran Anselin Local Index)2 for the NEi component of the change in employment in HDI in 2008–2018 led to the rejection of the hypothesis of complete spatial randomness (CSR); therefore, the national NEi effect at the NUTS2 level presents a clustered spatial model.
The analysis of the regions with the national component of the HH cluster type, with characteristics such as the level and growth rate of employment, the degree of regional coverage and urbanization, and structural aspects of the HDI sector at the regional level, highlighted the fact of better performances. The average competitive regions have a structure of HDI sectors comparable to the structure for the average of all regions, except the case of the C29–30 sector, The average employment growth rate from to 2008–2018 for regions with competitive advantage is 35.3%, 5.5 pp higher than the regions’ average. The urban environment achieves, on average, employment growth rates of 35%, which is 1.8 pp lower than in rural areas.
The core regions in clusters with high HH values and competitive advantage seem concentrated in three countries: Germany with 14 regions, France with 8 regions, and the Netherlands with one region.
The enumerated regions show a strongly polarized Germany-France model (Figures 3, 4). The central core of the specialized regions covers Germany, Belgium, and the Netherlands, and is adjacent to France, a territory with regions characterized by the absence of trend specialization. Another exception is Greece, a country with regions characterized by the absence of a specialization trend but not neighboring an identified nucleus. It should be noted that some “islands” are also visible in regions that specialize in relatively isolated HDI sectors: Madrid, Paris, and Bucharest. Based on the ESDA analysis, by Jenkins classification with ten classes, marking “0” manually, we identified 23 “champions,” respectively, the regions with IMi > 74,657 people employed in the HDI sectors. The regions are listed in Table 2.
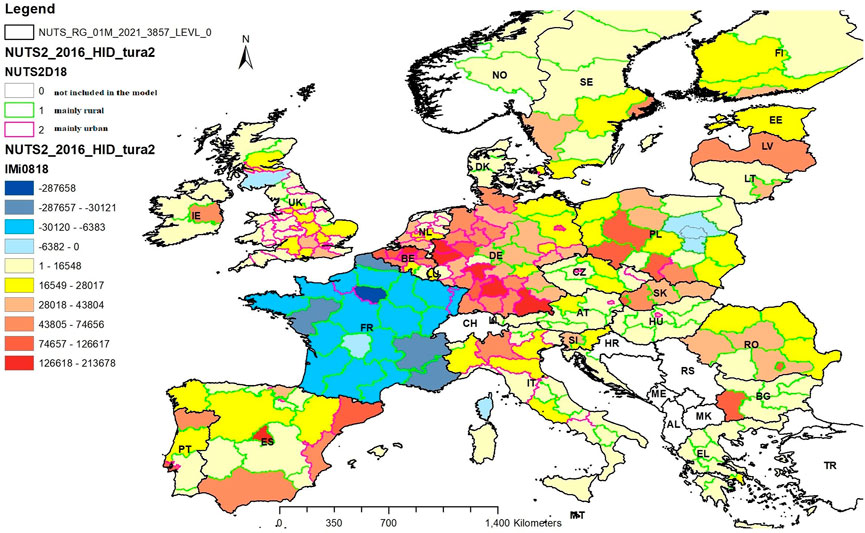
FIGURE 3. Change in Employment in high digital-intensive (HDI) sectors due to the Industrial Mix Effect in UE27 + UK + NO during 2008–2018 at the regional level.
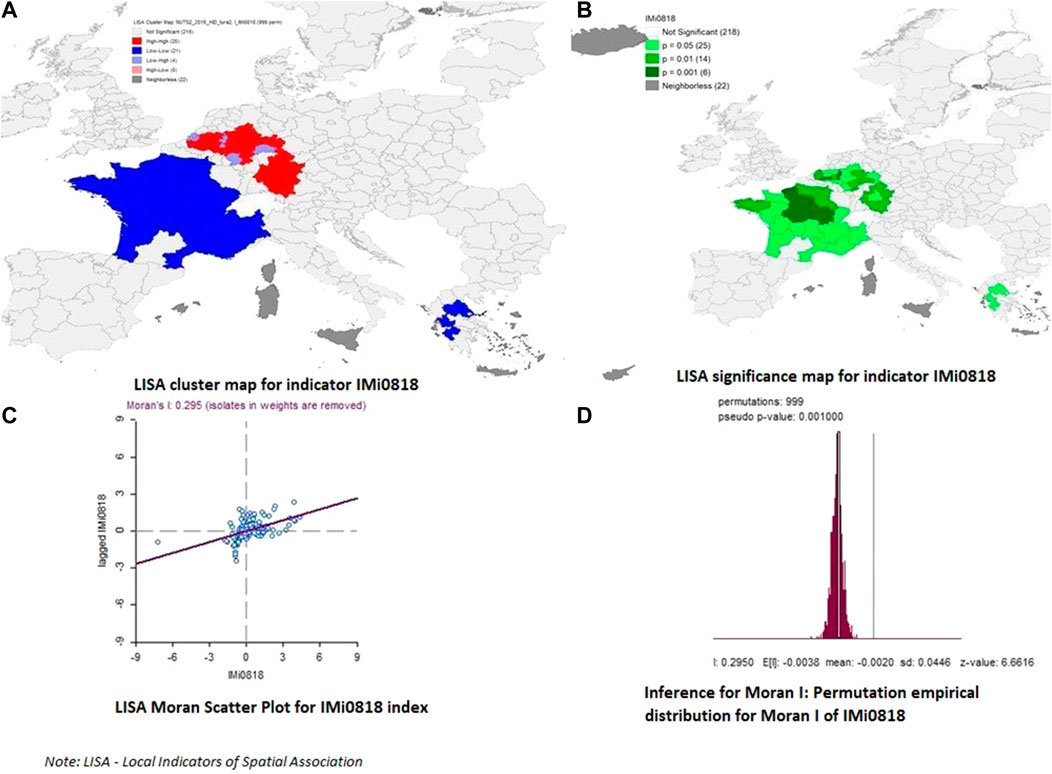
FIGURE 4. Local Indicators of Spatial Association (LISA) maps for regional IMi: HH cluster identification, significance level, Moran I index, and its characteristics at 999 permutations.
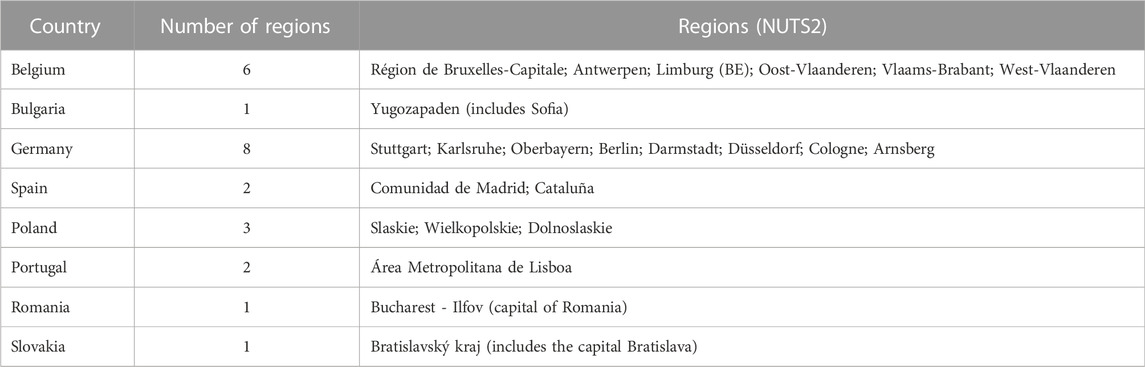
TABLE 2. HH regions benefiting from Industrial Mix.
It should be noted that France is the only country in the study group that does not have regions with a positive IMi.
The average of the specialized regions presents a structure of the HDI sectors that is comparable to the structure for all regions’ averages. The most considerable differences from the average of all regions are C29–30 higher by .6 pp and M69–71 higher by .5 pp. The average employment growth rate for the period 2008–2018 at the level of the region specializing in HDI is 35.9%, 6.1 pp higher than the regional average. The urban environment achieves, on average, an employment growth rate of 37.6%, about 3.3 pp higher than that in rural areas.
The analysis of HH (High-High) clusters and extreme values (Moran Anselin Local Index) for the IMi component of the change in occupancy in the HDI during the period 2008–2018 indicates that the observed spatial model is not the result of a random event. We reject the CSR hypothesis and conclude that the positive change in the HDI occupancy rate through the IMi specialization effect at the NUTS2 level presents a clustered spatial model.
The HH core regions with a tendency to specialize, with the Marshallian economies as a specialization feature, and the growth rates of employment in the HDI sectors in 2008–2018 are located in three countries: Germany with 12 regions, Belgium with 7 regions, and the Netherlands with 1 region. It should be noted that among the 20 regions, the Kassel is a predominantly rural region in Germany. It shows a specialization trend in the M73–75 sector, with an employment growth rate of 133.9%. The Mittelfranken region of Germany had the highest employment growth rate for the J61 sector for the period under review. Very high values of the increase in the employment rate are in the Antwerp region (Belgium) in sectors M69–72 (388.6%), M73–75 (279.1%), and N (184%). These sectors indicate a tendency to specialize, for instance, in some regions of Belgium and enjoy values over 70%: Région de Bruxelles-Capitale, Oost-Vlaanderen, Vlaams-Brabant, Limburg (BE), Liège, and Walloon Brabant.
The competitive effect shows a randomized spatial pattern, with a slight tendency to agglomerate in southern Germany and northwestern Austria, and in the vicinity of northeastern Italy, as illustrated in Figure 5 and validated in Figure 6. Northeast France and West Germany formed a contiguous area with an endogenous growth deficit. It should be noted that 22 “island” regions are also visible regions that have a tendency for endogenous growth in HDI sectors, selected with the criterion CEi .818 > 36,203 people:
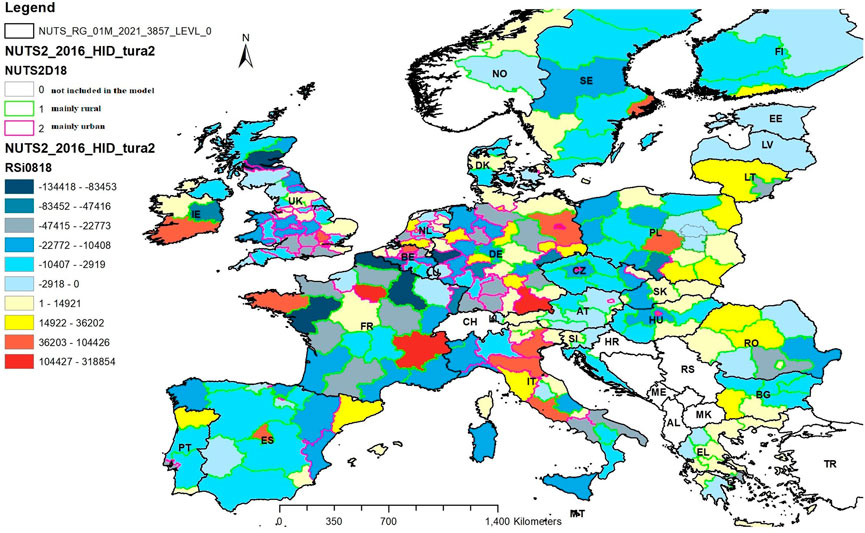
FIGURE 5. Change in Employment in HID due to Regional shift or Competitive Effect in UE27 + UK + NO during 2008–2018 period at the regional level.
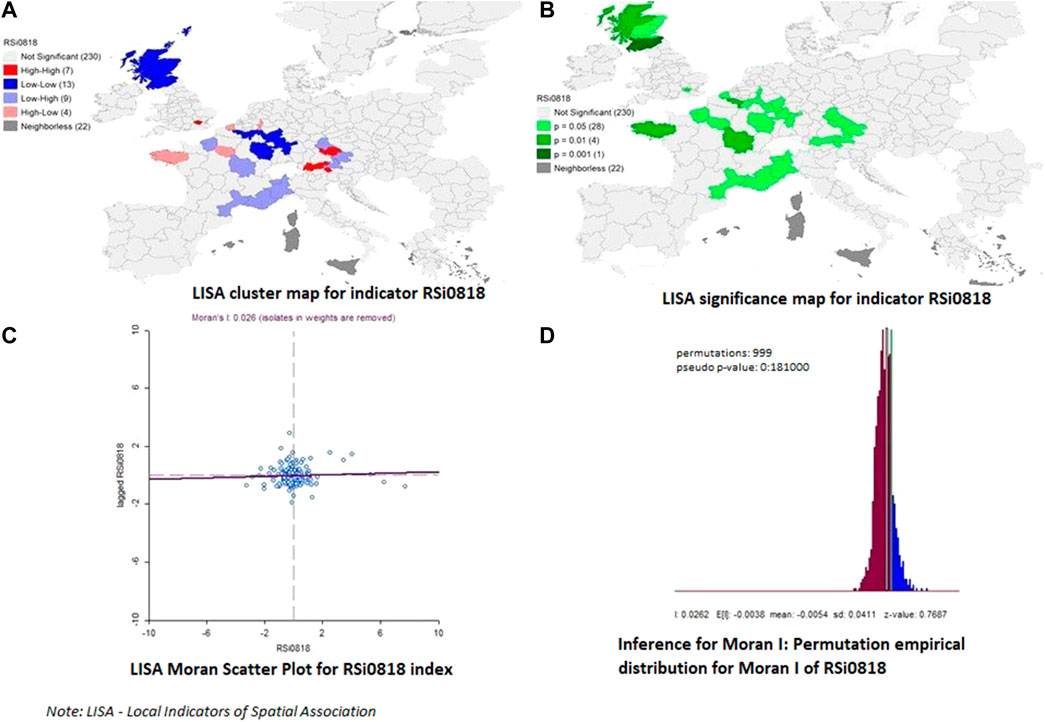
FIGURE 6. Local Indicators of Spatial Association (LISA) maps for regional CEi: HH cluster identification, significance level, Moran I index, and its characteristics at 999 permutations.
Endogenously growing regions are especially visible in large metropolises and big cities such as Madrid, Budapest, Prague, Stockholm and mega metropolises such as London, Berlin, or Paris. Megalopolises produce Jacobian and Morettian externalities in regions and indicate the capacity to produce and adopt radical innovation. This result is consistent with Chapple and Lester (2007), where the authors conclude that most resilient regions, in terms of capacity in labor-related community-based organizations, tend to be large, segregated cities that are restructuring into the New Economy.
There are five countries with no region with a CEi > 0 component: Czech Republic, Estonia, Luxembourg, Latvia, and Malta.
The HH core regions with positive endogenous employment growth and employment growth rates in the HDI sectors in 2008–2018 are Germany with one region, Austria with one region, and the United Kingdom with five regions. These regions are home to over 51.4 thousand people employed in the HDI. The nuclei formed by the Austrian Tyrol and German Niedebayern are mainly located in rural areas. The five United Kingdom regions (Outer London–West and Northwest, Inner London–West and Inner London East, Outer London–East and Northeast, and Outer London–South) are categorized as urban. These regions have over 1.83 thousand people, with employment growth rates of over 32% in sectors J62–63 and M69–72. These are non-core sectors characterized by consumption in the local and regional markets.
As a comprehensive result we can appreciate that the digital economy has positive externalities for the entire economy. This aspect is visible in Germany, Belgium, Ireland, Hungary, Slovenia, and Slovakia, which registered positive changes across most sectors of the economy, including the HDI sectors.
Towards the other studies the finding of this study are confirming the role of innovation in reducing the negative impact on the environment and support the positive effect on economic growth (Bahn-Walkowiak et al., 2020). Compared with the study developed by Cicerone et al. (2022) about the AI impact on regional socialization at NUTS3 level, our study is limited at NUTS2, but brings into discussion the HDI and both are concluding on the HH specialization potential. The industrial transformation 4.0 and smart specialization are discussed at the regional level by De Propris and Bailey (2020) pointing out the same conclusion of the need of a regional innovative policy. Riesener et al. (2019), Kristoffersen et al. (2020), Xue L. et al. (2022) and Jensen (2022) are highlighted the role of digitalization in circular economy without any regional development or specialization analysis, since Scott (2013) and Östh et al. (2015) are talking about the regional resilience, both beeing aproached by our study. Trevisan et al. (2021) reviewed 40 articles classified on three dimensions: digital transformation (DT), circular economy (CE) and sustainability, and a gap identified were “Empirical evidence about the benefits of DT for CE.” The present study addressed this gap and also the regional resilience, part of the sustainability, measuring the technological and geographical resilience. The study is addressing also the gap identified by Ghisellin et al. (2016) by providing a model of the regioal specialization and the use of HDI sector in CE.
Tables 1–3 are presenting the regions identified from the studied sample of 226, with the best results for national growth effect, industrial mix share and competitive effect. The spatial analysis is based on the difference of the regions, so, it was expected to not find homogeneity across the studied sample. A deep analysis can identify the main factors responsible for the heterogeneity of the regional development and the potential solution for cohesion.
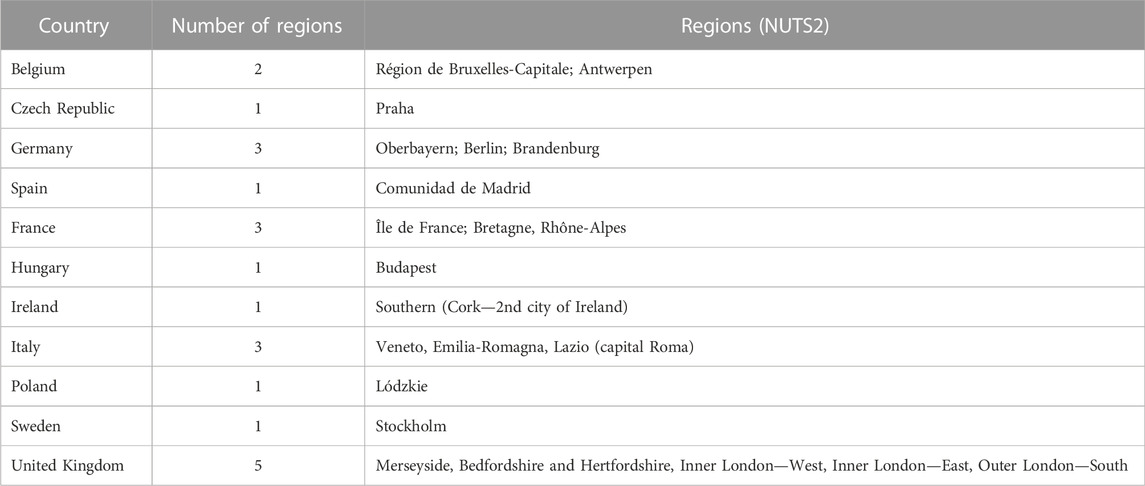
TABLE 3. HH regions benefiting from the Competitive Effect.
Our original contribution is the region’s degree of urbanization as a measure of connectivity, consistent with Boschma (2015). The spatial patterns of HDI sectors show data-sharing areas with large technological or cognitive proximity. The HDI sector is a tool to access and use innovations to solve problems, is resilient according to Boschma (2015), and develops new paths. The presence of HDI sectors indicates a high propensity to build a functional and efficient circular economy ecosystem. The general conclusions indicate that from the perspective of connectivity, it is evident that the HDI reflects a high degree of technological proximity in the Marshallian sense. Any region with a high level of HDI is potentially connected to a global network. According to Jensen (2021), these regions have created and participate in the global circular economy. The SSM analysis also highlighted that HDI employment is higher in regions with geographical connectivity. These regions exploit knowledge explicitly and tacitly and offer the apparent advantages.
Differentiation of the regional resilience potential is according to the type of base or non-base sector, given the local market size. Regions with sizeable endogenous growth have the highest degree of resilience, assured by their large local market dimensions.
The main findings are the two types of resilience, based on the technological and geographical connectivity of regions with a spatial labor market, for regions with competitive advantage and regions with a high level of specialization.
Our study contributes to resilience in rural areas (Scott, 2013). Based on our findings, decision-makers could focus on developing potential regions. They can use the findings, and if the region is more resilient than policies for a clean economy, renewed energy, then digital transformation and innovative business models are easier to implement. In the case of less resilient regions, the local authority should focus on stimulating resilience in the HDI sectors as the lever for developing a clean and green economy and sustainable business.
The success of green transition, in the context of convergence with digital transition, is dependent on the region’s path, performance, and previous experience. Cicerone et al. (2022) concluded that artificial intelligence (AI) and the Geography of Eco-Innovation that AI helps regions specialize in new green technologies, provided they have already done so in the past, while it reduces this capacity in specialized regions that are not already green. Bahn-Walkowiak et al. (2020) remarked that recent European policies (i.e., the European Green Deal, Circular Economy Action Plan and Biodiversity Strategy, and Zero Pollution ambition) have a strong synergy with digitalization, following similar trends (Bahn-Walkowiak, 2020).
The maps obtained in this study illustrate 10 years of dynamics of the new spatial digital economy and document a spatially heterogeneous pattern of HDI sector presence. The HDI sectors are adopting radical innovation. This pattern could explain the short-term recovery trend after the 2009–2010 economic and financial crises, which has been slow and uneven across European countries (OECD 2012). The uneven spatial distribution of HDI accelerates the segmentation of labor market profiles and spatial inequalities, according to Fischer and Njikamp (1987). In regions with HDI sectors, the urban-rural gap tends to decrease significantly. Our results provide insights that are essential for implementing digital and green transformation.
The corollary conclusion is that this study contributes to the identification of regions with HH and presence of HDI estimated through labor involved in digitalization. Identified regions are most sensitive to circular economies and green or clean economies. We also identify regions “with potential” and those that require strong support to change their economic strategy.
A limit of the research is the existence of data only at the NUTS 2 level, the level of relative granularity (Östh et al., 2015). It would have been better to have them at NUTS 3 level, but the collecting is just being considered. Another potential limitation is the relatively old sectoral taxonomy of digital intensity (Calvino et al., 2018). The digitalization is dependent on space and its development is not uniform. The lack of a qualitative indicator that gives an image of the circular economy, leads to the non-existence of a standardized statistic between the environmental economy and the degree of digitization. The complexity of the subject acts as a limitation due to the assumed simplifications of the real situation for the construction of the model, along with the known limitations introduced by the research methodology used.
The implication highlighted by the present research is the use of HDI sector as engine for circular economy. The decrease in carbon emissions can be addressed by closing polluting capacities or upgrading. Through digitization, resources are managed better and the existing capacities changed to clean. The role of smart jobs is to produce the best solution for the nowadays challenges, better managing the high skilled professionals and talent for innovation production.
A potential future research dimension could be the characterization of the speed of technological progress across sectors in terms of digital transformation. The big data usage or innovative business, the connectivity of the sectors or regions, the intensity and efficiency of the work in relation with the digital transformation are potential developments. A sectorial analysis of the circular economy implementation and the digital transformation can highlight the fast economic areas to this challenge.
Publicly available datasets were analyzed in this study. This data can be found here: The data analysed for this study can be found in the Eurostat data (sbs_r_nuts06_r2) at the link https://ec.europa.eu/eurostat/web/products-datasets/-/sbs_r_nuts06_r2 demo_r_d3dens] at the link Population density by NUTS 3 region–Products Datasets–Eurostat (europa.eu) [TEC00112] at the link Employment, domestic concept–Total–Products Datasets–Eurostat (europa.eu).
AG and CL were the principal investigators for this paper and wrote the first draft. SCP was the supervisor and the final verification of the manuscris. FMP, ELC si HTS contributed with data colection, data analysis, interpretation. All authors contribute to draft revision and improvement of the findings and conclusions. All authors contributed to the article and approved the submitted version.
This work was supported by a grant from the Romanian Ministry of Research, Innovation, and Digitalization (MCID) for the Project Functional perspectives of local labor markets in Romania, in the context of a smart and innovative economy, PN 19130101.
This publication was supported by the EEA Financial Mechanism (2014–2021) through the Project School of Knowledge Production and Transfer for Global Economy and Governance, contract number 18-COP-0032. The content does not reflect the official opinions of the Programme Operator, the National Contact Point, and the Financial Mechanism Office. The responsibility for the information and views expressed therein lies entirely with the authors.
The authors declare that the research was conducted in the absence of any commercial or financial relationships that could be construed as a potential conflict of interest.
All claims expressed in this article are solely those of the authors and do not necessarily represent those of their affiliated organizations, or those of the publisher, the editors and the reviewers. Any product that may be evaluated in this article, or claim that may be made by its manufacturer, is not guaranteed or endorsed by the publisher.
1NUTS (nomenclature of territorial units for statistics) is a hierarchical system for dividing the economic territory of the EU and the United Kingdom, for collection, development and harmonization of regional statistics. NUTS 2 are the basic regions for the application of regional policies in the EU (Eurostat).
2High-High (HH) clusters and extreme values (Moran Anselin Local Index) is a cluster and outlier analysis tool that identifies spatial clusters of features with high or low values. Detailed information is available at https://pro.arcgis.com/en/pro-app/2.9/tool-reference/spatial-statistics/h-how-cluster-and-outlier-analysis-anselin-local-m.htm.
Anselin, L. (2019). A local indicator of multivariate spatial association: Extending Geary’s c. Geogr. Anal. 51, 133–150. doi:10.1111/gean.12164
Anselin, L. (2010). Local indicators of spatial association-LISA. Geogr. Anal. 27, 93–115. doi:10.1111/j.1538-4632.1995.tb00338.x
Anselin, L. (2002). Under the hood issues in the specification and interpretation of spatial regression models. Agric. Econ. 27, 247–267. doi:10.1111/j.1574-0862.2002.tb00120.x
Antikainen, M., Uusitalo, T., and Kivikytö-Reponen, P. (2018). Digitalisation as an enabler of circular economy. Procedia CIRP. 10th CIRP Conference on Industrial Product-Service Systems, Linköping, Sweden. 73, 45–49. doi:10.1016/j.procir.2018.04.027
Bahn-Walkowiak, B. (2020). Eco-innovation observatory: Country profile 2018–2019 Germany. https://ec.europa.eu/environment/ecoap/sites/default/files/field/field-country-files/eio_country_profile_2018-2019_germany.pdf.
Bahn-Walkowiak, B., Magrini, C., Berg, H., Gözet, B., Beck-O’Brien, M., Arjomandi, T., et al. (2020). Eco-innovation and digitalisation case studies, environmental and policy lessons from EU member states for the EU green deal and the circular economy. EIO Biennial Report 2020) https://ec.europa.eu/environment/ecoap/sites/ecoap_stayconnected/files/eio5_eco-innovation_and_digitalisation_nov2020.pdf (Eco-innovation Observatory.
Barzotto, M., Corradini, C., Fai, F. M., Labory, S., and Tomlinson, P. R. (2020). in Revitalising lagging regions: Smart specialisation and Industry 4.0. Editors M. Barzotto, C. Corradini, F. M. Fai, S. Labory, and P. R. Tomlinson 1st ed. (London: Routledge). doi:10.4324/9780367422745
Béné, C., Headey, D., Haddad, L., and von Grebmer, K. (2016). Is resilience a useful concept in the context of food security and nutrition programmes? Some conceptual and practical considerations. Food Sec 8, 123–138. doi:10.1007/s12571-015-0526-x
Bishop, K. C., and Simpson, C. E. (1972). Components of change analysis: Problems of alternative approaches to industrial structure. Reg. Stud. 6 (1), 59–68. doi:10.1080/09595237200185051
Boschma, R. (2005). Proximity and innovation: A critical assessment. Reg. Stud. 39, 61–74. doi:10.1080/0034340052000320887
Boschma, R. (2015). Towards an evolutionary perspective on regional resilience. Reg. Stud. 49, 733–751. doi:10.1080/00343404.2014.959481
Calvino, F., Criscuolo, C., Marcolin, L., and Squicciarini, M. (2018). A taxonomy of digital intensive sectors, OECD Sci. Technol. Industry Work. Pap. Number 2018/14. Paris: OECD Publishing. doi:10.1787/f404736a-en
Chapple, K., and Lester, W. (2007). “Emerging patterns of regional resilience,” in Working paper for the building resilient regions network (Berkeley: Institute of Urban and Regional Development, University of California). doi:10.13140/RG.2.2.14903.88481
Cicerone, G., Faggian, A., Montresor, S., and Rentocchini, F. (2022). Regional artificial intelligence and the geography of environmental technologies: Does local AI knowledge help regional green-tech specialization? Reg. Stud. 1, 1–14. doi:10.1080/00343404.2022.2092610
De Propris, L., and Bailey, D. (2020). Industry 4.0 and regional transformations (taylor & francis). London, United Kingdom: Rouledge, 276.
Feser, E. J. (2002). Tracing the sources of local external economies. Urban Stud. 39, 2485–2506. doi:10.1080/0042098022000027077
Fischer, M. M., and Nijkamp, P. (1987). “Regional labour markets: Some concluding reflections,” in Regional labour markets: Analytical contributions and cross-national comparisons. Editors M. M. Fischer,, and P. Nijkamp (North-Holland, 485–488.
Foray, D. (2014). Smart specialisation: Opportunities and challenges for regional innovation policy. 1st ed. London: Routledge. doi:10.4324/9781315773063
Fothergill, S., and Gudgin, G. (1979). In defence of shift-share. Urban Stud. 16, 309–319. doi:10.1080/713702551
Frenken, K., Van Oort, F., and Verburg, T. (2007). Related variety, unrelated variety and regional economic growth. Reg. Stud. 41, 685–697. doi:10.1080/00343400601120296
Gallea, Q. (2019). “Arming opposition: Measuring the effect of arms transfers on internal conflict,” in Université de Lausanne, faculté des HECC. de Recherches economiques du Département d’économie (19.10 Lausanne: Cahiers de Recherches Economiques Du Département d’économie, 1–59. https://ideas.repec.org/p/lau/crdeep/19.10.html (Département d’Économie.
Ghisellini, P., Cialani, C., and Ulgiati, S. (2016). A review on circular economy: The expected transition to a balanced interplay of environmental and economic systems. J. Clean. Prod. 114, 11–32. doi:10.1016/j.jclepro.2015.09.007
Hassink, R. (2010). Regional resilience: A promising concept to explain differences in regional economic adaptability? Camb. J. Reg. Econ. Soc. 3, 45–58. doi:10.1093/cjres/rsp033
Henderson, J. V. (2003). High-high. (HH) clusters and extreme values (moran Anselin local index) is a cluster and outlier analysis tool identifies spatial clusters of features with high or low values. Marshall’s scale Econ. J. Urban Econ. 53, 1–28. doi:10.1016/S0094-1190(02)00505-3
Holling, C. S. (1973). Resilience and stability of ecological systems. Annu. Rev. Ecol. Syst. 4, 1–23. doi:10.1146/annurev.es.04.110173.000245
Ilić, M. P., Ranković, M., Dobrilović, M., Bucea-Manea-Țoniş, R., Mihoreanu, L., Gheța, M. I., et al. (2022). Challenging novelties within the circular economy concept under the digital transformation of society. Sustainability 14, 702. doi:10.3390/su14020702
Ingemarsdotter, E., Jamsin, E., Kortuem, G., and Balkenende, R. (2019). Circular strategies enabled by the internet of things - a framework and analysis of current practice. Sustainability 11, 5689. doi:10.3390/su11205689
Jackson, R. W., and Haynes, K. E. (2020). “Shift–share analysis,” in International encyclopedia of human geography (Elsevier), 199–205. doi:10.1016/B978-0-08-102295-5.10134-9
Jacobs, J. (1969). The city. The economy of the cities, 58. New York: Jane Jacobs. Random House, 201 East 50th StreetNatl Civic Rev., 268447–268448. doi:10.1002/ncr.4100580916
Jacobs, J. (1961). The Death and Life of great American cities. New York City: Vintage Books A Division of Random House.
Jensen, H. H. (2022). Circular economy. How digitalization can help build a circular economy ecosystem. https://www.weforum.org/agenda/2022/08/why-a-global-circular-economy-requires-a-digital-business-ecosystem/.
Jensen, H. H. (2021). Why digitalization is critical to creating a global circular economy. https://www.weforum.org/agenda/2021/08/digitalization-critical-creating-global-circular-economy/.
Jonard, F., Lambotte, M., Ramos, F., Terres, J. M., and Bamps, C. (2009). Delimitations of rural areas in europe using criteria of population density, remoteness and land cover (EUR), 23757 EN-2009, JRC. https://publications.jrc.ec.europa.eu/repository/bitstream/JRC49927/reqno_jrc49927_rural_typologies_final_report[1].pdf.57.
Kristoffersen, E., Blomsma, F., Mikalef, P., and Li, J. (2020). The smart circular economy: A digital-enabled circular strategies framework for manufacturing companies. J. Bus. Res. (Elsevier) 120 (4), 241–261. doi:10.1016/j.jbusres.2020.07.044
Martin, R. (2012). Regional economic resilience, hysteresis and recessionary shocks. J. Econ. Geogr. 12 (1), 1–32. doi:10.1093/jeg/lbr019
Matlaba, V. J., Holmes, M. J., McCann, P., and Poot, J. (2012). Classic and spatial shift-share analysis of state-level employment change in Brazil. Dep. Econ. Work. Pap. Ser., 656. https://hdl.handle.net/10289/6692.
Modica, M., and Reggiani, A. (2014). An alternative interpretation of regional resilience: Evidence from Italy. ERSA Conf. Pap. Available at: article ersa14p369 https://ideas.repec.org/p/wiw/wiwrsa/ersa14p369.html.
Modica, M., Reggiani, A., and Nijkamp, P. (2019). “Vulnerability, resilience and exposure: Methodological aspects,” in Advances in spatial and economic modeling of disaster impacts. Editors Y. Okuyama,, and A. Rose (Springer International Publishing), 295–324. doi:10.1007/978-3-030-16237-5_12
Modica, M., Reggiani, A., and Njikamp, P. (2018). SEEDS sustainability environmental economics and dynamics. Studies/Working Paper, 13http://www.sustainability-seeds.org/papers/RePec/srt/wpaper/1318.pdf.Vulnerability, resilience and exposure: Methodological aspects and an empirical applications to shocks
Moretti, E. (2003). Human capital externalities in cities chapter 8 Handbook of Urban and regional economics. Cambridge Human Capital Externalities in Cities | NBER. doi:10.3386/w9641
Moretti, E. (2004). Workers’ education, spillovers, and productivity: Evidence from plant-level production functions. Am. Econ. Rev. 94, 656–690. doi:10.1257/0002828041464623
Moroz, V., and Dyma, V. (2020). Zeszyty Naukowe Państwowej Wyższej szkoły Zawodowej im, 3.Digital transformation of public management system as a key factor for “greening” economy of Ukraine.Witelona Legn.
Nasiri, M., Tura, N., and Ojanen, V. (2017). Developing disruptive innovations for sustainability: A review on impact of internet of things (iot). Proceedings, 1–10. doi:10.23919/PICMET.2017.8125369
Neligan, A., Baumgartner, R. J., Geissdoerfer, M., and Schöggl, J.-P. (2022). Circular disruption: Digitalisation as a driver of circular economy business models. Bus. Strategy Environ. doi:10.1002/bse.3100.NUTS
OECD (2019). Measuring the digital transformation. Paris: A Roadmap for the Future, Organization for Economic Co-operation and Development Publishing. doi:10.1787/9789264311992-en
OECD (2020). OECD employment outlook 2020: Worker security and the COVID-19 crisis. Paris: OECD Publishing. doi:10.1787/1686c758-en
OECD (2012). What makes labour markets resilient during recessions? OECD Employ. Outlook (OECD), 53–107. doi:10.1787/empl_outlook-2012-3-en
Östh, J., Reggiani, A., and Galiazzo, G. (2015). Spatial economic resilience and accessibility: A joint perspective. Comput. Environ. Urban Syst. 49, 148–159. doi:10.1016/j.compenvurbsys.2014.07.007
Pieroni, M. P. P., McAloone, T. C., and Pigosso, D. C. A. (2019). Business model innovation for circular economy and sustainability: A review of approaches. J. Clean. Prod.215. Elsevier Ltd, 198–216. doi:10.1016/j.jclepro.2019.01.036
Pimm, S. L. (1984). The complexity and stability of ecosystems. Nature 307, 321–326. doi:10.1038/307321a0
Porter, M. E., and Heppelmann, J. E. (2014). How smart, connected products are transforming competition. Harv. Bus. Rev. 92, 64.
Reggiani, A. (2013). Network resilience for transport security: Some methodological considerations. Transp. Policy 28, 63–68. doi:10.1016/j.tranpol.2012.09.007
Riesener, M., Dölle, C., Mattern, C., and Kreß, J. (2019). Circular economy: Challenges and potentials for the manufacturing industry by digital transformation, 2019 IEEE international Symposium on Innovation and entrepreneurship. Puerto Rico: TEMS-ISIE, 1–7. doi:10.1109/TEMS-ISIE46312.2019.9074421
Ruault, J., and Schaeffer, Y. (2020). Scalable shift-share analysis: Novel framework and application to France. Pap. Reg. Sci. 99, 1667–1690. doi:10.1111/pirs.12558
Schwab, K. (2019). The global competitiveness report 2019. Geneva: World Economic Forum, 666. http://www3.weforum.org/docs/WEF_TheGlobalCompetitivenessReport2019.pdf.
Scott, M. (2013). Resilience: A conceptual lens for rural studies?: Rural resilience. Geogr. Compass. 7, 597–610. doi:10.1111/gec3.12066
Selting, A. C., and Loveridge, S. (1992). Staff Paper Series. Staff Paper p92-13.A summary of the literature on shift-share analysis.
Stevens, B. H., and Moore, C. L. (1980). A critical review of the literature on shift-share as a forecasting technique. J. regional Sci. 20 (4), 419–437. doi:10.1111/j.1467-9787.1980.tb00660.x
Stilwell, F. J. (1969). Regional growth and structural adaptation. Urban Stud. 6 (2), 162–178. doi:10.1080/00420986920080241
Trevisan, A. H., Zacharias, I. S., Liu, Q., Yang, M., and Mascarenhas, J. (2021). Circular economy and digital technologies: A review of the current research streams. Proc. Des. Soc. Int. Conf. Eng. Des. (Gothenburg, Swed. 1, 621–630. doi:10.1017/pds.2021.62
van Dijk, J., and Edzes, A. (2016). Towards inclusive and resilient regional labour markets: Challenges for research and policy. Investig. Reg. J. Reg. Res. 36, 169–190.
Xiaole, W., and Piscunova, L. P. (2022). The challenges of digital transformation and renewable energy management for the green economy transition. Российские регионы в фокусе сборник докладов. Том 1.—Екатеринбург. 2021, 253–265.
Xue, C., Shahbaz, M., Ahmed, Z., Ahmad, M., and Sinha, A. (2022a). Clean energy consumption, economic growth, and environmental sustainability: What is the role of economic policy uncertainty? Renew. Energy. 184, 899–907. doi:10.1016/j.renene.2021.12.006
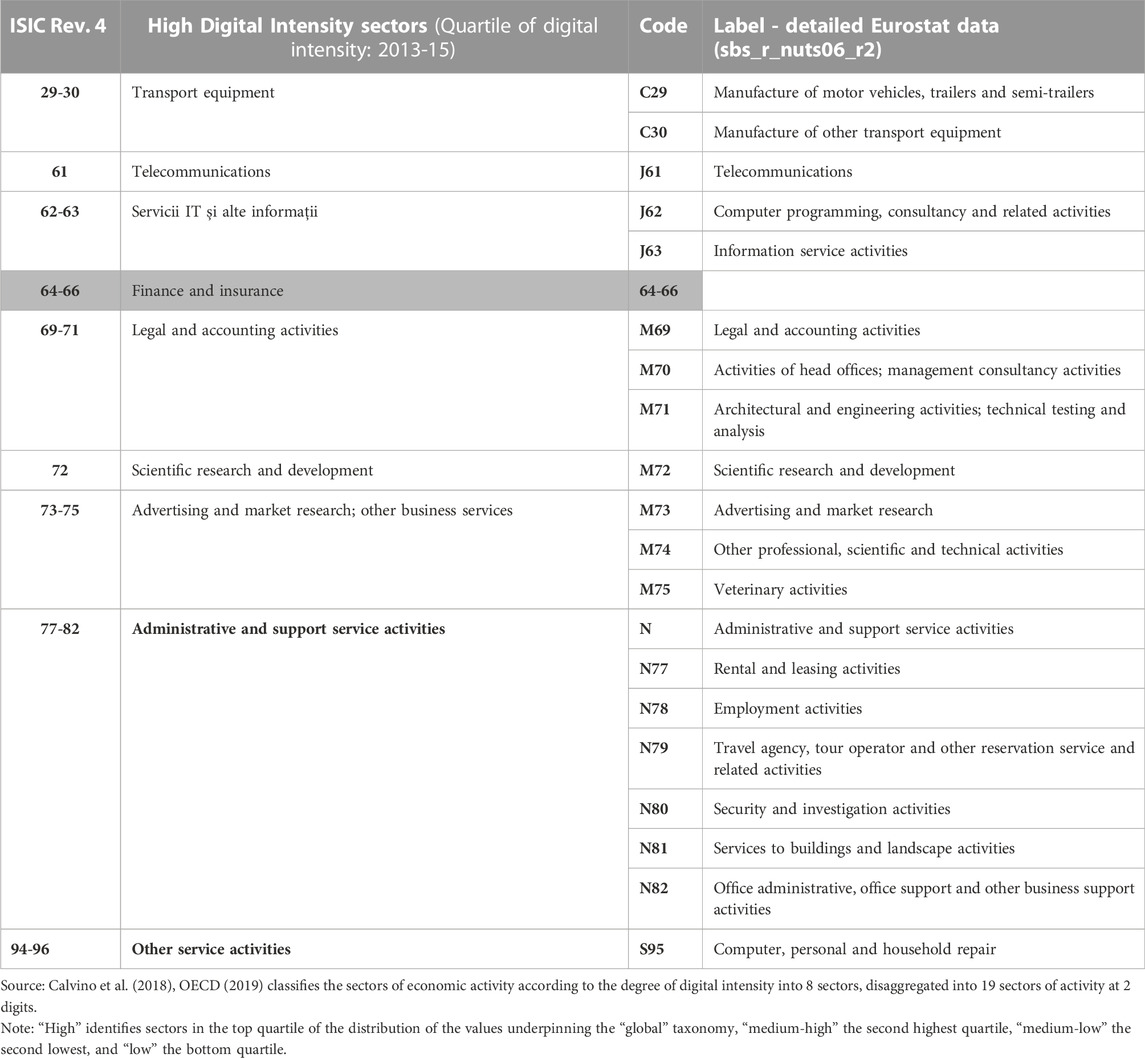
TABLE A1. Sectoral taxonomy of digital intensity: a “global” indicator.
Keywords: digital intensive sectors, digital transformation, regional competitiveness, clean economy, job resilience, sustainability
Citation: Pirciog SC, Grigorescu A, Lincaru C, Popa FM, Lazarczyk Carlson E and Sigurdarson HT (2023) Mapping European high-digital intensive sectors—regional growth accelerator for the circular economy. Front. Environ. Sci. 10:1061128. doi: 10.3389/fenvs.2022.1061128
Received: 04 October 2022; Accepted: 12 December 2022;
Published: 06 January 2023.
Edited by:
Zahid Yousaf, Government College of Management Sciences Mansehra, PakistanReviewed by:
Eglantina Hysa, Epoka University, AlbaniaCopyright © 2023 Pirciog, Grigorescu, Lincaru, Popa, Lazarczyk Carlson and Sigurdarson. This is an open-access article distributed under the terms of the Creative Commons Attribution License (CC BY). The use, distribution or reproduction in other forums is permitted, provided the original author(s) and the copyright owner(s) are credited and that the original publication in this journal is cited, in accordance with accepted academic practice. No use, distribution or reproduction is permitted which does not comply with these terms.
*Correspondence: Adriana Grigorescu, YWRyaWFuYS5ncmlnb3Jlc2N1QHNuc3BhLnJv
†These authors have contributed equally to this work and share first authorship
‡These authors have contributed equally to this work and share senior authorship
Disclaimer: All claims expressed in this article are solely those of the authors and do not necessarily represent those of their affiliated organizations, or those of the publisher, the editors and the reviewers. Any product that may be evaluated in this article or claim that may be made by its manufacturer is not guaranteed or endorsed by the publisher.
Research integrity at Frontiers
Learn more about the work of our research integrity team to safeguard the quality of each article we publish.