 Jing Ye1
 Jinkai Li
- 1School of Economics, Shanghai University, Shanghai, China
- 2School of Social Development and Public Policy, Fudan University, Shanghai, China
China’s environmental problems are emerging with the continuous development of the economy and urbanization. The study of the impact of urban spatial structure on environmental efficiency has important significance concerning exploring ways to reduce the environmental cost of economic activity. Based on the fusion-corrected DMSP-OLS and NPP-VIIRS nighttime light data, this paper constructs spatial structure indicators of 276 prefecture-level cities and then empirically tests the impact of urban spatial structure on environmental efficiency using a fixed-effects model. The results show that: 1) The monocentric spatial structure has higher environmental efficiency than the polycentric spatial structure. 2) The mechanism analysis shows that the monocentric spatial structure could improve environmental efficiency through learning, sharing, and matching. 3) Population size and density have a robust moderating effect that when the resident population size of a city is more than 5 million or the population density is beyond 280 persons/km2, the monocentric spatial structure has a negative impact on environmental efficiency. In contrast, the polycentric spatial structure is more effective. 4) The point-based household registration policy adopted by the government to control population size has no significant impact on environmental efficiency, while the environmental information disclosure policy can effectively play a role. Our findings provide a basis for the Chinese government to formulate urban planning and environmental protection policies and offer the experience to other developing countries.
1 Introduction
China’s economic growth has driven rapid urban development, with the urbanization rate growing from 20.16% in 1981 to 63.9% in 2020, and the current city scale is still in the expansion phase (Mou et al., 2018). Although the rapid development of urbanization in China has brought an agglomeration effect to the economy, it has also paid a substantial environmental cost. Take air pollution as an example: according to the Bulletin on China’s Ecology Environment, 53.4% of the 337 prefecture-level cities in China exceeded ambient air quality standards in 2019. Facing environmental problems, academics and policymakers have been discussing various policies to achieve sustainable environmental development, such as urban planning policies (Burgalassi and Luzzati, 2015), renewable energy policies (Zhao et al., 2022), and environmental information disclosure policies (Du et al., 2022).
Urban spatial structure is a depiction of population distribution in space and a spatial reflection of urban development degree and process (Horton and Reynolds, 1971). Whether the urban spatial structure is reasonable not only affects the optimal allocation of factors, but also its monocentric and polycentric distribution characteristics and agglomeration and dispersion state can have a massive spillover effect on the environment (Liu et al., 2022). The existing literature mainly focuses on the impact of urban population density, scale, and urban spatial structure on environmental pollutants but neglects the impact on environmental efficiency (Tao et al., 2020). Different from pollutants, environmental efficiency (EE) mainly refers to the impact of various elements in economic activities on the environment within a certain period. It is expressed as the proportion of economic output and environmental impact, and thus it can reflect the environmental cost of economic activity. Because of containing five indicators (CO2 emissions, waste burial and disposal, COD, NOx emissions, PRTE emissions, and movement) to examine environmental pollution from five aspects (global warming, increased waste, water pollution, air pollution, and soil pollution), it is a more comprehensive reflection of environmental pollution than the index of a single pollutant. In addition, it effectively combines urban economy and environmental pollution, thus being an indicator reflecting sustainable urban development from both economic and environmental aspects.
Based on the theory and reality, this paper proposes the following questions: 1) Which kind of urban spatial structure can improve environmental efficiency? 2) What are the mechanisms by which urban spatial structure affects environmental efficiency? 3) Is there heterogeneity in the impact of urban spatial structure on environmental efficiency? The answers to these questions can provide theoretical support for the government to formulate urban planning policies to help achieve environmentally sustainable development.
The contributions to the existing literature in this paper are as follows: 1) We focus on the impact of urban spatial structure on environmental efficiency, effectively integrating urban economic and environmental resource constraints to reflect the contribution of spatial structure to environmental sustainability, which fills the gap in the current literature in this field. 2) The sharing, learning, and matching mechanisms are introduced into the research framework, which uncovers three primary paths through which urban spatial structure affects environmental efficiency. 3) We discuss the moderating effect of population size and population density on the impact of urban spatial structure on environmental efficiency. 4) We prove that the implementation of a household registration system to control the urban population size does not lead to the improvement of environmental efficiency, while the environmental information disclosure policy is quite effective, offering a reference to other developing countries.
The remainder of this paper is organized as follows. Section 2 presents the literature review and hypotheses. Section 3 describes the methodology and variable and gives the summary statistics. Section 4 presents the empirical test results of the hypotheses. Section 5 is the further study. Section 6 includes the conclusion and the policy implications. The correction process of nighttime light data is shown in the Additional Files.
2 Literature review and hypotheses
2.1 Literature review
There is a long-running controversial debate about the choice of monocentric or polycentric oriented spatial structure and their relationship to environmental pollution. Some studies have shown that monocentric spatial structure can produce agglomeration effects (Yuan et al., 2018; Han et al., 2020), which can not only promote the upgrading of industrial structure and economic growth (Otsuka et al., 2014) but also be conducive to improving resource utilization efficiency and reducing environmental pollution (Tao et al., 2019; Zhao et al., 2019). Glaeser and Kahn (2010) took 66 cities in the United States as objects to explore the impact of urban density and compactness on air quality. The results showed that high-density urban spatial structure could significantly inhibit the pollutants emissions. Similarly, Veneri and Burgalassi (2012) found that polycentric spatial structure increases Green House Gas (GHG) emissions using the Italian NUTS-2 region as a study.
However, some scholars believe that the monocentric spatial structure generates congestion effects and brings negative externalities to urban development (Sun et al., 2022), leading to strained urban resource use and increased pollutant emissions (Li et al., 2019; Clark et al., 2011; Cho and Choi, 2014). The polycentric spatial structure and the decentralized urban form can achieve balanced urban development and enhance the development dynamics of small and medium-sized cities, thereby alleviating the environmental pollution of large cities (Tao et al., 2020). Wang and Zhang (2020) found that in China for every 1% increase in the polycentric index of prefecture-level cities, PM2.5 concentration decreased by 1.46%–2.67%.
The existing literature has laid a good theoretical foundation for our research. However, there are still some deficiencies: 1) Existing studies have focused on the impact of urban spatial structure on economic development or environmental pollutants, while few studies focused on the relationship between urban spatial structure and environmental efficiency. Studies of pollutants do not integrate the economy with the environment and cannot effectively reflect the environmental cost of economic activity. 2) Previous studies have not paid enough attention to heterogeneity analysis. Some studies have mentioned spatial scale (Burgalassi and Luzzati, 2015), but city size and density might moderate the effects of urban structure on environmental pollution (Larkin et al., 2016), while no further explanations and empirical evidence were provided.
This paper provides a comprehensive treatment of these gaps. We use panel data from 276 prefecture-level cities in China to deeply explore the impact of urban spatial structure on environmental efficiency. Besides, with the interaction terms of spatial structure and population size, spatial structure and population density included in the regression model, respectively, we investigate the moderating effect of population size and population density and try to answer the reasons for the controversy over the environmental performance of the urban monocentric and polycentric spatial structure.
2.2 Hypotheses
In essence, the monocentric-polycentric spatial structure is a balance between agglomeration and congestion effects, while environmental pollution is more of a direct manifestation of urban congestion. In the early stage of urban development, there is a welfare period in which environmental efficiency and economic efficiency can be improved simultaneously. In terms of reducing industrial pollution, agglomeration economy theory holds that the compact urban spatial structure can effectively shorten the distance of factor mobility. Besides, it can also promote industrial technology and reduce pollution through the positive externality of the agglomeration effect (Krugman, 1998; Ehrenfeld, 2003). In terms of reducing traffic pollution, areas with high population density can shorten commuting distances and reduce energy consumption, and the efficient use of public transportation can reduce the emission of air pollutants (Zheng et al., 2011). Although the polycentric spatial structure reduces the congestion effect, the relatively dispersed area will result in more private cars replacing public transport. This increases the cost of working and living and the emission of pollutants, eventually reducing environmental efficiency. Thus, we develop the following hypothesis:
Hypothesis 1. The monocentric spatial structure has higher environmental efficiency than the polycentric spatial structure.The agglomeration effect is not always conducive to reducing environmental pollution. Dynamic agglomeration economy theory suggests that when the scale of urban agglomeration exceeds a certain threshold, agglomeration diseconomies will dominate, bringing about problems such as environmental pollution (Verhoef and Nijkamp, 2002). Therefore, the polycentric spatial structure is considered an effective way to alleviate the diseconomies of urban agglomeration (Fujita and Thisse, 2002). On the one hand, the air pollution emissions of industrial enterprises can be diluted in a larger area, reducing the emission concentration. On the other hand, with relatively cheap land and property prices in the peripheral areas, the regrouped industrial enterprises can use capital savings for environmental investments. Thus, we develop the following hypothesis:
Hypothesis 2. With the expansion of urban scale or density, the urban polycentric structure will have higher environmental efficiency.Based on the idea of the benefits sources of agglomeration economy summarized by Duranton and Puge (2004), we propose three possible mechanisms for the effect of monocentric spatial structure on environmental efficiency: learning, sharing, and matching, as shown in Figure 1.Specifically, the learning mechanism is mainly reflected in the promotion of urban innovation and the enhanced capacity of green innovation. In the monocentric spatial structure, the spatial and temporal costs of mutual communication between enterprises and the labor force are reduced, which accelerates the frequency of knowledge exchange and then effectively improves enterprises’ environmental protection technology. The sharing mechanism is mainly reflected in the sharing of public infrastructure, public transportation, and pollution control equipment. In terms of the matching mechanism, the monocentric spatial structure accelerates the transmission of information and improves the matching efficiency between enterprises and the labor force, leading to the improvement of industrial technology, green development, and ultimate environmental efficiency. Thus, we develop the following hypothesis:
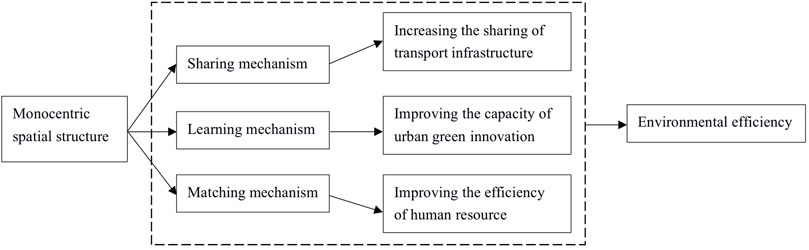
FIGURE 1. The influence mechanism of spatial structure on environmental efficiency.
Hypothesis 3. The monocentric spatial structure influences urban environmental efficiency through sharing, learning, and matching mechanism.
3 Methodology and variable
3.1 Model establishment
This paper refers to Dietz and Rosa (1994) for the STIRPAT model:
In Eq. 1,
In Eq. 2, the dependent variable
3.2 Variables
3.2.1 Explained variable: Environmental efficiency
Environmental efficiency mainly reflects the influence of factor input on the environment while promoting economic development for a certain period. Higher environmental efficiency means that in economic development, under the premise of minimum input of factors such as human capital and resources, the economic output is the largest, and the negative impact on the environment is the least. This paper uses the Super Slack-Based Measure (SBM) model to measure environmental efficiency. Referring to existing studies, the indicators for calculating environmental efficiency are shown in Table 1. The descriptive statistics of input and output indexes are shown in Table 2. The environmental efficiency indexes are measured in DEA-Solver pro5, and it should be noted that the missing values in the index are filled by the interpolation method. The calculation process is shown in the Additional Files.
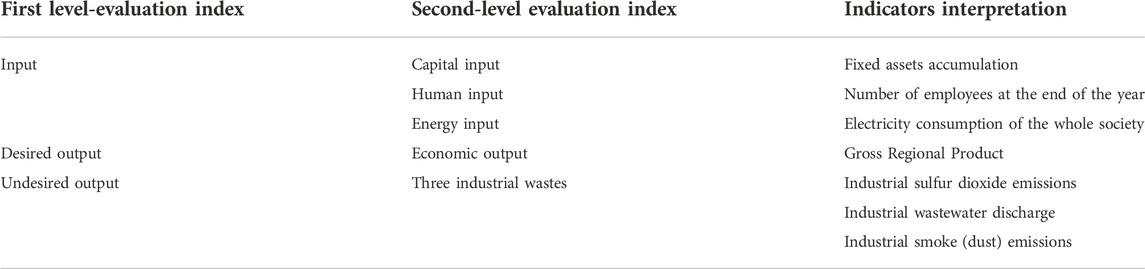
TABLE 1. Input-output indexes of environmental efficiency and interpretation of the indexes.
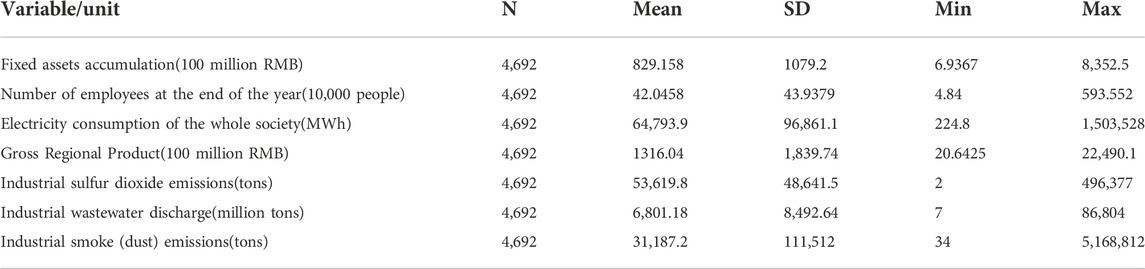
TABLE 2. The descriptive statistics of input and output indexes.
3.2.2 Core explanatory variable: Urban spatial structure
The existing literature on constructing urban spatial structure indicators is mainly based on urban population, employment, and other elements for measurement. However, these data can hardly reflect the real situation of the urban population living. Therefore, to avoid the effects of data measurement bias and endogeneity, this paper uses DMSP-OLS and NPP-VIIRS nighttime light data from National Oceanic and Atmospheric Administration (NOAA) and National Geophysical Data Center (NGDC) releases to construct urban spatial structure indicators. Since the DMSP-OLS data starts and ends from 1992 to 2013, its timeliness is poor. In contrast, the NPP-VIIRS data has strong timeliness (from 2013 to now), but the time series is short. Therefore, we fused and corrected the two and finally obtained the nighttime light data from 2001 to 2017. The detailed fusion-corrected process is shown in the Additional Files.
In addition, due to the slow development of the urban form and spatial structure, it is less likely to produce significant changes over time, as shown in Table 3 and Figure 2. Table 3 shows that the standard errors for the spatial structure variables are minor, and the between-group standard errors are closer to the overall standard errors. Figure 2 shows the distribution of urban spatial structure in China from 2001 to 2017. The darker color in the figure indicates that the spatial structure tends to be monocentric. The lighter color indicates that the spatial structure tends to be polycentric. From the perspective of time, the transformation and adjustment of the spatial structure of most cities from 2001 to 2017 are not obvious. Therefore, when using the fixed-effect model for regression analysis, it is preferable to fix the time effect alone (Harari, 2020).

TABLE 3. Descriptive statistics of urban spatial structure indexes.
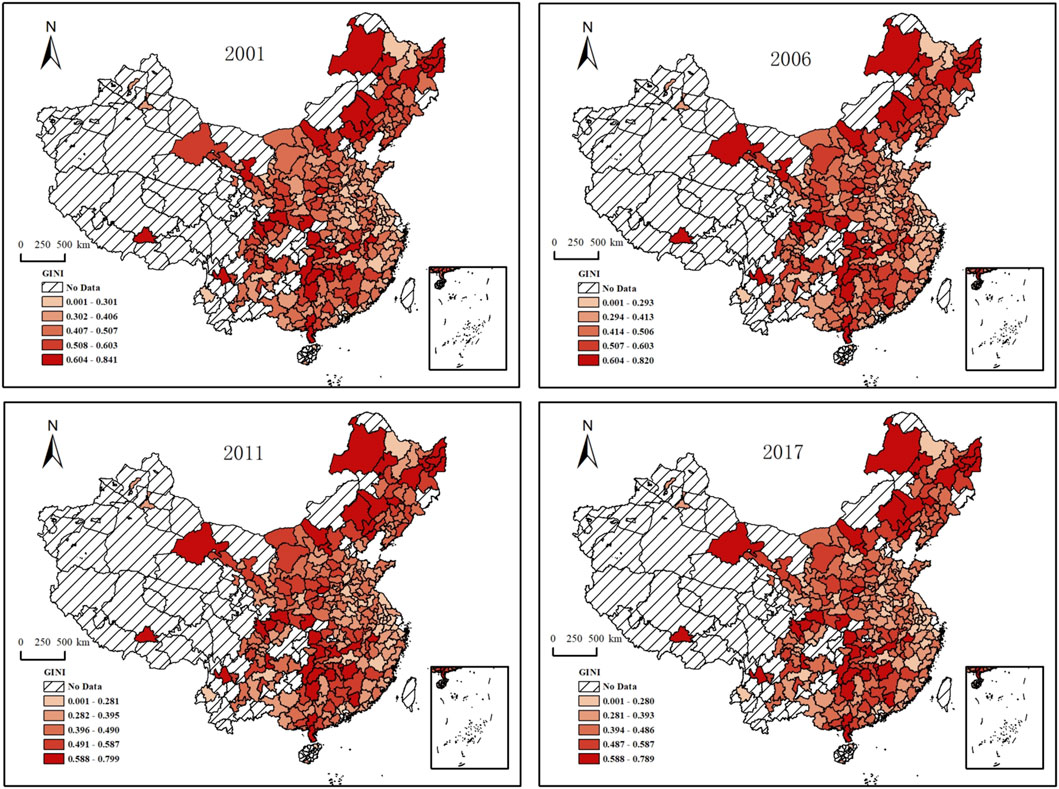
FIGURE 2. Urban spatial structure distribution based on GINI index.
3.2.3 Control variables
Control variables in this paper include two categories: one is that changes with time and individual, and the other is to represent urban characteristics that do not change with time. Among those that change with individual and time, we select the following variables to control the factors affecting environmental efficiency according to the IPAT model: 1) The Affluence degree (Agdp) is represented by the per capita GDP of a city. Theoretically, the improvement of urban economic development level can provide the economic basis for environmental protection and improve environmental efficiency. 2) The technology level is the ratio of government expenditure on science and technology to GDP (Asct) and the number of R&D personnel (Rdp). The level of technology can not only promote economic development but also be an effective means to control pollution. 3) urban population density (Popdensity) indicates the degree of urban population concentration and the change that will impact the environment. 4) The level of government intervention (Agov) is expressed as the ratio of government expenditure to the gross regional product. 5) The degree of openness to the outside world (Afdi) is expressed as the proportion of foreign investment in GDP. It is calculated as the ratio of foreign direct investment to the gross regional product. The impact of trade level on the environment is two-sided, and there are two hypotheses: pollution haven and pollution halo. The former believed that FDI destroys environmental quality by transferring highly polluting industries to host countries, and the increase in trade scale also increases pollutant emissions. The latter argued that FDI improves environmental quality by introducing advanced foreign production technology and equipment. 6) The industrial structure (Astr2) is expressed as the ratio of the secondary industry’s added value to GDP. The expansion of industrial production has increased energy consumption and pollution emissions, while the rapid development of the construction industry has increased the demand for steel, cement, and other products with high energy consumption, resulting in certain side effects on the environment. In addition, variables that do not change over time include city geographic latitude (latitude) and locational distribution (location, the values of east, middle, and west are 1, 2, and 3 in sequence). Table 4 shows the explanations of all control variables.
TABLE 4. List of control variables and descriptions.
3.3 Data and summary statistics
Our data range from 2001 to 2017, and the research objects are 276 prefecture-level cities in China. In order to reduce the impact of changes in administrative divisions on spatial structure measurement, we uniformly use the administrative divisions of 2017 as the standard map. Since the calculation of the spatial structure index needs data of municipal districts, we exclude the samples of municipalities directly under the central Government of China (Beijing, Shanghai, Tianjin, and Chongqing) and the samples without county-level administrative regions (Dongguan, Zhongshan, Jiayuguan, Danzhou, and Sansha). At the same time, we exclude samples with administrative level changes during the study period (e.g., Chaohu, Laiwu, Etc.) and samples with missing data. We end up with a sample of 276 cities.
The data of explained variables and control variables are obtained from China Urban Statistical Yearbook, China Regional Statistical Yearbook, China Energy Statistical Yearbook, and China Environmental Statistical Yearbook. The missing environmental data of prefecture-level cities are obtained from the almanac and bulletin of each city. In addition, this paper takes logarithms of Agdp, Rdp, Popsensity, Agov, Afdi, and Astr2 in the calculation process. Table 5 presents the variables’ summary statistics (mean, standard deviation, minimum, maximum).
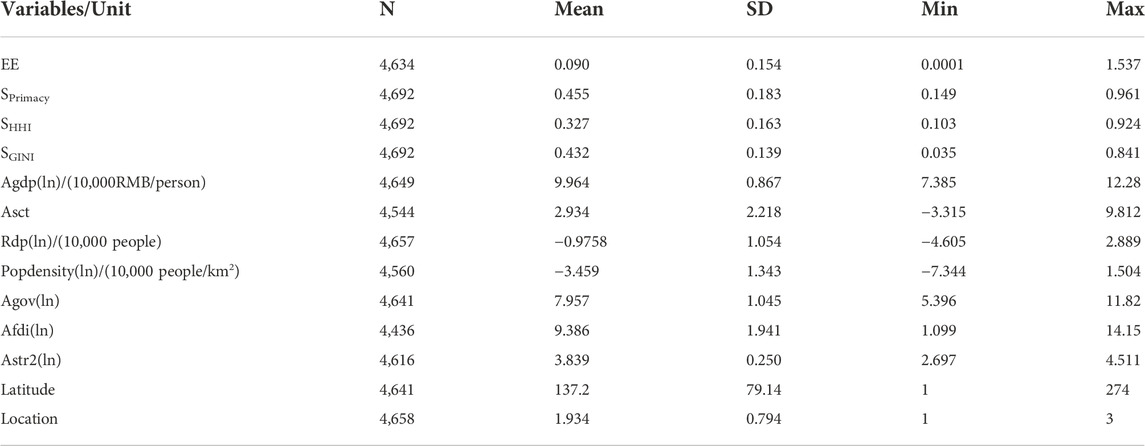
TABLE 5. Summary statistics.
4 The impact of urban spatial structure on environmental efficiency in China
4.1 Baseline results
This paper uses OLS to estimate the impact of urban spatial structure on environmental efficiency, and the estimation results are shown in Table 6. Without adding control variables or fixing time effects, the influence coefficient of spatial structure on environmental efficiency is positive and significant at the 1% level. This indicates that the larger the urban spatial structure index is (the region tends to develop toward the monocentric spatial structure), the higher the environmental efficiency is, meaning that the monocentric spatial structure has higher environmental efficiency than the polycentric spatial structure. After controlling for time fixed effects and adding control variables, the coefficient of spatial structure is still significantly positive, indicating that the conclusion that monocentric spatial structure has higher environmental efficiency still exists. From the above, Hypothesis 1 has been verified.
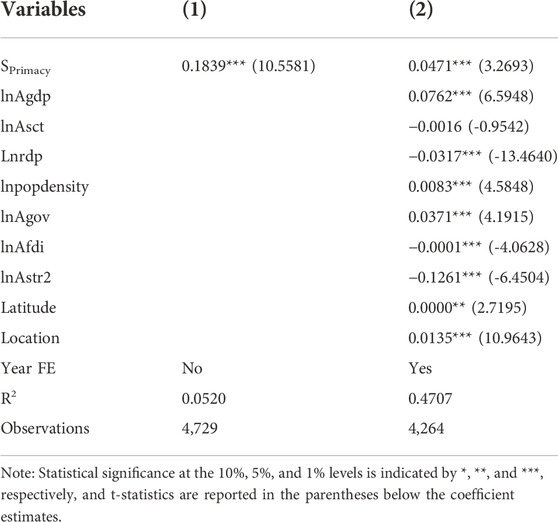
TABLE 6. Regression of urban spatial structure on environmental efficiency.
4.2 Robustness check
In this section, we conduct a series of regressions to ensure that the preceding findings on the relationship between urban spatial structure and environmental efficiency are robust.
Firstly, we change the index of the urban spatial structure. We replace the Primacy index (SPrimacy) in the benchmark regression with GINI (SGINI) and HHI (Herfindahl-Hirschman Index, SHHI) and substitute them into the benchmark regression for testing, respectively. The results are shown in Table 7. The regression results are consistent with the baseline regression.
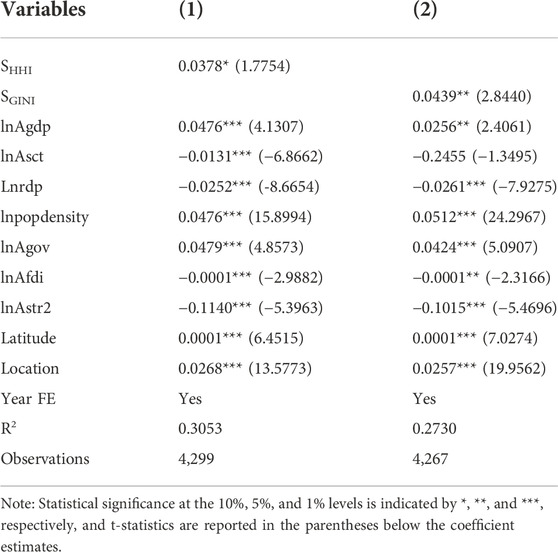
TABLE 7. Robustness check substituting GINI and HHI for the explanatory variable.
Second, this paper uses exogenous instrumental variables to address the endogeneity problem. We choose the urban average geographic elevation as the instrumental variable of the urban spatial structure and then use the two-stage least square estimation (2SLS), and the results are shown in Table 8. Table 8 shows that the F-statistic in the first stage is higher than the empirical value of 10, indicating that the average urban elevation is highly positively correlated with the spatial structure index. In the second stage of regression, the coefficient of the urban spatial structure index is significant, and the absolute value is higher than the benchmark regression result, indicating that the impact of spatial structure on environmental efficiency is underestimated. The instrumental variable method further supports the original conclusion.
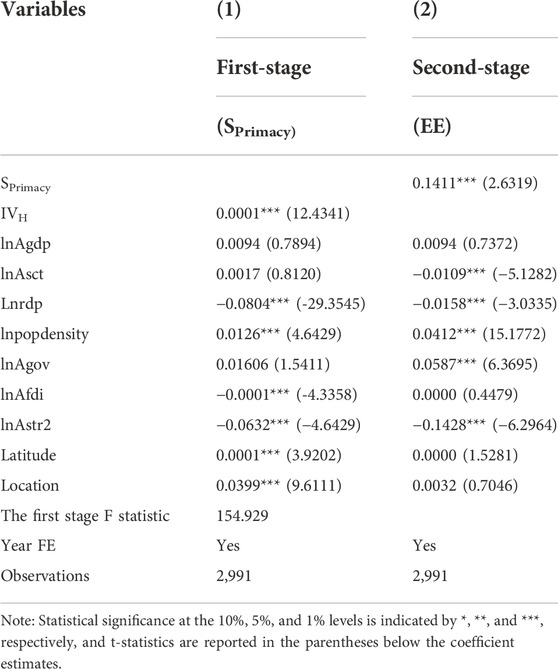
TABLE 8. Endogeneity test.
4.3 Heterogeneity test
The above results show that the monocentric spatial structure improves environmental efficiency. Nevertheless, does this conclusion still hold as cities continue to grow in size? Urban spatial structure and urbanization promote the coordinated development of each other, and there is a moderating effect of city scale on the impact of spatial structure on environmental efficiency. In this paper, the interaction terms between urban spatial structure and urban population quantity and the interaction terms between urban spatial structure and urban population density are respectively added to the benchmark regression. The model is as follows:
The moderating effect of urban population quantity is shown in Table 9 (1). The interaction term coefficient between urban population size and urban spatial structure is negative and significant at the 1% level, indicating that with the increase in urban population quantity, the polycentric spatial structure has higher environmental efficiency. At this time, the marginal effect of the polycentric spatial structure on environmental efficiency is 0.4117–0.0653 lnpop. When the urban permanent population size is higher than 5 million (e ^ (0.4117/0.0653)), the polycentric spatial structure has higher environmental efficiency.
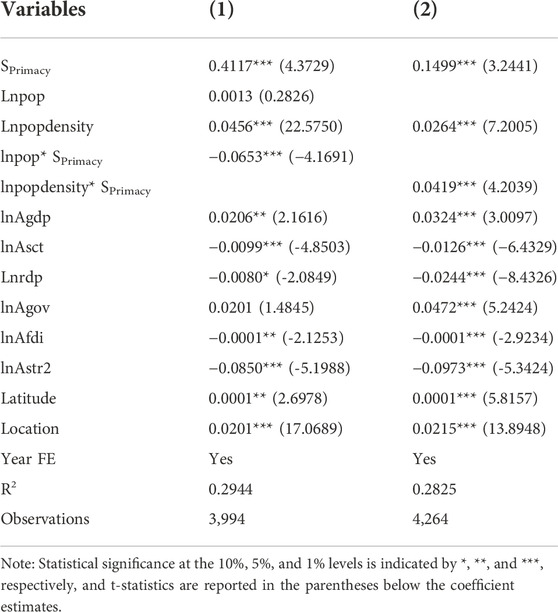
TABLE 9. Heterogeneity analysis.
The moderating effect of urban population density is shown in Table 9 (2). Consistent with the baseline regression results, the increase in urban population density is beneficial to improve environmental efficiency. The interaction coefficient between the spatial structure and population density is significantly positive, indicating that the monocentric structure is more conducive to improving environmental efficiency with the increase in population density. However, when the urban population density is higher than 280 people/km2 (e^ (−0.1499/0.0419)), the polycentric spatial structure has higher environmental efficiency. Hypothesis 2 has been verified.
4.4 Mechanism analysis
Based on the existing literature (Song et al., 2022), this paper uses the following model to test the influencing mechanism: 1) The spatial structure index (Sprimacy) is regressed with the mediating variable. If the coefficient is significant, it indicates that the spatial structure can affect the mediating variable. 2) The spatial structure index (Sprimacy) is regressed with the explained variable (environmental efficiency). If the coefficient is significant, it indicates that the urban spatial structure can impact environmental efficiency. 3) The spatial structure index and the mediating variable is regressed with environmental efficiency. If the coefficient of the spatial structure index is insignificant or significant but the absolute value of the coefficient decreases, while the coefficient of the intermediary variable is significant, it proves that the urban spatial structure affects the environmental efficiency through the mediating mechanism. Following the above steps, we set up the model as follows:
M is the intermediary variable, and the definitions of other variables are consistent with the baseline model. The selection of the mediating variable M is as described in the theoretical analysis. The monocentric spatial structure can improve environmental efficiency through learning, matching, and sharing mechanisms.
First, the monocentric spatial structure improves environmental efficiency through a learning mechanism. The learning mechanism is an effective means of directly promoting technological innovation. Enterprises’ production technology and innovation capacity can effectively improve the environmental protection capacity of the city. Therefore, this paper selects the number of green utility patent applications (
Second, the impact of monocentric spatial structure on environmental efficiency can be achieved through matching mechanisms. The function of the matching mechanism depends on adjusting talent structure and industrial structure. The better the match between the two, the better it is for promoting green economic development. Referring to the existing literature, this paper uses the total deviation index of industrial structure (
Third, the monocentric spatial structure can improve environmental efficiency by sharing public transport infrastructure. Although the increase in urban traffic mileage reflects the progress of transportation infrastructure, it ignores the growth rate of private cars. It does not accurately reflect the extent to which transport infrastructure is shared. Therefore, this paper uses the ratio of the number of private cars and highway mileage to express the sharing level of transportation infrastructure (
The number of green patent applications and inventions are from the National Intellectual Property Database and CNRDS database, respectively, and the rest of the indicators are from the China City Statistical Yearbook and the China Regional Statistical Yearbook.
Table 10 shows that the monocentric spatial structure promotes urban green innovation development, innovation ability, the sharing of transportation infrastructure, and the matching degree of the labor force. The results of the second step of the test are consistent with those of the baseline regression, where the spatial structure has a significant effect on environmental efficiency.
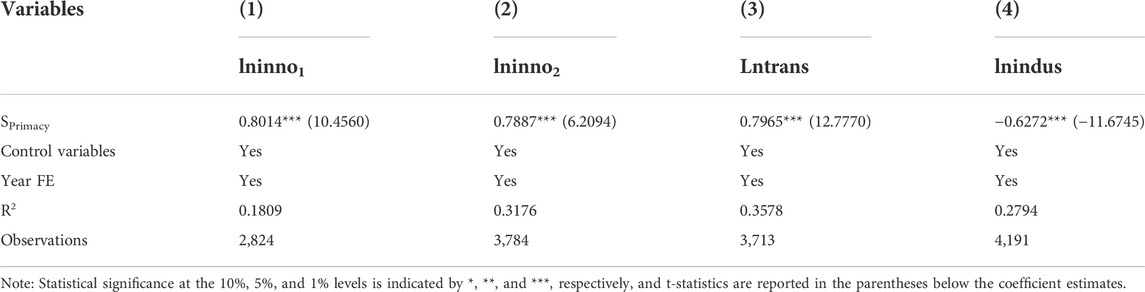
TABLE 10. Mechanism test.
Table 11 shows that the coefficients of the mediating variables are all significant, and the significance and absolute value of the spatial structure variables are decreased compared with the benchmark regression values. It shows that the monocentric spatial structure improves environmental efficiency through the learning mechanism, matching mechanism, and sharing mechanism. Hypothesis 3 has been verified.
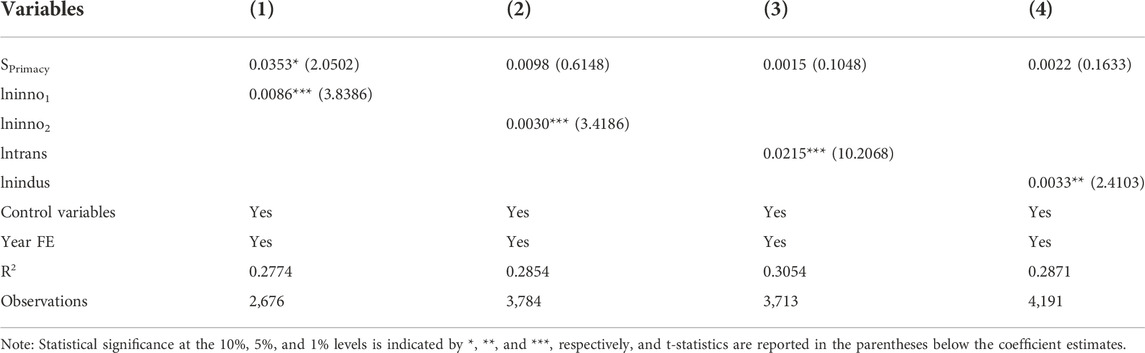
TABLE 11. Mechanism test.
5 Further study
As the problem of “urban disease” worsens, the government has begun to raise the threshold of household registration in big cities to control the influx of people. In 2009, Zhongshan took the lead in implementing the household registration system, controlling population inflows by reducing urban public services such as education and health care. Subsequently, Shanghai, Beijing, and other cities have introduced the point-based household registration policy. In addition, the government has made two regulations for the disclosure of environmental information. One is the pollutant information registration system (registering corporate pollutant discharge data), and the other is the performance evaluation system (rating corporate environmental performance based on pollutant discharge data). Therefore, this paper regards the environmental pollution supervision policy and the point-based household registration policy as a quasi-natural experiment and uses the differences-in-differences method (DID) to explore the impact of the two on environmental efficiency. The model is set as follows:
The results are shown in Table 12. The disclosure of environmental information effectively inhibits the emission of pollutants and plays an obvious role in improving environmental efficiency. However, the effect of the point-based household registration policy on environmental efficiency is not obvious.
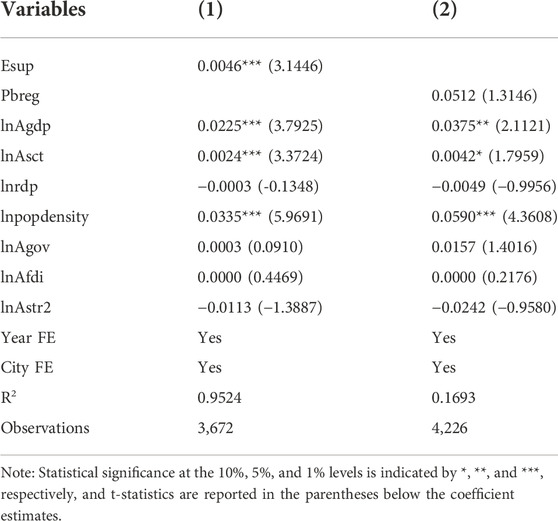
TABLE 12. The influence of environmental pollution regulation and the point-based household registration policy on environmental efficiency.
6 Conclusion and policy implications
With the continuous development of the economy and urbanization, China’s environmental problems are emerging, making the improvement of environmental efficiency necessary at present. The rational layout of urban spatial structure is of great significance to the improvement of environmental efficiency. Therefore, the main purpose of this paper is to explore what kind of urban spatial structure contributes to the improvement of environmental efficiency. Based on the fusion-corrected DMSP-OLS and NPP-VIIRS nighttime light data, we construct spatial structure indicators of 276 prefecture-level cities. Then we explored the impact of urban spatial structure on environmental efficiency from the perspective of monocentric and polycentric spatial structures. This can offer a better measurement of monocentric cities and polycentric cities than traditional government statistical data in the Chinese context. In addition, we use geographic elevation as an instrumental variable for the spatial structure to address potential endogeneity problems. The following conclusions are drawn from the findings:
(1) The monocentric spatial structure has higher environmental efficiency than the polycentric spatial structure. At the current level of urban agglomeration and economic development in China, the agglomeration effect still outweighs the agglomeration cost. Therefore, increasing urban agglomeration in China is still an effective way to achieve green development.
(2) The monocentric spatial structure improves environmental efficiency through learning, sharing, and matching mechanisms. The monocentric structure can improve the technological level of enterprises by promoting knowledge exchange and the matching efficiency between enterprises and the labor force, so as to reduce the environmental cost of urban economic activities. In addition, the monocentric spatial structure facilitates the “sharing” of public transportation, public infrastructure, and pollution control equipment, thus contributing to the improvement of environmental efficiency.
(3) Population size and density have a robust moderating effect. When the resident population size of a city is higher than 5 million or the population density is higher than 280 persons/km2, the monocentric spatial structure has a negative impact on environmental efficiency and at this time, the polycentric spatial structure is more effective in improving environmental efficiency.
(4) The point-based household registration policy adopted by the government to control population size has no significant impact on environmental efficiency. By contrast, the environmental information disclosure policy can effectively improve environmental efficiency. Combined with the results of the baseline regressions, we find that population agglomeration from the urban periphery to the central urban area is an effective way to achieve improved environmental efficiency.
Based on the conclusion, the following suggestions can be made:
(1) Our findings provide a criterion for dividing low-and high-density cities, and the threshold can serve as a guide to implementing different spatial strategies to improve environmental efficiency. The government should measure the urban resident population and predict the future population growth trend of each city and take the population scale of 5 million and population density of 280 people/km2 as the standard, and reasonably plan the development of the urban spatial structure to achieve optimal environmental efficiency. Specifically, for cities with small population size and low population density, the government can implement a monocentric urban planning policy. For mega-cities, such as Beijing, Shanghai, and Shenzhen, the government could implement a polycentric spatial structure planning policy.
(2) The government should actively promote learning, sharing, and matching mechanisms to maximize urban economic and environmental efficiency. For example, the government could invest more in public transportation infrastructure, which can improve the intra-city road traffic network and reduce the urban congestion effect. In addition, the government can build a sharing platform for talent matching and knowledge learning. This can enhance the knowledge spillover effect of the monocentric spatial structure and thus improve the efficiency of the environment.
(3) The government should abandon the traditional policy of reducing environmental pollution by controlling the population size. According to National Bureau of Statistics, there were 91 cities with a population of more than 5 million in China by 2021, accounting for only 26.5 percent of the country’s cities. Therefore, it is still the mainstream for cities to utilize the agglomeration effect.
(4) Urban planning should focus on solving pollution problems rather than solving agglomeration. For example, the government should strengthen the supervision of environmental pollution, actively establish an environmental pollution monitoring platform, and improve the registration of enterprise production input data and pollutant emission data.
However, this study may suffer from some limitations, which need further investigation. On the one hand, the polycentric spatial structure has better environmental efficiency when the resident population size is higher than 5 million or the population density is higher than 280 persons/km2. At this time, the mechanism through which polycentric spatial structure influences environmental efficiency needs to be further explored. On the other hand, this paper only reveals the relationship between spatial structure and environmental efficiency of prefecture-level cities, and it is also worth paying attention to the influence on provincial and urban agglomeration levels.
Data availability statement
The original contributions presented in the study are included in the article/Supplementary Material, further inquiries can be directed to the corresponding author.
Author contributions
JY and JL: Conceptualization, formal analysis, methodology, software, writing. FW and XL: Data collection, review and editing, funding acquisition, investigation, supervision.
Funding
This research was funded by the Program of National Social Science Fund of China (Grant No. 18VSJ023).
Conflict of interest
The authors declare that the research was conducted in the absence of any commercial or financial relationships that could be construed as a potential conflict of interest.
Publisher’s note
All claims expressed in this article are solely those of the authors and do not necessarily represent those of their affiliated organizations, or those of the publisher, the editors and the reviewers. Any product that may be evaluated in this article, or claim that may be made by its manufacturer, is not guaranteed or endorsed by the publisher.
Supplementary material
The Supplementary Material for this article can be found online at: https://www.frontiersin.org/articles/10.3389/fenvs.2022.1058585/full#supplementary-material
References
Burgalassi, D., and Luzzati, T. (2015). Urban spatial structure and environmental emissions: A survey of the literature and some empirical evidence for Italian NUTS-3 regions. Cities 49, 134–148. doi:10.1016/j.cities.2015.07.008
Cho, H. S., and Choi, M. J. (2014). Effects of compact urban development on air pollution: Empirical evidence from Korea. Sustainability 6 (9), 5968–5982. doi:10.3390/su6095968
Clark, L. P., Millet, D. B., and Marshall, J. D. (2011). Air quality and urban form in US urban areas: Evidence from regulatory monitors. Environ. Sci. Technol. 45 (16), 7028–7035. doi:10.1021/es2006786
Dietz, T., and Rosa, E. A. (1994). Rethinking the environmental impacts of population, affluence and technology. Hum. Ecol. Rev. 1 (2), 277–300. Available at: https://www.jstor.org/stable/24706840.
Du, L., Wang, F., and Tian, M. (2022). Environmental information disclosure and green energy efficiency: A spatial econometric analysis of 113 prefecture-level cities in China. Front. Environ. Sci. 1232, 966580. doi:10.3389/fenvs.2022.966580
Duranton, G., and Puga, D. (2004). “Micro-foundations of urban increasing returns: Theory,” in Handb. regional urban Econ. Editors V. Henderson, and J.-F. Thisse (Amsterdam, Netherlands: Elsevier) 4, 2063–2117.
Ehrenfeld, J. (2003). Putting a spotlight on metaphors and analogies in industrial ecology. J. Industrial Ecol. 7 (1), 1–4. doi:10.1162/108819803766729131
Fujita, M., and Thisse, J. F. (2002). Economics of agglomeration: Cities, industries location and globalization. Cambridge, United Kingdom: Cambridge University Press.
Glaeser, E. L., and Kahn, M. E. (2010). The greenness of cities: Carbon dioxide emissions and urban development. J. urban Econ. 67 (3), 404–418. doi:10.1016/j.jue.2009.11.006
Han, S., Sun, B., and Zhang, T. (2020). Mono-and polycentric urban spatial structure and PM2. 5 concentrations: Regarding the dependence on population density. Habitat Int. 104, 102257. doi:10.1016/j.habitatint.2020.102257
Harari, M. (2020). Cities in bad shape: Urban geometry in India. Am. Econ. Rev. 110 (8), 2377–2421. doi:10.1257/aer.20171673
Horton, F. E., and Reynolds, D. R. (1971). Effects of urban spatial structure on individual behavior. Econ. Geogr. 47 (1), 36–48. doi:10.2307/143224Available at: http://www.jstor.org/stable/143224.
Krugman, P. (1998). Space: The final frontier. J. Econ. Perspect. 12 (2), 161–174. doi:10.1257/jep.12.2.161
Larkin, A., van Donkelaar, A., Geddes, J. A., Martin, R. V., and Hystad, P. (2016). Relationships between changes in urban characteristics and air quality in East Asia from 2000 to 2010. Environ. Sci. Technol. 50 (17), 9142–9149. doi:10.1021/acs.est.6b02549
Li, W., Sun, B., and Zhang, T. (2019). Spatial structure and labour productivity: Evidence from prefectures in China. Urban Stud. 56 (8), 1516–1532. doi:10.1177/0042098018770077
Liu, P., Zhong, F., Yang, C., Jiang, D., Luo, X., Song, X., et al. (2022). Influence mechanism of urban polycentric spatial structure on PM2. 5 emissions in the Yangtze River Economic Belt, China. J. Clean. Prod. 365, 132721. doi:10.1016/j.jclepro.2022.132721
Mou, Y., Song, Y., Xu, Q., He, Q., and Hu, A. (2018). Influence of urban-growth pattern on air quality in China: A study of 338 cities. Int. J. Environ. Res. Public Health 15 (9), 1805. doi:10.3390/ijerph15091805
Otsuka, A., Goto, M., and Sueyoshi, T. (2014). Energy efficiency and agglomeration economies: The case of J apanese manufacturing industries. Regional Sci. Policy & Pract. 6 (2), 195–212. doi:10.1111/rsp3.12039
Song, D., Zhu, W., and Ding, H. (2022). Can firm digitalization promote green technological innovation? An examination based on listed companies in heavy pollution industries. J. Finance Econ. 48 (04), 34–48. doi:10.16538/j.cnki.jfe.20211218.304
Sun, B., Zhang, T., Li, W., and Song, Y. (2022). Effects of polycentricity on economic performance and its dependence on city size: The case of China. Land 11 (9), 1546. doi:10.3390/land11091546
Tao, J., Wang, Y., Wang, R., and Mi, C. (2019). Do compactness and poly-centricity mitigate PM10 emissions? Evidence from yangtze river delta area. Int. J. Environ. Res. Public Health 16 (21), 4204. doi:10.3390/ijerph16214204
Tao, Y., Zhang, Z., Ou, W., Guo, J., and Pueppke, S. G. (2020). How does urban form influence PM2. 5 concentrations: Insights from 350 different-sized cities in the rapidly urbanizing Yangtze River Delta region of China, 1998–2015. Cities 98, 102581. doi:10.1016/j.cities.2019.102581
Veneri, P., and Burgalassi, D. (2012). Questioning polycentric development and its effects. Issues of definition and measurement for the Italian NUTS-2 regions. Eur. Plan. Stud. 20 (6), 1017–1037. doi:10.1080/09654313.2012.673566
Verhoef, E. T., and Nijkamp, P. (2002). Externalities in urban sustainability: Environmental versus localization-type agglomeration externalities in a general spatial equilibrium model of a single-sector monocentric industrial city. Ecol. Econ. 40 (2), 157–179. doi:10.1016/S0921-8009(01)00253-1
Wang, M., and Zhang, B. (2020). Examining the impact of polycentric urban form on air pollution: Evidence from China. Environ. Sci. Pollut. Res. 27 (34), 43359–43371. doi:10.1007/s11356-020-10216-1
Yuan, M., Huang, Y., Shen, H., and Li, T. (2018). Effects of urban form on haze pollution in China: Spatial regression analysis based on PM2. 5 remote sensing data. Appl. Geogr. 98, 215–223. doi:10.1016/j.apgeog.2018.07.018
Zhao, X., Shang, Y., and Song, M. (2019). What kind of cities are more conducive to haze reduction: Agglomeration or expansion? Habitat Int. 91, 102027. doi:10.1016/j.habitatint.2019.102027
Zhao, X., Wang, W., and Wang, J. (2022). The policy effects of demand-pull and technology-push on the diffusion of wind power: A scenario analysis based on system dynamics approach. Energy 261, 125224. doi:10.1016/j.energy.2022.125224
Keywords: urban spatial structure, monocentric spatial structure, polycentric spatial structure, environmental efficiency, nighttime light data
Citation: Ye J, Wei F, Liu X and Li J (2022) Urban spatial structure and environmental efficiency: Empirical analysis from prefecture-level cities in China. Front. Environ. Sci. 10:1058585. doi: 10.3389/fenvs.2022.1058585
Received: 30 September 2022; Accepted: 07 November 2022;
Published: 23 November 2022.
Edited by:
Ghaffar Ali, Shenzhen University, ChinaReviewed by:
Wang Wei, North China Electric Power University, ChinaWeijing Ma, Lanzhou University, China
Copyright © 2022 Ye, Wei, Liu and Li. This is an open-access article distributed under the terms of the Creative Commons Attribution License (CC BY). The use, distribution or reproduction in other forums is permitted, provided the original author(s) and the copyright owner(s) are credited and that the original publication in this journal is cited, in accordance with accepted academic practice. No use, distribution or reproduction is permitted which does not comply with these terms.
*Correspondence: Jinkai Li, amtsXzIwMjJAMTYzLmNvbQ==