 Linlin Zhang
 Jun Zhu1,2
 Qiulan Zhang
 Aiming Zhang
95% of researchers rate our articles as excellent or good
Learn more about the work of our research integrity team to safeguard the quality of each article we publish.
Find out more
ORIGINAL RESEARCH article
Front. Environ. Sci. , 28 October 2022
Sec. Freshwater Science
Volume 10 - 2022 | https://doi.org/10.3389/fenvs.2022.1058351
This article is part of the Research Topic Interactions between Groundwater and Human Communities: Perspectives on the Resources, Environments, Threats and Sustainable Development View all 18 articles
The transport of colloid in unsaturated porous media affects the migration of contaminants and thus is closely related to groundwater resources protection. To figure out the combined effects of grain size, colloid concentration and injection flow rate on montmorillonite colloid transport characteristics in unsaturated quartz sand, a total of 27 sets of column experiments were conducted with three kinds of quartz sand (20, 40, 60 mesh), three flow rates (1.98, 3.96, 5.94 cm3/min) and three colloid concentrations (300, 600, 900 mg/L), using three packed columns with the inner diameter of 11 cm and the height of 40 cm. The experimental results showed that the transport of Na-montmorillonite colloid particles in the unsaturated quartz sand columnoccurred with significant retention. In the 20 mesh quartz sand column, the average peak values of the penetration curves for low and high concentration colloidal solutions of 300 and 900 mg/L increased by 44% and 27%, respectively, as the flow rate increased from 1.98 to 5.94 cm3/min. The average peak value of the colloidal solution with concentration 300 mg/L increased 17% more than that of the colloidal solution with 900 mg/L for increasing flow rate. When the injection flow rate of the colloidal solution was increased from 1.98 to 5.94 cm3/min, the effect of flow rate on colloidal transport was the most obvious, followed by the effect of media particle size, while the effect of colloidal solution concentration was the least. The calculation based on the total potential energy of Derjaguin-Landau-Verwey-Overbeek (DLVO) and collision efficiency further explained the retention of colloids in unsaturated porous media.
The clay colloids are widely distributed in subsurface aquifer and vadose zones, with the characteristics of small size, large specific surface area and high surface electrical potential (Vilks and Baik, 2001; Um and Papelis, 2002; Schoonheydt et al., 2018; Won et al., 2021; Xiao et al., 2022a). The transport of clay colloid in porous media is closely related to many processes in the field of environmental geoscience, including groundwater pollution and remediation, reinjection of geothermal water and gas filed produced water, oil and gas exploitation, as well as the radionuclides migration (Torok et al., 1990; Ohnuki et al., 2010; Yang et al., 2013; Syngouna et al., 2017; Won et al., 2021; Xiao et al., 2022b). Particularly, the clay colloids play a significant role intransporting contaminants in porous media. The high surface potential and large specific surface area of clay colloids favorably adsorb the heavy metals, organic pollutants, radionuclides, virus and bacteria, thus facilitating or hindering the migration of these contaminants, and ultimately determining the fate of the substances in the environmental systems (Um and Papelis, 2002; Kim et al., 2003; Syngouna and Chrysikopoulos, 2013; Syngouna and Chrysikopoulos, 2016; Won et al., 2019; Fountouli and Chrysikopoulos, 2020; Xiao et al., 2022c; Liu et al., 2022). Given that its high importance, it is necessary to understand the clay colloid migration for effective management of contaminants and other environmental resources.
The transport characteristics of clay colloids in saturated porous media are deeply influenced by many environmental parameters such as particle size (Wang et al., 2012; Zhang et al., 2020), matrix structure (Zhang et al., 2016), flow velocity (Saiers and Lenhart, 2003a; Syngouna et al., 2017), solution compositions and salinity (Grolimund et al., 1996; Saiers and Lenhart, 2003b), as well as the solution pH (Walshe et al., 2010; Ma et al., 2018). In order to clarify the migration and retention behaviors of clay colloids under different influencing factors, large research efforts have been carried out by many scholars on the basis of batch experiments, column experiments, mathematical model and numerical simulation (Lenhart and Saiers, 2002; Torkzaban et al., 2008; Zhang et al., 2014; Zhang and Hassanizadeh, 2017). Won et al. (2021) investigated the transport and retention behaviors of kaolinite and illite under different sand grain sizes and solution ionic strengths. The results show that 1) a decrease in the median sand grain size increases the amount of retained clay and 2) the presence of an ionic strength threshold allows for similar retention of clay colloids at 0.01 M and 0.1 M during an increase in ionic strength from 0 to 0.1 M strength. Bradford and Kim (2010) conducted the column experiments to investigate the efforts of the solution chemistry sequence on the clay release from sands with different grain sizes, which shows that clay release presents a relatively minor enhancement with increasing pH and decreasing ionic strength. However, when monovalent sodium ions on the clay and sand surfaces were exchanged for multivalent cations, clay release was significantly enhanced. Syngouna and Chrysikopoulos (2011) evaluated the combined effects of quartz sand particle size and pore water flow rate on the migration of three biocolloids in saturated quartz sand columns. The results showed that there is no obvious relationships between mass recovery of biocolloids and water flow rate or particle size, while better agreement between the Maxwell theoretical and experimental collision efficiencies was observed. The deposition and release of clay colloids in saturated porous media sand columns packed with biochar-modified sand was studied by Haque et al. (2017), the results showed that the deposition of clay colloids in biochar was more favorable than that in sand.
Furthermore, many researchers have put a lot of efforts into clay colloids migration and retention in partially saturated porous media. Zevi et al. (2005) conducted colloid migration in partially saturated quartz to directly observe and characterize colloid transport behaviors using pore scale visualization technologies. Torkzaban et al. (2008) used filled columns and mathematical models to study the effects of water saturation, pore water ionic strength and particle size on the transport of latex microspheres in porous media, which indicates that straining is the major mechanism of colloid retention for both fully and partially saturated conditions. Fountouli and Chrysikopoulos (2020) investigated the effects of kaolinite and montmorillonite on formaldehyde transport in unsaturated sandy media at different flow rates and saturation conditions. The results showed that the presence of clay particles would delay formaldehyde transport and significant clay colloid retention occurred at low flow rates. Additionally, calculation results on the basis of Derjaguin–Landau–Verwey–Overbeek (DLVO) theory demonstrated that permanent retention of clay colloids at solid-water interfaces and air-water interfaces was negligible.
In summary, the existing studies mainly focused on one or two factors affecting the migration and retention of colloids in fully or partially saturated porous media, column experiments in unsaturated porous media are mostly set to a certain degree of water saturation (Shang et al., 2008; Torkzaban et al., 2008; Fountouli and Chrysikopoulos, 2020). Nonetheless, media particle size, injection flow rate and initial colloid concentration all affect the migration and retention of colloids in porous media. The water content of the actual unsaturated zone increases with depth, rather than a fixed water content. Accordingly, the investigation on the combined effects of medium particle size, injection flow rate and initial concentration of colloidal solution on the migration of colloids in unsaturated porous media with variable water content is essential for a comprehensive understanding of the behaviors of colloids or colloid-borne contaminant transport. However, the corresponding studies in existing references remain very limited. The objective of this study was to investigate the combined effects of media particle size, initial colloid concentrations and injection flow rates on Na-montmorillonite colloid migration behaviors in unsaturated quartz sand through prong the penetration time of colloid. The breakthrough curves were fitted by the cumulative Weibull model. The combined influences of three influencing factors on the key parameters of breakthrough curves were discussed. Furtherly, the relative importance of three influencing factors was ranked and discussed.
SD1005 high purity (reagent grade) sodium montmorillonite colloid, made by Zhejiang Sanding Technology Co., Ltd., China, is used in the experiment. The sodium montmorillonite is a 2:1 layered aluminosilicate mineral composed of nanostructured micro crystals, and the particle size is less than 10 μm (Sposito et al., 1999; Schoonheydt et al., 2018). The particle size distribution of colloid was gauged by Malvin laser particle size analyzer (Mastersizer3000E, Malvern company, UK), which is roughly in the range of 0.1–1.5 μm (Figure 1).
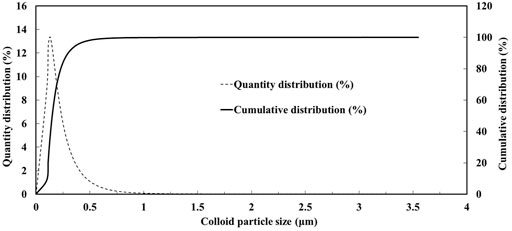
FIGURE 1. Montmorillonite colloid particle size distribution curve.
The morphological characteristics of montmorillonite were obtained by scanning electron microscope (SU8240, Hitachi, Japan), as shown in Supplementary Figure S1. The representative transmission electron microscopy (TEM, FEI Tecnai G2 F20, FEI, US) image is shown in Supplementary Figure S1.
Montmorillonite colloids were prepared into colloid suspensions for sand column experiments with deionized water, and the concentrations were 300 mg/L, 600 mg/L and 900 mg/L respectively. A colloid concentration calibration curve was obtained by using sodium montmorillonite colloids, shown in Figure 2. As a result, the obtained relationship for estimating of the montmorillonite colloid concentration with high accuracy is as follow:
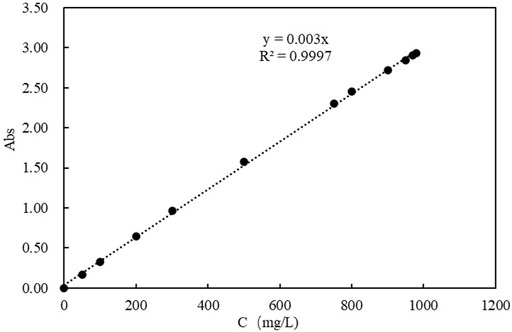
FIGURE 2. Standard curve of montmorillonite colloidal solution (Abs is the absorbance of the solution).
Three sizes of quartz sand were used to pack the columns in this study: 1) coarse sand with a mean grain diameter of 0.9 mm (Sieve No 20), 2) medium sand with a mean grain diameter of 0.45 mm (Sieve No 40), and 3) fine sand with a mean grain diameter of 0.3 mm (Sieve No 60). According to the particle size of quartz sand, the sieve with corresponding mesh number was selected, and use swing sieve analyzer (AS200, Retsch Company, Germany) was used to screen the quartz sand to remove impurities and ensure that the particle size is consistent.
The pretreatment procedures for thoroughly washing sand are as follows. Firstly, washing the quartz sand with deionized water and ultrasonic for 5 times, then soaking it in 1 M NaOH and HCl solution for 24 h, respectively. Subsequently, the sand was washed it with deionized water and ultrasonic for 3 times to remove the residual alkali and acid solution. Finally, the sand was dried in muffle furnace (L15/11, Nabertherm GmbH, Germany) at 600°C for 8 h. The high temperature of 600°C can completely remove the organic matter in quartz sand. The treated quartz sand is placed in a cool and dry place and sealed for storage.
Supplementary Figure S2 displays the morphological characteristics of quartz sand particles obtained by scanning electron microscope. It can be seen from Supplementary Figure S2 that there are both smooth areas and rough areas on the surface of quartz sand particles.
The zeta potential (ξ) represents a measure of the electrical potential of the mineral surfaces, determines the thickness of electrical double layer (EDL) at minerals surface, and controls the electrostatic interactions strength between mineral surface and polar species in aqueous solution (Shehata and Nasr-El-Din, 2015; Vinogradov and Jackson, 2015; Awan et al., 2022).
Given that its high importance, the zeta potentials of various colloid concentrations and sands used in this study were measured in deionized water by a ZetaPlus potential analyzer (ZetaPlus Nano, Malvern, UK). Note that the sand grains used in this work were too large for directly measurement of their zeta potential by the ZetaPlus potential analyzer. Consequently, a few sand grains were crushed into fine powder and then mixed with the deionized water to form suspension.
All zeta potential measurements were collected in triplicate. Figure 3 shows the average zeta potential values of montmorillonite colloid and quartz sand particles under different pH conditions. At 25°C deionized water, the zeta potential of quartz sand particles is determined to be -20.1 mV, and the zeta potential of montmorillonite colloid is determined to be -36.5 mV. In particular, the zeta potential of montmorillonite colloid is negative in the examined pH range.
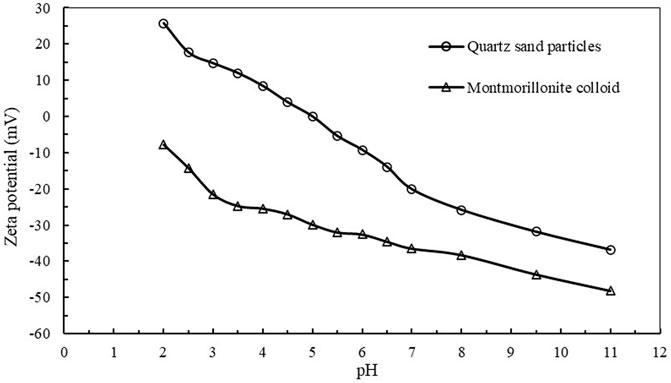
FIGURE 3. The average value of zeta potential value of montmorillonite colloid and quartz sand particles changing with pH in ionic water at 25°C.
All colloid transport experiments were conducted in three plexiglass columns, and each with a length of 40 cm and an inner diameter of 11 cm. Each column used in the experiments was filled with one size of quartz sand particles to obtain columns filled with 20 mesh, 40 mesh and 60 mesh quartz sand particles, respectively. The columns were evenly filled with dried sand in a layered manner. After each part of sand was filled, it needed to be compacted, and then roughened the sand with a thickness of 1 cm on the surface, so as to continue to fill quartz sand. As shown in Figure 4, the height of the filled sand was 33 cm. There were 2 cm and 5 cm spaces reserved at the top and bottom of the packed column without quartz sand filling, respectively. The 2 cm space was convenient for the uniform infiltration of the spray water at the top, and the 5 cm space was to prevent the deposition of the outflow liquid at the bottom. As the bottom boundary for the filling with 60 mesh quartz sand, we used a nylon membrane with mesh number of 120 supported by plexiglass porous sieve plate (80 mesh is used for the nylon membrane of the remaining two sand columns). The colloidal solutions were introduced into the column through a modified plexiglass cover (see Figure 4) with uniform hole distribution to ensure even distribution over the whole cross-section of the column. The bottom cover of the column was improved, and the internal surface was made into a conical appearance to ensure that the liquid flowing out of the porous sieve plate can smoothly converge to the outlet at the bottom of the column and then be collected.
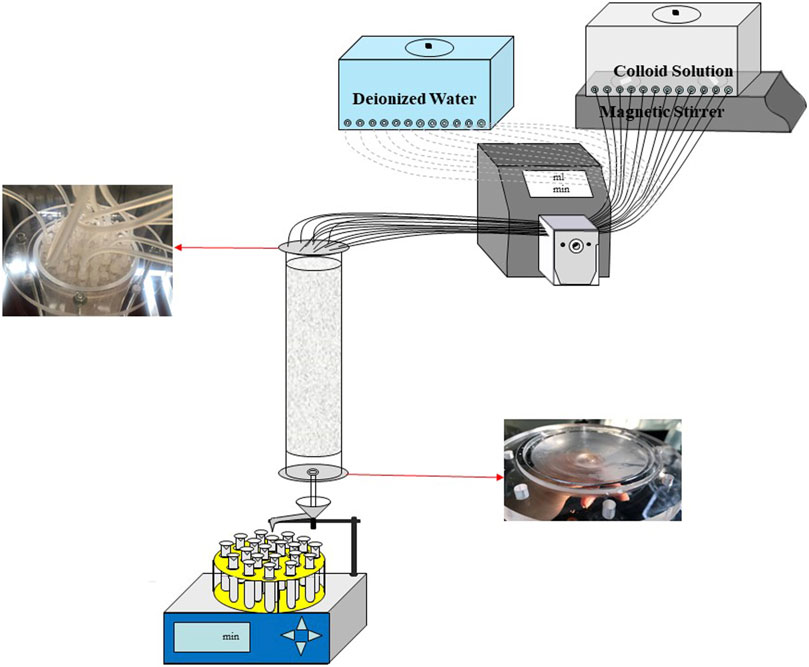
FIGURE 4. Schematic diagram of the experimental setup.
The saturated permeability coefficients, pore volumes, bulk density and weight of filled quartz sand of packed columns are listed in Table 1. The saturated permeability coefficient was measured by the constant head method with the Markov bottle, the pore volume was measured by the saturation method, and the porosity was obtained by dividing the pore volume by the sand column volume. Bulk density is obtained by dividing the weight of the sand column by its volume. The saturated volumetric water content was solved by using the Van Genuchten (VG) (Genuchten, 1980) model. It should be noted that the saturated volumetric water content and porosity are not identical for each particle size of quartz sand. This is because the application of the VG model to solve for the saturated volume water content requires the use of the centrifuge method to calculate the water content for each centrifugal force condition, and the quartz sand has poor water holding capacity, which can lead to errors when using the centrifuge method.
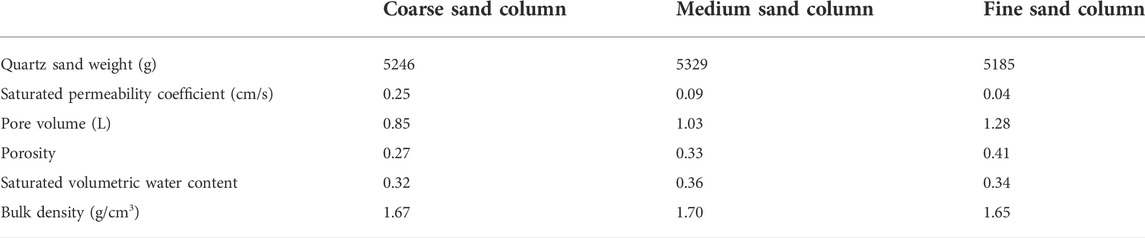
TABLE 1. The relevant parameters of packed columns.
Colloid transport experiments were conducted with the column vertically oriented. 12 flexible pipes were used to connect the water supply tank and the top cover of the column through the peristaltic pump, respectively. The colloid suspension was introduced into the column using the peristaltic pump at a fixed injection flow rate. Prior to each experiment, the pre-balance stage needs to be reached, that is, injecting deionized water at the same flow rate for 24 h before introducing colloidal suspension, so as to maintain a stable moisture content during the experiment. Initial leaching with deionized water was carried out for 24 h using downward flow from the top of the columns. At the end of the leaching process, the absorbance of the effluent was measured as the absorbance background value of each experiment. Table 2 summarizes the experimental conditions of each column for a total of 27 sets of column experiments. Liquid samples were collected from the column effluent by using a partial automatic collector (BSZ-40, Jihui analytical instrument (Shanghai) Co., Ltd) with a fixed time interval.
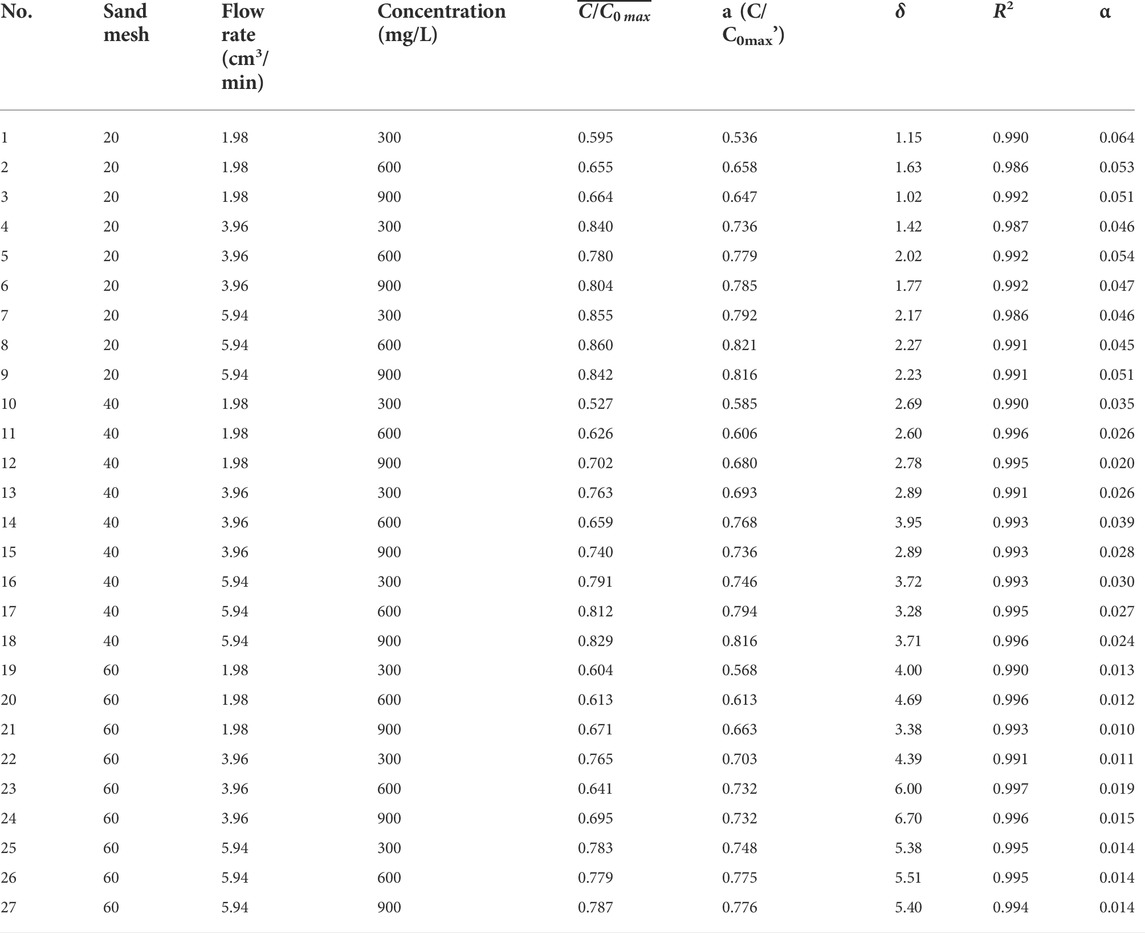
TABLE 2. The experimental conditions and characteristic parameters.
After the pre balance stage, the 12 flexible pipes connecting the water tank filled with deionized water reconnected to the container filled with montmorillonite colloidal suspension. The colloidal solution was let through the quartz sand column at the set injection flow rate. The concentration of montmorillonite colloid in the collected effluent was measured until 300 effluent samples were collected, indicating that the penetration stage was completed. For 20 mesh and 40 mesh quartz sand columns, nearly 12 PV (Pore Volume) colloidal solution was applied to collect 300 outflow samples. While in the 60 mesh quartz sand column, about 9 PV was applied.
When the above operations were completed, the elution stage begins. The 12 flexible pipeswere reconnected to the water tank with deionized water. The deionized water was let pass through the column at the set flow rate to measure the absorbance in the effluent until its value is the same or similar to the background absorbance. According to the experimental results, about 39 effluent samples can be collected at this stage to meet the conditions and stop the experiment. The absorbances (Abs) of all effluent were measured by UV-VIS spectrophotometer (UV1800, Shanghai Meipuda Instrument Co., Ltd) at 243 nm wavelength. After subtracting the background absorbance, the colloid concentration in the solution was calculated according to the standard curve. The breakthrough curves were obtained by plotting relative colloid concentration versus pore volume.
In order to ensure the consistency of the quartz sand structure inside the column during each group of experiments, after each conditional column experiment, the quartz sand column was cleaned with 100 L deionized water using a large water head difference. Generally, the absorbance of the effluent after cleaning is less than 0.07.
It should be emphasized that the whole experimental processes were carried out under the condition of 25°C in the absence of sunlight, and the temperature was adjusted and controlled by air conditioning.
In this study, Hydrus-1D was applied to simulate the water content of each sand column at different flow rates, where the water content increased with depth in the column. The average volumetric water content obtained for the same mesh of quartz sand column at the three flow rate experimental conditions did not differ significantly, while the water content at the top of the column and the depth at which the saturated volumetric water content was initially reached differed in each case. For subsequent calculations, the average volumetric water contents of the 20-, 40-, and 60-mesh quartz sand columns were obtained as 0.300, 0.355, and 0.310, respectively, based on the model results.
Derjaguin-Landau-Verwey-Overbeek (DLVO) theory is the cornerstone of colloidal science, which is used to describe the force between colloid and solid surface. The force is also referred as DLVO force, mainly including van der Waals force, and electric double layer force generated by electrostatic interaction. According to the DLVO theory, the total potential energy between the colloid and quartz sand particles is calculated by Eq 2 (Loveland et al., 1996):
where
For the sphere-plate particle geometry, the
where
where
The potential energy of the bilayer electrostatic force can be calculated by Eq 5 (Hogg et al., 1966; Mitropoulou et al., 2013):
where
where
The collision efficiency α, is generally estimated from the results of column experiments by Eq 7 in unsaturated porous media (Tufenkji and Elimelech, 2004):
where
where
where
where
where
where
where
The experimental results of montmorillonite colloid transportation in unsaturated packed column are expressed as breakthrough curves (BTCs), shown as the variation of percentages of aqueous phase mass concentration (C/C0) with PV. The breakthrough curves obtained for each experimental condition are shown in Figure 5.
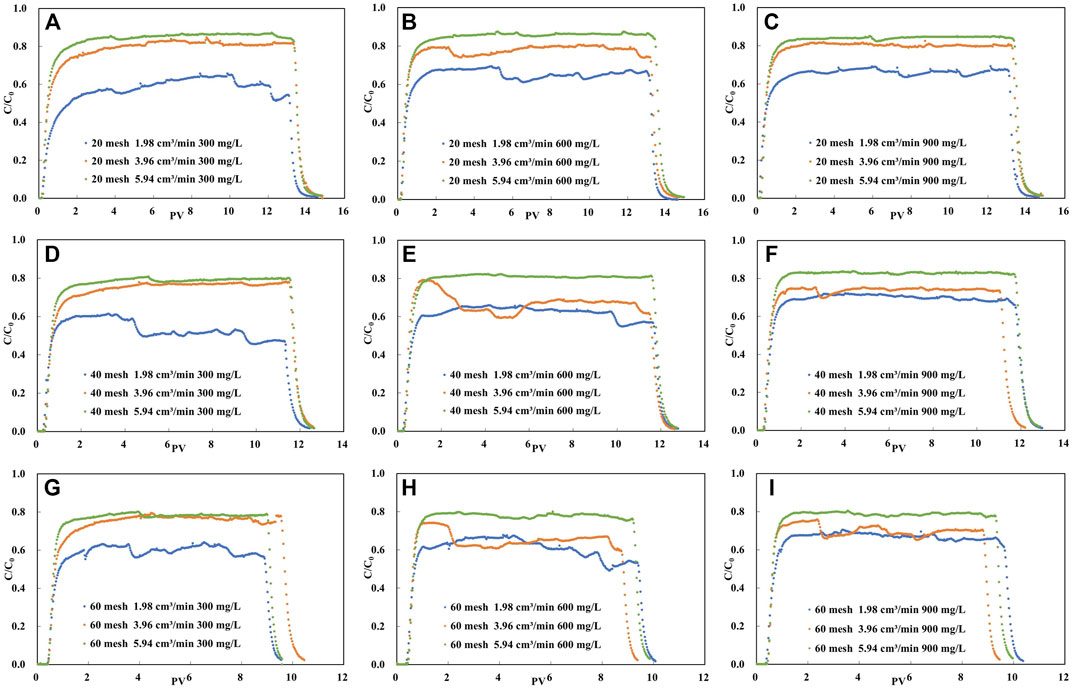
FIGURE 5. Experimental breakthrough data for the same concentration of colloid solution in the same mesh of quartz sand column under different flow rate conditions.
As can be seen from Figure 5, on the whole, each penetration curve shows a steep front and a long peak plateau period. Moreover, none of the peak values of the penetration curves of the colloid solutions reached 1, which indicates that there is retention of montmorillonite colloids migrating in the sand column. When the quartz sand particles are of the same size, the higher the plateau that the C/C0 of the penetration curve can reach as the flow rate increases from 1.98 cm3/min to 5.94 cm3/min. This was the case for all three colloidal concentration conditions.
In order to better compare the characteristics of the penetration curves of colloid solution obtained under various experimental conditions, the cumulative Weibull model is used to fit these penetration curves. The cumulative Weibull model is also known as the ‘stretch index’ function. It adds a parameter delta, which allows you to modify the inflection point. Moreover, the upper asymptote of the model is the maximum value of Y, and the lower asymptote can be non-zero. This model is usually used to simulate particle size during dissolution of solid dosage forms. The equation of this model is as follows:
where,
The variance obtained from each set of experimental model fits is greater than 0.9. The closer the R2 is to 1, the more accurate the model fit is proven.
As shown in Figure 5, the transport of colloids in unsaturated porous media is influenced by particle size, colloid concentration and injection flow rate. For analyze the effect of flow rate on colloid migration, we plot the peak variation of the penetration curve at different flow rates as demonstrated in Figure 6. The maximum of the peak mean values of the colloid breakthrough curves are 0.860 (Figure 6D), 0.829 (Figure 6E) and 0.787 (Figure 6F) for the three sand grain size cases, respectively. The maximum values are in the experimental condition with the highest flow rate and the minimum values are almost always in the experimental condition with the lowest flow rate (Figure 6).
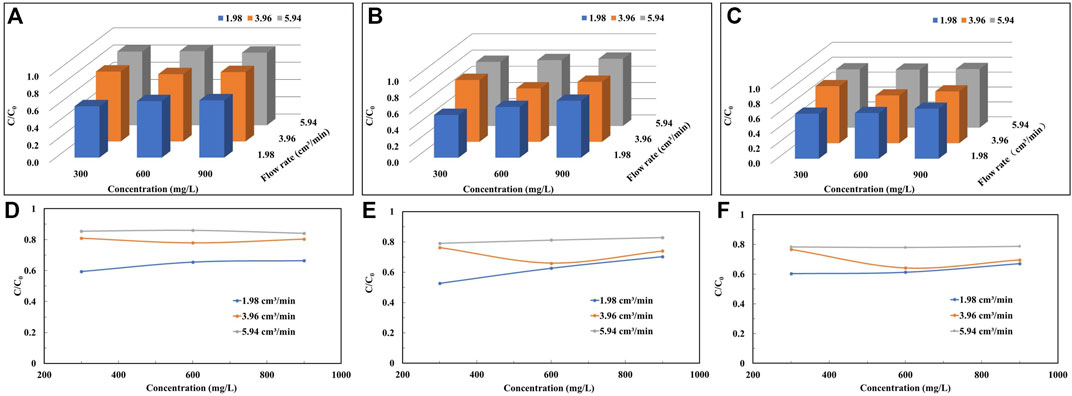
FIGURE 6. The peak plateau values of the penetration curves at different colloid concentrations and injection flow rates in unsaturated sand column: (A,D) 20 mesh, (B,E) 40 mesh, and (C,F) 60 mesh.
As shown in Figure 6D; Table 2, the average value of the peak of the breakthrough curve is 0.595 at a flow rate of 1.98 cm3/min under the coarse particle and low concentration condition, and nearly 40% of the colloids is deposited in the medium quartz sand during the transport in the sand column. Nevertheless, when the flow rate is increased to 5.94 cm3/min, the mean value of the peak penetration curve obtained in the experiment increases by 44%. In coarse particles and high concentration conditions, the peak mean value increases by 27% with increasing flow rate. The mean values of the peaks obtained by increasing the flow rate increase by 50% and 29% for medium and fine particle conditions, respectively, when the colloid solution concentration is low. Under the same conditions, the peak mean values increase by 18% and 17%, respectively, when the concentration of colloid solution is higher. When the quartz sand particle size is determined, the effect of increasing the colloid injection flow rate on the peak of the permeation curve is more pronounced at lower concentrations of colloid solution compared to higher concentrations of montmorillonite colloid solution.
As the flow rate increases, the migration of colloids in the sand column increases and the peak of the colloid penetration curve rises. This indicates that the increase in flow rate facilitates the migration of colloids in porous media. Similar findings have been reported by others (Shang et al., 2008; Fountouli and Chrysikopoulos, 2020). This is due to the fact that when the flow rate increases, the contact time between the colloid and the quartz sand particles decreases, reducing the possibility of colloid adsorption on the surface of the quartz sand particles, which is conducive to the migration of colloids. Another reason is that the increase of the flow velocity will generate a greater hydraulic shear force, which makes the colloids get more propulsion and migrate to the water, along the trajectory of the liquid phase (Chowdhury et al., 2011; Knappenberger et al., 2014), which will result in more colloids at the outflow end.
It can be seen from Figure 5 that when the mesh number of quartz sand is the same as the injection flow rate of colloidal solution, the peak platform value of penetration curve changes little with the initial concentration of colloidal solution, and the peak platforms almost coincide under each group of conditions.
According to Table 2, when the solution injection flow rate is 1.98 cm3/min and the colloid concentration remains unchanged, the difference of the peak platform value of the penetration curve obtained under the three types of quartz sand mesh is less than 0.1, and the same situation occurs when the flow rate is 5.94 cm3/min. Nevertheless, under the last flow rate, the difference of the peak platform value of the penetration curve obtained under the three types of quartz sand mesh is greater than 0.1.
Figure 5 demonstrates the variation of peak mean values of the penetration curves of colloid solutions with colloid concentration for the same injection flow rate and quartz sand particle size conditions. Under low flow rate conditions (Figure 7D), the peak mean values increase with increasing colloidal solution concentration and increase by 12%, 33% and 11% with increasing concentration as the quartz sand particles change from coarse to fine, respectively. However, under high flow rate conditions (Figure 7F), the peak mean values of the colloid breakthrough curves obtained for each quartz sand size condition do not vary significantly with concentration.
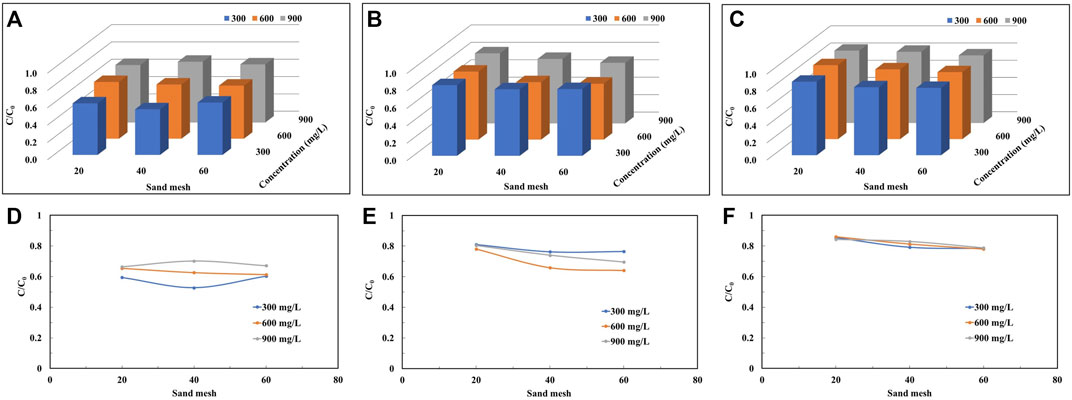
FIGURE 7. The peak plateau values of the penetration curves of quartz sand particles of different mesh sizes at different colloid concentrations under the conditions of injection flow rates: (A,D) 1.98 cm3/min, (B,E) 3.96 cm3/min, and (C,F) 5.94 cm3/min.
The mean values of the peak penetration curves obtain for colloid solutions of high concentration are larger than the results for other concentrations, both at low and high flow rates and for almost every grain size condition. When the concentration of colloid solution increases, the number of colloids in the solution increases per unit volume, and at the same time, there is competition for spots in the settling process, leading to a decrease in the settling rate, which enhances the migration.
The mean value of the peak increases with increasing flow rate by 44% (Figure 8D), 31% (Figure 8E) and 27% (Figure 8F) for the three concentration conditions in the coarse-grained sand column, respectively. Similarly, in the fine-grained sand column, the peak mean values increase by 30%, 27% and 17% with increasing flow rate, respectively. Compared to the coarse particle-filled quartz sand column, the peak mean values obtain for each concentration of solution in the fine sand condition show less variation with increasing flow rate. As the particle size becomes smaller, the pore volume used to be able to detect colloids in the effluent increases (Figure 5).
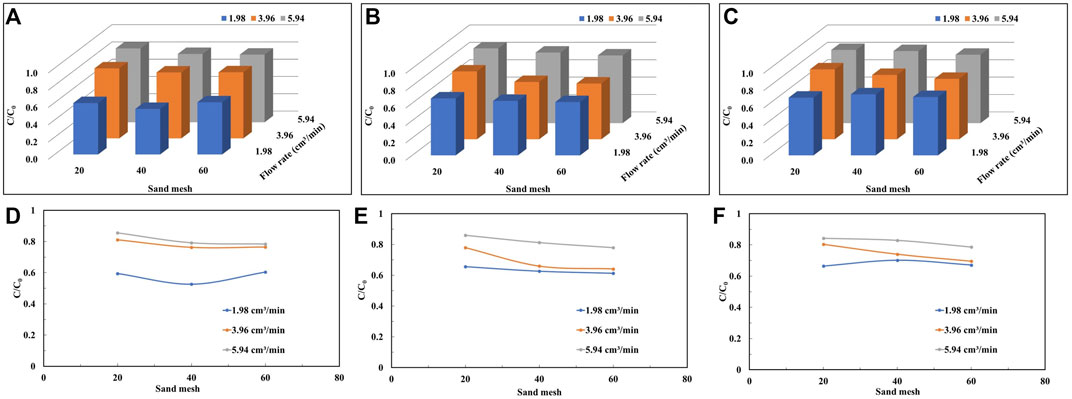
FIGURE 8. The peak plateau values of the penetration curves of quartz sand particles of different mesh sizes at different injection flow rates under the conditions of colloid concentration: (A,D) 300 mg/L, (B,E) 600 mg/L, and (C,F) 900 mg/L.
Figure 8; Table 2 show that regardless the colloid concentration, the peak mean values tend to decrease with smaller particle size of the quartz sand particles when the flow rate are 3.96 cm3/min and 5.94 cm3/min. At high flow rates, the peak mean values decrease by 8%, 9%, and 7%, respectively, as the number of sand mesh becomes larger. While at moderate flow rates, the peak mean values decrease by 6%, 18%, and 14%, respectively. This indicates that when the quartz sand particles change from coarse to fine, the specific surface area of sand particles increases, so the contact area between colloid and particles increases, which is favorable for the deposition of colloid particles. It is worth noting that the variation of the peak mean values at low flow rates, when the colloid solution is at low and high concentrations, is not the same as the results for other conditions.
In this study, although natural montmorillonite colloids are not spherical, it is assumed that the colloids are spherical and apply the equations mentioned previously to calculate the forces acting on the colloidal particles (Shang et al., 2008; Fountouli and Chrysikopoulos, 2020). According to the DLVO theory, Figure 9 shows the total DLVO potential energy of the interaction between the montmorillonite colloid and the solid-water interface (SWI) and the colloid and the air-water interface (AWI) under the experimental conditions in this study. According to the colloidal particle size distribution curve (Figure 1), the diameters of D10 (100 nm), D50 (150 nm), D60 (160 nm) and D90 (280 nm) were used to calculate DLVO potential energy, where D50 is used to indicate the average particle size of colloidal particle size (Figure 9).
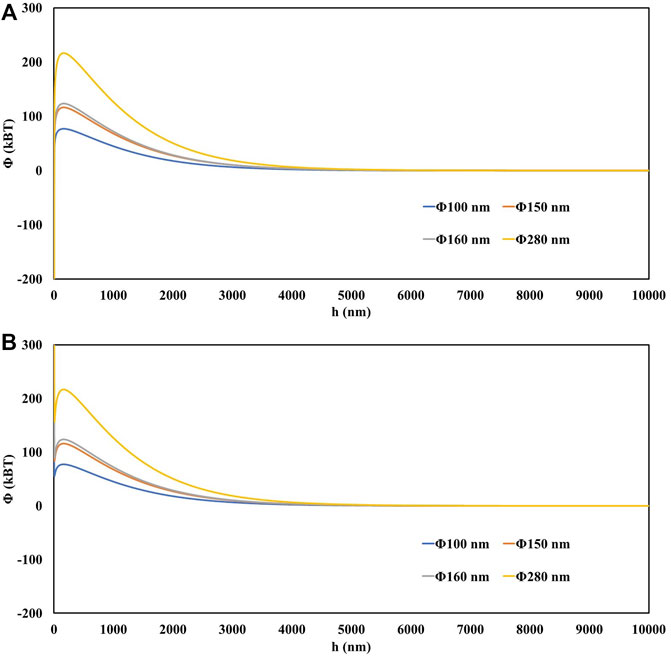
FIGURE 9. The total DLVO energy profile for: (A) montmorillonite colloid–SWI and (B) montmorillonite colloid–AWI, as a function of separation distance.
In this experiment, the average particle size of montmorillonite colloid was 150 nm, and its potential barrier in the deionized water and quartz sand system was calculated as 116.10
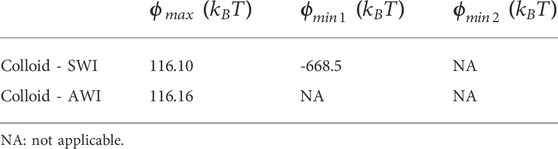
TABLE 3. Estimated φmax, φmin1 and φmin2 using DLVO theory for the colloid particle size of 150 nm.
This experiment considers unsaturated conditions, where AWIs exist during colloid migration and non-DLVO interactions such as hydrophobic, hydrodynamic and capillary forces may occur for colloids on AWIs (Bradford and Torkzaban, 2008). The capillary energy is calculated from the distance the colloid protrudes from the film or the air-water-solid interface, and the values obtained in the studies are several orders of magnitude larger than the total DLVO potential obtained (Syngouna and Chrysikopoulos, 2015; Fountouli and Chrysikopoulos, 2020). Thus, the capillary energy is sufficient to push the colloid to the quartz sand surface, where it is attracted by van der Waals forces, leading to the retention of the colloid (Gao et al., 2008).
The collision efficiency α, was calculated for all experiments according to Eqs 7-15 and the results are presented in Table 2. Combining Table 2; Figure 10, it can be seen that the α obtained in the sand column of the same quartz sand grain size under high flow rate experimental conditions does not differ much. According to the colloid filtration theory (CFT), an increase in the interstitial flow rate decreases the number of collisions occurring between the passive colloid particles and the collectors, which does not favor the retention of colloids and leads to an increase in the number of movable colloids (Walshe et al., 2010; Fountouli and Chrysikopoulos, 2020). This is consistent with the phenomenon that the peak of the breakthrough curve of colloids is the largest at high flow rate conditions as shown in Figure 8. Moreover, the peak of the breakthrough curve for the same particle size of quartz sand hardly varies with the colloid concentration at high flow rates, also because the fast flow rate reduces the number of effective collisions, and the flow rate affects the colloid migration to a greater extent than the effect of colloid concentration changes.
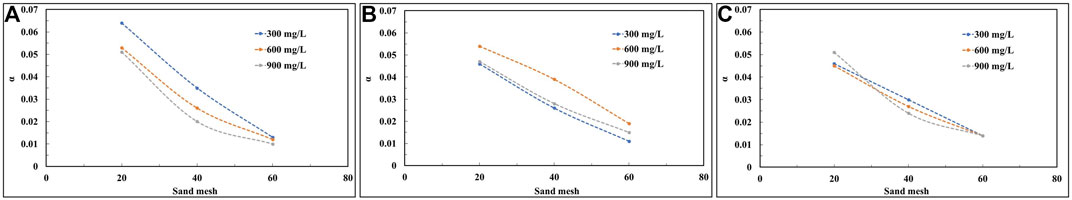
FIGURE 10. The collision efficiencies of: (A) 1.98 cm3/min, (B) 3.96 cm3/min, and (C) 5.94 cm3/min.
Under low flow rate conditions, increasing colloid solution concentrations lowers the α value (Figure 10A). Figure 7D demonstrates that an increase in colloid concentration reduces the collision between colloid particles and the collector, with a consequent increase in the peak of the penetration curve. However, in the experiment with a flow rate of 3.96 cm3/min, the α value did not change similarly to the low flow rate condition (Figure 10B). The reason for this is presumed to be that when the flow rate increased from 1.98 to 3.96 cm3/min, the flow rate dominated the degree of influence of flow rate and colloid concentration on colloid transport.
In this study, quartz sand column experiments were used to determine the impact of flow rate, grain size, and colloid concentration on the transport of sodium montmorillonite colloids through the porous media. The experimental results of the study indicated that colloid retention occurred under all experimental conditions.
(1) When the size of the quartz sand particles is determined, an increase in the flow rate reduces the retention of colloids, regardless of whether the concentration of the colloid solution is low or high. For the coarse particle and low concentration cases, an increase in flow rate from 1.98 cm3/min to 5.94 cm3/min increased the peak mean by 44%, while for the high concentration case, the peak mean increased by only 27%. Flow rate effects on the migration of colloids are more significant at lower concentration.
(2) At a flow rate of 5.94 cm3/min, the peak mean values of the breakthrough curves decreased by 8%, 9% and 7% with increasing the number of quartz sand mesh, respectively. Under the same flow rate condition, the peak average value of the breakthrough curve almost does not change with the change of colloid concentration.
(3) In the case of montmorillonite colloid solution transport in a column of unsaturated quartz sand, the injection flow rate of the solution plays a major role in the migration of the colloid, the size of the porous medium grains plays a secondary role, and then followed by the initial concentration of the solution (that is, flow rates > grain size > concentration).
(4) By calculating the total DLVO potential energy between the colloid and the quartz sand, it is inferred that there is a non-DLVO force—capillary force effect on the colloid retention phenomenon appearing in this study.
The experimental results of this study would be useful for the environmental decision-makers to prevent water resource contamination migrate through the carrier band of colloid in the water flow.
The raw data supporting the conclusion of this article will be made available by the authors, without undue reservation.
LZ: analyzing data, and drafting the manuscript. JZ: designing experiments. QZ: revising and editing the manuscript. JS and YC: development or design of methodology. AZ: analyzing conclusions.
This work was supported by Platform Open Fund of China Institute for Radiation Protection-Key Laboratory of Radiation Environment and Health: National of Environmental Protection and the National Natural Science Foundation of China (Grant No. 42272295).
The authors are thankful to the China Institute for Radiation Protection for their help in providing the laboratory.
The authors declare that the research was conducted in the absence of any commercial or financial relationships that could be construed as a potential conflict of interest.
All claims expressed in this article are solely those of the authors and do not necessarily represent those of their affiliated organizations, or those of the publisher, the editors and the reviewers. Any product that may be evaluated in this article, or claim that may be made by its manufacturer, is not guaranteed or endorsed by the publisher.
The Supplementary Material for this article can be found online at: https://www.frontiersin.org/articles/10.3389/fenvs.2022.1058351/full#supplementary-material
Awan, F. U. R., Al-Yaseri, A., Akhondzadeh, H., Iglauer, S., and Keshavarz, A. (2022). Influence of mineralogy and surfactant concentration on zeta potential in intact sandstone at high pressure. J. Colloid Interface Sci. 607, 401–411. doi:10.1016/j.jcis.2021.08.015
Bradford, S. A., and Kim, H. (2010). Implications of cation exchange on clay release and colloid-facilitated transport in porous media. J. Environ. Qual. 39 (6), 2040–2046. doi:10.2134/jeq2010.0156
Bradford, S. A., and Torkzaban, S. (2008). Colloid transport and retention in unsaturated porous media: a review of interface‐, collector‐, and pore‐scale processes and models. Vadose zone J. 7, 667–681. doi:10.2136/vzj2007.0092
Chowdhury, I., Hong, Y., Honda, R. J., and Walker, S. L. (2011). Mechanisms of tio2 nanoparticle transport in porous media: role of solution chemistry, nanoparticle concentration, and flowrate. J. Colloid Interface Sci. 360 (2), 548–555. doi:10.1016/j.jcis.2011.04.111
Chrysikopoulos, C. V., and Syngouna, V. I. (2012). Attachment of bacteriophages MS2 and ΦX174 onto kaolinite and montmorillonite: Extended-DLVO interactions. Colloids Surfaces B Biointerfaces 92, 74–83. doi:10.1016/j.colsurfb.2011.11.028
Fountouli, T. V., and Chrysikopoulos, C. V. (2020). Effect of clay colloid particles on formaldehyde transport in unsaturated porous media. Water 12, 3541. doi:10.3390/w12123541
Gao, B., Steenhuis, T. S., Zevi, Y., Morales, V. L., Nieber, J. L., Richards, B. K., et al. (2008). Capillary retention of colloids in unsaturated porous media. Water Resour. Res. 44 (4), 135–157. doi:10.1029/2006WR005332
Genuchten, M. T. V. (1980). A closed-form equation for predicting the hydraulic conductivity of unsaturated soils. Soil Sci. Soc. Am. J. 44 (5), 892–898. doi:10.2136/sssaj1980.03615995004400050002x
Gregory, J. (1981). Approximate expressions for retarded van der waals interaction. J. Colloid Interface Sci. 83 (1), 138–145. doi:10.1016/0021-9797(81)90018-7
Grolimund, D., Borkovec, M., Barmettler, K., and Sticher, H. (1996). Colloid-facilitated transport of strongly sorbing contaminants in natural porous media: a laboratory column study. Environ. Sci. Technol. 30 (10), 3118–3123. doi:10.1021/es960246x
Haque, M. E., Shen, C., Li, T., Chu, H., Wang, H., Li, Z., et al. (2017). Influence of biochar on deposition and release of clay colloids in saturated porous media. J. Environ. Qual. 46 (6), 1480–1488. doi:10.2134/jeq2017.06.0223
Hogg, R., Cahn, D. S., Healy, T. W., and Fuerstenau, D. W. (1966). Diffusional mixing in an i-deal system. Chem. Eng. Sci. 21 (11), 1025–1038. doi:10.1016/0009-2509(66)85098-4
Kim, S. B., Corapcioglu, M. Y., and Kim, D. J. (2003). Effect of dissolved organic matter and bacteria on contaminant transport in riverbank filtration. J. Contam. Hydrol. 66 (1/2), 1–23. doi:10.1016/S0169-7722(03)00025-1
Knappenberger, T., Flury, M., Mattson, E. D., and Harsh, J. B. (2014). Does water content or flow rate control colloid transport in unsaturated porous media? Environ. Sci. Technol. 48, 3791–3799. doi:10.1021/es404705d
Lenhart, J. J., and Saiers, J. E. (2002). Transport of silica colloids through unsaturated porous media: experimental results and model comparisons. Environ. Sci. Technol. 36 (4), 769–777. doi:10.1021/es0109949
Liu, R., Liu, F., Dong, Y., Jiao, J., Rm, E., and Zhu, L. (2022). Microplastic contamination in lacustrine sediments in the Qinghai-Tibet Plateau: Current status and transfer mechanisms. China Geol. 5, 421–428. doi:10.31035/cg2022030
Loveland, J. P., Ryan, J. N., Amy, G. L., and Harvey, R. W. (1996). The reversibility of virus attachment to mineral surfaces. Colloids Surfaces A Physicochem. Eng. Aspects 107, 205–221. doi:10.1016/0927-7757(95)03373-4
Ma, J., Guo, H., Weng, L., Li, Y., Lei, M., and Chen, Y. (2018). Distinct effect of humic acid on ferrihydrite colloid-facilitated transport of arsenic in saturated media at different pH. Chemosphere 212 (12), 794–801. doi:10.1016/j.chemosphere.2018.08.131
Mitropoulou, P. N., Syngouna, V. I., and Chrysikopoulos, C. V. (2013). Transport of colloids in unsaturated packed columns: role of ionic strength and sand grain size. Chem. Eng. J. 232, 237–248. doi:10.1016/j.cej.2013.07.093
Ohnuki, T., Kozai, N., Sakamoto, F., Ozaki, T., Francis, A. J., Suzuki, Y., et al. (2010). Associati-on of actinides with microorganisms and clay: implications for radionuclide migration fro-m waste-repository sites. Geomicrobiol. J. 27 (3), 225–230. doi:10.1080/01490450903456715
Olphen, V., and Fripiar, J. J. (1979). Data handbook for clay materials and other non-metallic minerals. Oxford: Pergamon Press. doi:10.1346/CCMN.1980.0280215
Saiers, J. E., and Lenhart, J. J. (2003a). Colloid mobilization and transport within unsaturated porous media under transient-flow conditions. Water Resour. Res. 39 (1), SBH 10–11. doi:10.1029/2002WR001370
Saiers, J. E., and Lenhart, J. J. (2003b). Correction to “Ionic-strength effects on colloid transport and interfacial reactions in partially saturated porous media”. Water Resour. Res. 41 (9), 149–163. doi:10.1029/2004WR003917
Schoonheydt, R. A., Johnston, C. T., and Bergaya, F. (2018). Clay minerals and their surfaces. Dev. Clay Sci. 9, 1–21. doi:10.1016/B978-0-08-102432-4.00001-9
Shang, J., Flury, M., Chen, G., and Zhuang, J. (2008). Impact of flow rate, water content, and capillary forces on in situ colloid mobilization during infiltration in unsaturated sediments. Water Resour. Res. 44 (6), 376–380. doi:10.1029/2007WR006516
Shehata, A. M., and Nasr-El-Din, H. A. (2015). “Zeta potential measurements: impact of salinity on sandstone minerals,” in SPE International Symposium on Oilfield Chemistry, Texas, USA, April 13-15, 1–17. doi:10.2118/173763-MS
Sposito, G., Skipper, N. T., Sutton, R., Park, S. h., Soper, A. K., and Greathouse, J. A. (1999). Surface geochemistry of the clay minerals. Proc. Natl. Acad. Sci. U. S. A. 96 (7), 3358–3364. doi:10.1073/pnas.96.7.3358
Syngouna, V. I., and Chrysikopoulos, C. V. (2013). Cotransport of clay colloids and viruses in water saturated porous media. Colloids Surfaces A Physicochem. Eng. Aspects 416, 56–65. doi:10.1016/j.colsurfa.2012.10.018
Syngouna, V. I., and Chrysikopoulos, C. V. (2016). Cotransport of clay colloids and viruses through water-saturated vertically oriented columns packed with glass beads: gravity effects. Sci. Total Environ. 545-546, 210–218. doi:10.1016/j.scitotenv.2015.12.091
Syngouna, V. I., and Chrysikopoulos, C. V. (2015). Experimental investigation of virus and clay particles cotransport in partially saturated columns packed with glass beads. J. Colloid Interface Sci. 440 (440), 140–150. doi:10.1016/j.jcis.2014.10.066
Syngouna, V. I., Chrysikopoulos, C. V., Kokkinos, P., Tselepi, M. A., and Vantarakis, A. (2017). Cotransport of human adenoviruses with clay colloids and TiO2 nanoparticles in saturated porous media: effect of flow velocity. Sci. Total Environ. 598, 160–167. doi:10.1016/j.scitotenv.2017.04.082
Syngouna, V. I., and Chrysikopoulos, C. V. (2011). Transport of biocolloids in water saturated columns packed with sand: effect of grain size and pore water velocity. J. Contam. Hydrol. 126 (3-4), 301–314. doi:10.1016/j.jconhyd.2011.09.007
Tokunaga, T. K. (2011). Physicochemical controls on adsorbed water film thickness in unsatu-rated geological media. Water Resour. Res. 47, W08514. doi:10.1029/2011WR010676
Torkzaban, S., Bradford, S. A., Genuchten, M., and Walker, S. L. (2008). Colloid transport in unsaturated porous media: the role of water content and ionic strength on par-ticle straining. J. Contam. Hydrol. 96 (1-4), 113–127. doi:10.1016/j.jconhyd.2007.10.006
Torok, J., Buckley, L. P., and Woods, B. L. (1990). The separation of radionuclide migration by solution and particle transport in soil. J. Contam. Hydrol. 6 (2), 185–203. doi:10.1016/0169-7722(90)90045-I
Tufenkji, N., and Elimelech, M. (2004). Correlation equation for predicting single-collector efficiency in physicochemical filtration in saturated porous media. Environ. Sci. Technol. 38 (2), 529–536. doi:10.1021/es034049r
Um, W., and Papelis, C. (2002). Geochemical effects on colloid-facilitated metal transport through zeolitized tuffs from the Nevada Test Site. Environ. Geol. 43 (1-2), 209–218. doi:10.1007/s00254-002-0646-4
Vilks, P., and Baik, V. (2001). Laboratory migration experiments with radionuclides and natural colloids in a granite fracture. J. Contam. Hydrol. 47 (2-4), 197–210. doi:10.1016/S0169-7722(00)00149-2
Vinogradov, J., and Jackson, M. D. (2015). Zeta potential in intact natural sandstones at elevated t-emperatures. Geophys. Res. Lett. 42, 6287–6294. doi:10.1002/2015GL064795
Walshe, G. E., Pang, L., Flury, M., Close, M. E., and Flintoft, M. (2010). Effects of pH, ionic strength, dissolved organic matter, and flow rate on the co-transport of ms2 bacteriophages with kaolinite in gravel aquifer media. Water Res. 44 (4), 1255–1269. doi:10.1016/j.watres.2009.11.034
Wang, C., Bobba, A. D., Attinti, R., Shen, C., Lazouskaya, V., Wang, L. P., et al. (2012). Retention and transport of silica nanoparticles in saturated porous media: effect of concentration and particle size. Environ. Sci. Technol. 46 (13), 7151–7158. doi:10.1021/es300314n
Won, J., Wirth, X., and Burns, S. E. (2019). An experimental study of cotransport of heavy metals with kaolinite colloids. J. Hazard. Mat. 373, 476–482. doi:10.1016/j.jhazmat.2019.03.110
Won, J., Kim, T., Kang, M., Choe, Y., and Choi., H. (2021). Kaolinite and illite colloid transport in saturated porous media. Colloids Surfaces A Physicochem. Eng. Aspects 626 (80), 127052. doi:10.1016/j.colsurfa.2021.127052
Xiao, Y., Hao, Q., Zhang, Y., Zhu, Y., Yin, S., Qin, L., et al. (2022a). Investigating sources, driving forces and potential health risks of nitrate and fluoride in groundwater of a typical alluvial fan plain. Sci. Total Environ. 802, 149909. doi:10.1016/j.scitotenv.2021.149909
Xiao, Y., Liu, K., Hao, Q., Li, Y., Xiao, D., and Zhang, Y. (2022b). Occurrence, controlling factors and health hazards of fluoride-enriched groundwater in the lower flood plain of yellow river, northern China. Expo. Health 14, 345–358. doi:10.1007/s12403-021-00452-2
Xiao, Y., Liu, K., Hao, Q., Xiao, D., Zhu, Y., Yin, S., et al. (2022c). Hydrogeochemical insights into the signatures, Genesis and sustainable perspective of nitrate enriched groundwater in the piedmont of Hutuo watershed, China. CATENA 212, 106020. doi:10.1016/j.catena.2022.106020
Yang, Y., Saiers, J. E., and Barnett, M. O. (2013). Impact of interactions between natural organic matter and metal oxides on the desorption kinetics of uranium from heterogeneous colloidal s-uspensions. Environ. Sci. Technol. 47 (6), 2661–2669. doi:10.1021/es304013r
Zevi, Y., Dathe, A., McCarthy, J. F., Richards, B. K., and Steenhuis, T. S. (2005). Distribution of colloid particles onto interfaces in partially saturated sand. Environ. Sci. Technol. 39 (18), 7055–7064. doi:10.1021/es048595b
Zhang, P., Bai, B., Jiang, S., Wang, P., and Li, H. (2016). Transport and deposition of suspended particles in saturated porous media: effect of hydrodynamic forces and pore structure. Water Supply 16 (4), 951–960. doi:10.2166/ws.2016.011
Zhang, Q., Hassanizadeh, S. M., Liu, B., Schijven, J. F., and Karadimitriou, N. K. (2014). Effect of hydrophobicity on colloid transport during two‐phase flow in a micromodel. Water Resour. Res. 50 (10), 7677–7691. doi:10.1002/2013WR015198
Zhang, Q., and Hassanizadeh, S. M. (2017). The role of interfacial tension in colloid retention and remobilization during two-phase flow in a polydimethylsiloxane micro-model. Chem. Eng. Sci. 168, 437–443. doi:10.1016/j.ces.2017.04.038
Keywords: colloid transport, unsaturated sand column, flow rate, grain size, colloid concentration
Citation: Zhang L, Zhu J, Zhang Q, Shao J, Cui Y and Zhang A (2022) Transport of montmorillonite colloid in unsaturated packed column: The combined effects of sand grain size, flow rate and colloid concentration. Front. Environ. Sci. 10:1058351. doi: 10.3389/fenvs.2022.1058351
Received: 30 September 2022; Accepted: 20 October 2022;
Published: 28 October 2022.
Edited by:
Yong Xiao, Southwest Jiaotong University, ChinaReviewed by:
Xiaolang Zhang, The University of Hong Kong, Hong Kong SAR, ChinaCopyright © 2022 Zhang, Zhu, Zhang, Shao, Cui and Zhang. This is an open-access article distributed under the terms of the Creative Commons Attribution License (CC BY). The use, distribution or reproduction in other forums is permitted, provided the original author(s) and the copyright owner(s) are credited and that the original publication in this journal is cited, in accordance with accepted academic practice. No use, distribution or reproduction is permitted which does not comply with these terms.
*Correspondence: Qiulan Zhang, cWx6aGFuZzkxOUBjdWdiLmVkdS5jbg==
Disclaimer: All claims expressed in this article are solely those of the authors and do not necessarily represent those of their affiliated organizations, or those of the publisher, the editors and the reviewers. Any product that may be evaluated in this article or claim that may be made by its manufacturer is not guaranteed or endorsed by the publisher.
Research integrity at Frontiers
Learn more about the work of our research integrity team to safeguard the quality of each article we publish.