 Jinyu Ye
 Rongyan Zhang4
 Lu Gao
95% of researchers rate our articles as excellent or good
Learn more about the work of our research integrity team to safeguard the quality of each article we publish.
Find out more
ORIGINAL RESEARCH article
Front. Environ. Sci. , 10 November 2022
Sec. Atmosphere and Climate
Volume 10 - 2022 | https://doi.org/10.3389/fenvs.2022.1058054
This article is part of the Research Topic Hydro-Climate Extremes and Natural Disasters During Global Warming: Observation, Projection, and Mitigation View all 11 articles
The daily precipitation data (20-20 o’clock) of 66 meteorological stations from 1981 to 2020 were collected. According to the definition of rainstorm day and rainstorm process, 614 non-typhoon rainstorm processes data were obtained after removing the typhoon rainstorm processes data. Combined with the topographic data, the geological disaster points data and the social economic data, this study established an indices system from four aspects: disaster-causing factors, disaster-formative environment, disaster-affected bodies, and disaster prevention and mitigation abilities. Based on the analytic hierarchy process, the entropy method and the correlation coefficient analysis method, the combination weighting was assigned to carry out the non-typhoon rainstorm disaster risk assessment. The results show that the spatial pattern of the comprehensive risk of non-typhoon rainstorm in Fujian Province is completely different from that of typhoon rainstorm in this study area. It shows a gradually increasing trend from the eastern coastal area to the mountainous area in the northwest. The risk areas above middle were observed in the northwestern Fujian and the narrow coastal area of southeastern Fujian. Risk of most of the areas between the two mountain ranges in the middle and northwest of Fujian was relatively lower. The disaster-causing factors were the dominant risk factors of non-typhoon rainstorm. The spatial pattern of non-typhoon rainstorm hazard is obviously affected by the topography of Fujian Province. The comprehensive risk pattern of a specific historical non-typhoon rainstorm case is significantly different from that of the general comprehensive risk of non-typhoon rainstorm disasters. In terms of historical cases, most of the higher-risk and high-risk areas of non-typhoon rainstorm cases were generally small, and were concentrated in northwestern Fujian, but the comprehensive risk pattern of different cases was significantly different.
The intensity and frequency of various natural disaster events have increased due to the recent climate change (Chen et al., 2022; Li et al., 2021; Chan et al., 2021; Li et al., 2020; Shang et al., 2019). The rainstorm flood disasters account for about 40% (Zhou et al., 2019). Consequently, developing effectively methods of rainstorm disasters risk assessment and zoning has increasingly attracted the attention of relevant scholars and government departments, and has become a hot research issue (Zhou et al., 2019; Xie and LiuXu, 2022a; Huang et al., 2022; Qiu et al., 2022; Xu et al., 2022). Located on the southeastern coast of China (Figure 1), Fujian Province is among the provinces worst affected by rainstorm disasters. There are two main types of rainstorms affecting Fujian Province, the typhoon rainstorm and the non-typhoon rainstorm. This study carries out risk assessment research for non-typhoon rainstorm disasters.
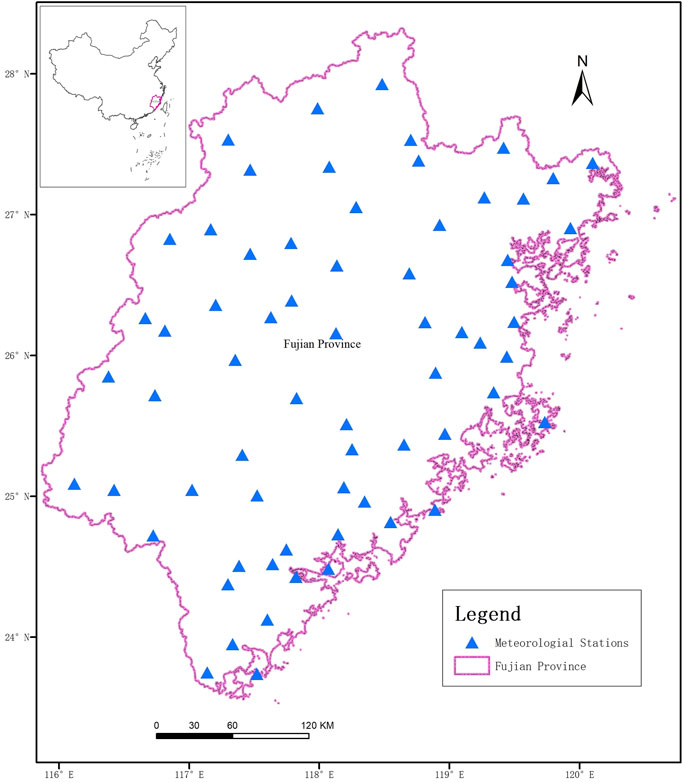
FIGURE 1. Location of study area and meteorological stations.
There have been many research results on the risk of rainstorm disaster. Ma et al. (2021) established risk assessment model based on a set of index system including regional vulnerability, adaptability and restorability of cities and weighted clustering assessment to realize the risk assessment of urban rainstorm and flood disaster. Wu et al. (2021) established an indicator system for urban rainstorm flooding based on an urban element analysis and determined the relative importance of the indicators based on the RF algorithm to identify the urban rainstorm flood disaster-sensitive indicator. Li et al. (2020) used the Bohai Rim, China, as a case study, and studied the risk of rainstorms under different return periods. Zhou et al. (2019) systematically reviewed the research history and the achievements of research progress on risk assessment of heavy rainfall and flood disasters in China. Chen et al., 2019b established the cloud matter-element model by coupling the cloud model with the matter-element analysis method, and assessed the risk of urban rainstorm disasters in Nanjing from 2011 to 2016. Wang et al. (2019) established a rainstorm disaster risk assessment model and conducted a graded assessment, and analyzed its impact on agriculture. Li et al. (2019) assessed the risk of rainstorm and flood disasters based on the hazard grades/indices in Qinghai Province. Xu et al. (2018) studied the climate change characteristics of rainstorm and risk assessment of rainstorm rainfall in Jinshan of Shanghai in recent 60 years. In recent years, there are also many studies on the types and characteristics of rainstorm disasters. Jou (2020) reviewed the non-typhoon heavy rain research in Taiwan for the past 30 years. Chen et al. (2019) and Lin et al. (2017) divided the rainstorms in the southeastern coastal areas of China into the rainstorms that occurred in the pre-flood season from April to June and the typhoon rainstorms that occurred from July to September according to the time nodes, and carried out rainstorm flood researches based on the classification. These studies provide rich experience, theories and methods for rainstorm disaster risk assessment. However, most of the rainstorm disaster risk assessments did not distinguish different rainstorm types. In fact, the climatic characteristics of different types of rainstorms are obviously different, and the risk patterns are significantly different. On the other hand, researches have shown that the southeastern coastal areas of China are affected by typhoons from April to October (Ye, 2015). Typhoon rainstorms may occur in the pre-flood season, and the frontal rainstorms may also occur in typhoon season (Ying et al., 2011; Zhao et al., 2020). Therefore, the classification of typhoon rainstorm and non-typhoon rainstorm based on time node is not reasonable.
Consequently, distinguishing typhoon rainstorms from non-typhoon rainstorms scientifically and reasonably, and carrying out risk assessments based on different types of rainstorm disasters can improve the pertinence of risk prevention, which is of great significance for disaster prevention and mitigation departments. This study collected rainstorm data from 66 major meteorological stations in Fujian Province from 1981 to 2020. According to the influence time of each typhoon every year, the non-typhoon rainstorm data was obtained by excluding the typhoon rainstorm data. Combined with the ground basic data, the non-typhoon rainstorm disaster risk assessment was carried out. The objectives were to: 1) focus on the impact of non-typhoon rainstorms and discuss the risk assessment methods of non-typhoon rainstorms, 2) analyze the characteristics of non-typhoon rainstorms hazard, the sensitivity of disaster-formative environment, the vulnerability of disaster-affected bodies and the ability of disaster prevention and mitigation, 3) obtain the spatial pattern of non-typhoon rainstorm risks. The outcome of this study can provide effective scientific support for decision-making of disaster prevention and mitigation departments.
As shown in Table 1, it lists the main data and their source. The non-typhoon rainstorm data come from the Fujian Climate Center. According to the definitions of rainstorm day and rainstorm process in the Provisional Regulations on Disaster Weather Forecasting Services in Fujian Province issued by the Science, Technology and Forecast Division of Fujian Meteorological Bureau, that is, a rainstorm day refers to at least three stations with daily rainfall exceeding 50 mm and a rainstorm process refers to a weather process with more than one consecutive rainstorm day. The daily precipitation data (20-20 o’clock) of 66 meteorological stations (Figure 1) from 1981 to 2020 were collected. The rainstorm processes data were extracted based on the definitions of rainstorm day and rainstorm process. According to the influence time of each typhoon every year, 614 non-typhoon rainstorm processes data were obtained after removing the typhoon rainstorm processes data. The basic information and disaster data of non-typhoon rainstorm cases that have affected Fujian Province during 1981–2020 come from Climatological Bulletin of Fujian Province (2001–2020) and the Climate of FUJIAN (Second Edition) (Lu and Wang, 2012). The topographic data of Disaster-formative environment is a 30 m resolution DEM generated from the 1:100000 topographic map of Fujian Province. The geological disaster points data come from the website of Fujian Provincial Department of Natural Resources, and the geological disaster points density is obtained by statistical analysis and calculation with town level administrative region as the basic unit. Most of the data related to the vulnerability of disaster-affected bodies and ability of disaster prevention and mitigation come from the 2021 Fujian Statistical Yearbook and the 7th National Census Bulletin of nine prefecture-level cities in Fujian Province, China.
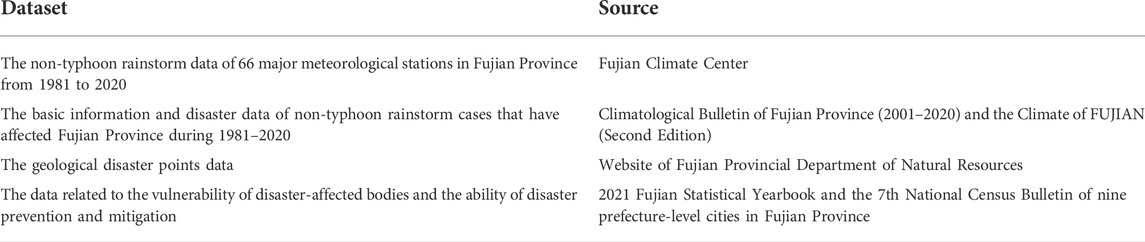
TABLE 1. Data source.
According to the disaster system theory (Shi, 2002; Shi et al., 2014), disaster risk is the result of the comprehensive effect of disaster-causing factors, disaster-formative environment and disaster-affected bodies. Based on the study on disaster mechanism of non-typhoon rainstorm and the characteristics of disaster-formative environment and disaster-affected bodies in Fujian Province, the characterization indicators of non-typhoon rainstorm disaster risk were selected from four aspects: hazard of the disaster-causing factors, sensitivity of the disaster-formative environment, vulnerability of the disaster-affected body and disaster prevention and mitigation ability.
Disaster-causing factor is the direct cause of disaster. It is a universal natural phenomenon that is generally unavoidable and difficult to change. Hazard analysis of disaster-causing factor is the basis of risk assessment. Its core is studying the characteristics of the spatiotemporal conditions, probability, and intensity of disaster-causing factors, and then obtaining the hazard results. The spatiotemporal conditions refer to determining the time span and spatial scope of the impact of the disaster-causing factors. Therefore, this study analyzed the hazard of the disaster-causing factors based on the intensity and spatiotemporal scope analysis of non-typhoon rainstorms.
The disaster-formative environment refers to the natural environment in the area affected by rainstorm, which has regional differences. The overlay of different disaster-formative environments, different disaster-causing factors and different disaster-affected body will produce different types of disasters. The more sensitive the disaster-formative environment is, the greater the risk of disasters. Among the influencing factors of disaster-formative environment, the most important are terrain factors. The changes of terrain factors will cause a series of changes in other elements such as hydrology, climate, soil and vegetation. Therefore, the sensitivity analysis of terrain factors can be used to reflect the sensitivity of non-typhoon rainstorm disaster-formative environment. Consequently, this study selected the elevation, slope, terrain relief and the density of potential geological disaster points to analyze the sensitivity of the non-typhoon rainstorm disaster-formative environment in Fujian.
The disaster-affected body refers to the human socio-economic system in the rainstorm disaster affected area. Its characterization indicators include population density, wealth accumulation, crop sown area, urban morphological characteristics and infrastructure conditions. The combination and spatial distribution of their quantity and quality are the main causes of rainstorm disasters. The vulnerability of non-typhoon rainstorm disaster-affected bodies refers to the characteristics of disaster-affected bodies that are easily damaged and injured by rainstorm. The greater the vulnerability value, the weaker the ability of the disaster-affected body to resist the impact of rainstorm disasters, and the greater the risk. On the contrary, it shows that the stronger the ability of the disaster-affected body to resist the impact of rainstorm disasters, the smaller the risk. This study analyzed the vulnerability of non-typhoon rainstorm disaster-affected bodies in Fujian Province based on the analysis of population and social economy.
The main purpose of disaster prevention and mitigation is to reduce the loss of life and property caused by disasters. The ability of disaster prevention and mitigation is also reflected in the prediction before disaster, the response and rescue when disaster occurs, and the recovery and reconstruction after disaster. According to the National Comprehensive Disaster Prevention and Mitigation Plan (2016–2020) and the Emergency Response Law of the People’s Republic of China, combined with the actual situation of Fujian Province, this study selected relevant indicators from three aspects: the monitoring and early warning capabilities, emergency response and rescue capabilities and post disaster recovery ability to characterize the disaster prevention and mitigation ability of non-typhoon rainstorm disasters.
In summary, twenty-four indices from four aspects were selected to characterize the risk of non-typhoon rainstorm disaster (Table 2).

TABLE 2. Indices system of the non-typhoon rainstorm disaster risk assessment of Fujian Province, China.
Commonly used index weight-determination methods include subjective weighting and objective weighting. Subjective weighting method determines the weight of each index by scoring according to the importance of index. It includes cycle scoring method, binomial coefficient method, analytic hierarchy process, etc. Since this method determines the weight by individual judgment of experts, it has greater randomness when there are many indicators. Objective weighting method uses the objective information reflected by each index to weight, such as correlation coefficient weighting method, entropy method, etc. Although this method can reflect the amount of information of each index, it cannot benefit from the knowledge and experience of decision-makers (Sahoo et al., 2016). Considering that the combination weighting method gives each index a different weight based on the data characteristics and empirical judgment, provides additional insights into overcoming the one-sidedness of a single subjective or objective weighting method (Xie et al., 2022b), and has been commonly employed (Tian et al., 2020; Xie and LiuXu, 2022a; Xie et al., 2022b; Wu et al., 2022). Therefore, this study used the combination weighting method to determine the index weight. Using the idea of analytic hierarchy process (AHP) for reference, the importance degree was judged in the first-level indicators layer with less classification, and the weights were determined by AHP, while the weights of the second and third-level indicators layer were determined by the correlation coefficient weighting method and entropy method (see Table 2). Among them, the hazard indices of disaster-causing factors were weighted by correlation coefficient method, while the sensitivity indices of disaster-formative environment, vulnerability indices of disaster-affected body and the ability indices of disaster prevention and mitigation were comprehensively weighted by correlation coefficient method and entropy method. The average weight calculated by the two methods was taken as the weight of the corresponding indicator.
There are many influential factors involved in the comprehensive risk assessment. Different factors are represented by different indicators, and the dimensions and magnitudes of each indicator are also different, so it needs to be standardized. The range standardization method was used in this study. The calculation formula is shown in Eqs 1, 2.
where rij is the standardized value of the ith evaluating object on the jth index, and max(xij) and min(xij) are the maximum and minimum of the ith evaluating object on the jth index, respectively. Among the indices, Eq. 1 should be used for those that strengthen the evaluating result, while Eq. 2 should be used for those that weaken the result.
The AHP method is one of the most widely employed subjective weighting methods. The AHP can integrate the effects of various variables and comprehensively consider the subjective experience of the data (Xie et al., 2022b). The weights of the four first-level indices were calculated by AHP method. The calculation steps were as follows:
① Construction of judgment matrix
The numbers 1–9 and their reciprocal were used as scales (see Table 3) to compare the four factors in pairs and construct the judgment matrix A.in which, A is the judgment matrix, aij represents the judgment value of the relative importance of factor ai to factor aj, and n is the number of factors.
② The weight of each index was calculated by sum-product method.
③ In order to prove the scientific nature and rationality of weights, a consistency test was required.
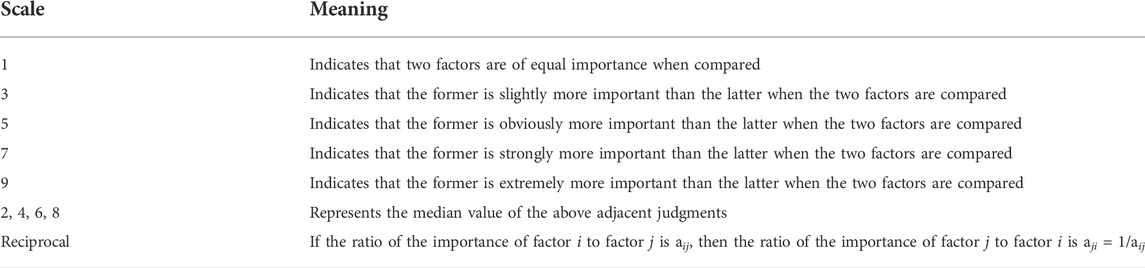
TABLE 3. Scales of Judgment matrix and their meanings.
Firstly, the maximum characteristic root and consistency index CI of the judgment matrix were calculated. Then the average random consistency index RI was found to be 0.89. And then the consistency ratio CR was calculated to be 0.0436, less than 0.1, indicating that the comparison between the factors in the judgment matrix was reasonable, which further indicated that the index weight calculated in step (2) was reasonable.
Correlation coefficient weighting method determines the weight according to the internal relationship between indicators (Li, 2007). It has no clear constraint on factors and can solve the correlation problem between factors. The calculation steps were as follows:
① The correlation coefficient matrix U of the m evaluation indices was obtained.
in which, U is the correlation coefficient matrix, uij (i, j = 1,2, … , m) is the correlation coefficient between the ith evaluation index and the jth evaluation index.
② The multivariate correlation coefficients between the ith evaluation index and other m-1 evaluation indices were calculated by Eq. 5.
in which,
③ The weight wi of each evaluation index can be obtained by normalizing the reciprocal of
The entropy method determines the index weight by using the spatial fluctuations of the data, which can eliminate human interference and make the evaluation result more objective (Ye et al., 2020). The calculation steps were as follows:
① Suppose there are l evaluating objects, and each object has m evaluating indices, then an original indices value matrix X is formed.
② Eqs 1, 2 is used to standardize the original indices value matrix X to generate standardized matrix R, and rij is the element of R.
③ According to the traditional entropy concept, the entropy of each evaluating index can be defined as
Where
④ The weight of the entropy of each evaluating index can be expressed as
in which, 0 ≤ wj ≤ 1,
Weighted comprehensive evaluation method considers the overall impact of various factors on the assessment object. It groups various specific indices together, and uses a quantitative index to express the advantages and weaknesses of the whole evaluation object. This method is commonly used. It is especially suitable for comprehensive analysis, evaluation and optimization of technology, decision-making, or a case study (Zhang and Li, 2007; Ye et al., 2020). The risk of non-typhoon rainstorm disaster relates to many factors with different influences. Therefore, the weighted comprehensive evaluation method was used to group the specific indices together, which can be expressed as
where C is the value of the composite risk index; ck is the standard value of the kth indicator; and wk is the weight of the kth indicator.
According to the characteristics of the non-typhoon rainstorm disasters in Fujian Province, the risk analysis of non-typhoon rainstorm disasters was carried out from four aspects: Hazard of the disaster-causing factors, sensitivity of the disaster-formative environment, vulnerability of the disaster-affected bodies and ability of the disaster prevention and mitigation. The risk assessment indices system and the assessment model based on GIS were combined to complete the non-typhoon rainstorm disaster risk assessment in Fujian Province, China.
On the basis of obtaining the relevant data of non-typhoon rainstorm hazard indicators, the standardization process was carried out according to Eq. 1, and then the non-typhoon rainstorm hazard index of each site was calculated according to the calculated indicator weights (Table 2) and Eq. 11. The spatial distribution pattern of non-typhoon rainstorm hazard in Fujian Province was obtained by using GIS spatial interpolation method and natural breakpoint classification method, as shown in Figure 2 and Table 4.
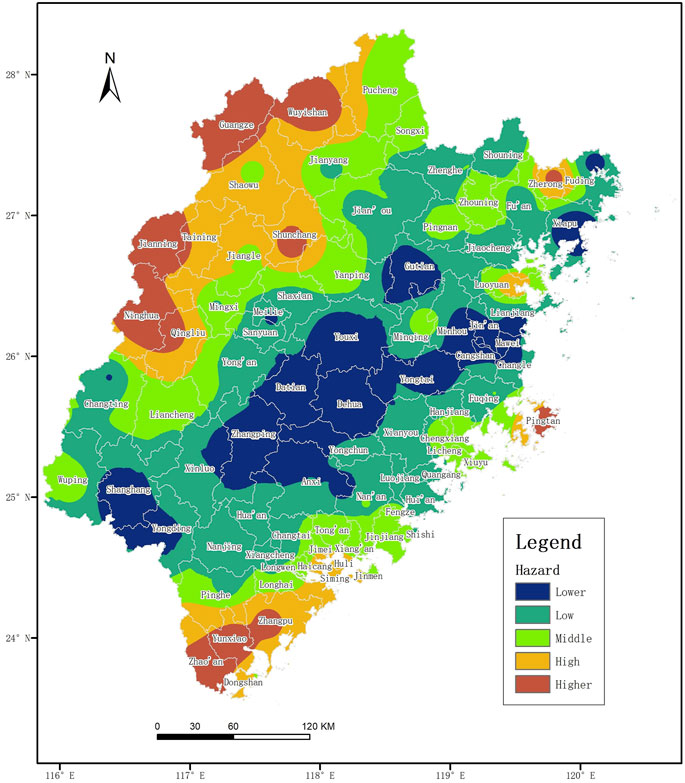
FIGURE 2. Hazard of non-typhoon rainstorm.
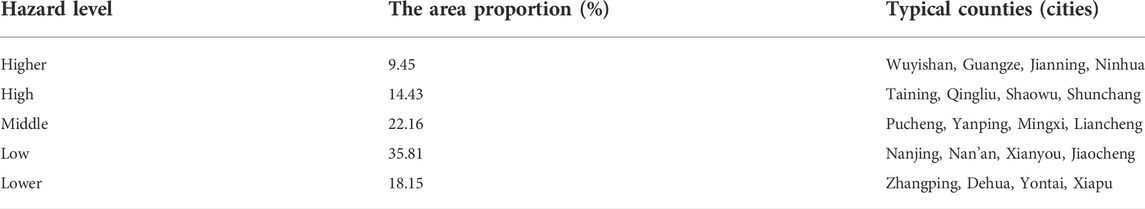
TABLE 4. Proportion of different hazard levels over the whole province.
As can be seen from Figure 2 and Table 4, the spatial pattern of non-typhoon rainstorm hazard in Fujian Province is very different from that of typhoon rainstorm hazard in this study area (Ye, 2015; Ye et al., 2020). It generally presents a gradually increasing distribution pattern from the eastern coastal areas to the western mountainous areas. In addition to the northwest of Fujian, the middle or above hazard areas were also observed in the narrow and long area of the southeast coast of Fujian. The higher hazard areas and the high hazard areas accounted for 9.45% and 14.43% of the province’s area respectively, and were mainly observed in the northwest of Fujian with Wuyishan, Guangze, Jianning, and Ninghua as the center, and Zhangpu, Yunxiao and Zhao’an in the southeast corner of Fujian. The middle hazard areas accounted for 22.16% of the province, including some counties (cities) outside the high hazard areas in the northwest and west of Fujian, and some counties (cities) in the northeast and southeast coast of Fujian. The central Fujian province and most of the areas between the northwestern and central mountain ranges of Fujian exhibited low and lower hazard, which accounted for 53.96% of the province. The spatial pattern of non-typhoon rainstorm hazard is obviously affected by the topography of Fujian Province. Most of the non-typhoon rainstorms in Fujian province were systematic frontal precipitation caused by interaction of cold and warm air. The cold air moving south was blocked by the Wuyi Mountain Range in the northwest of Fujian and moved slowly. When the warm and humid air flow from the southeastern sea intruded Fujian along the two mountain ranges in the middle and northwest of Fujian, heavy precipitation occurred and fell on the southeast side of the two mountain ranges under the combined action of cold air and topography uplifting. During the rainy season, the rainstorm started from the southeastern coast, intruded the inland areas of Fujian along the southeast-northwest direction, and would be intensified by the uplifting effect of the topography. Therefore, the distribution of the two middle or above hazard areas in Figure 2 was consistent with the distribution pattern of the climate characteristics of the non-typhoon rainstorm in Fujian. The main rainstorm region was in the northwest of Fujian, and the secondary rainstorm region was in the southeast coast of Fujian. Most of the areas between the two mountain ranges received relatively little rainfall, and exhibited relatively lower hazard.
For the sensitivity of the disaster-formative environment, the lower the altitude, the smaller the terrain relief, and the closer the area to the river, the more likely it is to be affected by rainstorm-flood disasters. The greater the slope and the more potential geological disaster points, the greater the sensitivity, and the more likely the rainstorm will cause geological disasters such as landslides and debris flows. Therefore, when standardizing the data related to the sensitivity factors of the disaster-formative environment, slope and density of potential geological disaster points were regarded as positive indicators, which were standardized by Eq. 1. And elevation, terrain relief and distance to the river were regarded as negative indicators, which were standardized by Eq. 2. On this basis, the sensitivity index of disaster-formative environment was calculated according to the calculated weights (Table 2) and Eq. 11. The spatial distribution pattern of the disaster-formative environment sensitivity in Fujian Province was obtained by natural breakpoint classification method, as shown in Figure 3.
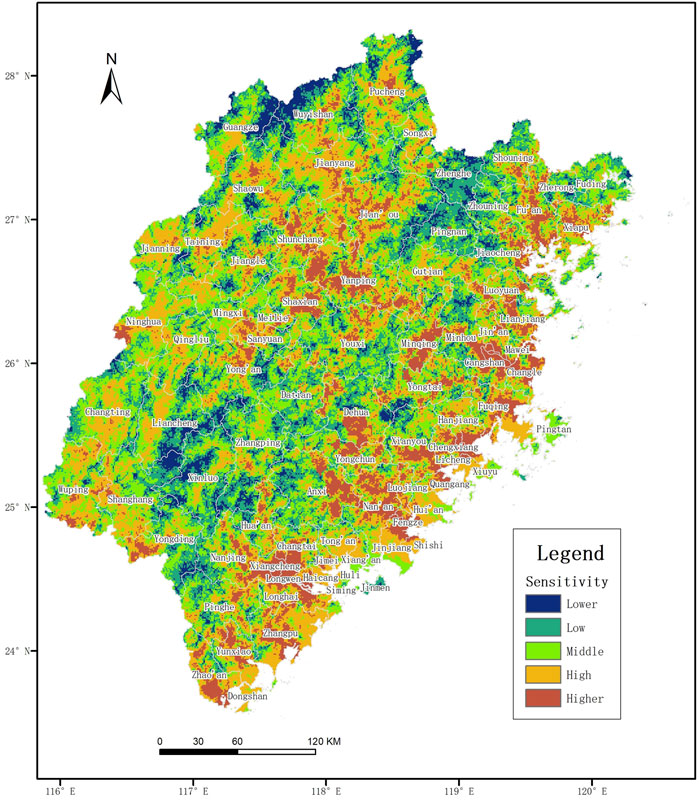
FIGURE 3. Sensitivity of the disaster-formative environment.
As can be seen from Figure 3, The higher sensitivity areas and the high sensitivity areas were observed in the eastern coastal areas and river valley, accounted for 12.96% and 29.43% of the province’s area respectively. Among them, the southeastern coastal areas were the most prominent. The middle sensitivity areas accounted for 29.90% of the province. The low sensitivity areas and the lower sensitivity areas were mainly located in the high-altitude areas of the two mountains of central and western Fujian, and accounted for 28.04% of the province. This distribution pattern also indicated that the environment-formative sensitivity of non-typhoon rainstorm disaster was generally high in Fujian Province due to the fragmented terrain and numerous rivers.
The standardization of the relevant data of disaster-affected bodies was carried out according to Eq. 1, and then the disaster-affected bodies vulnerability index of each county (city) was calculated according to the calculated indicator weights (Table 2) and Eq. 11. According to the classification of natural breakpoints, the spatial pattern of vulnerability of non-typhoon rainstorm disaster-affected bodies in Fujian Province was obtained as shown in Figure 4 and Table 5.
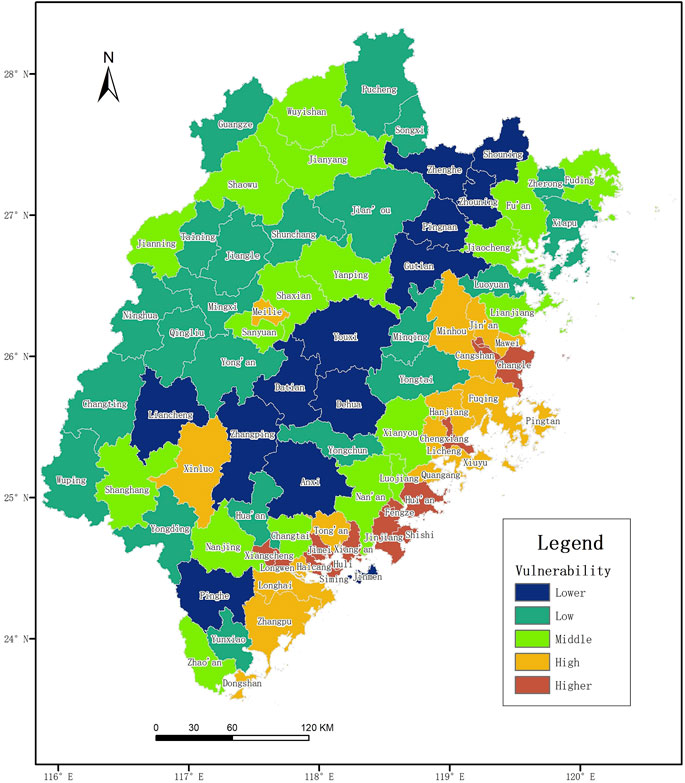
FIGURE 4. Vulnerability of the disaster-affected bodies.
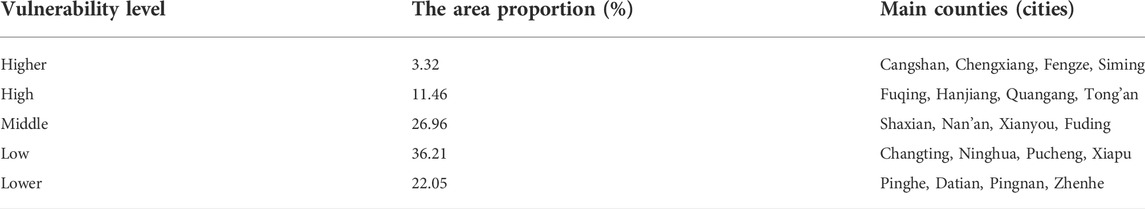
TABLE 5. Proportion of different vulnerability levels over the whole province.
As can be seen from Figure 4 and Table 5, the spatial difference of the disaster-affected bodies vulnerability in Fujian Province is clear, and presents a pattern of higher or high in the east and lower or low in the west. The areas with higher and high vulnerability were mostly concentrated in the southeastern coastal areas, accounting for 14.78% of the province. The middle vulnerability regions accounted for 26.96% of the province, and were observed in some counties (cities) in the eastern coast, Nanping city and Longyan city. The vulnerability of most counties (cities) in central, western and northeastern Fujian was low or lower, accounting for 58.26% of the province.
The impact of disaster prevention and mitigation ability on rainstorm disaster is negative, that is, a region with strong disaster prevention and mitigation ability can greatly reduce the impact of rainstorm disaster. After obtained the relevant index data of the disaster prevention and mitigation ability, the standardization process was carried out according to Eq. 2. Comprehensive calculation was made according to the calculated index weight (Table 2) and Eq. 11 to obtain the comprehensive index of disaster prevention and mitigation ability. The spatial pattern of disaster prevention and mitigation ability for non-typhoon rainstorm disasters in Fujian Province was obtained according to the classification of natural breakpoints, as shown in Figure 5 and Table 6.
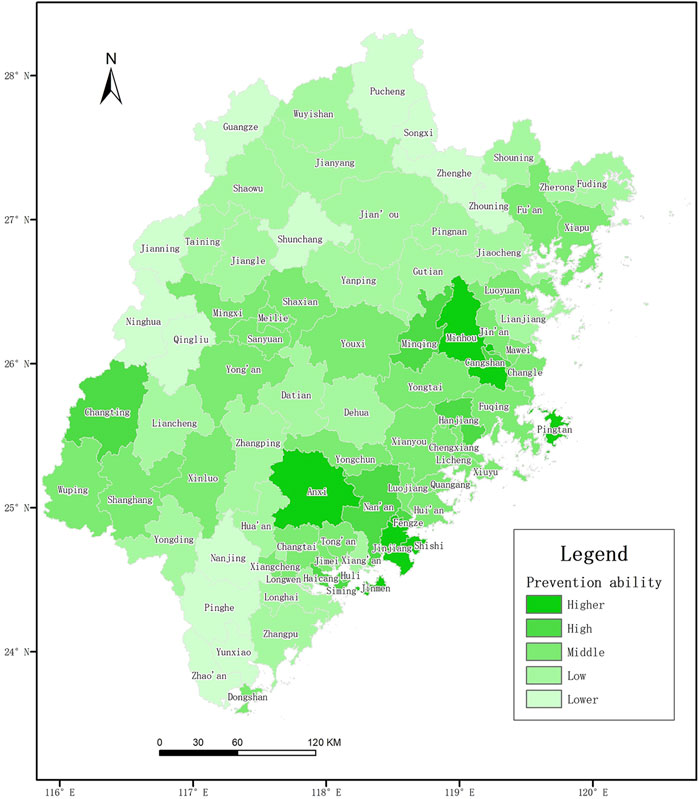
FIGURE 5. Spatial distribution pattern of the disaster prevention and mitigation ability.

TABLE 6. Proportion of different prevention and mitigation ability levels over the whole province.
It can be seen from Figure 5 and Table 6 that the spatial difference of the ability of disaster prevention and mitigation in Fujian Province is obvious. Counties (cities) with higher and high ability of disaster prevention and mitigation were mostly concentrated in the eastern coastal area north of Zhangzhou City and Longyan city, accounting for 11.75% of the province’s area. Counties (cities) with middle ability of disaster prevention and mitigation accounted for 30.44% of the province. And the disaster prevention and mitigation ability of the mountainous counties (cities) in Ningde City and most of the counties (cities) in Zhangzhou city, Sanming city and Nanping city was low or lower, accounting for 58.08% of the province.
Based on the above analysis of non-typhoon rainstorm disaster-causing factors hazard, disaster-formative environment sensitivity, disaster-affected bodies vulnerability, and disaster prevention and mitigation ability, comprehensive calculation was made according to the related index weight (Table 2) and Eq. 11. Spatial pattern of the comprehensive risk of non-typhoon rainstorm in Fujian Province was obtained according to the natural breakpoint classification, as shown in Figure 6 and Table 7.
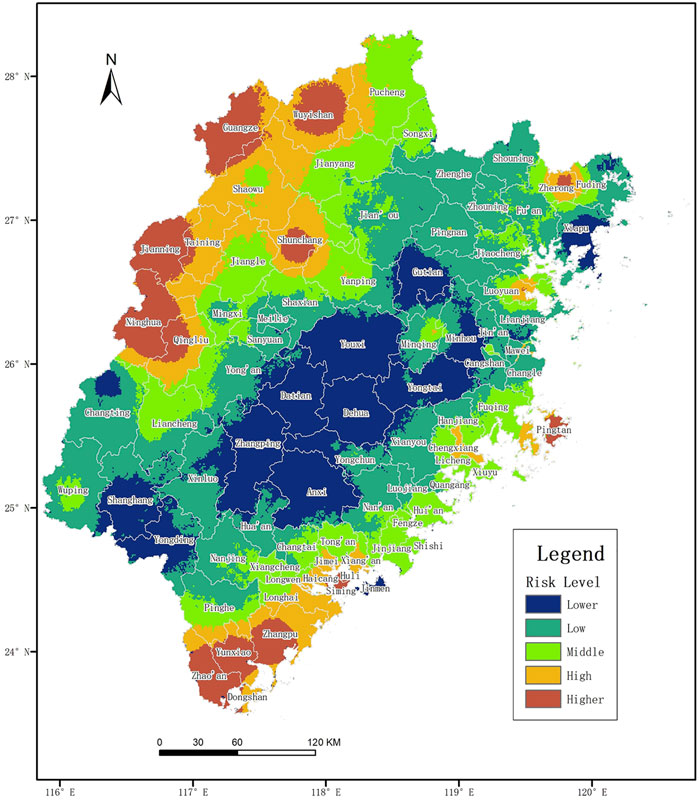
FIGURE 6. The spatial distribution pattern of the comprehensive risk of non-typhoon rainstorm disaster.

TABLE 7. Proportion of different comprehensive risk levels over the whole province.
As can be seen from Figure 6 and Table 7, Spatial pattern of the comprehensive risk of non-typhoon rainstorm in Fujian Province is completely different from that of typhoon rainstorm in this study area (Ye, 2015). Its variation trend of non-typhoon rainstorm is similar to that of non-typhoon rainstorm hazard mentioned above, and increases gradually from the southeast coastal area to the mountainous area in the northwest. The risk areas above middle were observed in the northwestern Fujian and the narrow coastal area of southeastern Fujian. Risk of most of the areas between the two mountain ranges in the middle and northwest of Fujian was relatively low. It indicated that the disaster-causing factors of rainstorm were the dominant risk factors of non-typhoon rainstorm. The areas with higher and high risk were basically consistent with the corresponding level of non-typhoon rainstorm hazard, accounting for 9.49% and 13.23% of the province respectively. In addition to some counties (cities) in northwestern Fujian and central Fujian, the middle risk was also observed in some counties (cities) in southeast coastal areas and Fuding, Zherong in northeastern Fujian, which accounted for 21.59% of the province. Inland mountainous areas along the eastern coast, most counties (cities) in southwestern Fujian, and most counties (cities) in central Fujian exhibited low or lower risk, which accounted for 34.34% and 21.36% of the province respectively.
The risk assessment results obtained by above methods reflect the general pattern of the comprehensive risk of non-typhoon rainstorm disasters in the study area, which can also be called the climatic characteristics. In fact, for a single rainstorm case, the spatial pattern of its risk is also different due to inconsistency of the rainstorm cause and the spatial and temporal range of impact. Therefore, in order to illustrate the reliability of the analysis results, four historical cases of non-typhoon rainstorm were selected for verification, and the results are shown in Figure 7.
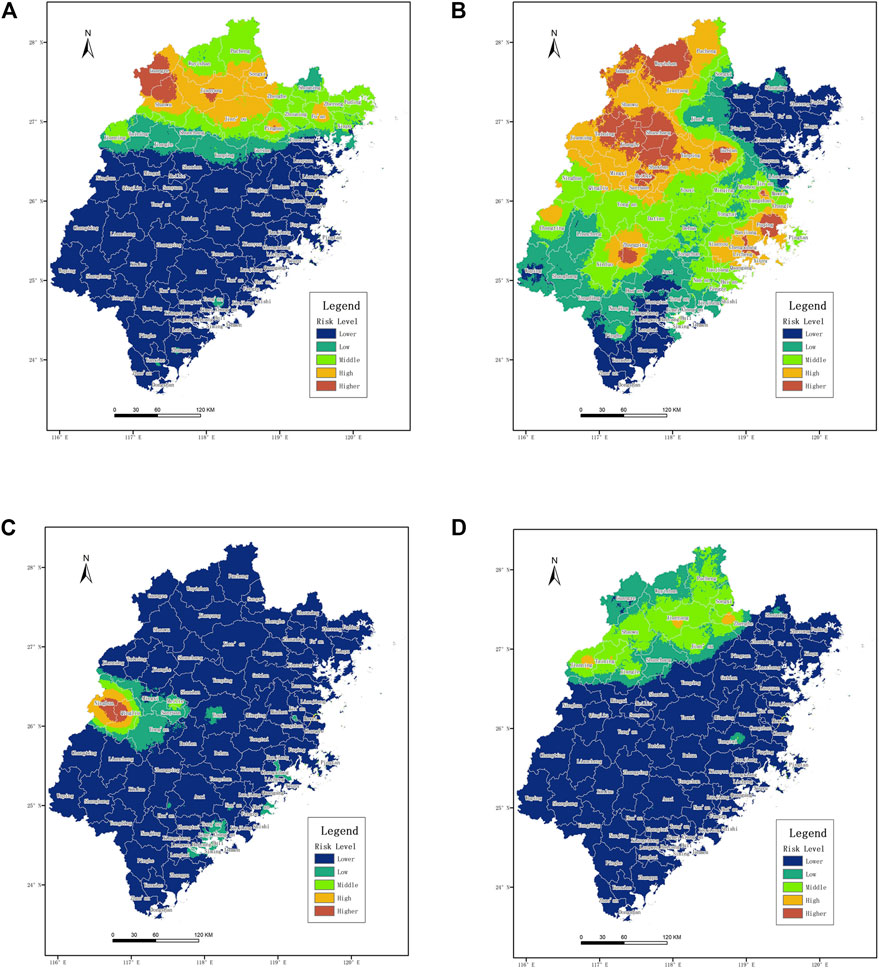
FIGURE 7. Spatial distribution pattern of the comprehensive risk of four non-typhoon rainstorm cases. (A) 19980619-0624. (B) 20100614-0626. (C) 20150519-0520. (D) 20160505-0510.
It can be seen from Figure 7 that the spatial pattern of comprehensive risk of non-typhoon rainstorm disasters in the four historical cases is significantly different from that of the general comprehensive risk of non-typhoon rainstorm disasters in Figure 6. In terms of historical cases, most of the higher-risk and high-risk areas of non-typhoon rainstorm cases were concentrated in northwestern Fujian, but the comprehensive risk pattern of different cases was significantly different.
As can be seen from Figure 7A, the higher-risk and high-risk areas of rainstorm from June 19 to 24, 1998 were mainly observed in Nanping City in northern Fujian, and the risk was relatively low in the southeastern coast of Fujian and most of the areas in central and western Fujian. According to the relevant records, due to the continuous precipitation, the reservoirs in northern Fujian were full, the water level of rivers rose sharply, and Jianxi and Futunxi had suffered multiple floods that exceeded the dangerous water level. And Guangzhuang, Shaowu, Jian’ou and many other counties (cities) were flooded. These flooded counties (cities) were mostly concentrated in the higher-risk and high-risk areas in Figure 7A.
As can be seen from Figure 7B, the rainstorm from June 14 to 26, 2010 lasted for nearly half a month and affected a wide range of areas. Its higher-risk and high-risk areas were widely distributed, mainly included Sanming and Nanping in the northwest of Fujian Province and some counties (cities) in Fuzhou and Putian in the central coastal area. Ningde in the northeast of Fujian, Zhangzhou and Xiamen in the southeast of Fujian, and some counties (cities) in the southwest of Fujian exhibited low or lower risk. According to the Climatological Bulletin of Fujian Province (2010), the rainstorm process was characterized by long duration, large amount of rainfall, wide range of heavy rain, strong rainfall intensity and concentrated area of heavy rain. Heavy rainstorms and extremely heavy rainstorms were mostly concentrated in Nanping city and Sanming city. There were seven counties (cities) of Nanping, Shaxian, Shunchang, Jiangle, Changting, Jianning and Taining with process rainfall 300% above normal. And four counties (cities) of Nanping, Shunchang, Taining and Fuqing ranked the highest precipitation in the same period since 1961. The continuous heavy rainstorm brought severe disasters and losses to Fujian Province. It caused 59,500 houses to collapse, 78 deaths and 79 persons missing, and a direct economic loss of 14.46 billion yuan. These worst-hit areas are the higher-risk and high-risk areas in Figure 7B.
As can be seen from Figure 7C, the impact area of the rainstorm from May 19 to 20, 2015 was relatively small. Its higher-risk and high-risk areas were only observed in Ninghua and Qingliu of Sanming City, and areas outside Sanming City were all exhibited low or lower risk. According to the Climatological Bulletin of Fujian Province (2015), the western and southern parts of Fujian Province experienced heavy rains or extremely heavy rains. The daily rainfall of Qingliu broke the historical maximum precipitation record, and the daily rainfall of Ninghua ranked the second in the history of this station during the same period. Some urban areas and towns in Qingliu, Ninghua and Changting counties were flooded for more than 10 h, with the maximum water depth exceeding 2 m. The flooded areas recorded here were consistent with the middle-to-higher risk areas shown in Figure 7C.
It can be seen from Figure 7D that the rainstorm from May 5 to 10, 2016 mainly impacted the Sanming and Nanping cities, and the middle-risk and high-risk areas were mainly observed in these areas. According to the Climatological Bulletin of Fujian Province (2016), From May 5th to 10th, a large-scale heavy rain process occurred in Fujian Province, which was characterized by long duration, concentrated heavy rainfall area, and large amount of rainfall. Sanming and Nanping cities, where the heavy rainfall was concentrated, were severely affected. The severely affected areas recorded here were consistent with the middle-high risk areas shown in Figure 7D.
The risk pattern of the above four historical cases of non-typhoon rainstorm shows that the higher-risk and high-risk areas of a single non-typhoon rainstorm case are generally small. Except for the rainstorm in June 2010, the higher-risk and high-risk areas of the other three cases were limited to a small local area. The intensity, duration, scope and concentration of rainstorm directly affect its hazard, and then affect the spatial pattern of comprehensive risk.
As for the natural disaster risk in the study area, previous studies mainly focused on typhoon disaster (Ye et al., 2020; Zhu et al., 2017; Ye, 2015; Chen, 2007b), and paid less attention to the risk of rainstorm disaster. A few risk assessments for rainstorm disasters did not distinguish different types of rainstorms. Ye (2015) carried out the risk assessment of typhoon rainstorm based on different landing paths. The results showed that the risk of typhoon rainstorm in Fujian Province gradually decreased from the eastern coastal area to the western inland area, and the high-risk areas were mainly concentrated in the coastal areas, but the risk pattern of typhoon rainstorm notably differ between different landing paths. The result showed that the spatial pattern of the comprehensive risk of non-typhoon rainstorm in Fujian Province is completely different from that of typhoon rainstorm. It shows a gradually increasing trend from the eastern coastal area to the mountainous area in the northwest. But the risk areas above middle were observed in the northwestern Fujian and the narrow coastal area of southeastern Fujian. Chen (2007a) constructed the index system and assessment model from two aspects of disaster-causing factors and disaster-affected bodies, and carried out the risk assessment of rainstorm flood disasters in Fujian Province. The study showed that the high-risk areas of rainstorm flood disasters were mainly distributed in the eastern coastal areas from north to south and the windward slope areas of the Wuyi Mountain Range in the northwest, but it did not distinguish rainstorm types. This paper not only focused on the study of non-typhoon rainstorm, but also made great improvements in data acquisition, index selection, evaluation model construction, etc. It was verified by examples. The results showed that the high-risk and higher-risk areas in northwestern Fujian were consistent with the results of Chen (2007a), but the overall pattern of risk and the high and higher-risk areas in the east coast were different. The high and higher-risk areas in the east were only observed in the narrow coastal area of the southeast. Therefore, it is necessary to distinguish different types of rainstorm and carry out different types of rainstorm disaster risk assessment, and the research results are more scientific and reasonable.
Existing studies have shown that non-typhoon rainstorms in Fujian Province can be further divided into spring rainstorm, rainy season rainstorm, summer rainstorm, autumn rainstorm and winter rainstorm according to different seasons, and the temporal and spatial distribution and intensity characteristics of rainstorms in different seasons were significantly different. Among them, the rainy season rainstorm was the most intense and the most serious non-typhoon rainstorm. The cases given in this paper all belonged to the rainy season rainstorm, which were significantly representative. Further research may consider classifying non-typhoon rainstorms by season and carry out more targeted risk assessment based on non-typhoon rainstorms in different seasons.
Based on the non-typhoon rainstorm data of major meteorological stations in Fujian Province in the recent 40 years, combined with ground basic data and social economic data, this study established an indices system from four aspects: Disaster-causing factors, disaster-formative environment, disaster-affected bodies, and disaster prevention and mitigation abilities. Based on the analytic hierarchy process, the entropy method and the correlation coefficient analysis method, the combination weighting was assigned to carry out the non-typhoon rainstorm disaster risk assessment. The main conclusion are as follows:
1) The spatial pattern of the comprehensive risk of non-typhoon rainstorm in Fujian Province is completely different from that of typhoon rainstorm in this study area. It shows a gradually increasing trend from the eastern coastal area to the mountainous area in the northwest. But the risk areas above middle were observed in the northwestern Fujian and the narrow coastal area of southeastern Fujian.
2) The variation trend of the non-typhoon rainstorm comprehensive risk is similar to that of non-typhoon rainstorm hazard. It indicated that the disaster-causing factors were the dominant risk factors of non-typhoon rainstorm. The spatial pattern of non-typhoon rainstorm hazard is obviously affected by the topography of Fujian Province. Moreover, intensity, duration, impact scope and concentration of non-typhoon rainstorm also directly affect its hazard, and then affect the spatial pattern of comprehensive risk.
3) The comprehensive risk pattern of a specific historical non-typhoon rainstorm case is significantly different from that of the general comprehensive risk of non-typhoon rainstorm disasters. In terms of historical cases, most of the higher-risk and high-risk areas of non-typhoon rainstorm cases were generally small, and were concentrated in northwestern Fujian, but the comprehensive risk pattern of different cases was significantly different.
4) The rainy season rainstorm is the most representative non-typhoon rainstorm. And the temporal and spatial distribution and intensity characteristics of non-typhoon rainstorms in different seasons are significantly different. Further research may consider classifying non-typhoon rainstorms by season and carry out more targeted risk assessment based on non-typhoon rainstorms in different seasons.
The original contributions presented in the study are included in the article/supplementary material, further inquiries can be directed to the corresponding author.
JY designed the research, JY and RZ collected the data, JY, RZ and MZ contributed to the data processing and analysis, JY prepared the original draft, RZ, GL and LG edited and reviewed the manuscript. All authors have read and agreed to the published version of the manuscript.
This research was supported by the Public Welfare Projects of Science and Technology Department of Fujian Province, China (2021R002006, 2018R10344).
The meteorological data were provided by Fujian Climate Center. The geological disaster points data came from the website of Fujian Provincial Department of Natural Resources (https://zrzyt.fujian.gov.cn/). The population and social economy data come from the website of Fujian Provincial Bureau of Statistics (https://tjj.fujian.gov.cn/).
The authors declare that the research was conducted in the absence of any commercial or financial relationships that could be construed as a potential conflict of interest.
All claims expressed in this article are solely those of the authors and do not necessarily represent those of their affiliated organizations, or those of the publisher, the editors and the reviewers. Any product that may be evaluated in this article, or claim that may be made by its manufacturer, is not guaranteed or endorsed by the publisher.
Chan, F. K. S., Yang, L. E., Scheffran, J., Mitchell, G., Adekola, O., Griffiths, J., et al. (2021). Urban flood risks and emerging challenges in a Chinese delta: The case of the Pearl River Delta. Environ. Sci. Policy 122, 101–115. doi:10.1016/j.envsci.2021.04.009
Chen, J. F., Chen, M. C., Gao, S. P., Xu, J. P., and Zhou, P. (2019). Risk assessment of rainstorm disasters in Nanjing based on cloud matter-element model [J]. J. Econ. Water Resour. 37 (2), 67–72+88. doi:10.3880/j.issn.1003-9511.2019.02.012
Chen, X., and Brown, F. K. (2007a). Asymmetry of chemical similarity. ChemMedChem 14 (4), 180–182. (in Chinese). doi:10.1002/cmdc.200600161
Chen, X. (2007b). Risk assessment and zonation of typhoon disasters in Fujian Province [J]. Chin. J. Ecol. 26 (6), 961–966. doi:10.13292/j.1000-4890.2007.0173
Chen, X. W., Gao, L., Chen, Y., Deng, H. J., Liu, M. B., and Lin, B. Q., (2019b). Study on the classification of typhoon and non-typhoon related rainstorm flood [J]. China Flood Drought Manag. 29 (4), 18–21. doi:10.16867/j.issn.1673-9264.2018251
Chen, Y., Wang, L., Zhao, J. H., Zhang, Y. X., Zhao, S. S., Li, W., et al. (2022). Climatic characteristics and major meteorological events over China in 2021 [J]. Meteorol. Mon. 48, 470–478. doi:10.7519/j.issn.1000-0526.2022.022501
Huang, J., Zhang, F. M., and Hu, Z. H. (2022). Spatio-temporal evolution of rainstorm disaster in Anhui Province based on the comprehensive precipitation indices with multi-indicators [J]. J. Catastrophology 37 (2), 111–116. doi:10.3969/j.issn.1000-811X.2022.02.018
Jou, B. J. (2020). Non-typhoon heavy rain research in taiwan for the past 30 years: A review [J]. Torrential Rain Disasters 39 (2), 109–116. doi:10.3969/j.issn.1004-9045.2020.02.001
Li, B. N. (2007). Fuzzy mathematics and application [M]. Hefei: Hefei University of Technology Publishing House. (in Chinese).
Li, W., Zhao, S. S., Chen, Y., Wang, Q., and Ai, W. (2021). State of China's climate in 2020. Atmos. Ocean. Sci. Lett. 14, 100048. doi:10.1016/j.aosl.2021.100048
Li, W. Z., Yu, D., Feng, X. L., and Zhang, T. F. (2019). Risk assessment of rainstorm and flood disasters based on the hazard grades/indices in Qinghai Province [J]. J. Glaciol. Geocryol. 41 (3), 680–688.
Li, Y., Zhang, Z. R., Gong, S. Y., Liu, M., and Zhao, Y. (2020). Risk assessment of rainstorm disasters under different return periods: A case study of Bohai Rim, China. Ocean. Coast. Manag. 187, 105107. doi:10.1016/j.ocecoaman.2020.105107
Lin, Z. D., Chen, X. W., Lin, M. S., and Chen, Y. (2017). Spatial and temporal variations of storm-floods in Xixi watershed of southeast coastal region [J]. Mt. Res. 35 (4), 488–495. doi:10.16089/j.cnki.1008-2786.000246
Lu, S. J., and Wang, Y. (2012). The climate of FUJIAN. Second Edition. Beijing: China Meteorological Press. (in Chinese).
Ma, S. Q., Lyu, S. R., and Zhang, Y. D. (2021). Weighted clustering-based risk assessment on urban rainstorm and flood disaster. Urban Clim. 39, 100974. doi:10.1016/j.uclim.2021.100974
Qiu, C., Liu, H. B., Wan, C. C., Zhao, L. N., and Wen, J. H. (2022). Tempo-spatial variation and cause analysis of rainstorms and related flood disasters in shandong from 1984 to 2019[J]. J. Catastrophology 37 (4). https://kns.cnki.net/kcms/detail/61.1097.P.20220708.1703.009.html.
Sahoo, M., Sahoo, S., Dhar, A., and Pradhan, B. (2016). Effectiveness evaluation of objective and subjective weighting methods for aquifer vulnerability assessment in urban context. J. Hydrology 541, 1303–1315. doi:10.1016/j.jhydrol.2016.08.035
Shang, Z. H., Cao, H. L., Lin, M. P., and Zhan, H. Y. (2019). Review of typhoon disaster risk assessment for agriculture in China [J]. J. Catastrophology 34 (2), 168–172. doi:10.3969/j.issn.1000-811X.2019.02.030
Shi, P. J., Lv, L. L., Wang, M., Wang, J. A., and Chen, W. F. (2014). Disaster system: Disaster cluster, disaster chain and disaster compound [J]. J. Nat. Disasters 23 (6), 1–12. doi:10.13577/j.jnd.2014.0601
Shi, P. J. (2002). Theory on disaster science and disaster dynamics [J]. J. Nat. Disasters 11 (3), 1–9. doi:10.13577/j.jnd.2002.0301
Tian, M., Shen, Y. H., and Zhang, Y. R. (2020). Risk assessment of wind-hailstorm in typical mountainous area of yunnan based on combination weighting method [J]. J. Catastrophology 35 (2), 110–115. doi:10.3969/j.issn.1000-811X.2020.02.021
Wang, Y., Zhang, X. Y., Zhang, Q., Li, L. L., and Huang, Y. (2019). Assessment on storm disaster risk and its impact on agriculture [J]. J. Meteorological Sci. 39 (1), 137–142. doi:10.3969/2018jms.0001
Wu, J. R., Chen, X. L., and Lu, J. Z. (2022). Assessment of long and short-term flood risk using the multi-criteria analysis model with the AHP-Entropy method in Poyang Lake basin. Int. J. Disaster Risk Reduct. 75, 102968. doi:10.1016/j.ijdrr.2022.102968
Wu, M. M., Wu, Z. N., Ge, W., Wang, H., Shen, Y., and Jiang, M. (2021). Identification of sensitivity indicators of urban rainstorm flood disasters: A case study in China. J. Hydrology 599, 126393. doi:10.1016/j.jhydrol.2021.126393
Xie, J., Liu, W., Xu, Y. S., and Lei, C. M. (2022a). Rainstorm disaster risk assessment in Xining area in rainy season based on the AHP weight method and entropy weight method [J]. J. Nat. Disasters 31 (3), 60–74. doi:10.13577/j.jnd.2022.0306
Xie, X., Zhang, J. Y., Lian, Y. Q., Lin, K., Gao, X., Lan, T., et al. (2022b). Cloud model combined with multiple weighting methods to evaluate hydrological alteration and its contributing factors. J. Hydrology 610, 127794. doi:10.1016/j.jhydrol.2022.127794
Xu, W., Yang, X. Y., Xu, J., Lu, J. L., and Xia, Y. (2018). Study on climate change characteristics of rainstorm and risk assessment of rainstorm rainfall in Jinshan of Shanghai in recent 60 years [J]. Torrential Rain Disasters 37 (6), 177–182. doi:10.3969/j.issn.1004-9045.2019.02.010
Xu, Y. Q., Chen, L., Liu, Y. H., Li, S., Zhou, X. X., and Na, R. B. (2022). Comparative analysis of natural disaster risk assessment based on different spatial resolution data--taking rainstorm and flood disaster as an example [J]. J. Catastrophology 37 (3), 61–68. doi:10.3969/j.issn.1000-811X.2022.03.011
Ye, J. Y., Lin, G. F., Zhang, M. F., and Gao, L. (2020). Hazard analysis of typhoon disaster-causing factors based on different landing paths: A case study of fujian province, China. Nat. Hazards (Dordr). 100, 811–828. doi:10.1007/s11069-019-03843-6
Ye, J. Y. (2015). Typhoon disaster chains integrated risk assessment model and information tupu based on multi-dimensional matrix. Fuzhou, China: Doctoral Dissertation of Fujian Normal University. (in Chinese).
Ying, M., Yang, Y. H., Chen, B. D., and Zhang, W. (2011). Climatic variation of tropical cyclones affecting China during the past 50 years. Sci. China Earth Sci. 54, 1226–1237. doi:10.1007/s11430-011-4213-2
Zhang, J. Q., and Li, N. (2007). Quantitative methods and applications of risk assessment and management on main meteorological disasters[M]. Beijing: Beijing Normal University Press. (in Chinese).
Zhao, J., Wang, J. A., and Zhu, H. S. (2020). Geography of China. Second Edition. Beijing: Higher Education Press. (in Chinese).
Zhou, Y. H., Peng, T., and Shi, R. Q. (2019). Research progress on risk assessment of heavy rainfall and flood disasters in China [J]. Torrential Rain Disasters 38 (5), 494–501. doi:10.3969/j.issn.1004-9045.2019.05.011
Keywords: non-typhoon rainstorm, risk assessment, combination weighting method, spatial characteristics, disaster system
Citation: Ye J, Zhang R, Lin G, Zhang M and Gao L (2022) Comprehensive risk assessment of non-typhoon rainstorms over the southeastern coastal region of China. Front. Environ. Sci. 10:1058054. doi: 10.3389/fenvs.2022.1058054
Received: 30 September 2022; Accepted: 27 October 2022;
Published: 10 November 2022.
Edited by:
Shao Sun, Chinese Academy of Meteorological Sciences, ChinaReviewed by:
Tangao Hu, Hangzhou Normal University, ChinaCopyright © 2022 Ye, Zhang, Lin, Zhang and Gao. This is an open-access article distributed under the terms of the Creative Commons Attribution License (CC BY). The use, distribution or reproduction in other forums is permitted, provided the original author(s) and the copyright owner(s) are credited and that the original publication in this journal is cited, in accordance with accepted academic practice. No use, distribution or reproduction is permitted which does not comply with these terms.
*Correspondence: Jinyu Ye, amlueXV5ZXppQDEyNi5jb20=
Disclaimer: All claims expressed in this article are solely those of the authors and do not necessarily represent those of their affiliated organizations, or those of the publisher, the editors and the reviewers. Any product that may be evaluated in this article or claim that may be made by its manufacturer is not guaranteed or endorsed by the publisher.
Research integrity at Frontiers
Learn more about the work of our research integrity team to safeguard the quality of each article we publish.