 Li Zhang
 Shibing You*
94% of researchers rate our articles as excellent or good
Learn more about the work of our research integrity team to safeguard the quality of each article we publish.
Find out more
ORIGINAL RESEARCH article
Front. Environ. Sci., 21 November 2022
Sec. Environmental Economics and Management
Volume 10 - 2022 | https://doi.org/10.3389/fenvs.2022.1058009
The severity of haze pollution has increased along with the growth of the economy and urbanization. Studying the relationship between urbanization and environmental pollution is extremely important from a practical standpoint in the context of encouraging new urbanization development in China. In this paper, we explore the impact mechanism of urbanization on air pollution, using a spatial Durbin model (SDM) build on panel data of 277 cities from 2010 to 2019. The findings demonstrate that urbanization significantly inhibits haze pollution across the country, with energy consumption structure and industrial structure upgrading acting as mediating factors. Moreover, economic growth, population aggregation, and openness to foreign investment aggravate pollution, whereas transportation facilities, urban vegetation areas, and wind speed reduce air pollution. Furthermore, foreign direct investment increases pollution nationwide while alleviating haze pollution in the eastern region. According to analysis of regional heterogeneity, there is a nonlinear relationship between urbanization and pollution in the central and western cities, while development and pollution in the eastern cities show a tendency to decouple. On this basis, this paper puts forward some policy recommendations to attenuate the vicious linkage between urbanization and pollution in order to promote high-quality urbanization development.
China had a tremendous economic growth following the economic reform and opening-up, and it has also become the world’s nation with the fastest urbanization rate, which increased from 17.92 percent to 64.72 percent from 1978 to 2021. Urbanization has driven China’s rapid economic growth and strengthened its competitiveness in international markets. Similar to other developing countries, China’s urbanization is accompanied by the transformation of surplus rural population into city population and the transformation of the primary industry into secondary and tertiary industries. In this process, people, resources, and wealth are gathered in cities. Although urbanization promotes infrastructure investment (Zhou et al., 2015), expands consumption market, and improves the income and education level of residents (Yuan, 2015; Choy and Li, 2017), it also increases the consumption of resources, in turn, causing environmental pollution problems (Hueglin et al., 2005; Stone, 2008). Urbanization brings about “big city disease” such as traffic congestion, energy shortage, and air pollution. The World Health Organization estimates that air pollution causes seven million premature deaths annually, and air pollution, especially haze pollution, has become an important hidden danger to residents’ health.
Numerous scholars have discussed the connection between urbanization and air pollution through different models. Liang et al. (2019) discovered a nonlinear relationship between environmental pollution and urbanization using a geographically and temporally weighted regression model. Du and Feng (2013) constructed a panel model with Kaya’s constant equation, which indicated a U-shaped curve relationship between urbanization and air pollution in developing countries. Jiao (2015) tested the relationship between urbanization and environmental pollution at different population sizes, it was found that the urbanization rate of small-population countries had a positive linear relationship with environmental pollution, the urbanization rate of medium-sized countries had a U-shaped relationship with environmental pollution, and the urbanization rate of large-population countries had an inverted U-shaped relationship with environmental pollution. Moreover, many literature works have studied the variables through which urbanization affects air pollution. Rahman and Alam (2021), who found that the use of clean energy improved air quality, studied the interaction between environmental pollution and economic growth, population density, clean energy, and opening-up during urbanization in Bangladesh. Yang et al. (2018) found that urbanization can promote the reorganization of the industrial structure, deteriorating the environment in the short term and benefiting the treatment of air pollution in the medium and long term. Mayer (1999) argued that population growth and land expansion are the main reason for air pollution caused by urbanization. Gao et al. (2016) found that population aggregation in urbanization has a more significant effect on environmental pollution than land expansion.
In the study related to air pollution, spatial dependence between cities needs to be taken into consideration, otherwise, the spillover effect of air pollution would be neglected and the haze diffused from neighboring cities will be regarded as being produced by local cities. As a result, the residual terms of econometric models are spatially correlated, leading to inconsistent coefficient estimates of the urbanization and air pollution, which may lead to incorrect conclusions. Therefore, more accurate econometric models need to be constructed.
Spatial econometric models can effectively identify spatial spillover effects. There is a large number of literature using spatial econometric models to study urbanization and air pollution. Yu (2021) constructed four new-type urbanization indicators related to economy, demography, society, and environment. He used a dynamic spatial panel error model (SPEM) empirically to analyze the new-type urbanization in the environment in China and found that new-type urbanization significantly improves energy efficiency and reduces pollution emissions. Liu et al. (2017) used cross-sectional data from 289 cities in China to construct a spatial Durbin model (SDM), which revealed that urbanization significantly increases air pollution, and the urbanization of neighboring cities has a greater impact on air pollution than the urbanization of the city itself. Du et al. (2019) found that both urban expansion and population agglomeration have negative impacts on air quality. Gan et al. (2021) used the GS3LS model to study urbanization in 287 cities in China and found an inverted U-shaped relationship between economic growth and haze pollution, and urbanization leads to air pollution by increasing the exuberant demand of urban residents. By establishing a spatial Durbin model (SDM), Zhang et al. (2017) believed that there is a positive effect of economic growth on the spillover effect of haze pollution in the eastern and western provinces of China, while the economic growth in the central region has a negative spillover effect of haze pollution.
Although the aforementioned literature used spatial econometric models to reduce the estimation bias caused by spatial correlation, it is still difficult to determine whether urbanization increases, decreases, or has a nonlinear relationship with air pollution. Therefore, we analyze the potential shortcomings in the current studies and make efforts to obtain more accurate results by refining the variables, samples, and models. We discovered that the following reasons could affect the regression estimator. 1) Most of the studies are based on provincial data. Compared to cities, provinces have huge geographical spans, making it difficult to control the influence of environmental factors such as rainfall and wind temperature within the region. Moreover, cities are the basic unit of most policy implementation. As there could be huge differences in urbanization patterns between cities in the same province, using provincial data will ignore these differences. Therefore, the urban data selected in this paper can better reflect the environmental, economic, and policy changes in the region, as well as provide more accurate results for the model. 2) The time span of the sample is comparatively long, and as a result, the coefficients reflecting the mixed effects of two phases: the rapid expansion of urbanization in the early years and the high-quality urbanization in recent years, confuses the results. Considering the systematic impact of COVID-19 on the urban environmental and economic order, we select the time span from 2010 to 2019 as the sample, which exactly covers the decade of China’s new urbanization strategy and can better reflect the impact of China’s sustainable urban development strategy. 3) A large amount of literature uses sociological statistics such as the industrial structure, population structure, or urban area variable as a substitute for urbanization, which suffers from data distortion due to changes in statistical caliber. This paper uses nighttime lights (NTL) data as a proxy variable for urbanization, which can also eliminate potential endogeneity problems between variables while ensuring the consistency of statistical caliber. 4) At present, a large amount of literature, articles merely focusing on economic and social factors, ignore the influence of natural factors. In order to reduce the resulting bias, we include control variables such as temperature, precipitation, and wind speed in our model.
In conclusion, this paper selects panel data of 277 prefecture-level cities in mainland China from 2010 to 2019 as the research object, empirically analyzes the impact and mechanism of urbanization on air pollution during the decade after China’s new urbanization, and uses a spatial econometric model to eliminate endogeneity among variables.
Dietz and Rosa (1997) proposed the STIRPAT model based on the IPAT model, pointing out that environmental pollution is influenced by factors such as population, affluence, and technology. The panel of the STIRPAT model can be expressed as QUOTE
Considering that a major advantage of the STIRPAT model is that it can appropriately improve the influencing factors of the environment (Jin et al., 2022), we extend the equation based on STIRPAT Eq. 1 and construct a panel equation as follows:
where lnAP is the natural logarithm of air pollution concentrations in city i in year t, lnUrban represents the urbanization, X is a series of control variables including the economy, environment, and technology, and
Base on the STIRPAT model (Dietz & Rosa, 1994) and the EKC hypothesis (Grossman & Krueger, 1995), we extend Eq. 2 to Eq. 3 by selecting appropriate control variables with reference to (Yu et al. 2021) and (Shao S 2019).
where
Air pollution (lnAP): We use the annual average concentration of PM2.5 as an indicator of air pollution. The data were obtained from the Atmospheric Composition Analysis Group of Washington University in St. Louis1, which estimates annual and monthly ground-level fine particulate matter (PM2.5) for 1998–2020 by combining aerosol optical depth (AOD) retrievals from the NASA MODIS, MISR, and SeaWIFS instruments with the GEOS–Chem chemical transport model (Aaron van Donkelaar 2021). Also, considering that air pollution also includes sulfide, nitrogen oxides, and carbon monoxide, we will use the air quality index (AQI) from 2013 to 2019 for robustness analysis.
Urbanization (lnUrban1): Urbanization is the core explanatory variable in this paper. We use nighttime light (NTL) data to characterize the level of urbanization. The NTL data are obtained by the satellite technology and are barely disturbed by natural and human factors and maintain the consistency and comparability of the data (Liu et al., 2021). Moreover, the NTL data reflect the economic development through the digital number (DN) value of each pixel from cities, and the expansion of the city area is also expressed by the changes between the area with a non-zero DN value. In addition, since the long-standing household registration system in China restricts population mobility, using population indicators as a proxy for urbanization would result in an underestimation of urbanization levels; moreover, scholars have demonstrated that NTL data reflect well the process of urbanization (Liu et al., 2012). Therefore, this paper uses the mean DN value in pixel of the cities as a proxy variable for urbanization (lnurban1). The data are collected from the Global Nighttime Light Database (GNLD), which is constructed based on the National Oceanic and Atmospheric Administration (NOAA), is derived from DMSP/OLS imagery data until 2013 and from VIIRS/DNB imagery data.
To minimize omitted variable bias, we also set a series of urban control variables as follows.
Foreign direct investment (lnFDI): Foreign direct investment (FDI) could have both positive and negative effects on air pollution (Zhang and Luo, 2021), corresponding to the “Pollution Heaven Hypothesis” and the “Pollution Halo Hypothesis” (Tang et al., 2022). On the one hand, FDI will introduce high technology, and thus reduce resource consumption and pollutant emissions; on the other hand, for developing countries, foreign investment and trade have become methods for developed countries to transfer energy-intensive industries. For example, the trade between China and developed regions leads to large net inflows of carbon emissions, especially in the sectors of mechanical and electronic equipment and chemical products (Wang et al., 2020), which will increase environmental pollution. Therefore, FDI should be included in the model, and this paper uses the annual accomplished foreign investment and converts it to RMB according to the exchange rate of the year, and the data are sourced from the China City Statistical Yearbook.
Population density (lnPop): Population exacerbates energy consumption and traffic congestion and has a negative impact on air quality. We calculated the population per unit area of the city precincts to express the population density and collected the data from the China Urban Statistical Yearbook.
Transportation infrastructure (lnTrans): The better the construction of transportation infrastructure, the more effective it is in relieving traffic congestion and reducing air pollution. However, excellent transportation infrastructure can also cause a “siphoning effect” on transportation in neighboring cities, increasing the pressure on the local road network and nearly worsening air quality (Sun et al., 2019). This paper uses the road freight volume to measure transportation infrastructure, and the data sources are China City Statistical Yearbook and China Transport Statistical Yearbook.
Urban green coverage (Green): Urban vegetation can absorb particulate matter to some extent and alleviate air pollution. This paper introduces urban green coverage to measure the degree of greening in cities, and the data are downloaded from CEI data2.
Rail transit (Metro): The opening of urban rail transit has a significant and robust pollution control effect (Liang and Xi, 2016). Rail transit as an important public transportation facility can effectively replace the travel mode of road transportation such as private cars, and thus reducing tailpipe emissions and reducing air pollution. In this paper, the number of completed metro miles is used as a control variable, and the data source is the Rapid Report on Rail Transit reported by the Ministry of Transport of China.
Climate variables: Wind speed (lnWind), rainfall (lnRain), and temperature (lnTemp), as important factors of climate change, can significantly affect the generation and dispersion of air pollution such as haze. Meteorological data are obtained from the China Meteorological Data Service Center3.
The economic development (lnPgdp): Economic development could intensify the resource consumption of residents and cause the gathering of polluting industries or guide enterprises to upgrade their industries through the income effect and provide more tax revenue for the government to support environmental protection and technology development, and thus affect air quality from both sides. Therefore, we choose GDP per capita to control the impact of economic development on air pollution, and the data are downloaded from CEI data.
Industrial structure (lnSec): The initial stage of urbanization is usually accompanied by industrialization, along with a large amount of waste gas and wastewater emissions. If the economic growth is mainly driven by the energy-intensive secondary industry, the air pollution in that city is more serious (Yu, 2010). In order to control the impact of the industrial structure on air quality, we selected the share of secondary industry output in regional GDP as one of the control variables.
In order to explore the mechanism of urbanization inhibiting air pollution, we also test the mediating effect of two variables: industrial structure upgrading (ISU) and energy consumption structure (ECS). Referring to the previous studies, the ISU index is calculated by the economic proportion of each industry and the proportion of the employed population (Fu. 2010), and ECS is represented by the proportion of natural gas use in total energy (shao et al., 2019). All the data are collected from the China City Statistical Yearbook and China Energy Statistical Yearbook.
This paper focuses on the impact of urbanization on haze pollution, and the data are municipal data which exclude county-level cities. To avoid heteroscedasticity, the logarithmic measurement is used for variables with absolute values. Table 1 shows descriptive statistics for each variable.
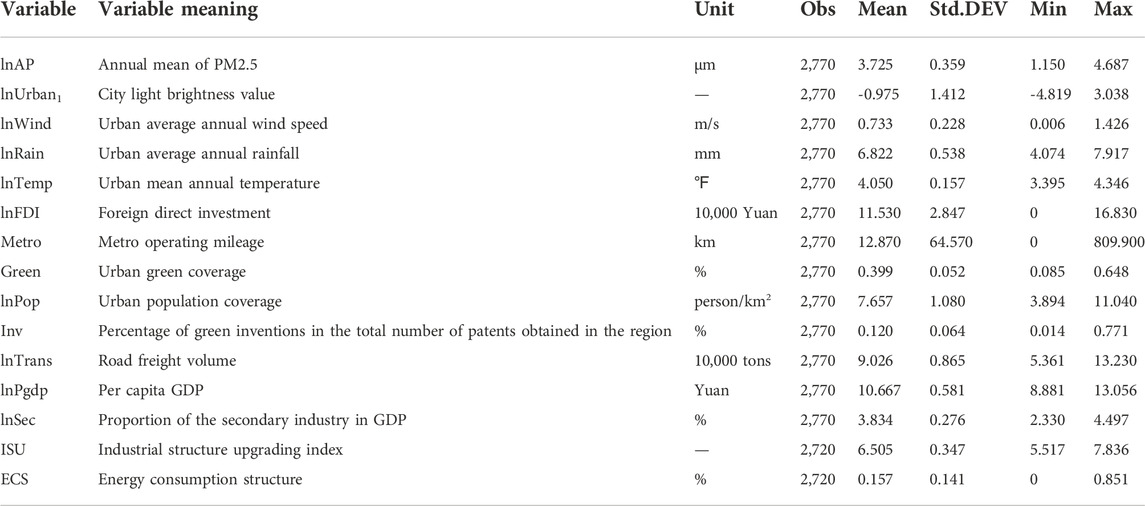
TABLE 1. Descriptive statistics of variables.
In order to observe the changes in air pollution in the past 10 years more intuitively, we take four of these years as samples to plot the changes of PM2.5 in prefectural-level cities in China4, as shown in Figure 1. It can be clearly found that haze pollution has obvious spatial aggregation, especially in North China and Sichuan Province. Therefore, the spatial correlation of haze pollution should be analyzed.
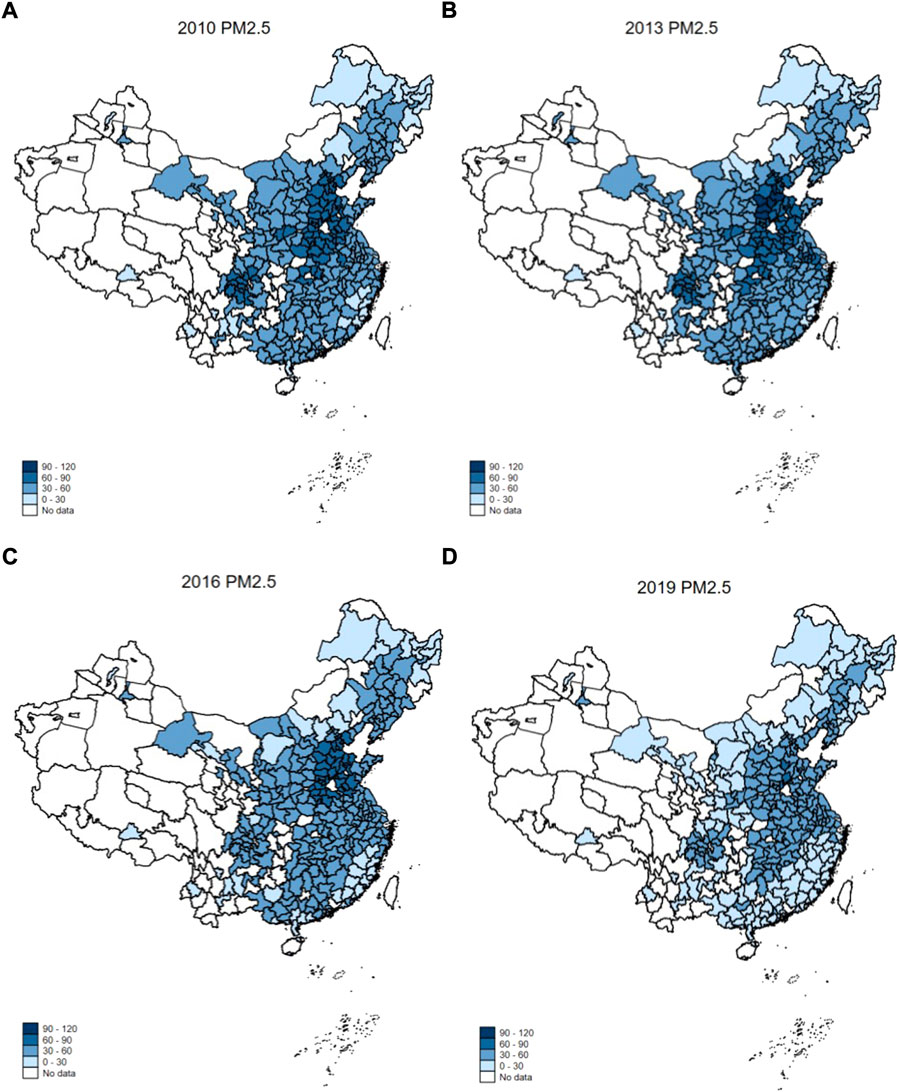
FIGURE 1. Distribution of PM2.5 in China. (A) PM2.5 distribution in 2010. (B) PM2.5 distribution in 2013. (C) PM2.5 distribution in 2016. (D) PM2.5 distribution in 2019.
Tobler’s first law of geography states that all attribute values on a geographic surface are related, with closer values being more strongly related than more distant ones (Tobler, 1970). Environmentally relevant variables often have strong spatial dependence, for example, haze pollution in city i will spread to neighboring city j with air flow, and haze in city j will in turn increase air pollution in city i, exhibiting geographical clustering with high-polluted area neighboring and low-polluted area neighboring. On the other hand, there is also spatial dependence on urban policies. For example, local government officials will imitate neighboring cities to make similar decisions, which are also understood as the congruence effect, and this phenomenon is not interrupted by provincial border boundaries, but decays with an increasing geographical radius (Deng and Zhao, 2018). Therefore, the spatial dependence of both explanatory and explanatory variables should be considered in the model, as reflected in the corresponding inclusion of spatial lagged terms of the explained and explanatory variables. We set Eq. 3 as a spatial panel equation.
Eq. 4 is a spatial panel Durbin model (SDM) with the spatial lagged terms of the explanatory variables and explanatory variables, and the validity of the model setting in the next section will be checked. In the Eq. 4, W denotes the spatial weight matrix, which evaluates the dependence between the cities and their neighboring areas. Also, a geographic distance matrix is constructed to describe the dependence, that is, the closer the geographic distance, the closer the spatial weights of cities are to 1. The weight elements Wij are as follows:
where
To test the spatial autocorrelation of air pollution, we use the Moran’s I index, which is given by
where n denotes the number of cities,
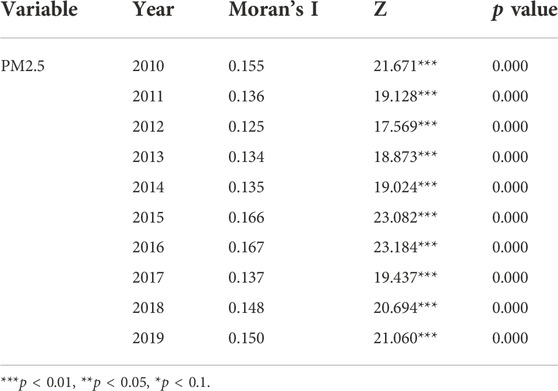
TABLE 2. Moran’s I for PM2.5.
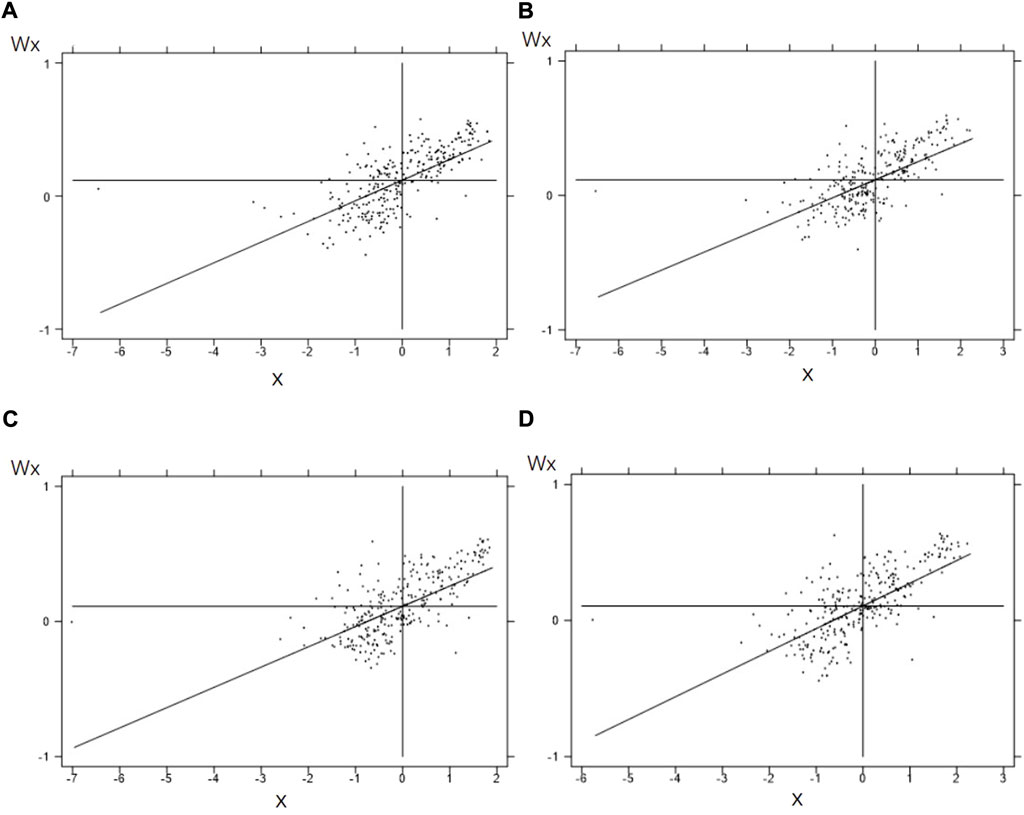
FIGURE 2. Moran’s index scatter plots of PM2.5 in Chinese cities. (A) PM2.5 in 2010. (B) PM2.5 in 2013. (C) PM2.5 in 2016. (D) PM2.5 in 2019.
To determine the optimal spatial model for the sample data, we follow the method of Elhorst (2014) and identify the model through a “general to specific” step, and the test results are shown in Table 3.
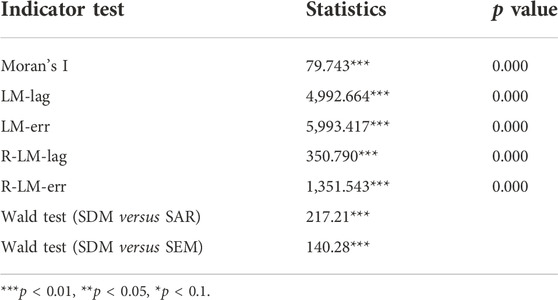
TABLE 3. Model inspection results.
First, we test the spatial effects with the residuals of OLS regression of Eq. 3.
The results show that, for both spatial errors and spatial lags, LM and robust LM tests reject the original hypothesis that the model is not spatially correlated. In this situation, setting up a spatial Durbin model (SDM) is more robust (LeSage and Pace, 2009).
Second, we conducted a Hausman test to determine whether the fixed effect (FE) model or random effect (RE) model should be selected. With the null hypothesis H0: random effect is the preferred model, the chi-square statistic is 119.02, which rejects the H0 at 1% significance level, so the fixed effect model should be used. In addition, considering that the data are collected from 277 cities in 10 years, we believe it is necessary to control the heterogeneity between cities and years, so the fixed effect controller for both cities and years is the optimal choice, meanwhile, the LR test shows that the two-way fixed effect model outperforms either time or individual fixed effect model at 1% significance level.
Finally, we test whether the spatial Durbin model (SDM) could degenerate into a spatial error model (SEM) or a spatial lag model (SAR) (Elhorst, 2014). First, we test whether it can reduce into a spatial lag model (SAR). For the original hypothesis H0:
The parameters estimators of the spatial Durbin model (SDM) and dynamic spatial Durbin model (SPDM) were obtained by the quasi-maximum likelihood method (QMLE) (Yu et al., 2008) and compared with those of the two-way fixed effects model (two-way FE) and the spatial autoregressive model (SAR). Many researchers argued that a special understanding of coefficients with spatial lag terms is needed (Anselin and Legallo 2006; Kelejian et al., 2006). LeSage and Pace. (2009) proposed that the average direct, indirect, and total effect are understood as marginal effects of explanatory variables when compared with the non-spatial model (Belotti et al., 2017). The calculation for the direct and indirect effects is given in the following equations:
Direct effect:
Indirect effect:
where
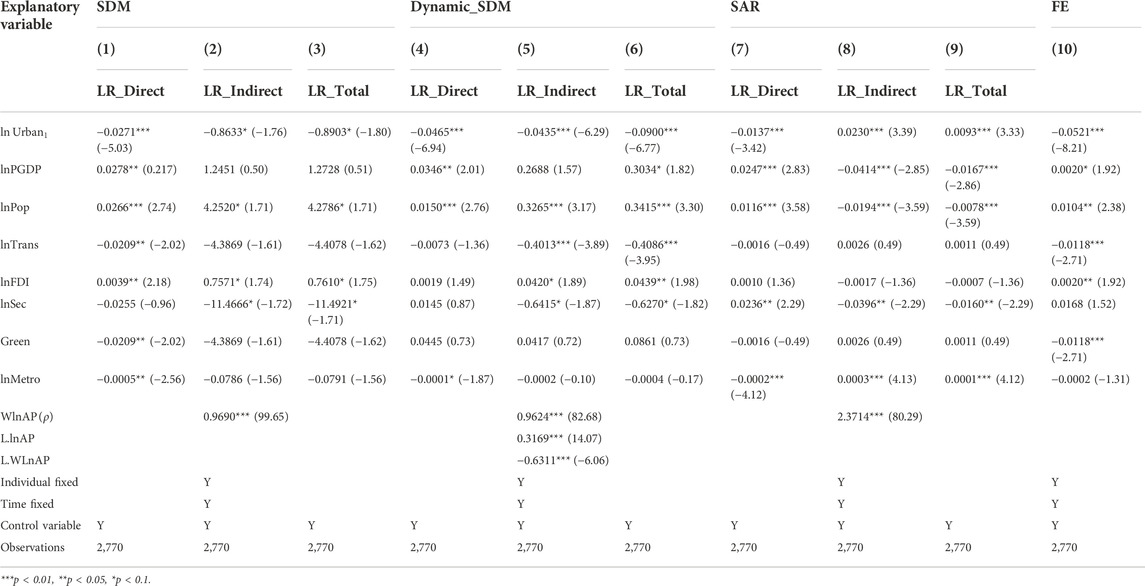
TABLE 4. Model estimation results.
Table 4 presents the effects of urbanization on air pollution, with the estimated coefficients of spatial models listed in columns (1)–(9) and compares with the spatial models, and the estimation results of the fixed effect (FE) model are shown in column (10). In general, the addition of the spatial lag term in the model does not affect the sign of the core explanatory variables, but the magnitude of the estimated coefficients, that is, the non-spatial model will overestimate the impact of urbanization on air pollution. The spatial lagged terms of the explanatory variables (WlnAPs) are different from zero at the 1% significance level in all three spatial models, reflecting the spatial dependence of “high–high” and “low–low” agglomeration, which is also consistent with the pattern of haze distribution in Figure 1. The coefficient of WlnAP in SDM is 0.9690, which implies for every 1% increase in the average PM2.5 of neighboring cities, the PM2.5 of local cities increases by more than 0.97% net of other explanatory variables. However, the coefficients of SDM (0.9690) and SPDM (0.9624) are quite different from those of SAR (2.3714), we believe that the spatial lagged terms of the explanatory variables (e.g.,WlnpGDP) help explain the spillover effects of air pollution from the neighboring cities. Different from the SAR model, which has the same proportion of direct and indirect effects, the SDM model is more flexible in describing spatial spillovers (Elhorst 2014). Meanwhile, the time lag term of the explained variable (L.lnAP) is also significantly positive at 1% level, indicating that haze pollution is not only spatially dependent, but also time-dependent. Since the dynamic Durbin model provides more enriched information than other models, this study mainly focuses on the estimation results of it.
In terms of explanatory variables, the long-run direct effect in column (4) shows that the urbanization significantly inhibits air pollution, surprisingly; the indirect effects of urbanization are as strong as the direct effects, suggesting that urbanization can reduce air pollution in both local and surrounding cities. We believe the results derived from the following reasons: first, the urbanization level of regional central cities, such as Beijing, Shanghai, Wuhan, and Chengdu, is generally high. The siphon effects of the industry in those cities promote the merger and reorganization of small enterprises in the surrounding area and reduce unit pollution emissions through the economy scale effect. Second, with the overall improvement of the regional urbanization level, cities change from individual development to an integrated regional development model led by urban agglomerations (Ruining et al., 2021), the resources can achieve higher allocation efficiency, which in turn improves the level of haze governance in the whole region (Zhang et al., 2020). Finally, due to the spatial spillover effects of urbanization, the increased level of urbanization in the surrounding area can drive the development of local urbanization, which in turn reduces local air pollution.
Regarding the control variables in Table 4, the direct and indirect effects of
The positive direct effect of FDI indicates that the introduction of foreign capital is still the cause of urban pollution in China and confirms the “Pollution Halo Hypothesis.” FDI affects the host country’s environment mainly through the scale, structural, and technical effects (Grossman and Krueger, 1995). The scale effect indicates that FDI will affect environmental pollution by expanding the scale of production, as well as on capital accumulation and taxation; the structural effect shows that FDI will affect the industrial structure of the investing country, because foreign companies are more competitive in technology and management, which will compress the survival of local companies; and the technology effect shows that the technology introduced into host country by FDI help reduce the pollution emissions. Developed countries with strict environmental regulations tend to develop clean industries and shift pollution-intensive industries to developing countries through foreign direct investment (Wang et al., 2020), and FDI in China has shown more scale and structural effects than technology effects which could compensate for the environmental pollution. The positive indirect effect of FDI in column (5) could result from a “learning effect” in regional policy decision (Du et al., 2022), cities with lenient environmental policies can attract more foreign investment and are more likely to achieve the target of political performance such as GDP.
The secondary industry (lnSec), mainly including energy supply and manufacturing, theoretically increases air pollution. However, the direct effects in columns (1) and (4) are insignificant. We argue that in the context of China’s smallholder economy, agricultural production processes such as straw burning have caused serious air pollution, and the replacement of the secondary industry to the first industry would not cause serious additional pollution. In addition, the Chinese government implemented an industrial transformation plan from labor-intensive industries to environmental friendly development during 2010–2019 and guided the industrial upgrading of enterprises through environmental policies, so the development of the secondary industry significantly reduced the haze pollution in the surrounding areas with a coefficient −0.6415.
The direct effect of rail transit (metro) shows a positive impact on air quality by easing road congestion and reducing vehicle exhaust emissions. But the traffic infrastructures (lnTrans) can also effectively alleviate local traffic congestion, and its indirect effect (−0.4013) is significantly different from the direct effect (−0.0073). On the one hand, a strong substitution relationship between roads and other transportation facilities, such as the replacement of the freight function of the surrounding urban road network with local high-quality transportation facilities, can reduce transportation time and cost, and thus reduce air pollution in the surrounding areas. On the other hand, local road infrastructure investments, investments with peer effects among cities, will drive similar investments in surrounding areas, and thus alleviate the traffic pressure in the region.
To verify the robustness of the model, we re-estimate the model using three methods, which include replacement of the explanatory variables, replacement of the core explanatory variables, and replacement of the spatial weight matrix.
In 2012, China’s Ministry of Environmental Protection issued a new ambient air quality standard (GB3095-2012), using the air quality index (AQI) to describe the air quality of cities The AQI is based on six atmospheric pollutants: sulfur dioxide, nitrogen dioxide, carbon monoxide, ozone, particulate matter with a particle size of 10 microns or less (PM10), and particulate matter with a particle size of 2.5 microns or less (PM2.5). Compared with PM2.5, the AQI can reflect urban air pollution more comprehensively. In addition, in September 2013, China’s state council issued the Action Plan of Air Pollution Prevention and Control, followed by corresponding pollution control policies in various cities. In order to test the robustness of regression results under the policy shock, we used the sub-data from 2013 to 2019 and the annual average AQI index as the explained variable for the regression, as shown in Table 5 (1).
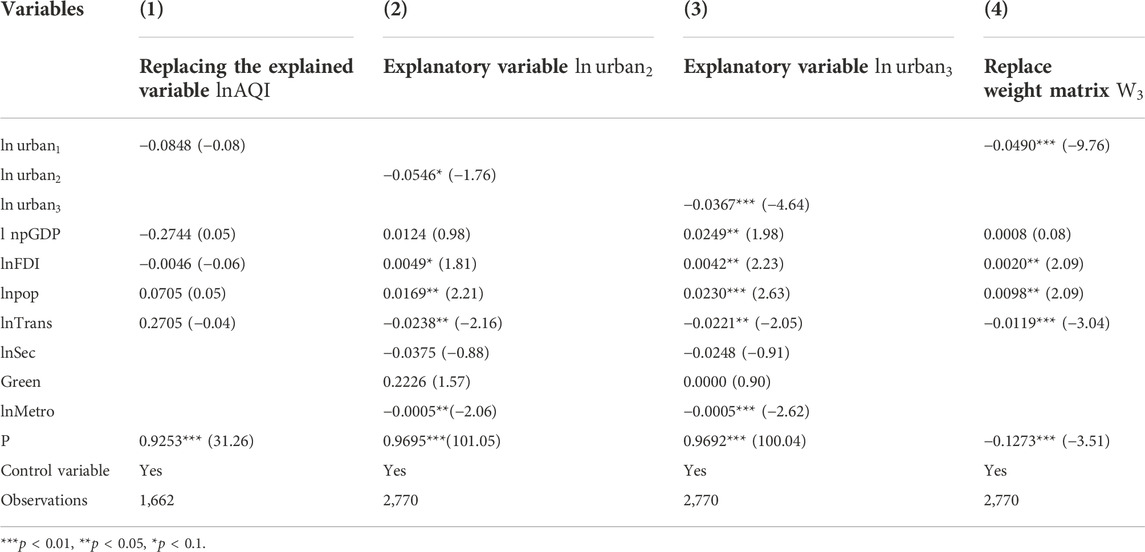
TABLE 5. Regression results of replacing the interpreted variable.
The coefficient of the WlnAQI is 0.918, which is close to the result of baseline regression, indicating that AQI has a similar spatial spillover effect and can be effectively used as a surrogate variable of urban air pollution. Urbanization, the core explanatory variable, still significantly reduces air pollution. Although the significance of some control variables decreases due to the reduction of samples, the signs of regression coefficients are basically unchanged, which proves the robustness of the model.
We use the population proportion and the urban expansion variable as alternative variables to the core explanatory variable
We also constructed the nested matrix with geographical and economic factors for the robust test. Compared with the geographic distance matrix, the nested matrix takes the economic connection between cities into consideration. The matrix is constructed as follows:
where
The spatial dynamic Durbin model (SPDM) can solve the endogeneity problem caused by the spatial lagged term of the explanatory variable, the temporal lagged term of the explanatory variable, and the omission of explanatory variables during the model setting. In addition, nighttime lighting data (NTL) selected as a proxy variable for urbanization also ensure the exogeneity of the core explanatory variables. However, the endogeneity arising from the interplay between explanatory and explained variables still cannot be ruled out. In fact, not only urbanization affects air pollution, but air pollution may also affect urbanization in turn (Gan et al., 2020). Therefore, we use the first-order time-lagged terms of the explanatory and core explanatory variables as instrumental variables (Han and Yang, 2020; Wang et al., 2022) of a systematic GMM approach (Lee and Yu 2014) and choose the population growth rate (Shao et al., 2019) as an instrumental variable of urbanization to estimate the model, and the results are shown in Table 6.
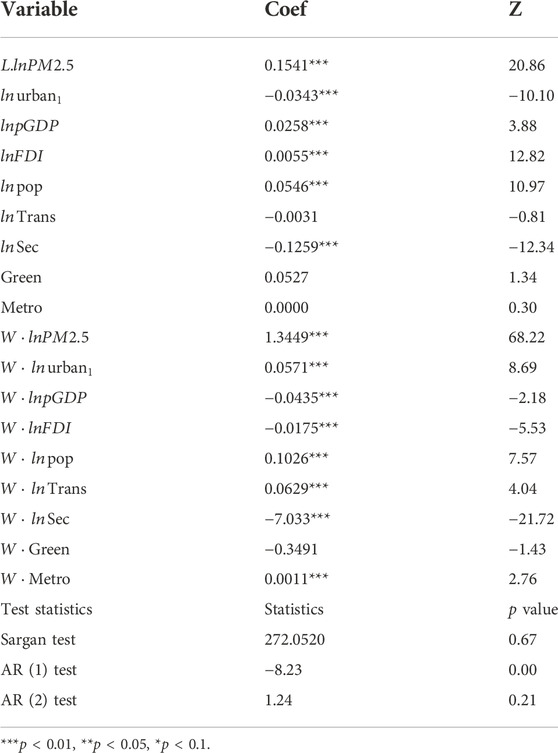
TABLE 6. Regression results based on systematic GMM.
The regression results in Table 6 show that the p value of Arellano–Bond AR (1) is less than 0.1, and that of AR (2) is greater than 0.1, indicating that there is no second-order autocorrelation in the series. The p value of the Sargon over-identification test is greater than 0.1, rejecting the original hypothesis that the instrumental variables are invalid. Therefore, the regression results in Table 6 are considered convincing. The estimation coefficients of urbanization are still significantly negative after excluding the endogeneity of mutually causal. The regression results of other explanatory variables remain basically unchanged, confirming the conclusion that urbanization attenuates air pollution.
In order to explore the mechanism that urbanization inhibits air pollution, we intend to test whether the industrial structure upgrading (ISU) and energy consumption structure (ECS) can act as the mediator variable between urbanization and air pollution, following the approach of Jin et al. (2022) and Yu (2022). We follow the causal steps proposed by Baron and Kenny (1986), which are generally adopted when setting the mediation models. The steps are shown in Figures 3A,B.

FIGURE 3. The path of mediation effect. (A) The total impact. (B) The direct and indirect impact.
In Figure 3A, C is the path which shows that urbanization influences air pollution. Since the mediator is not involved, C represents the total impact. Figure 3B shows the relationship between urbanization and air pollution after controlling the mediator variable. Also, path A represents the impact of urbanization on the mediator, path B represents the impact of the mediator on air pollution, and both A and B form the indirect impact. The path C′ represents the direct impact of urbanization on air pollution after controlling the mediator variable. Therefore, total impact (C) = indirect impact (AB)+ direct impact (C’). To test the existence of indirect impact (AB), the following models are constructed:
We use the dynamic spatial Durbin model (SPDM) to estimate Eqs. 10–12, and the direct effects are calculated for each equation referred to Eq. 7. Coefficients
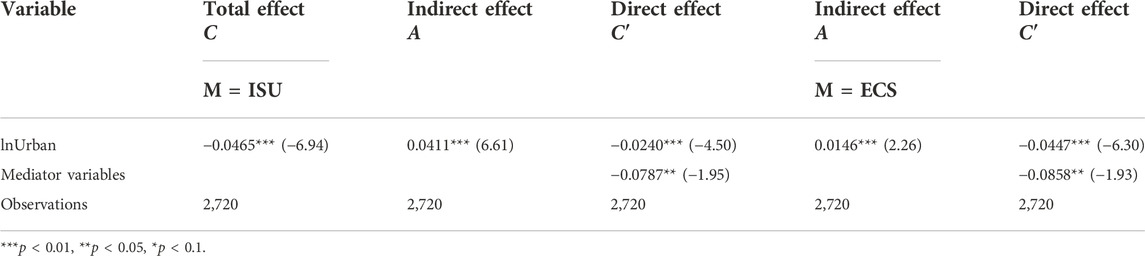
TABLE 7. Analysis of the mediating effect.
For industrial structure upgrading (ISU), the Petty–Clark theorem (Clark 1940) points out that urbanization and industrialization proceed simultaneously: the labor force first transfers from the primary industry to the secondary industry, then to the tertiary industry. In China’s Urbanization process, a large number of rural surplus labor forces with lower marginal productivity to enter the urban industrial sector with higher productivity, and in later stages, the tertiary industry replaces the secondary to become the leading industry, which is more environmentally friendly than the secondary industry. Moreover, the upgrading of the industrial structure will promote the large-scale and intensive use of energy at the macro level and lead to innovations in production technologies at the micro level, thereby reducing air pollution in energy consumption and production processes.
For the energy consumption structure (ESC), we believe that on the one hand, urbanization can change residents’ energy consumption habits, reduce the use of highly polluting energy such as coal, and increase the use of clean energy such as natural gas and solar energy. On the other hand, urbanization enhances the efficiency of energy use. For example, the government could set up industrial zones to conduct unified supervision over energy-intensive enterprises around the city, so as to improve energy utilization efficiency and pollution treatment efficiency, and thus reduce pollution.
Urbanization reduced air pollution nationwide, but there is regional variability in the degree of urbanization, for example, urbanization is significantly greater in the east and central regions than that in the west, we are interested in regional variability in the impact of urbanization on air quality in China, so we divided the sample into three groups: central, eastern, and western for heterogeneity analysis, and the regression result as shown in Table 8.
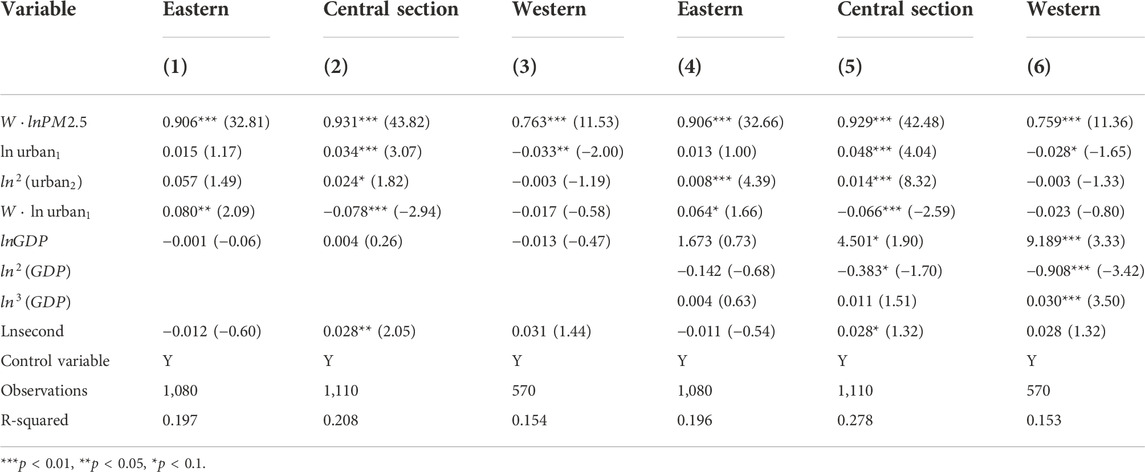
TABLE 8. Heterogeneity analysis.
From the first row of Table 8, WlnPM2.5 is significant at 1%, the spillover effect of air pollution in the western region is weaker than that in the other region. The reasons for this could be twofold: first, the mountains and basins in the west impede air flow and haze dispersion; second, the lack of large-scale industrial clusters in the west makes regional aggregation of pollution less frequent, which weakens the spatial dependence of the haze.
In order to test the nonlinear relationship between air pollution and urbanization, we add the quadratic
Referring to the environmental EKC hypothesis, we are also interested in the relationship between the economic growth and air quality, so we add the quadratic and tertiary terms of lnpGDP in columns (4), (5), and (6). The regression results confirm the existence of a nonlinear relationship between GDP and air pollution. In columns 5) and (6), the primary term is positive and the secondary term is negative in both the central and western cities, and the tertiary term is significantly positive in the western cities, which is consistent with the “N-shaped” curve of the EKC hypothesis, the coefficient in the western cities indicates that the economic growth of the western cities still depends on the high-pollution industries. Although the haze pollution in the eastern cities is not significant, but the coefficient of lnSec (−0.01) is negative, we believe that in the eastern region, “environmentally friendly” investment and intensive green industrial development have reduced the pressure of economic growth on air quality.
Based on the panel data of 277 prefecture-level cities in China from 2010 to 2019, we use the spatial panel Durbin model (SDM) to analyze the mechanism and regional heterogeneity of urbanization on air pollution and choose PM2.5 land lights (NTL) as the core explained and explanatory variables. The main conclusions are as follows:
(1) During the time span of the sample, the urbanization had a significant improvement in air quality. The air quality will be improved by 0.028% with every 1% improvement in urbanization. This conclusion is still valid under a series of robust tests.
(2) Population and traffic are two major factors that affect air quality in the process of urbanization. The increase in the population density worsens the air quality, and every 1% increase in the population density causes the air quality to decline by 0.019%. The improvement of traffic can significantly affect the air quality. Every 1% optimization of the traffic road variable (
(3) Industrial structure upgrading (ISU) has a mediating effect on urbanization and air pollution. Urbanization not only induces the changes in resident demand, but also upgrades the industrial structure during the demand adjustment. Additionally, ISU helps in optimizing production, adjusting the ratio of resource allocation, and reducing the input of high-carbon material such as coal and oil. Moreover, there are obvious differences between the energy demand and consumption in primary, secondary, and tertiary sectors. The upgrade of the industrial structure will reduce the proportion of primary sectors including mining and agriculture, increase the proportion of the tertiary sector, directly reduce the rigid demand for energy in production, and control the rapid growth of energy consumption. In addition, by optimizing resource allocation, the upgrading of the industrial structure can speed up the transfer of economic factors to high-productivity sectors like high-tech industry, promoting the coordinated development of various industries, and promote green and high-quality economic development, and thus reduce air pollution.
(4) From the perspective of regional heterogeneity, the influence mechanism of urbanization in eastern, central, and western China is different. Due to the deepening and high-quality development, there is a tendency of “decoupling” between urbanization and air pollution in the eastern region. In the central and western regions, there is a nonlinear relationship between urbanization and air pollution. The regression results of GDP per capita, economic growth in the central region worsens air quality, but the quadratic coefficient
The empirical results of this paper indicate that urbanization reduces air pollution; however, there are still shortcomings in the study process that limit the reliability of the conclusion. In order to describe the spatial interaction effect, we built a spatial weight matrix based on the geographical distance. However, we use an inverse distance matrix to focus on describing the geographical relationship between cities, while ignoring the economic and social links between cities. As a result, it is difficult to estimate the spillover effects of variables related to economic policies, which needs to be improved in our next work. In general, the use of dynamic panels can effectively overcome the endogeneity problem of missing important explanatory variables, but considering the availability of data, it is difficult to select panel data with a longer time span, resulting in insignificant dynamic panel estimating results. For further research, it is necessary to find variable groups with a time span. From the whole sample of this paper, urbanization has significantly improved the air pollution, but from the regional sample, except that urbanization in the west can significantly reduce haze pollution, urbanization in the middle is still positively related to haze pollution, while urbanization in the east is not significantly related to haze pollution. The reason for such unexpected phenomenon is that when conducting regional heterogeneity analysis, spatial dependence among cities in different regions will be ignored, and there are many more adjacent cities in the eastern and central regions than those in western regions, thus causing an underestimation of the spillover effect of central and eastern cities.
From the analysis of the mediating effect, we believe that high-quality urbanization is the fundamental way to avoid economic growth constrained by air pollution. As the central region has undertaken some heavy pollution industries in the eastern region, it has shown the trend of the environment for the economy in recent years. It should be corrected by encouraging scientific and technological innovation and strengthening policy guidance. The western region is in the primary stage of urbanization, so we should improve the development orientation in a timely manner, such as controlling the development of resource industries in a moderate manner, promoting tourism, big data, and other environment-friendly industries, and reducing dependence on heavily polluting development approaches. Eastern cities should continue to improve transport infrastructure, increase R&D investment to alleviate air pollution caused by population aggregation, and better utilize the positive externality of the urban agglomeration effect to achieve sustainable development (Belotti et al., 2017; China Energy Statistical Yearbook, 2022; Gan et al., 2020; BNDT, 2022; Stats Gov, 2022).
The original contributions presented in the study are included in the article/Supplementary Material; further inquiries can be directed to the corresponding author.
SY (2nd author), LZ, MZ, and SY (4th author) designed the research; LZ, SZ, SY (4th author), and BZ collected the data; LZ and SY (4th author) contributed to data processing and analysis; LZ, SZ, SY (4th author), and BZ prepared the original draft; SY (2nd author), LZ, and MZ edited and reviewed the manuscript; and LZ contributed to the discussion. All authors have read and agreed to the published version of the manuscript. SY (2nd author): Shibing You, SY (4th author): Shuaixiang Yi.
The authors declare that the research was conducted in the absence of any commercial or financial relationships that could be construed as a potential conflict of interest.
All claims expressed in this article are solely those of the authors and do not necessarily represent those of their affiliated organizations, or those of the publisher, the editors, and the reviewers. Any product that may be evaluated in this article, or claim that may be made by its manufacturer, is not guaranteed or endorsed by the publisher.
1https://sites.wustl.edu/acag/datasets/surface-pm2-5/
4The map template is from the Map Technology Review Center of the Ministry of Natural Resources (GS (2022) 4312)
Anselin, L., and LeGallo, J. (2006). Interpolation of air quality measures in hedonic house price models: Spatial aspects. Spat. Econ. Anal. 1 (1), 3152–52. doi:10.1080/17421770600661337
Baron, R. M., and Kenny, D. A. (1986). The moderator-mediator variable distinction in social psychological research: Conceptual, strategic, and statistical considerations. J. Pers. Soc. Psychol. 51 (6), 1173–1182. doi:10.1037//0022-3514.51.6.1173
Belotti, F., Hughes, G., and Mortari, A. P. (2017). Spatial panel-data models using Stata. Stata J. 17 (1), 139–180. doi:10.1177/1536867x1701700109
Bndt (2022). Map technology Review center of the Ministry of natural resources of China. Available at: http://bzdt.ch.mnr.gov.cn/browse.html?picId=%224o28b0625501ad13015501ad2bfc0694%22.
China Energy Statistical Yearbook (2022). China energy statistical Yearbook. Available at: https://data.cnki.net/Trade/yearbook/single/N2021050066?zcode=Z023.
Choy, Lennon H. T., and Li, Victor J. (2016). The role of higher education in China's inclusive urbanization. Cities 60, 504–510. doi:10.1016/j.cities.2016.04.008Part B
Clark, C. (1940). The Conditions of Economic Progress. The Economic Journal 51 (201), 120–124. doi:10.2307/2225658
Deng, H., and Zhao, J. (2018). ‘Group effect’ in local government economic decisionmaking. China Ind. Econ. (4), 59–78. doi:10.19581/j.cnki.ciejournal.2018.04.004
Dietz, T., and Rosa, E. A. (1997). Effects of population and affluence on CO2 emissions. Proc. Natl. Acad. Sci. U. S. A. 94 (1), 175–179. doi:10.1073/pnas.94.1.175
Du, L., Wang, F., and Tian, M. (2022). Environmental information disclosure and green energy efficiency: A spatial econometric analysis of 113 prefecturelevel cities in China. Front. Environ. Sci. 10. doi:10.3389/fenvs.2022.966580
Du, W., and Feng, K. (2013). Does urbanization worsen air quality? -Empirical evidence from countries with emerging economies. Comp. Econ. Soc. Syst. 5, 91–99. https://www.cnki.com.cn/Article/CJFDTotal-JJSH201305011.htm
Du, Y., Wan, Q., Liu, H., Liu, H., Kapsar, K., and Peng, J. (2019). How does urbanization influence PM2. 5 concentrations? Perspective of spillover effect of multi-dimensional urbanization impact. J. Clean. Prod. 220, 974–983. doi:10.1016/j.jclepro.2019.02.222
Elhorst, J. P. (2014). Spatial econometrics: From cross-sectional data to spatial panels. Heidelberg, New York, Dordrecht, London: Springer. doi:10.1007/978-3-642-40340-8
Fu, L. (2010). Empirical study on the relationship between industrial structure high-grade and economic growth in China. Stat. Res. (8), 79–81. doi:10.19343/j.cnki.11-1302/c.2010.08.011
Gan, T., Yang, H., and Liang, W. (2020). How do urban haze pollution and economic development affect each other? Empirical evidence from 287 Chinese cities during 2000–2016. Sustain. Cities Soc. 65, 102642. doi:10.1016/j.scs.2020.102642
Gan, T., Yang, H., and Liang, W. (2021). How do urban haze pollution and economic development affect each other? Empirical evidence from 287 Chinese cities during 2000–2016. Sustain. Cities Soc. 65. doi:10.1016/j.scs.2020.102642
Gao, M., Wu, X., and Guo, S. (2016). Urbanization, environmental regulation and air pollution - an empirical analysis based on STIRPAT model. Ind. Techno-Economics 35 (9), 110–117. doi:10.3969/j.issn.1004-910X.2016.09.015
Grossman, G. M., and Krueger, A. B. (1995). Economic growth and the environment. Q. J. Econ. 110, 353–377. doi:10.2307/2118443
Han, F., and Yang, L. G. (2020). How does agglomeration of productive services affect structural upgrading of manufacturing? --An integrated framework of agglomeration economy and schumpeterian endogenous growth theory. Manag. World 2, 72–94. doi:10.19744/j.cnki.11-1235/f.2020.0022
Hueglin, C., Gehrig, R., Baltensperger, U., Gysel, M., Monn, C., and Vonmont, H. (2005). Chemical characterisation of PM2.5, PM10 and coarse particles at urban, near-city and rural sites in Switzerland. Atmos. Environ. 39 (4), 637–651. doi:10.1016/j.atmosenv.2004.10.027
Jiao, R. (2015). The relationship between population size, urbanization and environmental pollution - an analysis based on panel data from emerging economies. Urban issues. 5, 8–14. doi:10.13239/j.bjsshkxy.cswt.150502
Jin, S., Wang, W., Qalati, S. A., Zhang, C., Lu, N., Zhu, G., et al. (2022). Can low-carbon technological innovation reduce haze pollution?—based on spatial econometric analysis. Front. Environ. Sci. 10. doi:10.3389/fenvs.2022.893194
Kelejian, H. H., Tavlas, G. S., and Hondroyiannis, G. (2006). A spatial modelling approach to contagion among emerging economies. Open Econ. Rev. 17, 423–441. doi:10.1007/s11079-006-0357-7
Lee, L, and Yu, J. (2014). Efficient GMM estimation of spatial dynamic panel data models with fixed effects. J. Econ. 180 (2), 174–197. doi:10.1016/j.jeconom.2014.03.003
LeSage, J. P., and Pace, R. K. (2009). Introduction to spatial econometrics. New York, NY, USA: Chapman and Hall, CRC. doi:10.1201/9781420064254
Liang, L., Wang, Z., and Li, J. (2019). The effect of urbanization on environmental pollution in rapidly developing urban agglomerations. J. Clean. Prod. 237, 117649. doi:10.1016/j.jclepro.2019.117649
Liang, R., and Xi, P. (2016). Heterogeneous impact of rail transit on air pollution: An empirical study based on RDID method. China Ind. Econ. 2016 (3), 83–98. doi:10.19581/j.cnki.ciejournal.2016.03.007
Liu, H., Fang, C., Zhang, X., Wang, Z., Bao, C., and Li, F. (2017). The effect of natural and anthropogenic factors on haze pollution in Chinese cities: A spatial econometrics approach. J. Clean. Prod. 165, 323–333. doi:10.1016/j.jclepro.2017.07.127ISSN 0959-6526
Liu, S., Shi, K., Wu, Y., and Chang, Z. (2021). Remotely sensed nighttime lights reveal China's urbanization process restricted by haze pollution. Build. Environ. 206, 108350. doi:10.1016/j.buildenv.2021.108350
Liu, Z., He, C., Zhang, Q., Huang, Q., and Yang, Y. (2012). Extracting the dynamics of urban expansion in China using DMSP-OLS nighttime light data from 1992 to 2008. Landsc. Urban Plan. 106 (1), 62–72. doi:10.1016/j.landurbplan.2012.02.013
Mayer, H. (1999). Air Pollution in Cities. Atmospheric Environment 33, 4029–4037. doi:10.1016/S1352-2310(99)00144-2
Rahman, M. M., and Alam, K. (2021). Clean energy, population density, urbanization and environmental pollution nexus: Evidence from Bangladesh. Renew. Energy 172, 1063–1072. doi:10.1016/j.renene.2021.03.103
Ruining, J., Meiting, F., Shuai, S., and Yantuan, Y. (2021). Urbanization and haze-governance performance: Evidence from China's 248 cities. Journal of Environmental Management 288, 112436. doi:10.1016/j.jenvman.2021.112436
Shao, S., Li, X., and Cao, J. (2019). China's urbanization and haze control. Econ. Res. 54 (2), 148–165.
Stats Gov (2022). China city statistical Yearbook. Available at: http://www.stats.gov.cn/tjsj/tjcbw/.
Stone, J. B. (2008). Urban sprawl and air quality in large US cities. J. Environ. Manag. 86 (4), 688–698. doi:10.1016/j.jenvman.2006.12.034
Sun, C., Zhang, W., Luo, Y., and Xu, Y. (2019). The improvement and substitution effect of transportation infrastructure on air quality: An empirical evidence from China's rail transit construction. Energy Policy 129, 949–957. doi:10.1016/j.enpol.2019.03.005
Tang, D., Yi, R., Kong, H., Da, D., and Boamah, V. (2022). Foreign direct investment entry mode and China’s carbon productivity based on spatial econometric model. Front. Environ. Sci. 10, 922151. doi:10.3389/fenvs.2022.922151
Tobler, W. R. (1970). A computer movie simulating urban growth in the detroit region. Econ. Geogr. 46, 234–240. doi:10.2307/143141
van Donkelaar, A, Hammer, M S., Bindle, L, Brauer, M, Brook, J R., and Garay, M J. (2021). Monthly global estimates of fine particulate matter and their uncertainty. Environ. Sci. Technol. 55. doi:10.1021/acs.est.1c05309
Wang, S., Chen, H., and Yin, K. (2022). The employment effect of Chinese industrial enterprises embedded in environmental cost-adjusted global value chains. Environ. Sci. Pollut. Res. 29, 18160–18176. doi:10.1007/s11356-021-17118-w
Wang, S., Tang, Y., Du, Z., and Song, M (2020). Export trade, embodied carbon emissions, and environmental pollution: An empirical analysis of China's high- and new-technology industries. J. Environ. Manag. 276, 111371. doi:10.1016/j.jenvman.2020.111371
Wang, S., Wang, X., and Tang, Y. (2019). Drivers of carbon emission transfer in China—an analysis of international trade from 2004 to 2011. Sci. Total Environ. 709, 135924. doi:10.1016/j.scitotenv.2019.135924
Yang, H., and Zhang, L . (2018). An empirical study on the impact of industrial structure evolution and urbanization process on air quality in beijing-tianjin-hebei region. China Popul. Resour. Environ. 28 (6), 111–119. doi:10.12062/cpre.20180323
Yu, B. (2020). Ecological effects of new-type urbanization in China. Renew. Sustain. Energy Rev. 135, 110239. doi:10.1016/j.rser.2020.110239
Yu, J., de Jong, R., and Lee, L. (2008). Quasi-maximum likelihood estimators for spatial dynamic panel data with fixed effects when both n and T are large. J. Econ. 146 (1), 118–134. doi:10.1016/j.jeconom.2008.08.002
Yu, Y., and Shi, J. (2022). Environmental regulation, low-carbon technologyprogress and energy efficiency. Front. Environ. Sci. 10. doi:10.3389/fenvs.2022.1012229
Yu, Y. (2010). The nonlinear threshold of GDP growth and Energy Consumption: An empirical analysis of the inter-provincial transfer of traditional industries in China. China Ind. Econ. 12, 57–65. doi:10.19581/j.cnki.ciejournal.2010.12.006
Yuan, B., Ren, S., and Chen, X. (2015). The effects of urbanization, consumption ratio and consumption structure on residential indirect CO2 emissions in China: A regional comparative analysis. Appl. Energy 140, 94–106. doi:10.1016/j.apenergy.2014.11.047
Zhang, K., Shao, S., and Fan, S. (2020). Market integration and environmental quality: Evidence from the Yangtze river delta region of China. J. Environ. Manag. 261, 110208. doi:10.1016/j.jenvman.2020.110208
Zhang, M., and Li, M. (2017). Regional differences in Impacts of economic growth and environmental regulation on haze. China Popul. Resour. Environ. 27 (9), 23–34. doi:10.12062/cpre.20170702
Zhang, W., and Luo, R. (2021). Environmental effects of FDI: ‘Pollution Halo’ or ‘pollution paradise’? -- empirical test based on panel ARDL-ECM model. J. Chongqing Technol. Bus. Univ. Soc. Sci. Ed., 1–19. Available at: http://kns.cnki.net/kcms/detail/50.1154.C.20210719.1745.014.html.
Keywords: urbanization, air pollution, spatial Durbin model (SDM), nighttime light data (NTL), China
Citation: Zhang L, You S, Zhang M, Zhang S, Yi S and Zhou B (2022) The effects of urbanization on air pollution based on a spatial perspective: Evidence from China. Front. Environ. Sci. 10:1058009. doi: 10.3389/fenvs.2022.1058009
Received: 03 October 2022; Accepted: 31 October 2022;
Published: 21 November 2022.
Edited by:
Shuhong Wang, Shandong University of Finance and Economics, ChinaReviewed by:
Binbin Lu, Nankai University, ChinaCopyright © 2022 Zhang, You, Zhang, Zhang, Yi and Zhou. This is an open-access article distributed under the terms of the Creative Commons Attribution License (CC BY). The use, distribution or reproduction in other forums is permitted, provided the original author(s) and the copyright owner(s) are credited and that the original publication in this journal is cited, in accordance with accepted academic practice. No use, distribution or reproduction is permitted which does not comply with these terms.
*Correspondence: Shibing You, c2J5b3VAd2h1LmVkdS5jbg==
Disclaimer: All claims expressed in this article are solely those of the authors and do not necessarily represent those of their affiliated organizations, or those of the publisher, the editors and the reviewers. Any product that may be evaluated in this article or claim that may be made by its manufacturer is not guaranteed or endorsed by the publisher.
Research integrity at Frontiers
Learn more about the work of our research integrity team to safeguard the quality of each article we publish.