 Can Li
 Wei Wei3
94% of researchers rate our articles as excellent or good
Learn more about the work of our research integrity team to safeguard the quality of each article we publish.
Find out more
ORIGINAL RESEARCH article
Front. Environ. Sci., 04 January 2023
Sec. Environmental Informatics and Remote Sensing
Volume 10 - 2022 | https://doi.org/10.3389/fenvs.2022.1056042
This article is part of the Research TopicTowards Sustainable Urban Development: Use of Geographic Big Data for Spatial PlanningView all 25 articles
It is important to explore the correlation characteristics of land markets among cities in order to promote coordinated developments. Based on the residential land prices in 168 counties in Hebei Province, this study used spatial econometric models and social network analysis to analyze the regional correlation effect and network structure evolution characteristics of residential land prices. The results indicated that: 1) the regional residential land price level has significant global spatial autocorrelation and local autocorrelation. High-High clusters were concentrated in cities around Beijing and Tianjin and provincial capitals, while Low-Low clusters were mostly distributed in central and southern Hebei. 2) The direct effect and spillover effect of influencing factors of residential land price were significantly different. The residents’ purchasing power, the socioeconomic level, and the land resources had significant impacts on the residential land price of the county itself, while the level of infrastructure and the policy environment had significant impacts on the residential land price of neighboring counties. 3) The degree centrality and betweenness centrality of residential land price in central counties of Hebei Province was generally high, showing a trend of agglomeration. However, the peripheral cities of Hebei Province lacked important central nodes in the network structure. From 2013 to 2020, increasing numbers of counties had shown the transmission function of “bridge,” and the balance of land price in the whole region had been constantly improved. The study found that the regional residential land price itself had spatial autocorrelation, and the spillover effect of its related factors was also the driving force that affects the transmission and diffusion of land price between counties. The change in the spatial network of county residential land price was primarily manifested in the transmission process starting from the central cities. The tightness of the spatial network was related to the number and distribution of central nodes. Hebei Province should focus on cultivating urban central nodes with development potential in marginal areas, create more land market growth poles according to local conditions, and accelerate the integration of land factor markets in Beijing, Tianjin, and Hebei to achieve healthy and balanced development of residential land prices. This study made up for the shortcomings of previous studies on land price correlations. The combination of correlation feature analysis and spatial network structure analysis was more helpful to reveal the characteristics of regional land price development, and the results could provide a reference for the formulation of urban land market regulation policies.
The land price is an important manifestation of the relationship between land supply and demand that reflects the interaction between land resources, the surrounding socioeconomic conditions and the ecological environment (Huang and Du, 2021), (Glumac et al., 2019). The land price provides feedback for the operation of the land market and plays an important role in the optimal allocation of land resources (Huang et al., 2022). The residential land price is a key part of the price of housing, and it is closely related to the operating mechanism of the real estate market, the level of urbanization, the degree of social and economic development, and the level of people’s livelihood (Davis and Palumbo, 2008). Influenced by regional economic and natural endowment differences, urban residential land prices show strong regional heterogeneity. However, due to the existence of capital flow, population migration, economic cooperation, and other functions between cities, residential land prices will naturally produce spatial correlation in theory. The so-called spatial correlation of urban residential land price refers to the manifestation of the interaction between urban residential land price and its influencing factors in space. Due to the difference of land price level, there are also differences in the spatial connection of land prices among cities, thus forming several urban agglomeration collectives. There is attraction within the urban agglomeration that can generate a networked spatial structure and enhance the cohesion so as to optimize the allocation of land elements and promote the development of each city within the urban agglomeration (Liang et al., 2015).
In recent years, most studies on land prices has focused on the driving mechanisms of influencing factors and the spatio-temporal differentiation characteristics of land prices. The research on influencing factors has involved the identification and quantification of factors. Some studies have constructed a multi-factor land price characterization system and revealed the comprehensive driving mechanisms of multi-factor land prices. Brano formed a set of characteristic variables that can explain the price of land in Luxembourg, including Accessibility, Proximity, Physical, Legal, Social, and Economic factors (Glumac et al., 2019). Song Jianan constructed a characteristic system of urban residential land prices in China comprising four variables: land supply and demand, economic level, social level, and policy impact (Song et al., 2011a). Han Juan constructed a characteristic system of urban residential land prices in China by choosing three variables: urban location, development potential, and socioeconomic level (Han et al., 2017). Some studies have investigated the mechanism of certain factors on land price such as population structure and distribution (Song et al., 2022), regional environment (Zhu et al., 2018), urban traffic conditions (Shen and Karimi, 2017), (Sohn, 2014), and national land policy (Gyourko and Jacob, 2021), (Liu et al., 2022). The research on the spatio-temporal differentiation characteristics of land price has included the exploration of the non-stationarity in time and heterogeneity in space of land prices and the associated influencing factors. Relevant results have confirmed that plot ratio, public facilities, population, and environmental factors have different effects on land price in different regions (Kheir and Boris, 2016). The impact of natural facilities and educational facilities on the surrounding land price would gradually increase over time, while the impact of commercial facilities and public transport would continue to decline (Zhang et al., 2021). The above achievements have provided a good foundation for the research on spatial correlation of land prices and the spatial network structure.
In studies of the spatial correlation effect on residential land prices, researchers have explored the characteristics of spatial correlation of land prices and analyzed the influencing factors of the spatial correlation effect. The current studies have generally focused on a single city or several adjacent cities in a region. It is believed that the urban land price is rising rapidly in the time dimension while showing relevance in the spatial dimension (Griffin et al., 2015). Most researchers have attributed the factors of land price correlation to geographical proximity and have concluded that the closer the geographical distance, the stronger the land price correlation between cities (Harris et al., 2013), (Zhan et al., 2011). Geographic proximity creates conditions for spatial correlation of land prices between neighboring cities, but for distant cities, the impact of geographic proximity decreases with the increase of spatial distance (Zhou and Tang, 2019). For land prices, the spillover effect is an important factor that leads to the land price correlations between neighboring cities. The spillover effect is reflected in the price transmission between geographical neighboring regions. The land price fluctuation in neighboring regions will have a significant impact on the local land price (Zhou and Tang, 2019). This rule applies not only to land prices but also to housing prices, which had been confirmed in city agglomerations in different countries such as the United Kingdom (Meen, 1999), the United States (Stephen, 1999), Australia (Tu, 2000) and China (Wang et al., 2016), (Zhang et al., 2015), (Liu and Chen, 2013). In addition to land price itself, frequent interactions of land price related factors between cities could also lead to land price related effects. Land price related factors such as urban traffic conditions (Okamoto and Sato, 2021), (Niu et al., 2021), administrative proximity (Zeng, 2019), and regulatory policies (Zheng et al., 2021) could link land price fluctuations by promoting the full flow of resources and information elements between regions. The government should implement land policy according to the distribution and flow of land elements and improve and adjust the land supply and demand structure in order to promote the stable and healthy operation of the local housing market (Tsai, 2018). The influence mechanism of land price related factors on land price correlation has become a trend in land price spatial correlation research, but there are few relevant achievements at present.
In terms of the research on the spatial network structure of residential land price, with the accelerated flow of elements between cities, studies no longer limit their research perspective to the spatial distribution pattern of residential land prices, but focus more on the spatial network structure between cities because of the relationship between regional residential land prices, focusing on the formation process and drivers of the spatial network structure of residential land prices. Relevant results have shown that the number of spillover relationships between real estate prices in most cities far exceeded the number of neighboring cities, indicating that the real estate linkage between multiple cities had broken through the “neighborhood effect” in the simple geographical sense and presented a complex network structure (Huang et al., 2009), (Zhang and Lin, 2015). The rapid progress of market integration and informatization has strengthened the long-distance transmission of resources and information and the ability to trade goods and personnel. This increases the closeness of the connection between residential land prices in different cities and makes the network characteristics more prominent (Gan and Huo, 2016). As to the reasons for the formation of the spatial network structure of land prices, most researchers believe that the spatial transmission of real estate prices has a certain regularity, and the land prices in some areas would lead to changes in the surrounding areas after the first price change. Family migration, wealth transfer, spatial arbitrage, and other factors as well as market heterogeneity factors such as regional land market development level and public expectations were the main reasons for the emergence of land price spatial networks (Elias, 2006). Some researchers also believe that the “ripple effect” of land price is related to the definition of geographical regions, and the mode of land price transmission was clear only between continuous geographical regions (Pollakowski and Ray, 1997), (Wang et al., 2008). With the frequent flow of factors among cities and the increasingly close cooperation relationships, the closeness of social and economic development levels, resource endowment, and infrastructure construction determine the form and characteristics of urban land price related networks and also affect the position and role of each city in the land price transmission process (Zhou et al., 2020).
In terms of research methods, exploratory spatial data analysis, spatial econometric models (Juethe and Pede, 2011), Geographically Weighted Regression models (Harris et al., 2013), (Nilsson, 2014) and hedonic price models (Zhu et al., 2014) are widely used in the research on spatial correlation effects and driving factors of residential land prices. These methods play important roles in analyzing the spatial differentiation characteristics of residential land prices. Spatial econometric models are used to study the spatial correlation and heterogeneity of economic phenomena. These models pay more attention to the spatial relationships between things, and they have advantages in finding the mechanism of the influence of land price-related factors on land price correlation (Cheng et al., 2020). Social network analysis methods are generally used to discuss the network types and development laws in urban industrial development (Fu, 2021), tourism economic development (Gan et al., 2021), ecological efficiency (Xu et al., 2020), land use efficiency (Xia et al., 2020), spatial planning (Bacău et al., 2020) and other fields in the region, while application to research on real estate prices is relatively rare. In recent years, only a few researchers have used the social network analysis methods to investigate the network structure characteristics of real estate price linkage between cities. However, these studies have verified the applicability of social network analysis methods in the real estate market, and they could provide data support and a theoretical basis for different cities to formulate targeted regulatory policies.
To sum up, most studies have confirmed that urban land prices generally have regional correlation effects and network morphological characteristics that can achieve optimal allocation of land resources to a large extent. However, there are two aspects worth further exploration: First, the existing studies often discuss the conduction and correlation of land price itself, ignoring the spatial correlation effect of land price-related factors (Peng et al., 2019), (Hu et al., 2016), (Griffin et al., 2015), and thus the influence mechanism of related factors on land price correlation needs further exploration. Second, there are few studies on the combination of regional residential land price correlation effect and spatial network structure. Most studies have focused on the analysis of land price correlations between cities, primarily considering the geographical “neighborhood” effect or “regional” effect, factors with which it is difficult to grasp the overall characteristics of land price linkage. The analysis of the correlation effect of regional residential land prices and the spatial network structure is more helpful to comprehensively reveal the regional local and overall residential land price development characteristics. Three, most of the current studies have focused on urban scale residential land price correlation characteristics, while few studies have focused on the county scale. The correlation characteristics of land prices at different scales may be different. The study of small-scale unit land prices is more conducive to the government being able to formulate effective regulation policies. The spatial effect of residential land prices at the county level needs to be explored.
In recent years, the process of urbanization in China has accelerated significantly, and the demand for land has increased. The residential land market is becoming more competitive (Jiang et al., 2021). Hebei Province, which is the main region used to relieve Beijing’s non-capital functions, is accelerating the integration of its land market. The complementary characteristics of land resources between regions are becoming more prominent (Ma et al., 2020), and the cross-border exchanges in land markets between regions are also increasing (Wang et al., 2020). In China, the rational use of land resources is the key to promoting industrial transfer from Beijing and Tianjin (Luo et al., 2021). However, it is unknown whether correlations exist among the elements of land resources in Hebei or how to coordinate the development of the inter-city residential land markets. These questions need to be answered.
The present study considered 168 counties in Hebei Province as the research object. We used the spatial econometric model to analyze the regional correlation effect of residential land prices in the region and used social network analysis methods to explore the structural characteristics of the overall regional residential land price network. This study explains the influence mechanisms of relevant factors on spatial correlation of residential land prices through the estimation results of direct and spillover effects, examines the status and role of each county in the residential land price linkage network through the measurement results of degree centrality and intermediary centrality, and depicts the overall network structure characteristics of residential land price linkage through the measurement results of network density, and agglomeration subgroups. This study answers the following three questions. What factors affect the linkage of residential land prices in different regions? What is the position and role of local residential land prices in this linkage network? What are the characteristics of the network structure of the linkage of land prices in different regions? Based on the answers to the above questions, the study has important theoretical significance and application value to improve the accuracy of residential land price regulation policy and build a coordinated regulation mechanism of cross-regional land markets.
The total area of Hebei Province is 188,000 km2, accounting for 1.96% of China’s total area. It is the only province in the country with plateaus, plains, mountains, hills, lakes, and seashores. Hebei Province includes Shijiazhuang, Baoding, Langfang, Tangshan, Cangzhou, Handan, Xingtai, Chengde, Zhangjiakou and Hengshui, 11 prefecture-level cities and 168 county-level administrative units. In 2020, the GDP of Hebei Province was 3620.69 billion yuan. Tangshan, Shijiazhuang, and Cangzhou ranked the top three contributors to GDP, with 721.09 billion yuan, accounting for 19.9%, 16.4%, and 10.2% respectively. The per capita GDP of Hebei Province was 48,564 yuan, a year-on-year growth rate of 4.78%. The permanent population of Hebei Province was 74.6384 million, accounting for 5.28% of the national population. Shijiazhuang had the highest population with 10.6471 million people. The population of Hebei Province is concentrated in the central and southern plains, and the population in the northern mountainous areas is sparsely distributed. Differences in the economic level and population density among cities contribute to the unbalanced nature of urban land prices. In 2020, the average residential land price in Hebei Province was 5278 yuan/m2, with significant regional differences. The average residential land prices in Tangshan, Langfang and Baoding were high, at 8668 yuan, 6675 yuan, and 6580 yuan/m2, respectively. In 2020, there was an investment of 581.7 billion yuan to increase the transportation volume in Hebei Province, a rise of 3.4%. Hebei Province had 7941 km of railways and 204,737 km of highways, forming a modern comprehensive transportation system with multiple modes of transportation. Hebei Province had an annual passenger volume of 182 million and a freight volume of 2.478 billion tons in terms of external connections. There are close economic ties between cities in Hebei Province, and these are increasing in the current social and economic conditions (Figure 1).
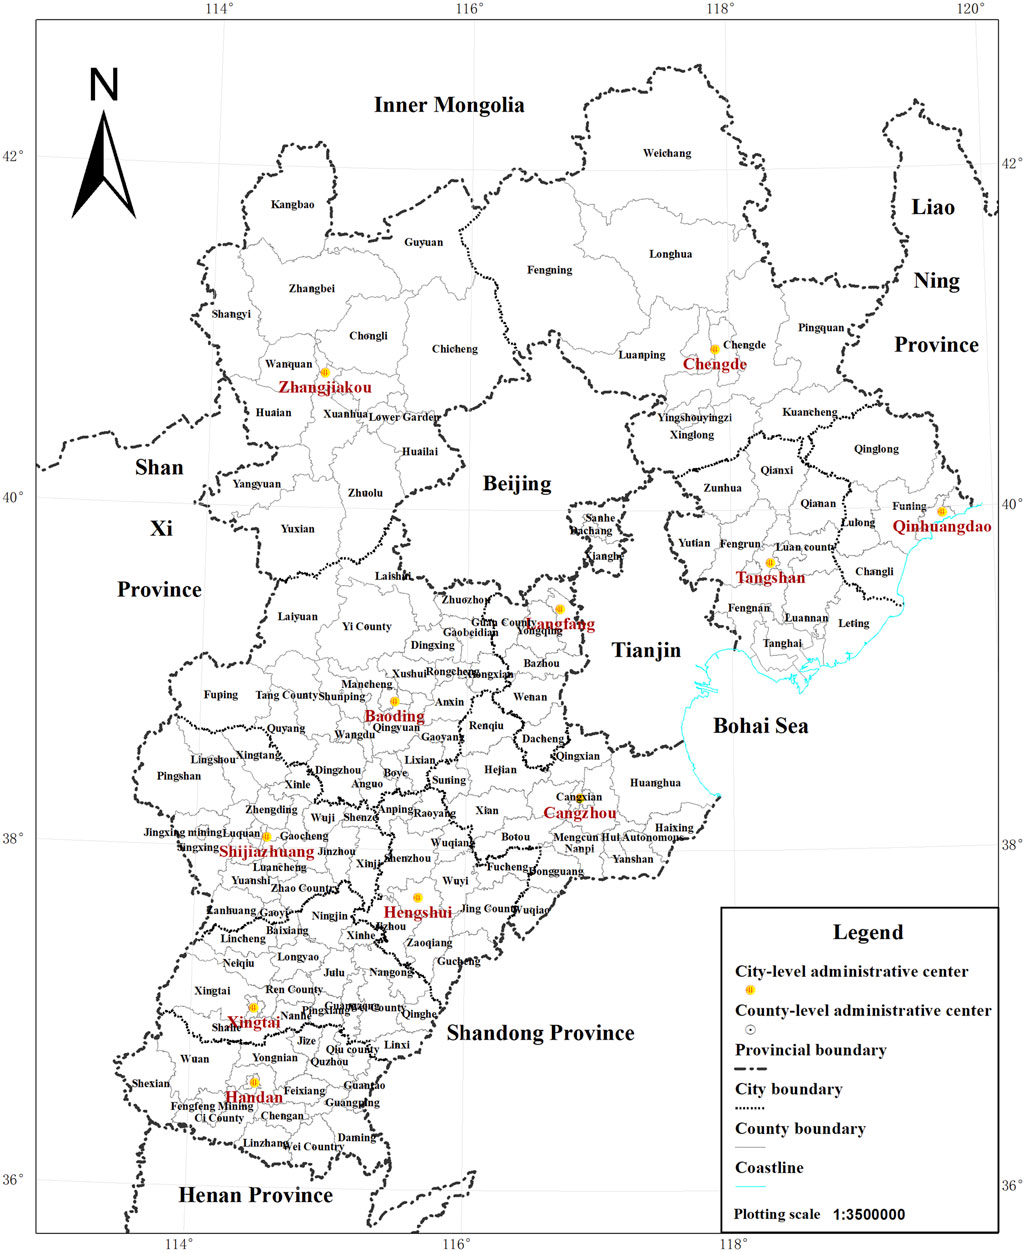
FIGURE 1. Research area in Hebei Province, China.
This study applied spatial autocorrelation analysis, spatial econometric modelling, and social network analysis. Spatial autocorrelation analysis is the core content of spatial correlation analysis and is also an important prerequisite for spatial econometric analysis. Spatial autocorrelation analysis determines whether residential land prices are spatially relevant by measuring the degree of spatial correlation and difference, and the analysis can identify the regional correlation characteristics of residential land prices at different levels. Spatial econometric analysis pays more attention to the spatial relationship between things and can further identify the impact mechanism of relevant factors on the spatial correlation of residential land prices and reveal the regional correlation characteristics of land price driving factors. Social network analysis can clarify the status and role of each region in the land price linkage network and depict the overall network structure characteristics of residential land price linkage. The combination of spatial autocorrelation analysis, spatial econometric analysis, and social network analysis is helpful to fully reveal the regional local and overall land price development characteristics. A flow chart of the study is presented in Figure 2.

FIGURE 2. Flow chart of the study.
This study took 168 county-level administrative units in Hebei Province as the research object. The research time span was from 2013 to 2020. The data included residential land transaction data and socio-economic data for each county in Hebei Province. The transaction data of residential land is obtained through China Land Market Network (https://www.landchina.com/#/), and the websites of natural resource bureaus of various cities, and field research. The transaction data of residential land included information such as the name, location, land use, area, land use period, land source, land supply method, transaction price, plot ratio, and contract signing date. Socio-economic data included Per capital disposable income, Resident deposit savings, Average salary of employees, Population density, Urbanization rate, etc. which were derived from Various statistical yearbooks of Hebei Province from 2013 to 2020. The transaction data of residential land was mainly used to calculate the residential land price in different years in each county, and the socio-economic data was mainly used to build the indicator system of influencing factors of residential land price. See Table 1 for data source overview.
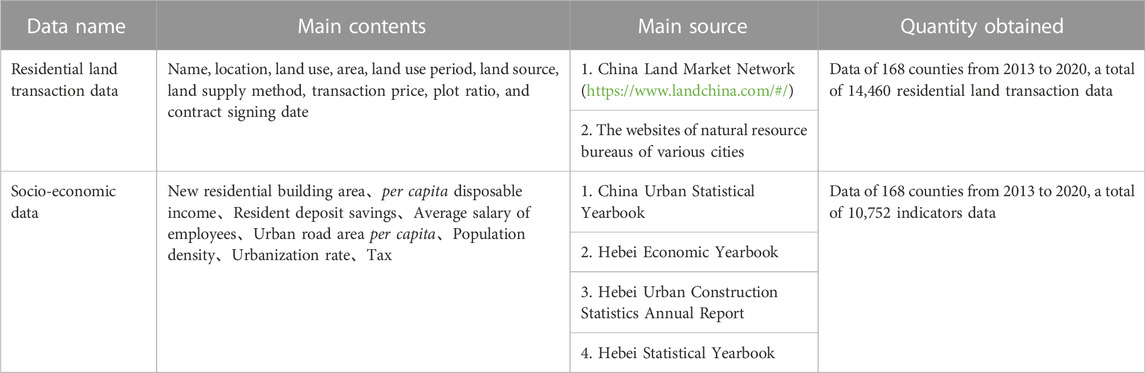
TABLE 1. Data source overview.
To ensure the accuracy of model estimation and objectively reflect the relationship between residential land prices in the region, research on the regional correlation effect of residential land prices needs to consider both the single interaction of residential land prices between cities, and also other variables that affect residential land prices. According to the principles of regional differences, operability, and comparability (Liu et al., 2019), (Song et al., 2011b), (Lesage and Pace, 2009), we selected eight land price influencing factors, including land resources, residents’ purchasing power, socioeconomic level, infrastructure, population size, urban development level, and the policy environment based on existing achievements. The data for these indicators were derived from China Urban Statistical Yearbook, Hebei Economic Yearbook, Hebei Urban Construction Statistics Annual Report, and the Statistical Yearbook of Cities in Hebei Province. To reduce the influence of strong fluctuations in the data, the natural logarithm of the original data of all variables was calculated (Table 2).
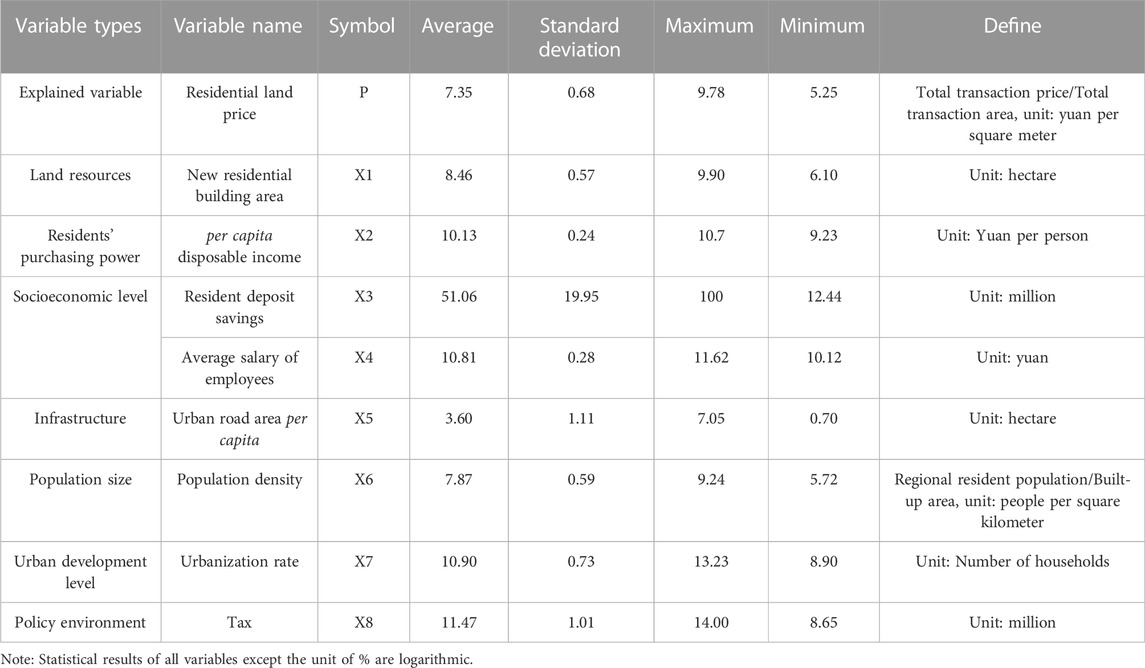
TABLE 2. Descriptive statistics for variables related to spatial analysis.
In order to ensure the scientific rationality of the survey data, we used the relevant research methods of Chenxi Li et al. (2021) to verify and analyze the quality of the survey data, including data validity test and reliability analysis.
Validity analysis mainly includes content validity and structure validity. The scientificity of the indicator types used in this study had been verified by relevant literatures. The data were from the land market transaction data published by the government and the publicly issued yearbook data. Combined with the theoretical elements of the literature and the realistic elements of the data source, the content validity of the data meets the requirements. Structural validity refers to the corresponding relationship between the framework and the measured value, usually using exploratory factor analysis. In this study, KMO and Bartlett’s sphericity test were used to measure the correctness of the selected measurement variables. The KMO value calculated by SPSS statistics is 0.852, greater than 0.7, Bartlett’s approximate chi square value is 2631.346, and the Sig. value is .000, less than .05 (Table 3). This showed that the research data is effective and suitable for subsequent spatial autocorrelation analysis and spatial econometric analysis.
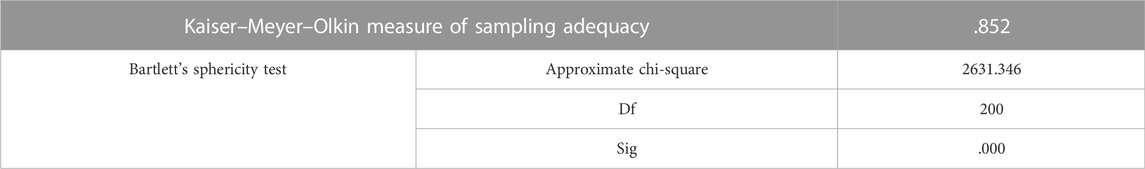
TABLE 3. Test results of KMO and Bartlett.
Among the reliability analysis methods, Cronbach analysis is the most widely used measurement method, which directly used the reliability coefficient value(α) to describe the level of reliability. In order to further test the authenticity and credibility of the data, this study used Cronbach reliability analysis method to measure the reliability level of the data. If the coefficient of Cronbach’s α≧0.7, it indicates that the data reliability is acceptable, and the larger the reliability coefficient value, the better (Feng and Tian, 2011), (Chai et al., 2019). Calculated by SPSS statistics, the coefficient of Cronbach’s α of the total amount table was 0.956, which met the standard. This proved the reliability of the study data (Table 4).
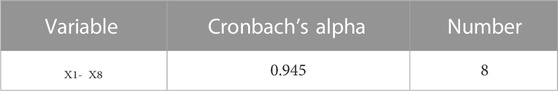
TABLE 4. Reliability statistics results.
Moran’s I was used to test the global spatial autocorrelation of residential land prices and provide a basis for the selection of subsequent spatial econometric models. The value range of Moran’s I was [−1, 1]. If the Moran’s I value was greater than 0, it meant that the residential land price showed a positive spatial correlation. When the index was closer to 1, there was a closer relationship between residential land prices among counties. If the Moran’s I was equal to 0, it means that there was no spatial autocorrelation for residential land prices. If the Moran’s I was less than 0, it indicated that there was a negative spatial correlation between residential land prices. When the Moran’s I was close to −1, there was a greater difference in residential land prices among counties. The calculation formula is as follows:
where I is the global Moran’s index; Xi and Xj are the residential land prices of county i and j; n is the number of counties and districts; Wij is the spatial weight matrix of county i and j;
To further identify the spatial agglomeration characteristics of residential land prices among local counties and districts, this study used local Moran’s I to measure the correlation between the residential land price in a county and in its neighboring counties. The value range of the local Moran’s Ii was [−1, 1]. If Moran’s Ii was greater than 0, it meant that the residential land price was spatially positively correlated, e.g., the residential land price between counties and districts had a “High–High” or “Low–Low” cluster phenomenon. If the Moran’s Ii was equal to 0, it meant that there was no spatial autocorrelation for residential land prices. If the Moran’s Ii was less than 0, it meant that the residential land price was negatively correlated with space, and there was a “High–Low” or “Low–High” cluster phenomenon.
where Ii is the local Moran’s I of county i; Xi and Xj are the residential land prices of counties i and j; n is the number of counties; Wij is the spatial weight matrix of counties i and j;
Before the quantitative regression of county residential land prices, this study considered whether there were certain constraints between the assumed factors. The three main test methods for econometric models are the Lagrange multiplier (LM) test, Wald test, and likelihood ratio (LR) test. These three methods were used to test whether the constraints we set were established, and methods were tested in turn. The LM test was used to assess whether there was a serial correlation in the residual series of the model. It can supplement the Moran’s I estimation results and improve the accuracy of the spatial dependence estimation of the residential land price model. The LM statistic is defined as:
where λ is the Lagrange multiplier vector;
The Wald test and LR test were used to select and determine the applicable form of the specific spatial econometric model. In the Wald test, if the p-value of the Wald-lag test was significant, and the p-value of the Wald-error test was not significant, the Spatial Lag Model (SLM) was applicable. If the p-value of the Wald-lag test was not significant, and the p-value of the Wald-error test was significant, the Spatial Error Model (SEM) model was applicable. If the p-values of both the Wald-error test and the Wald-error test were significant, then the Spatial Dubin Model (SDM) model was used. The Wald statistic is defined as:
Where
In the LR test, if the p-value of the LR-lag test was significant, but the p-value of the LR-error test was not significant, then the SLM model was applicable. If the p-value of the LR-lag test was not significant, but the p-value of the LR-error test was significant, then the SEM model was applicable. If the p-value of both the LR-lag test and the LR-error test were significant, then the SDM model was used. The LR statistic is defined as:
where
After determining the specific form of the model, we needed to analyze its internal effect dimensions. We selected a fixed effect and a random effect using the Hausman test. If the p-value of the Hausman test was high, the fixed effect model was used, otherwise the random effect was used. The Hausman statistic is defined as:
where
In theory, the frequent interaction of land price related factors between cities leads to the correlation of land price. The change of related factors of land price in any region will not only affect its land price level, but also affect the land price level of the region with spatial correlation. Spatial econometric model is introduced in this study to explore the direct and indirect effects of related factors on residential land prices in various regions, and to reveal the influencing mechanism of related factors on the correlation of land prices. The spatial econometric model incorporated spatial effects into the model, which addressed the spatial dependence problem in the traditional linear regression model and measured the interaction between various factors that influenced the residential land price in counties and districts. The spatial Durbin model is a generalized form of the spatial econometric model, containing both endogenous interaction effects (WY) and exogenous interaction effects (WX). The spatial Durbin model was able to explore the regional correlation effect of the residential land price and the correlation path of each influencing factor from the dimensions of the intrinsic direct effect and the extrinsic spillover effect in the application process. The calculation is as follows:
where Yit is the explained variable (residential land price); X is the explanatory variable matrix (the influencing factors of residential land prices); ρ, α, β are the coefficients to be estimated; ε is the residual; i is the county, t is the year; W is the spatial weight matrix. The test of a correlation effect on residential land prices between counties and districts was whether the coefficient ρ in the model was significant. If ρ was significant, this meant that the residential land price of a county was affected by other counties and districts, and there was a correlation effect. If ρ was not significant, this meant that the residential land price in a county was not affected by other counties and districts, and there was no correlation effect.
In the model, the parameter estimation results of each influencing factor cannot directly characterize the specific correlation path of the residential land price. Therefore, on the basis of the research of LeSage (Fu, 2021) and others, this study used partial differential decomposition to decompose the impact of various influencing factors on residential land prices into direct effects and spillover effects. The expression is adjusted as follows:
transform the expression:
The matrix form is as follows:
where Sr(W)ij represents the ith and jth factors in Sr(W), and V(W)i represents the ith row in V(W), and thus the expression is as follows:
where the diagonal mean Sr(W)ii represents the direct effect value, indicating that the change of the influencing factor r of a county will play an elastic role in the local residential land price. The non-diagonal mean Sr(W)ij represents the indirect effect value, indicating that the change of the influencing factor r of one county will have an overflow effect on the residential land price in other counties in the region. The mean value of the matrix row (column) Sr(W) represents the comprehensive value of the spatial effect, representing the degree to which a county influencing factor affects the total residential land price in the area.
The current study formed a county-level association network system of residential land prices by connecting the residential land price nodes in the counties of Hebei Province. By observing the characteristics of network centrality, network density, and agglomerated subgroups, we were able to analyze the organizational structure characteristics of the regional residential land price spatial network in Hebei Province. This analysis helped to identify the role and status of residential land prices in each county in the network structure, the degree of connection, and the characteristics of regional subgroups.
Network centrality is an important indicator to measure the degree of centralization of residential land price nodes. Network centrality can be divided into point degree centrality, closeness centrality and betweenness centrality.
Point degree centrality represents the influence and competitiveness of a land price node. Counties with higher centrality have a higher land price influence. The expression is as follows:
where CRD(i) is the relative degree centrality of city i; CAD(i) is the absolute degree centrality of city i, and n is the number of other cities connected to city i in the network.
Betweenness centrality represents the degree of connection between residential land price nodes. It is used to measure the ability of a land price node to be unaffected by other nodes. When the degree of the node is higher, it has a stronger ability to transmit and control information, and a higher degree of linkage to the spatial network. The expression is as follows:
where CRBi is the relative betweenness centrality of city i; CABi is the absolute betweenness centrality of city i.
Network density was used to measure the degree of connection between all nodes in the network structure, which showed the cohesion of the spatial network. It could comprehensively reflect the impact of the residential land price spatial network on each land price node and the closeness of the communication between each node. When the network density value was high, there was a greater effect of the spatial network on the land price nodes, there was a higher degree of interaction between the land price nodes, and the space was more closely related. The expression is as follows:
where D is the network density, k is the number of nodes in the network structure (168 counties in Hebei Province); d(mi,mj) is the relationship between mi and mj. If there was an association between county i and county j, then d(mi,mj) was 1, otherwise it was 0.
Cohesive subgroup analysis was used to identify small urban land price groups in the residential land price spatial network by simplifying the complex land price network. We could identify the number of agglomerated subgroups and the members of land price nodes within different subgroups through data analysis. This was able to show how subgroups were related, how they were connected, and how they were organized. We used UCINET software and CONCOR to carry out the calculation and analysis of cohesive subgroups.
This study used ArcGIS10.2 software to calculate Moran’s I (Figure 3). The global Moran’s I index was 0.44, and the Z value was 8.94, exceeding the test threshold of 2.58, and the p-value passed the 1% significance test. It showed that the spatial distribution of the residential land price in the region had a strong global autocorrelation. Geoda was used to generate the LISA aggregation map (Figure 4). The results showed that the spatial distribution of residential land price in the region also had significant local autocorrelation characteristics. High-High clusters were mainly concentrated in cities around Beijing and Tianjin and provincial capitals and were distributed in 14 counties including Dachang and Xianghe in Langfang, Mancheng in Baoding, and Gaocheng in Shijiazhuang. The Low-Low clusters were mostly distributed on the southern and central Hebei, involving 20 counties. Therefore, it could be judged that the data set of this study could further carry out spatial correlation effect analysis.
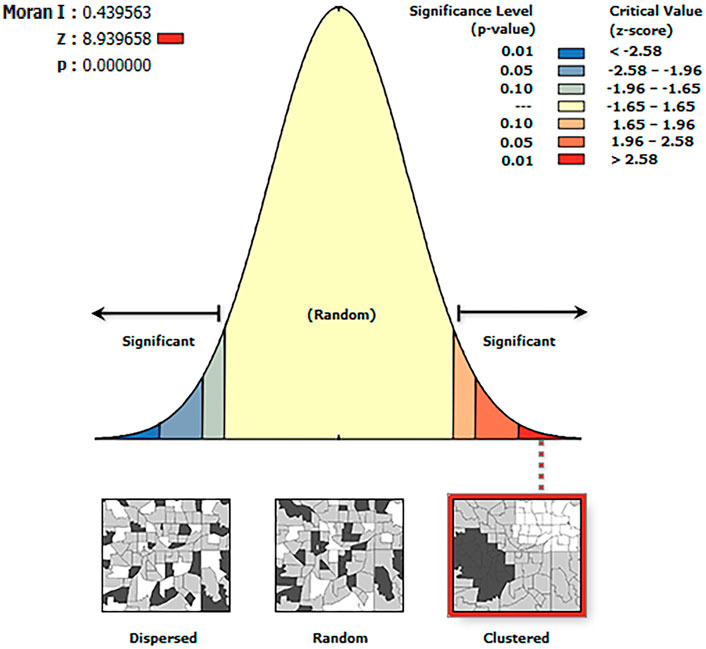
FIGURE 3. Moran’s I of residential land prices.
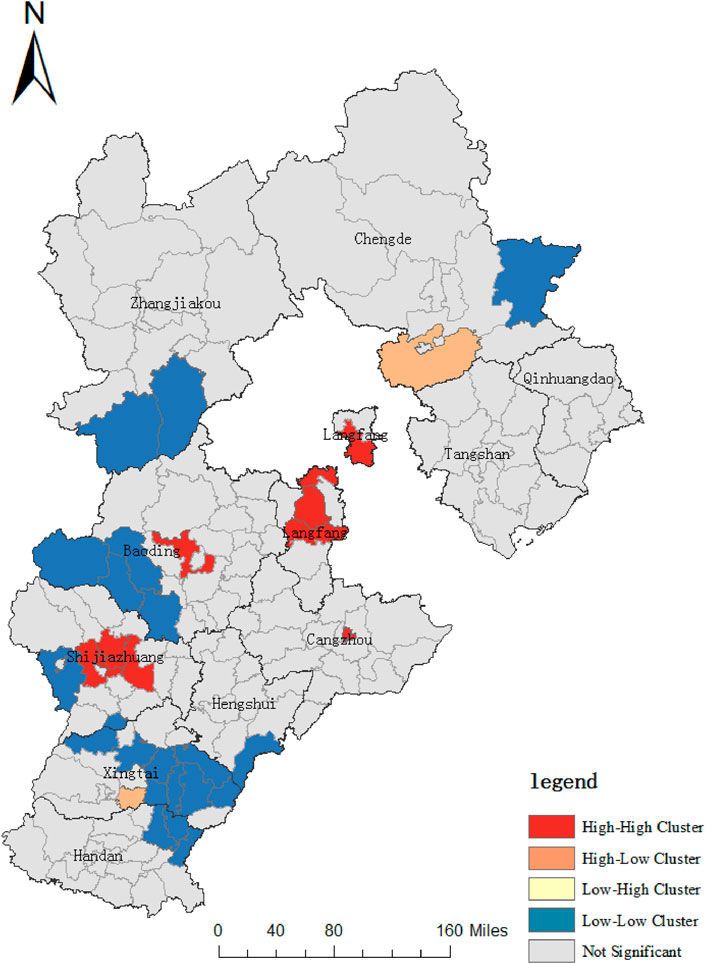
FIGURE 4. LISA cluster map of Hebei.
The spatial econometric correlation analysis referred to the research process established by Anselin (Anselin et al., 1996). First, a series of regression tests was carried out on the residential land price, which was used to select and determine the applicable model for specific spatial measurement. The test results are shown in Table 5. 1) The LM spatial dependence test showed that: LM-Lag, LM-Error and their robustness tests passed the significance test at the levels of 5%, 1%, 1%, and 1% in turn, which indicates that the data in this study were suitable for use in the spatial econometric model for parameter estimation. 2) Both the Wald test and the LR test passed the 1% significance level test, and it was determined that the specific form of the spatial panel model was the Spatial Durbin model. 3) The Hausman test had a value of 38.13, which met the 1% significance level and showed that the spatial Durbin model under fixed effects was the most suitable choice to analyze the regional correlation effect of residential land prices between counties and districts in Hebei Province.
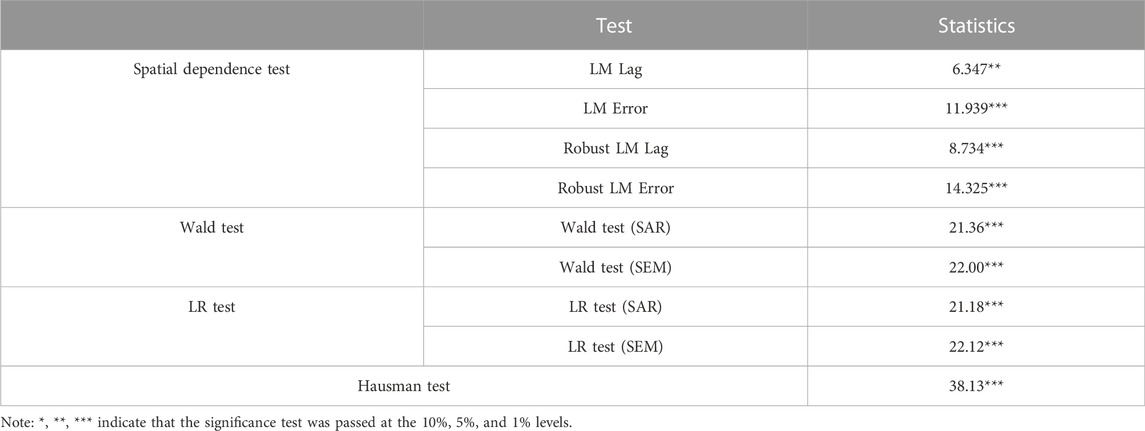
TABLE 5. Series of test results of spatial Econometric model.
After logarithmic processing of all research data, this study used the STATA spatial measurement tool to estimate the results, as shown in Table 6.
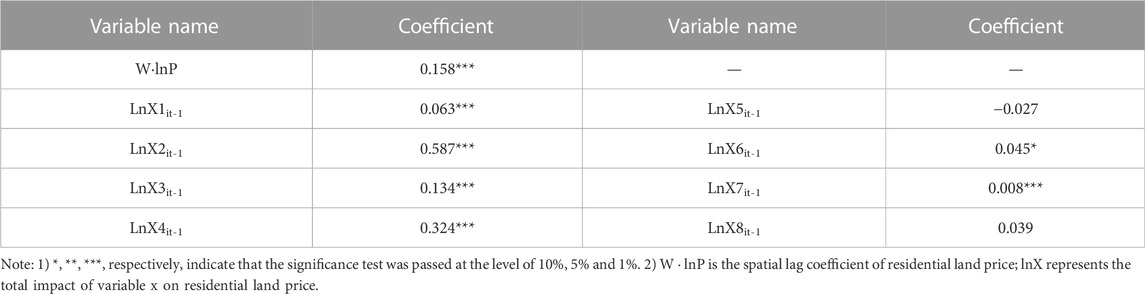
TABLE 6. Estimation results of spatial Durbin model.
The spatial lag coefficient of the residential land price was 0.158, and it passed the significance test at the level of 1%. This result indicated that the residential land price in Hebei Province had a significant positive spatial correlation effect in geographical space. The changes in residential land prices in adjacent counties had interactive linkage and radiation effects, which were manifested in the form of synchronized increases and decreases.
Among the total effects of the different variables on the residential land price, Residents’ purchasing power, Social and economic level, Land resources, and Urban development level variables had a positive impact on the residential land price at the 1% significance level. Every 1% increase in the Per capita disposable income increased the residential land price by .587%. Every 1% increase in Average salary of employees increased the residential land price by .324%. Every 1% increase in Resident deposit Savings increased the residential land price by .134%. Every 1% increase in New residential building area increased the residential land price by .063%, and every 1% increase in Urbanization rate increased the residential land price .008%. The variable of population size also had a positive impact on the residential land price at the 10% significance level. Every 1% increase in population density increased the residential land price by .045%.
The spatial Durbin model included the residential land price and the spatial lag terms of each variable. To further test the specific influence of each variable on the spatial effect of residential land price, this study used a partial differential solution to decompose the spatial effect of each variable and analyze the internal transmission mechanism of each variable’s impact on the residential land price as a direct effect and a spillover effect. The direct effect represented the contribution of each variable to the residential land price within the county, and the spillover effect represented the contribution of each variable of the residential land price within the county to the residential land price in neighboring counties. The results are shown in Table 7.
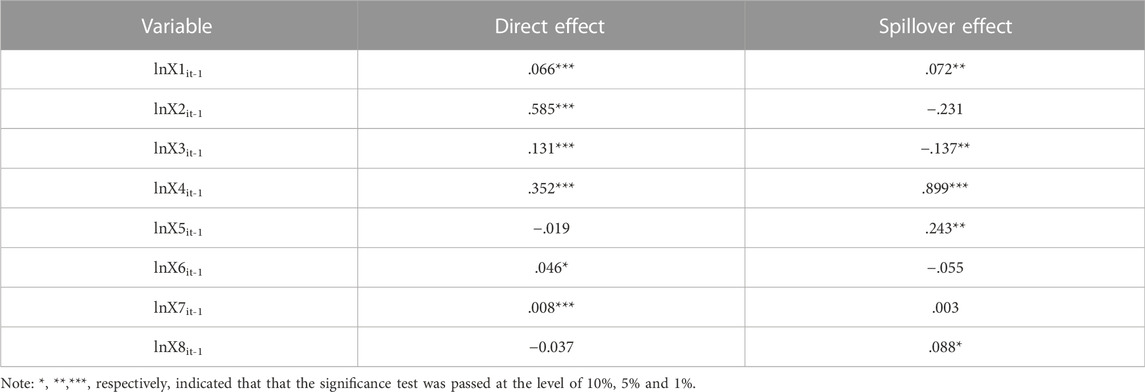
TABLE 7. Estimation of the direct effect and spillover effect of the spatial econometric model.
Residents’ purchasing power, Socio-economic level, Land resources, Population size and Urban development level all had a direct impact on residential land price within the county to varying degrees. The direct influence of each variable was in the order of Per capita disposable income >Average salary of employees > Residents’ deposit savings > New residential building area > Population density > Urbanization rate. The per capita urban road area and taxation both showed negative effects, but these were not significant. The per capita disposable income had the greatest influence on residential land prices in the county, at the 1% significance level, every 1% increase raised the residential land price in the county by .585%. The urbanization rate had the lowest degree of influence, at the 1% significance level, every 1% increase raised the residential land price by .008%.
Socio-economic level, Infrastructure, Policy environment all had an indirect impact on the residential land price of neighboring counties to varying degrees. The contribution of each variable to the spatial spillover effect of residential land prices in neighboring counties was in the order of Average salary of employees > Per capita road area > Residents’ deposit savings# > Tax > New residential building area (# indicates a negative impact). The per capita disposable income and Population density had a negative effect, and the Urbanization rate had a positive effect, but none of these were significant. The average salary of employees was the most significant factor affecting the residential land price in neighboring counties. At the 1% significance level, every 1% increase in the average salary of employees increased the residential land price in neighboring counties by .899%. The contribution of the newly added residential building area to the residential land price in the neighboring counties was relatively low, but also showed a positive impact. Every 1% increase raised the residential land price in the neighboring counties by .072%.
The evolution of the individual network structure was dominated by the centrality characteristics. Centrality analysis mainly measured the role and dominance of node cities in the spatial network. Owing to the differences in economic level and resource conditions of cities, as well as the influence of traffic conditions and geographical location, node cities had different roles in the spatial network. The analysis of the individual network structure clarified the position of each network node city in the overall network. This study used UCINET to calculate the degree centrality and betweenness centrality of 168 counties and districts in Hebei Province in 2013 and 2020.
As shown in Figure 5; Table 8, in 2013, the high-value areas of degree centrality were mainly distributed in the center of Hebei Province, with values of 115 in Qiaoxi of Shijiazhuang, 93 in Yuhua of Shijiazhuang, and 92 in Chang’an of Shijiazhuang; In 2020, the central high-value areas expanded to the surrounding areas, mainly in the central and southern parts of Hebei Province, in which Anci of Langfang reached 108, Yunhe of Cangzhou reached 104, and Zhengding of Shijiazhuang reached 96. From 2013 to 2020, the average degree centrality of residential land price in Hebei Province increased from 37.988 to 41.321, showing an overall upward trend. The high-value degree of centrality areas gradually became clustered in the central region, including Chang’an and Yuhua of Shijiazhuang, Jingxiu of Baoding, and Guangyang of Langfang. The average degree centrality of each node county expanded, and more counties played a growing role in the spatial network of residential land prices.
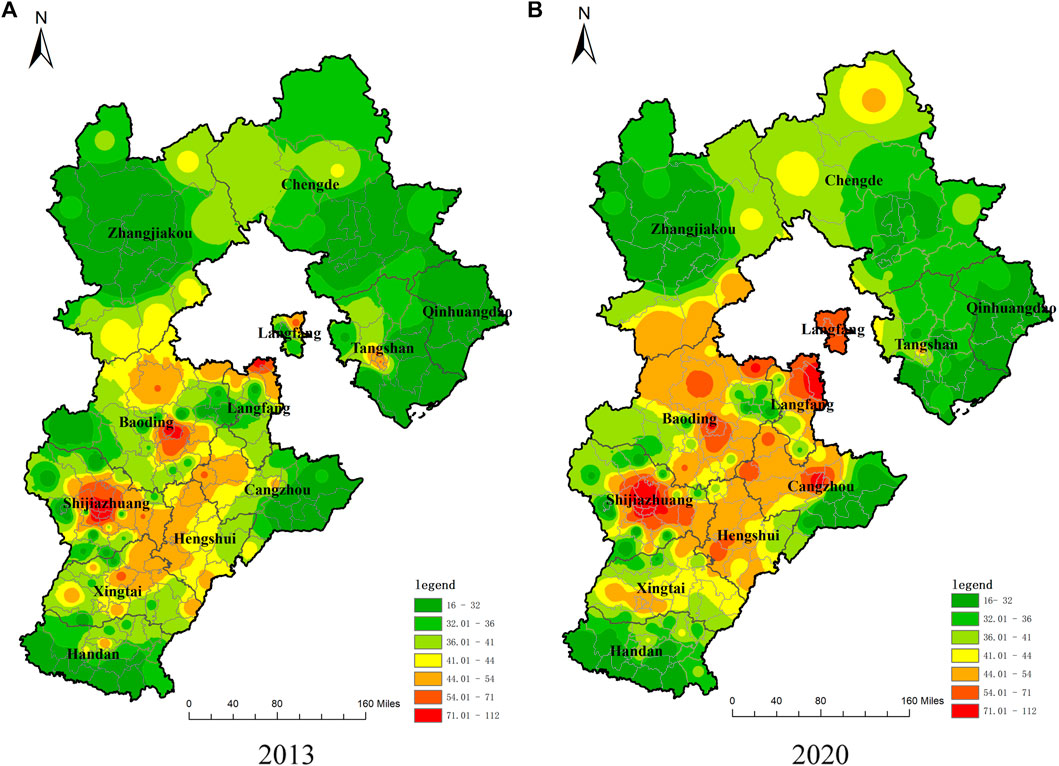
FIGURE 5. Map of the degree centrality of residential land prices in the counties of Hebei.
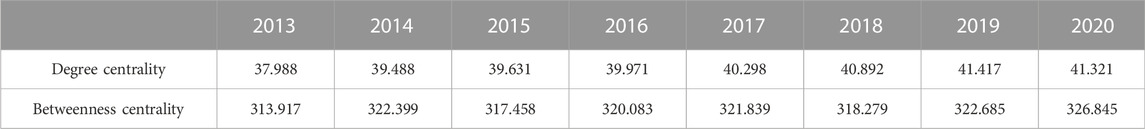
TABLE 8. Average value table of residential land price centrality in Hebei Province.
As shown in Figure 6; Table 8, in 2013, the high-value areas of betweenness centrality were scattered in the central part of Hebei Province, including values of 2547.85 in Qiaoxi of Shijiazhuang, 1041.007 in Guangyang of Langfang, and 730.411 in Lianchi of Baoding. In 2020, the high-value areas of betweenness centrality expanded to the periphery, concentrated in the central and coastal areas of Hebei Province, with a small area in the north of the region. The highest values were in Yunhe of Cangzhou at 1684.134, Anci of Langfang at 1274.999, and Qiaoxi of Shijiazhuang at 768.572. From 2013 to 2020, the average value of betweenness centrality rose from 313.917 to 326.845, although the change trend showed a fluctuating distribution. The number of cities in the high-value areas increased, mainly in the central part of Hebei Province, and their role as “bridges” in the network structure was clear.

FIGURE 6. Betweenness centrality change map of residential land prices in Hebei province.
Network density was used to measure tightness of the overall spatial network structure of residential land prices in Hebei Province. A high-density network will have a greater impact on the counties and districts in the region, and the flow of resource elements will be more active. As shown in Figure 7, from a numerical point of view, the network density value of residential land price in Hebei Province was low overall. From 2013 to 2020, the network density ranged between .1614 and .1663, indicating that the spatial network connection of residential land prices in the counties and districts of Hebei Province was weak. Over time, the network density value showed an upward trend, increasing from .1614 in 2013 to .1663 in 2020. This indicated that since 2013, the links among residential land price activities between counties and districts in Hebei Province had gradually increased. The network correlation coefficient reflected the robustness and vulnerability of the spatial network itself. The number of network relationships increased from 4527 in 2013–4665 in 2020, and the network structure gradually became more robust.
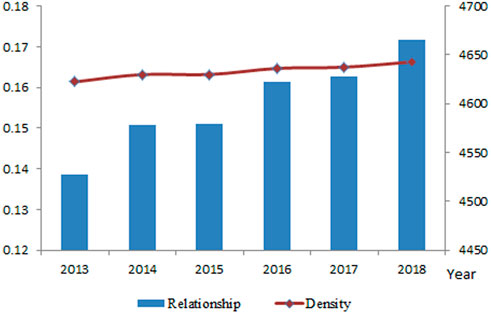
FIGURE 7. Spatial network density and changes in the correlation coefficient.
This study divided four agglomerate subgroups with the help of social network analysis tools. Agglomerate subgroups have distinct hierarchical structure and significant geographical proximity, as shown in Figure 8. The number of counties and role attributes included in the subgroups are shown in Table 9. The number of association relationships between county nodes within the four subgroups was high. The correlation coefficients of subgroup1 to subgroup4 were 830, 884, 893, and 683, respectively. The number of internal county nodes was 43, 41, 48, and 36, respectively. Owing to the change in the relationship among residential land prices between counties, the counties included in the subgroup also changed. The strength of the relationship between the sending and receiving counties in subgroup1 was 1402 and 1290, and the ratio of the expected to actual internal relationship was .25 and .64. The strength of the relationship between the sending and receiving counties in subgroup3 was 1408 and 1312, and the ratio of the expected to actual internal relationship was .28 and .68. Both subgroup1 and subgroup3 reflected the fact that the actual internal relationship ratio was greater than the expected internal relationship ratio, the ratio of the sending to receiving relationship was the ratio of the sending to receiving relationship was more than 1. Therefore, both subgroup 1 and 3 reflected counties that showed a mutual spillover effect in the residential land price space network, and they played both an external connection role for other subgroups in the residential land price network. The intensity of the correlation between the sending and receiving association of subgroup2 was 1005 and 1211, and the ratio of the expected to actual internal relationship was .24 and .73. The intensity of the correlation between the sending and receiving association of subgroup 4 was 850 and 852, and the ratio of the expected to actual internal relationship was .21 and .80. Subgroups 2 and 4 reflected the fact that the ratio of the sending to receiving relationship was the ratio of the sending to receiving relationship was less than 1. Therefore, both subgroup 2 and subgroup 4 were net beneficiary counties, receiving a higher proportion of the radiation effect of residential land prices.
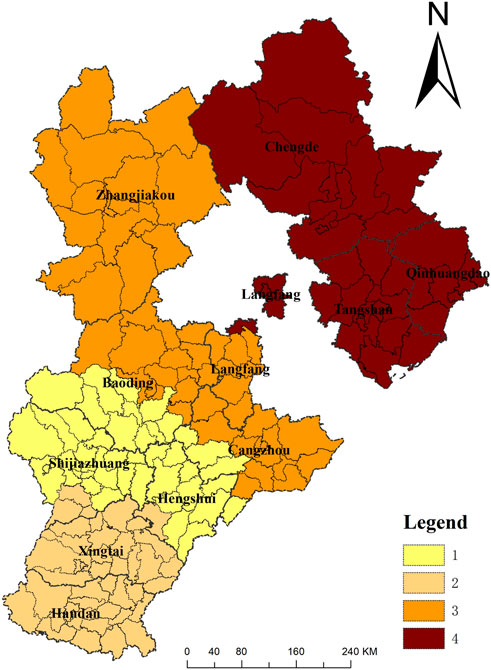
FIGURE 8. Spatial network cohesion subgroup map.
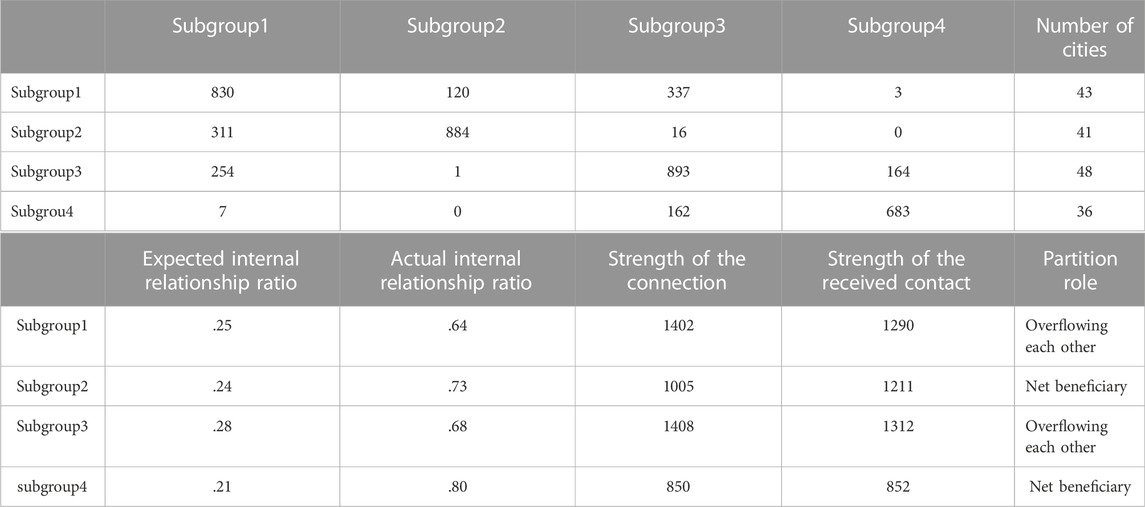
TABLE 9. The relationship and role of subgroups in the residential land price spatial network.
There was a significant spatial autocorrelation between counties in Hebei Province. The change of the residential land price within a county was not only constrained by the existing local conditions, but also by the land price of adjacent counties. Owing to the influence of various factors such as resource endowment, policy measures, and facility conditions, there was a distinct spatial heterogeneity in residential land prices among counties. High–High clusters involved five counties in Langfang, two counties in Baoding, one county in Cangzhou, and six counties in Shijiazhuang. Most of the High–High cluster counties in Langfang, Baoding and Cangzhou were adjacent to Beijing and Tianjin, with pronounced regional advantages. These cities were within a 1 h radius of Beijing and Tianjin, and they had strong economic influence from Beijing and Tianjin. They also received policy dividends from the provincial capital city; the land transfer price was higher; they were closely connected with surrounding counties, and there was a significant spatial correlation effect. High-High cluster counties in Shijiazhuang were mostly downtown counties. Shijiazhuang is the political, economic, scientific, technological, financial, cultural, and information center of Hebei Province and is also an important central city in the Beijing-Tianjin-Hebei region of China. After years of development, Shijiazhuang has accumulated significant advantages. In 2020, Shijiazhuang had a permanent population of 11.24 million, ranking first in the province, with a GDP of 593.51 billion yuan, ranking third in the province. The large population, abundant capital, convenient transportation system, and complete infrastructure allowed the real estate market in this area to develop to a high degree, and the residential land price in the central area formed a “convex area.” Low-Low cluster counties involved one county in Chengde, two counties in Zhangjiakou, three counties in Baoding, two counties in Shijiazhuang, one county in Hengshui, eight counties in Xingtai, and three counties in Handan. Low-Low cluster counties in Chengde, Zhangjiakou, Baoding and Shijiazhuang were mostly located in the ecological conservation areas of Yanshan and Taihang Mountains. These counties were located in mountains and hills, and the complex terrain conditions restricted the urban construction and development to a certain extent. The disadvantages of inconvenient transportation, low land grade, and weak urban competitiveness finally led to low activity of the real estate market and low overall residential land prices. Low-Low cluster counties in Hengshui, Xingtai, and Handan were located in the plain area of southern Hebei Province. Most of these counties were poor, with weak resources and technical strengths. They were far from the city centers and had weak radiation and driving effects from developed counties. Low economic level and location disadvantage were the main reasons for the slow development of the real estate market and low residential land prices in these counties.
Owing to the existence of spatial correlation, the influencing factors of residential land price also showed a significant spatial effect. However, there were important differences among the influencing factors on the residential land price and its spatial correlation effect. The direct effect and spillover effect reflected the internal mechanism of different influencing factors on the residential land price, which were important in analyzing the trend of the housing land market.
According to the results, the per capita disposable income, average salary of employees, resident deposit savings, new residential building area, and population density indicators had a significant positive impact on residential land prices in the region, of which per capita disposable income had the largest impact on residential land prices. This conclusion was similar to the research results of ZHOU (Zhou et al., 2019). ①The per capita disposable income reflected the purchasing power of residents, while the average salary of employees and resident deposit savings reflected the living standard of residents. The stronger the residents’ purchasing power and living standard, the stronger the residents’ demand for real estate (including rigid demand and improvement demand) and the greater the competition in land transactions, which led to the rise of residential land prices. In addition, the above three indicators reflected the social and economic development level of a region from the perspective of residents’ living conditions. Higher social and economic development level is usually accompanied by higher local financial income, more rapid urban development, and greater real estate development investment scale that are the main reasons for the positive interaction between these three indicators and residential land prices. ②The driving effect of new residential building on residential land prices was related to the dependence of local governments on land finance in recent years. The increase of residential building area means the increase of residential land. In theory, the increase of residential land can effectively meet the vigorous demand for real estate, alleviate the contradiction between supply and demand, and thus play a role in restraining or stabilizing land prices. However, in recent years the “land finance” model has been an important means for Chinese local governments to accumulate urban capital and promote urbanization and economic development. In this mode, the increase of residential land could meet the capital needs of local governments for infrastructure and public facilities construction, stimulate infrastructure construction, improve urban environment, and also increased the competition of real estate developers for land purchase and the expectations of consumers for housing purchase, which would drive the increase of land transfer prices. ③The driving effect of population density on residential land price was the specific performance of market supply and demand mechanisms. The population density reflected the relationship between the land quantity and the potential land demand of the population. The coordinated development of residential land and population change could stabilize the land price. In a certain period of time, the increase in population density would bring about an imbalance between supply and demand, leading to an increase in housing demand and thus driving up land prices.
According to the results, the average salary of employees, urban road area per capital, taxes, and new residential building area had significant positive spillover effects on residential land prices in nearby areas, among which the average salary of employees had the greatest impact. However, residents’ deposit savings had a significant negative spillover effect on residential land prices in nearby areas. ①Higher average salaries of employees could not only increase residents’ local demand for housing but also increase residents’ desire to buy houses in nearby areas. Especially under the background of strict regulation and control policies in some cities, developers were willing to bid for land at a higher price in anticipation of the flow of housing demand sand thus the land price in nearby areas would rise. ②With the improvement of traffic facilities and convenience, people had more ways of commuting, shorter commuting times, and wider choice of residence. People tended to consider neighboring regions with better living environments and infrastructure, and this increased the demand for residential land in surrounding counties to a certain extent and promoted the rise of residential land prices. ③Taxes were closely related to residents’ living pressures, and an increase in residents’ living pressures directly affected the choice of real estate. When the real estate price within a particular county was relatively high, the availability of housing land in surrounding counties with a relatively low residential land price was able to ease the pressures of life, thereby driving an increase in the residential land prices in the surrounding counties. ④Increased areas of new housing also drove the residential land prices in the surrounding areas. The reason might be that under the background of cooperation and competition between counties, the increase of new residential building area had a certain “demonstration effect”. The increase of residential building area in a certain county might prompt the neighboring county governments to take similar actions, increase the supply of residential land, and thereby increased the pace of real estate development. Therefore, when the real estate development in some counties was strong, it would spill over to the neighboring counties through the expectation of the market development, causing the residential land prices in the neighboring areas to rise. ⑤Residents’ deposit savings had a certain degree of inhibition on neighboring areas. Different from the per capita disposable income, the increase of residents’ deposit savings indicated the decline of residents’ consumption ability, and the residents’ enthusiasm for purchasing or consuming in other places was reduced when the local living conditions were met; this reduced the pace of the real estate market in nearby areas to a certain extent, thus playing a role in curbing the rise of residential land prices.
After decomposing the spatial effect of the residential land price, it was found that the counties were connected through a number of influencing factors. This expanded the linkage in the residential land price among different counties and formed a closely related spatial network. Counties differed in geographical location, economic level, and resource conditions, and they played different roles in the allocation of land resources over the entire region.
Counties with a high degree centrality had a strong radiation and guidance role in the spatial network owing to their advantages of location and development level. These counties could achieve coordination and interaction with other county nodes and easily attract the inflow of economic and resource factors from surrounding counties. The inflow of economic and resource elements from the surrounding counties showed the Matthew effect of accumulated advantage. In 2013, the central high-value counties were mainly distributed in the central urban areas of Langfang, Shijiazhuang, and Baoding. Counties of Langfang and Baoding made full use of resources from the integration of Beijing-Tianjin-Hebei by virtue of its proximity to Beijing and Tianjin and thus developed rapidly. Shijiazhuang, as the capital of Hebei Province, played the role of “the third pole” in the coordinated development of Beijing, Tianjin, and Hebei. According to the data of China Land Price Information Service Platform, in 2013 the residential land prices of Langfang, Shijiazhuang and Baoding were 3059 yuan/m2, 2245 yuan/m2 and 2441 yuan/m2 respectively, prices that were among the top cities in Hebei Province. Under the effect of price leverage, the surrounding labor, capital, and other land production factors of these three cities were concentrated in the center of the city. The good scale efficiency had promoted them to form the economic development pole and land price radiation center in Hebei Province. With the in-depth implementation of the coordinated development of Beijing, Tianjin, and Hebei, Beijing’s industrial transfer had promoted the economic development and residential land prices of Cangzhou, Hengshui, Xingtai and other cities in central Hebei Province. The data showed that from 2013 to 2020, the GDP growth rates of Cangzhou and Hengshui were 31.58% and 51.85% respectively, and the residential land price growth rates were 9.12% and 9.62% respectively, both of which were in the forefront of Hebei Province. The rapid economic growth had promoted the development of the land market, and these two cities had gradually formed a secondary radiation center of land prices in central Hebei Province. From the perspective of the distribution pattern of central high-value counties, the spatial network structure of residential land price in Hebei Province had gradually evolved from the decentralized central nodes dominated by Langfang, Shijiazhuang, and Baoding central areas in 2013 to a network-like central node group dominated by Langfang, Shijiazhuang, Baoding, Cangzhou, and Hengshui central areas in 2020. The change in the spatial network was manifested in the conduction process starting from the central city, a pattern that conformed to the central characteristics of the ripple effect. Under the radiation of the above urban centers, more counties had gradually played leading roles in the residential land price spatial network. The peripheral cities of Hebei Province lacked important central nodes in the network structure, and there were distance barriers from important central nodes. For example, Kangbao of Zhangjiakou, located in the northern part of Hebei Province, was at the edge of the spatial network, far from important economic centers, and it lacked central city nodes to participate in the connection. It was weakly driven by the radiation of cities with a high level of development, and the speed of reflection and regulation of land price information was slow.
The betweenness centrality of residential land prices in Hebei Province also rose overall, and the connection between counties was gradually smooth. Similar to the distribution pattern of degree centrality, the counties with high betweenness centrality were largely distributed in Shijiazhuang, Baoding, and Langfang in 2013. These counties not only had a strong ability to mobilize the land production factors of their own counties in the network structure but also showed a strong “bridge” role with high transmission capacity, becoming important media driving the connection between counties. In 2020, the structure of the spatial network changed from a single center with a scattered distribution to a multi-intermediary center with a centralized distribution. Two secondary intermediary centers of the network formed in Cangzhou central urban area and Hengshui central urban area. From 2013 to 2020, the number of counties with betweenness centrality above 300 increased from 7 to 14. More counties played important roles in land price transmission. Land prices between counties became more closely related. Superior geographical location and convenient transportation provided better conditions for the contact and cooperation between counties and in the middle of Hebei Province. Influenced by the Beijing Tianjin radiation, Langfang’s socio-economic and land market changes were more sensitive, and it had become an important city node to transmit Beijing radiation and guide land price changes in Baoding and surrounding counties. Cangzhou had the regional advantage of being close to Tianjin and had become an important city node to transmit Tianjin’s radiation and guide the land price of surrounding counties. As the city with the strongest economic strength and the most mature land market in Hengshui’s surrounding cities, Shijiazhuang naturally became the most attractive city for Hengshui’s land prices. The present study found that in the spatial connection network structure of land prices in central Hebei, Shijiazhuang, Hengshui, and Cangzhou, the three central node cities were basically consistent with the Shijiazhuang-Hengshui-Cangzhou-Huanghua port intercity railway station cities currently planned and constructed in Hebei Province. This indicated that the results were in line with the current planning of the Chinese government on road network construction and promoting the coordinated development of Beijing-Tianjin-Hebei urban agglomeration industries.
The spatial network density of residential land prices in the counties and districts of Hebei Province slowly increased from 0.1614 in 2013 to 0.1663 in 2020. The overall network structure had some weak connection characteristics, and there was still room for improvement in the degree of spatial correlation. The transmission role of node cities in the process of spatial network development constantly increased. The number of network associations increased to 4,665 in 2020, reaching a peak, and the closeness of connections between cities was still improving. The increase of network density value year by year benefited from the evolution of land price multi-core structure. The spatial correlation network of residential land price in Hebei Province gradually evolved from the initial three core to five core driven evolution, and the position of the five core growth poles tended to be stable. In particular, the formation of Cangzhou and Hengshui, two intermediary central nodes, had gradually changed the relationship between counties in the province from unbalanced to relatively balanced. This trend was conducive to the full flow of land resource elements in the network and the benign interaction between different nodes. The increase in the number of network relations reflected the stability and reconstruction of the overall network structure. With the changes in the land market level, industrial development, and policy mechanism of each city, Hebei Province is likely to realize the new pattern of reconstruction and optimization, and the spatial network connection and interaction of residential land prices in the region may be more frequent.
The distribution of subgroups had a strong correlation with the geographical location and policy environment of each county. The counties with similar geographical location and policy environment had frequent economic exchanges, and the residential land markets had close exchanges and cooperation that made it easier to combine into urban subgroups. Subgroup 1 was composed of Shijiazhuang and Hengshui counties, as well as the southern counties of Baoding and Cangzhou. Subgroup 3 was composed of Zhangjiakou counties, including the counties in the north of Baoding and Cangzhou and the counties in the south of Langfang. Subgroups 1 and 3 occupied the core position in the network. The land market environment of counties included in these two subgroups was superior. They were not only closely related internally but also displayed strong spillover effects, and they had close external communication with other subgroups. However, the close relationship between counties in subgroup 1 was weaker than that in subgroup 3, and thus it was necessary for subgroup 1 to accelerate its development and promote the coordinated improvement of economic strength and network status. Subgroup 2 was composed of Xingtai and Handan counties and also included a few counties in the south of Shijiazhuang and Hengshui. Subgroup 4 comprised Chengde, Qinhuangdao, and Tangshan counties, including the counties in the north of Langfang. Subgroups 2 and 4 played the role of edge subgroups. Their internal structure was relatively loose, and their interactions with other subgroups were insufficient, and thus the network edge risk was high. On the one hand, the diffusion effect of land factor marketization in Xingtai, Handan, Chengde, Qinhuangdao, Tangshan, and other cities was weaker than its siphon effect. On the other hand, these two subgroups lacked important central nodes and were spatially separated from the existing central nodes. Therefore, it was necessary to accelerate the cultivation and construction of more growth poles in subgroups 2 and 4, promote the orderly development of the land market pattern of the residential land price spatial correlation network in Hebei Province, and enhance the dual driving role of the center and the network.
Accurately identifying the correlation characteristics of urban residential land prices in the region will help improve the pertinence of regulatory measures. According to the research results, we put forward suggestions on regional land price regulation measures from three aspects:
First, we should explore the market regulation policy of differentiated residential land and build a city cluster with coordinated land price development. In view of the unbalanced development of residential land prices in Hebei Province, the government should consider the economic development status, functional positioning, leading industries, and land price differences of each city and customize development strategies for each city. For the central cities (Langfang, Shijiazhuang, and Baoding) with rapidly rising land prices, we can adjust and control the land demand by rationally allocating new construction land, activating the use of idle land, and optimizing the financial credit policy for residential land to ensure the healthy and stable development of the residential land market. For marginal cities (Chengde, Zhangjiakou, Qinhuangdao, and Handan) and mountainous counties where land prices are rising slowly, we should give full play to the advantages of ecological resources, improve the income level of residents by vigorously developing distinctive economies, strengthen economic cooperation among counties by improving transportation networks, and guide superior real estate enterprises and high-end technical talents to settle in through policies such as taxation, finance, and talent incentive plans to realize the balanced development of residential land prices in central cities.
Second, we should accelerate the optimization of residential land price network structure and strengthen the role of the network. On the one hand, we can further enhance the core leading function of the leadership subgroups in the network and enhance its radiation effect through the external transfer of the existing central city land elements. Subgroup 1 and Subgroup 3 should give play to their interconnection advantages and continue to build Cangzhou and Hengshui as two intermediary centers, actively playing the role of outward connection while undertaking Beijing’s industrial transfer and driving the development of marginal subgroups by establishing long-term cooperation mechanisms such as talent exchange and industrial coordination. On the other hand, edge subgroups should strengthen external connections, focus on cultivating potential network centers, and reduce network edge risks. Subgroup 2 focuses on cultivating Xingtai as the intermediary center, creating a “Shijiazhuang-Xingtai-Handan” connecting channel to radiate around the counties; Subgroup 4 focuses on the construction and cultivation of Tangshan as the intermediary center and creates a “Qinhuangdao-Tangshan-Chengde” connecting channel to radiate to surrounding counties. By creating more growth poles, we will promote the orderly development of the network pattern and the communication ability between subgroups.
Third, Hebei Province should not only promote the network of the internal land market of the urban agglomeration but also actively build the external network of coordinated development. This province can play an important role in the national important strategy of “Beijing-Tianjin-Hebei coordinated development.” On the one hand, more dense transportation lines should be built within Hebei Province, making it easier to connect the weak areas with the core cities. We can try to make the marginal cities such as Zhangjiakou, Chengde, Qinhuangdao, Handan, Beijing, and Tianjin have greater contact. On the other hand, we can accelerate the integration of the Beijing-Tianjin-Hebei land factor market. In the process of formulating the land space planning, the three areas of Beijing, Tianjin, and Hebei should break the situation of separate administration to organically connect the resources and guide reasonable competition among the cities by perfecting the construction of the land price information network platform in order to realize the coordinated and healthy development of the land market.
By exploring the spatial correlation effect of residential land prices in counties of Hebei Province and the characteristics of spatial network structure, this study reached the following conclusions:
1) There was a significant spatial correlation effect of residential land prices between counties in Hebei Province. First, the regional residential land price level has significant global spatial autocorrelation and local autocorrelation. High-High clusters were mainly concentrated in cities around Beijing and Tianjin and provincial capitals, while Low-Low clusters were mostly distributed on the central and southern Hebei. Second, the residential land price changes in adjacent counties will produce interactive linkage, which is manifested in the form of simultaneous increase and decrease. The residents’ purchasing power, the socioeconomic level, and the land resources have a significant impact on the residential land price of the county itself, while the level of infrastructure, and the policy environment have a significant impact on the residential land price of neighboring counties.
2) The centrality of residential land price in central counties of Hebei Province was generally high, and showed a trend of agglomeration. The spatial network characteristics of residential land prices were mainly manifested in the conduction process starting from the central county, which conformed to the centrality characteristics of the ripple pattern. However, the peripheral cities of Hebei Province lacked important central nodes in the network structure, and the risk of land price development marginalization was high. The betweenness centrality of residential land prices in counties around Beijing and Tianjin and provincial capital cities was generally high. The betweenness centrality of counties had evolved into a multi-core structure. More and more counties showed the role of “bridges” with transmission characteristics, and the balance of the entire regional land price network had been constantly improved.
3) The spatial network connection of residential land prices in the counties of Hebei Province was weak, but the network density was slowly increasing, and there was a large space to improve the tightness of spatial connection. The counties in Hebei Province can be divided into four subgroups, among which the residential land prices of provincial capital cities and surrounding counties (subgroup1), southern Hebei counties (subgroup2), and counties around Beijing and Tianjin (subgroup3) had a good interaction relationship. The residential land prices of subgroup1 and 3 played an important role in conducting the spatial network, while subgroup 2 and 4 had less interaction with other subgroups. The government departments should implement the integrated development strategy based on the overall functional orientation of Hebei, the development foundation and potential of each city, and realize the coordinated development of the whole region.
There may be a major limitations in this study. Due to the lack of data, this study did not consider the two cities of Beijing and Tianjin, and only focused on Hebei Province. The higher land price level and stronger economic radiation capacity in Beijing and Tianjin may have an impact on the structure of residential land price network in Hebei Province. The study in the Beijing-Tianjin-Hebei region may make the conclusion more scientific and valid, which is also the direction of the authors’ follow-up research.
Publicly available datasets were analyzed in this study. This data can be found here: http://landchina.mlr.gov.cn/.
Conceptualization and writing: CL and ZF; methodology and software: WW; data acquisition: CZ and PA; and analysis and interpretation of data: YD. All authors contributed to the article and approved the submitted version.
This research was funded by Chinese National Science Foundation (No. 41471090), Hebei Province National Science Foundation (No. H16028), Science Foundation of Hebei Normal University (No. L2021B29).
The authors declare that the research was conducted in the absence of any commercial or financial relationships that could be construed as a potential conflict of interest.
All claims expressed in this article are solely those of the authors and do not necessarily represent those of their affiliated organizations, or those of the publisher, the editors and the reviewers. Any product that may be evaluated in this article, or claim that may be made by its manufacturer, is not guaranteed or endorsed by the publisher.
Anselin, L., Bera Anil, K., Raymond, F., and Yoon, M. J. (1996). Simple diagnostic tests for spatial dependence. Regional Sci. urban Econ. 26 (1), 77–104. doi:10.1016/0166-0462(95)02111-6
Bacău, S., Grădinaru, S. R., and Hersperger, A. M. (2020). Spatial plans as relational data: Using social network analysis to assess consistency among Bucharest’s planning instruments. Land Use Policy 92, 104484. doi:10.1016/j.landusepol.2020.104484
Chai, N., Stevens, R., Fang, X., Mao, C., and Wang, D. (2019). The impact of compensation upon urban village residents satisfaction with the land expropriation process. China. Int. J. Law Built Environ. 11, 186–216. doi:10.1108/JPPEL-03-2019-0011
Cheng, D., Jing, L., and Peng, S. (2020). Research on the test and model of trans-regional interaction among urban housing price. Constr. Econ. 41 (04), 101–105. doi:10.14181/j.cnki.1002-851x.202004101
Davis, M. A., and Palumbo, M. (2008). The price of residential land in large US cities. SSRN J. 63 (1), 352–384. doi:10.2139/ssrn.943771
Elias, O. (2006). The diffusion of housing price movements from center to surrounding areas. J. Hous. Res. 15 (1), 3–28. doi:10.1080/10835547.2004.12091958
Feng, J. L., and Tian, P. C. (2011). Validity analysis of maximum entropy distribution based on different moment constraints for wind energy assessment. Energy 36, 1820–1826. doi:10.1016/j.energy.2010.11.033
Fu, N. (2021). Innovation efficiency and the spatial correlation network characteristics of intelligent-manufacturing enterprises. Complexity 2021, 1–15. doi:10.1155/2021/4299045
Gan, C., Voda, M., Wang, K., Chen, L., and Ye, J. (2021). Spatial network structure of the tourism economy in urban agglomeration: A social network analysis. J. Hosp. Tour. Manag. 47, 124–133. doi:10.1016/j.jhtm.2021.03.009
Gan, W., and Huo, X. (2016). Study on the measures of land factor market integration in beijing Tianjin hebei—from the perspective of supply side structural reform. People's Trib. 14, 215–217. doi:10.16619/j.cnki.rmlt.2016.14.070
Glumac, B., Herrera-Gomez, M., and Licheron, J. (2019). A hedonic urban land price index. Land Use Policy 81, 802–812. doi:10.1016/j.landusepol.2018.11.032
Griffin, T., Gregg, I., and Mark, T. (2015). How spatially clustered are state-level farmland values? J. ASFMRA 2015, 103–112. doi:10.22004/ag.econ.235188
Gyourko, J., and Jacob, K. (2021). The impact of local residential land use restrictions on land values across and within single family housing markets. J. Urban Econ. 126, 103374. doi:10.1016/j.jue.2021.103374
Han, J., Jin, X., Zhang, Z., Sun, W., Xu, X., and Zhou, Y. (2017). Development characteristics and FactorsAnalysis of residential land price in China. Sci. Geogr. Sin. 37 (04), 573–584. doi:10.13249/j.cnki.sgs.2017.04.011
Harris, R., Dong, G., and Zhang, W. (2013). Using contextualized geographically weighted R egression to model the spatial heterogeneity of land prices in beijing, China. Trans. GIS 17, 901–919. doi:10.1111/tgis.12020
Hu, S., Yang, S., Li, W., Zhang, C., and Xu, F. (2016). Spatially non-stationary relationships between urban residential land price and impact factors in Wuhan city, China. Appl. Geogr. 68, 48–56. doi:10.1016/j.apgeog.2016.01.006
Huang, Z., and Du, X. (2021). How does high-speed rail affect land value? Evidence from China. Land Use Policy 101, 105068–8. doi:10.1016/j.landusepol.2020.105068
Huang, F., Zhou, J., Li, Z., and Hou, T. (2009). Relationships effect among housing prices of Chinese big cities based on cointegration and vector error correction model. China Manag. Stud. 4 (2), 122–142.
Huang, Z., Li, S., and Du, X. (2022). Spatial-temporal pattern and influence mechanism of urban land prices under the integrated development of the yangtze river delta. China Land Sci. 36 (02), 53–62. doi:10.11994/zgtdkx.20220117.095034
Jiang, R., George, C., and Lin, S. (2021). Placing China’s land marketization: The state, market, and the changing geography of land use in Chinese cities. Land Use Policy 103, 105293. doi:10.1016/j.landusepol.2021.105293
Juethe, T. H., and Pede, V. O. (2011). Regional housing price cycles: A spatio-temporal analysis using us state-level data. Reg. Stud. 45 (5), 563–574. doi:10.1080/00343400903497897
Kheir, N., and Boris, A. P. (2016). Economic, demographic and environmental factors affecting urban land prices in the Arab sector in Israel. Land Use Policy 50, 518–527. doi:10.1016/j.landusepol.2015.08.031
Lesage, J. P., and Pace, P. K. (2009). Introduction to spatial economics [M]. Boca Raton: Press Taylor and Francis Group, 66–71.
Li, C., Wu, J., Xi, Z., and Zhang, W. (2021). Farmers’ satisfaction with land expropriation system reform: A case study in China. Land 10, 1353. doi:10.3390/land10121353
Liang, J., Wen, S., and Fang, J. (2015). The spatial economic association of city agglomeration on CAFTA based on the perspective of social network analysis. Sci. Geogr. Sin. 35 (05), 521–528. doi:10.13249/j.cnki.sgs.2015.05.002
Liu, H., Yuan, M., and Ma, J. (2019). Spatial distribution of influence factors of residential land price in Cangzhou city based on GWR model. IOP Conf. Ser. Earth Environ. Sci. 332 (2), 022032. doi:10.1088/1755-1315/332/2/022032
Liu, Y., Gao, H., Cai, J., Lu, Y., and Fan, Z. (2022). Urbanization path, housing price and land finance: International experience and China’s facts. Land Use Policy 113, 105866. doi:10.1016/j.landusepol.2021.105866
Liu, Z., and Chen, Z. (2013). Spatial correlation, influencing factors and pass-through effect of urban housing prices: An empirical research based on regional market relation. J. Shanghai Univ. Finance Econ. 15 (05), 81–88. doi:10.16538/j.cnki.jsufe.2013.05.007
Luo, Y., Zhou, D., Tian, Y., and Jiang, G. (2021). Spatial and temporal characteristics of different types of pollution-intensive industries in the Beijing-Tianjin-Hebei region in China by using land use data. J. Clean. Prod. 329, 129601. doi:10.1016/j.jclepro.2021.129601
Ma, W., Jiang, G., Chen, Y., Qu, Y., Zhou, T., and Li, W. (2020). How feasible is regional integration for reconciling land use conflicts across the urban–rural interface? Evidence from beijing–tianjin–hebei metropolitan region in China. Land Use Policy 92, 104433. doi:10.1016/j.landusepol.2019.104433
Meen, G. (1999). Regional house prices and the ripple effect: A new interpretation. Hous. Stud. 14 (6), 733–753. doi:10.1080/02673039982524
Nilsson, P. (2014). Natural amenities in urban space: A geographically weighted regression approach. Landsc. Urban Plan. 121, 45–54. doi:10.1016/j.landurbplan.2013.08.017
Niu, F., Xin, Z., and Sun, D. (2021). Urban land use effects of high-speed railway network in China: A spatial spillover perspective. Land Use Policy 105, 105417. doi:10.1016/j.landusepol.2021.105417
Okamoto, C., and Sato, Y. (2021). Impacts of high-speed rail construction on land prices in urban agglomerations: Evidence from Kyushu in Japan. J. Asian Econ. 76, 101364. doi:10.1016/j.asieco.2021.101364
Peng, S-H., Jing, L-L., Zhang, M, Cheng, D-P., and Wu, Q. (2019). Study on the mode and spillover effect of interaction influence of local government land transfer. China Population, Resources and Environment. 29 (08), 156–167.
Pollakowski, H. O., and Ray, T. S. (1997). Housing price diffusion patterns at different aggregation levels: An examination of housing market efficiency. J. Hous. Res. 8 (1), 107–124. Available at: https://www.jstor.org/stable/24833634.
Shen, Y., and Karimi, K. (2017). The economic value of streets: Mix-scale spatio-functional interaction and housing price patterns. Appl. Geogr. 79, 187–202. doi:10.1016/j.apgeog.2016.12.012
Sohn, K. (2014). Identifying the impact on land prices of replacing at-grade or elevated railways with underground subways in the seoul metropolitan area. Urban Stud. 51 (1), 44–62. doi:10.1177/0042098013484543
Song, J., Jin, X., Tang, J., Zhang, Z., Ding, N., Zhao, J., et al. (2011). Analysis of influencing factors for urban land price and its changing trend in China in recent years. Acta Geogr. Sin. 66 (08), 1045–1054. doi:10.11821/xb201108004
Song, J., Jin, X., and Tang, J. (2011). Analysis of influencing factors or urban land price and its changing trend in China in recent years. Acta Geogr. Sin. 66 (08), 1045–1054. doi:10.1007/s12182-011-0124-2
Song, M., Xie, Q., and Chen, J. (2022). Effects of government competition on land prices under opening up conditions: A case study of the huaihe river ecological economic belt. Land Use Policy 113, 105875. doi:10.1016/j.landusepol.2021.105875
Stephen, M. (1999). A simple error correction model of house prices. J. Hous. Econ. 8 (01), 27–62. doi:10.1006/jhec.1999.0240
Tsai, I-C. (2018). Housing price convergence, transportation infrastructure and dynamic regional population relocation. Habitat Int. 79, 61–73. doi:10.1016/j.habitatint.2018.07.004
Tu, Y. (2000). Segmentation of Australian housing markets: 1989–98. J. Prop. Res. 17 (4), 311–327. doi:10.1080/09599910010001420
Wang, S., Yang, Z., and Liu, H. (2008). An empirical study on the interaction of urban housing prices in China's regional market. Res. Financial Issues (06), 122–129. doi:10.19654/j.cnki.cjwtyj.2008.06.020
Wang, S., Wang, Y., Lin, X., and Zhang, H. (2016). Spatial differentiation patterns and influencing mechanism of housing prices in China: Based on data of 2872 counties. Acta Geogr. Sin. 71 (08), 1329–1342. doi:10.11821/dlxb201608004
Wang, C., Liu, H., and Zhang, M. (2020). Exploring the mechanism of border effect on urban land expansion: A case study of beijing-tianjin-hebei region in China. Land Use Policy 92, 104424. doi:10.1016/j.landusepol.2019.104424
Xia, H., Li, C., Zhou, D., Zhang, Y., and Xu, J. (2020). Peasant households’ land use decision-making analysis using social network analysis: A case of tantou village, China. J. Rural Stud. 80, 452–468. doi:10.1016/j.jrurstud.2020.10.023
Xu, J., Huang, D., He, Z., and Zhu, Y. (2020). Research on the structural features and influential factors of the spatial network of China’s regional ecological efficiency spillover. Sustainability 12, 3137. doi:10.3390/su12083137
Zeng, C. (2019). Spatial spillover effect on land conveyance fee—a multi-scheme investigation in wuhan agglomeration. Land Use Policy 89, 104196. doi:10.1016/j.landusepol.2019.104196
Zhan, H., Zhan, H., and Wu, Q. (2011). Spatial autocorrelation analysis of urban land price in jiangsu province. Statistics Decis. (20), 102–104. doi:10.13546/j.cnki.tjyjc.2011.20.040
Zhang, Q., Wang, X-Z., and Wang, C-Z. (2015). On spillover effect of Chinese Cities’House price fluctuation- based on DCC-MVGARCH model. J. Tibet Univ. 30 (04), 187–194. doi:10.16249/j.cnki.1005-5738.2015.04.029
Zhang, P., Hu, S., Li, W., Zhang, C., Yang, S., and Qu, S. (2021). Modeling fine-scale residential land price distribution: An experimental study using open data and machine learning. Appl. Geogr. 129, 102442. doi:10.1016/j.apgeog.2021.102442
Zhang, X., and Lin, R. (2015). Empirical study of short- term ripple effect of China's urban housing price. Finance Econ. (09), 132–140.
Zheng, X., Chen, X., and Yuan, Z. (2021). Exploring the spatial spillover effect of home purchase restrictions on residential land prices based on the difference-in-differences approach: Evidence from 195 Chinese cities. Land Use Policy 102, 105236. doi:10.1016/j.landusepol.2020.105236
Zhou, Y., and Tang, N. (2019). Effects of spillover effect and comparison effect on spatial correlation of urban land price. Geogr. Geo-Information Sci. 35 (02), 111–119. doi:10.3969/j.issn.1672-0504.2019.02.017
Zhou, Z-P., Qin, Z-Y., Zhao, S., and Chai, D. (2019). The spatial pattern, evolution characteristics and inflfluencing factors of land share in housing price in China: A spatial econometric analysis of 35 large and medium-size cities. China Land Sci. 33 (01), 40–48. doi:10.11994/zgtdkx.20181218.144450
Zhou, Y., Tang, N., and Wang, W. (2020). Influence of multidimensional closeness on strength and centrality of urban land price spatial correlation network. Areal Res. Dev. 39 (03), 65–69+82.
Zhu, C., Tang, Y., and Wu, Q. (2014). A study on the influence factors of the residential land price based on hedonic price model: Taking nanjing city as an example. Areal Res. Dev. 33 (03), 156–160.
Keywords: regional correlation effect, spatial network structure, social network analysis, residential land price, spatial econometric model
Citation: Li C, Wei W, Duan Y, Feng Z, Feng X, Zhu C and An P (2023) Exploration of the regional correlation and network structure characteristics of land prices: A case study of Hebei, China. Front. Environ. Sci. 10:1056042. doi: 10.3389/fenvs.2022.1056042
Received: 28 September 2022; Accepted: 05 December 2022;
Published: 04 January 2023.
Edited by:
Yiyun Chen, Wuhan University, ChinaReviewed by:
Chenxi Li, Xi’an University of Architecture and Technology, ChinaCopyright © 2023 Li, Wei, Duan, Feng, Feng, Zhu and An. This is an open-access article distributed under the terms of the Creative Commons Attribution License (CC BY). The use, distribution or reproduction in other forums is permitted, provided the original author(s) and the copyright owner(s) are credited and that the original publication in this journal is cited, in accordance with accepted academic practice. No use, distribution or reproduction is permitted which does not comply with these terms.
*Correspondence: Can Li, bGljYW4zMDA4QDEyNi5jb20=; Zhongjiang Feng, ZmVuZ3pob25namlhbmdAMTYzLmNvbQ==; Xiaomiao Feng, ZmVuZ3htMDMxMEAxMjYuY29t
Disclaimer: All claims expressed in this article are solely those of the authors and do not necessarily represent those of their affiliated organizations, or those of the publisher, the editors and the reviewers. Any product that may be evaluated in this article or claim that may be made by its manufacturer is not guaranteed or endorsed by the publisher.
Research integrity at Frontiers
Learn more about the work of our research integrity team to safeguard the quality of each article we publish.