 Yijing Shang
 Weiwei Chen
 Qiuyang Bao2
 Xiaobing Pang
 Yanli Zhang
- 1Key Laboratory of Wetland Ecology and Environment, Northeast Institute of Geography and Agroecology, Chinese Academy of Sciences, Changchun, China
- 2Division of Atmospheric Environment, Jilin Provincial Academy of Environmental Sciences, Changchun, China
- 3Jilin Provincial Environmental Monitoring Centre, Changchun, China
- 4School of Environment, Zhejiang University of Technology, Hangzhou, China
- 5State Key Laboratory of Organic Geochemistry, Guangzhou Institute of Geochemistry, Chinese Academy of Sciences, Guangzhou, China
- 6College of Biological and Agricultural Engineering, Jilin University, Changchun, China
- 7Key Laboratory of Groundwater Resources and Environment, Jilin University, Changchun, China
As key precursors of tropospheric ozone (O3) pollution, volatile organic compound (VOC) pollution and related studies in China are mainly concentrated in developed regions or metropolises, while there are few studies on VOC pollution in the heavy industrial base in Northeast China. This study conducted a systematic survey of VOCs’ information for the first time in Jilin Province, covering eight prefecture-level cities, ten major industries (e.g., petrochemical, chemical), and 130 major factories, based on cruise monitoring for 2 months. The concentrations and compositions (i.e., 65 species) of VOC were measured in real-time. The emission characteristics of VOC, local source profiles, and the ozone formation potential (OFP) were further analyzed to support O3 pollution control in Northeast China. On the provincial scale, the concentrations of total VOC during the monitoring period ranged from 0.03 to 18321.5 μg/m3, and averaged at 607.9 ± 2051.8 μg/m3. Among the prefecture-level cities, Jilin City had the highest concentration level (1938.0 ± 3811.3 μg/m3) given the largest numbers of petrochemical factories, and the lowest level (85.5 ± 48.9 μg/m3) was found in Liaoyuan City. At the industrial scale, the highest (1915.2 ± 1842.6 μg/m3) was detected in the petrochemical industry with a major species of 1,1,2,2-tetrachloroethane. The lowest VOC emission concentration levels were found in the textile industry (57.8 ± 44.6 μg/m3; major species: xylene/ethylbenzene). Local source profiles in various industries were established, and normalized OFP of corresponding species was calculated, which are important parameters to evaluate the contribution of different VOC sources to O3 pollution. Combined with provincial industrial structure and future planning, we suggest two major industries including the chemical industry and petrochemical industry in Changchun City and Jilin City are prior to being optimized to reduce O3 pollution. This study contributes to the knowledge of the characteristics and source profiles of VOC emissions, providing an important reference for the management or control of O3 pollution in Northeast China.
Introduction
With the continuous acceleration of economic development and urbanization, air pollution problems, such as PM2.5 and O3 pollution, have become increasingly prominent. Although pollution levels of PM2.5 decreased, those of O3 are exacerbated (Wang et al., 2020c; Fang et al., 2020; Liu et al., 2020; Lu et al., 2020). The formation of ground-level O3 is inseparable from its precursor, volatile organic compounds (VOCs) and nitrogen oxides (NOx) (Ma et al., 2016). Due to the complex chemical mechanism of VOCs (Wang et al., 2013; Yan et al., 2019; Mohd Napi et al., 2020) and the non-linear relationships between O3 concentrations and precursors (Xing et al., 2011), the control of O3 pollution poses a significant challenge. Thus, a deep understanding of VOCs is necessary to develop corresponding strategies for O3 pollution in different regions.
VOCs refer to organic compounds that participate in atmospheric photochemical reactions. In addition to contributing to O3 formation, numerous species in VOCs are carcinogenic, teratogenic, and mutagenic to human health, which can cause chronic harm to the human central nervous system (Zhou et al., 2011; Zhu and Liu, 2014; Alabdulhadi et al., 2019). Because of these hazards, the control of VOC pollution has become an indispensable part of urban air quality and control measures (Wu et al., 2015).
In recent years, research on VOCs mainly focused on the following aspects. One is the chemical characteristics of VOCs and their contribution to O3 pollution. Rajabi et al. (2020) found that in the process of oil discharge, alkanes, such as hexane and pentane, are the high-detected compounds. Tiwari et al. (2010) reported that aromatics are the characteristic compounds of the petrochemical industrial area of Yokohama. Ku et al. (2021) claimed that alkenes make a significant contribution to the atmospheric VOCs in Shenyang City. The second aspect considers the source profiles (Zhang et al., 2013b; Zhong et al., 2017; He et al., 2020). The third aspect is the reaction mechanism of VOCs in the atmosphere, mainly the one oxidizing free radicals (Galano and Raúl Alvarez-Idaboy, 2008; Shen et al., 2013). The fourth aspect is the source apportionment of VOCs, where positive matrix factorization (PMF) is a commonly used method (Wei et al., 2019; Wang et al., 2020b). The fifth is the development of elimination technologies of VOCs. At present, low-temperature catalytic ozonation has good prospects (Liu et al., 2022), and low-temperature plasma catalytic degradation of VOCs is also among the more common methods (Bahri and Haghighat, 2014; Chang et al., 2020). Studies on the characteristics of VOCs are mostly conducted in densely populated and economically developed areas in China, such as North China and South China, while such studies are rarely conducted in Northeast China.
VOCs source profiles represent the composition pattern of species emitted from a specified source category. The establishment of the source profiles database provides an analytical basis for the targeted composition and provides a reference for numerical simulations. Due to various energy uses and industrial structures, there are significant differences in the sources of VOC pollution (Zhang et al., 2013a; Zhang et al., 2018). Therefore, the determination of VOCs source profiles is necessary for further control of local VOCs. The SPECIATE database is currently the most comprehensive source category-specific emission profile database established and integrated by the U.S. Environmental Protection Agency (EPA) (Simon et al., 2010). Many researchers have developed their own localized region source profiles, such as North America and West Africa (Garzon et al., 2015; Dominutti et al., 2019). However, the studies on VOCs source profiles were mostly concentrated around several megacities in China, such as the Beijing-Tianjin-Hebei (BTH), Yangtze River Delta (YRD), and Pearl River Delta (PRD) (Zhang et al., 2010; Xu et al., 2017; Guan et al., 2020). In addition to regional studies, there are also numerous studies on VOCs in fast-developing cities, such as Zhengzhou and Wuhan (Hui et al., 2020; Zhang et al., 2021). Although China has carried out studies on source profiles in various cities or agglomerations, there is still a lack of VOCs source profiles in Northeast China.
The purpose of this study is to: 1) Understand the emission background of VOCs in Jilin Province; 2) obtain the localized source profiles of VOCs. Taking Jilin Province as an example, we adopted cruise monitoring technology to measure the total VOCs concentration around 130 key factories in ten major VOC emission industries and obtained real-time monitoring data of 65 VOC species. Based on this information, we ascertained the background status of major VOC pollution, and identified industries that emit high levels of VOCs and compositions with greater OFP. We provide a complete set of VOC source profiles covering most industries and the OFP. The above provides an important scientific basis for the management and control of VOCs and numerical simulation in Jilin Province of Northeast China.
Materials and methodology
Study area
Northeast China is a major industrial and agricultural base in China, including three provinces, Liaoning, Jilin, and Heilongjiang. Among them, Jilin Province (40°50′N-46°19′N, 121°38′E-131°19′E) is located in the central part of Northeast China and has a temperate continental monsoon climate. The terrain shows evident characteristics of high southeast and low northwest (Figure 1). The total population is 26.9 million, and the area accounts for approximately 12.3% of Northeast China. There are eight prefecture-level cities (i.e., Changchun, Jilin, Siping, Tonghua, Baishan, Liaoyuan, Baicheng, and Songyuan) and one autonomous prefecture (i.e., Yanbian Korean Autonomous Prefecture). The proportion of forest land in Yanji City, the capital of Yanbian Prefecture, exceeds 70%, and it is an area dominated by forestry development. The provincial capital (i.e., Changchun) has China’s largest automobile manufacturing factories (Chen et al., 2017), and it is also a major transportation hub connecting North and South in Jilin Province with Siping. In addition, the petrochemical industry is mainly concentrated in Jilin. Therefore, a modern industrial system with relatively complete categories has been formed with the three pillar industries of automobiles, petrochemicals, and agricultural products processing, as well as the dominant industries of medicine and optoelectronics.
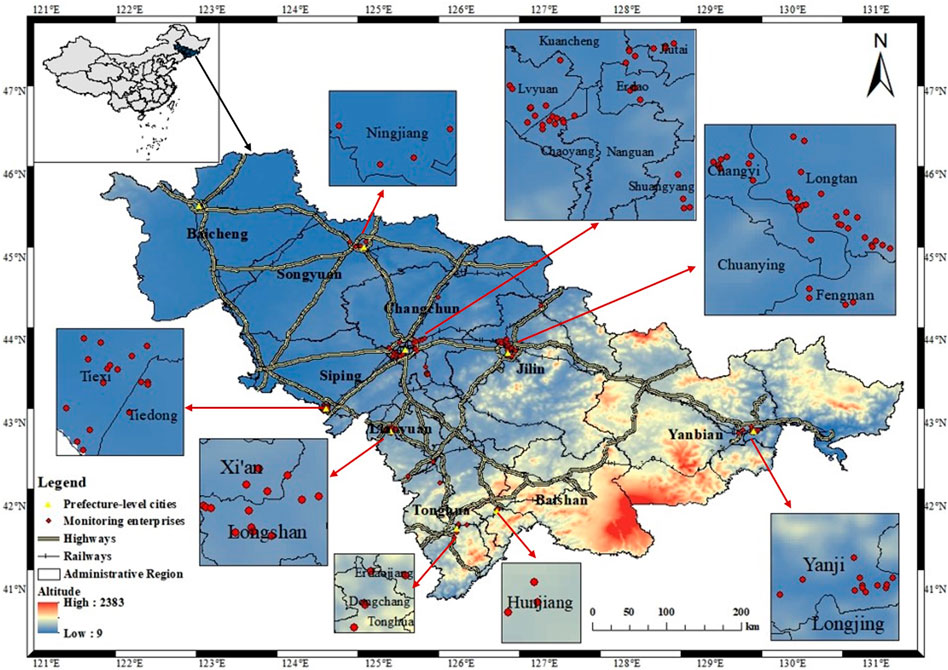
FIGURE 1. Topography and administration of Jilin Province. The spatial distribution of monitoring enterprises in each prefecture-level city. Yellow solid triangles represent prefecture-level cities; red solid circles represent monitoring enterprises; black solid lines depict the boundaries of city/county/district; the gradient color represents the altitude of Jilin province. Red solid lines point to the spatial distribution of monitoring enterprises in each prefecture-level city.
Equipment
VOCs online monitoring technology mainly includes the Fourier transform infrared (FTIR) spectrometer, proton transfer reaction mass spectrometry (PTR-MS), and single-photon ionization mass spectrometer (SPIMS) (Lian et al., 2020). SPIMS has the advantages of high sensitivity and low detection limits compared to traditional online monitoring techniques, but the disadvantages are that it cannot discriminate isomers and has limited measurement species.
In this study, SPIMS is selected with a time resolution of 5 s, which has the advantages of fast detection speed and high sensitivity. SPIMS includes three parts: the membrane inlet system, ionization system, and mass spectrometry system. Firstly, the gas samples are selectively passed through the polydimethylsiloxane membrane (PDMS), and subsequently enter the ionization system. The gas is ionized by a vacuum ultraviolet lamp (10.6 eV) into molecular ions. Then, the ions are transmitted into the vertical acceleration reflective time-of-flight mass analyzer, achieving qualitative and quantitative analysis of different species. Finally, the electrical signal is collected by the data acquisition system and stored in the computer.
SPIMS (single-photon ionization mass spectrometer) can detect 65 VOC species in real-time, grouped into eight classes, including 14 alkanes, 6 alkenes, 14 halocarbons, 10 OVOCs, 5 amines, 7 aromatics and 9 sulfides. Due to low mass resolution, SPIMS usually cannot discriminate isomers, such as acetone/butane, and hexene/methyl cyclopentane, we divided isomers into "else” categories (Supplementary Table S1). Throughout the observation period, the compositions of the VOCs are overall consistent.
Monitoring scheme
To accurately investigate the sources of VOC pollution in Jilin Province, cruise monitoring vehicles were used to conduct observations around key factories from 19 September 2018, to 27 October 2018, and multiple species were simultaneously detected with high sensitivity. During the observation period, the cruise navigation vehicle travels around the factory, or along the side of workshop at a speed of no more than 20 km/h, ensuring that it stays near the factory for 3–10 min, 5 m away from the factory. We chose our monitoring period in clear weather and weak wind meteorological conditions for monitoring.
According to the distribution characteristics of industrial, the monitoring routes cover various types of factories in Jilin Province. These routes reflect the periods and regions of industrial VOC pollution, and provide a comprehensive grasp of pollution in Jilin Province. The cruise routes and three-dimensional cruise concentration maps are shown in the Supplementary Figures SA,SB.
More than 16 thousand legal entities in various industries were involved in VOC emissions in Jilin Province toward the end of 2018. By comparing VOC pollution in recent years in each prefecture-level city, the scale of enterprises, and the enterprises with large VOC emissions in the emission list, we selected 130 enterprises with large VOC emissions, and the spatial distribution is shown in Figure 1.
The technical guidelines for VOC emission control in key industries issued by the Ministry of Ecology and Environment divided the industries into 5 major areas and 16 sub-industries: petrochemicals, chemicals, industrial painting, packaging and printing, and oil storage, transportation and marketing. This study subdivided industrial painting into automobile manufacturing (AM), wood processing and furniture manufacturing (WPFM), electronics and electrical (EE), and machinery manufacturing (MM) industries. Combined with the results of the VOC emission inventory of Jilin Province, the type of raw materials and products, and the processes that mat be involved in emission of VOC, we divided 130 factories into 10 industries in this study (Table 1), which cover most VOC polluting industries in Northeast China.
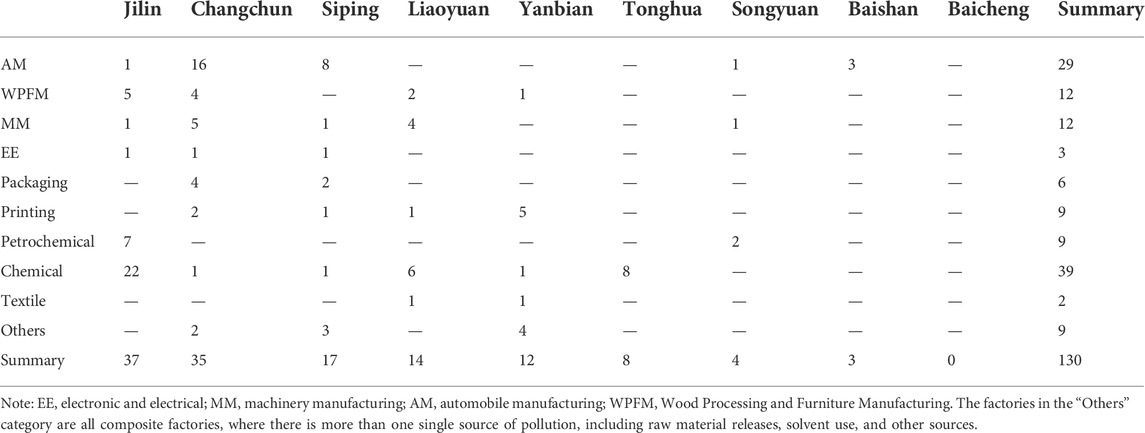
TABLE 1. Number of VOCs emission-related legal entities in various industries registered in Jilin Province.
Quality assurance and quality control
Before formally carrying out walk-around monitoring, a trial run is required to start monitoring equipment and vehicles. A small-scale walk around the area was carried out to confirm that the vehicle, sampling system and monitoring equipment were operating normally, the IPC could upload monitoring data, and the electronic map showed accurate positioning and no significant delay.
The vehicle was equipped with DSG-1000 automatic gas distributor (Guangzhou Huxin Instrument Co., Ltd.); carrier gas (99.999% high purity nitrogen, Guangzhou Yuejia Gas Co., Ltd.); standard mixture of benzene, toluene, xylene and monochlorobenzene at a concentration of 5 μmol/mol, and TO-14 standard gas at a concentration of 1 μmol/mol (Dalian Dart Gas Co., Ltd.) to quantitatively calibrate the monitored major VOCs to ensure the accuracy of the monitoring results (Supplementary Table S2). The vehicle used in this study is a petrol vehicle, travelling at a speed of no more than 20 km/h, with an analysis rate of 100 spectra/second, approximately 0.05 m a spectral data, and powered by a UPS battery. The results of the observation were influenced by the few vehicles gas on the road, and to reduce the impact of vehicle emissions, this study was conducted when there were no vehicles passing around the factory.
Ozone formation potential
The ozone formation potential (OFP) is among the most important indicators for assessing the contribution of ambient VOCs to O3, which is also a parameter to measure the reactivity of VOC species. Due to the existence of isomers and the lack of reactivity of VOC species, this study calculates the OFP of 30 VOC species. To assess the OFP in various industries, we use a normalized concentration of VOCs. We performed the normalization process by calculating the VOC species proportions. The OFP of each VOC species is calculated by multiplying the individual normalized VOCs concentration and the MIR value, as shown in Equation:
where OFPi represents the OFP of VOCi, g/g, MIRi is the coefficient of component i, g/g, and VOCi is the normalized concentration of VOC species, %. Details of MIR value are provided in the research on Carter (Carter, 2012).
Results
Summary of concentration and composition of volatile organic compounds
The real-time concentrations of VOCs in Jilin Province during the monitoring period ranged from 0.03 to 18321.5 μg/m3, with an average of (607.9 ± 2051.8 μg/m3) (Table 2). Based on the normalization of compounds, the proportion of aromatics (25.4 ± 49.7%) is the highest, followed by halocarbons (22.0 ± 34.6%) > alkanes (15.2 ± 28.2%) > alkenes (12.6 ± 18.2%) > OVOCs (6.0 ± 15.9%) > sulfides (5.2 ± 14.8%) > others (4.5 ± 7.8%) > amines (2.9 ± 7.6%). The top ten VOCs concentration accounted for 52.2% of the total 65 VOC species. Among them, concentrations of xylene/ethylbenzene (0–2151.8 μg/m3) had the highest share of TVOC, with ratio of 16.2 ± 27.3%. The other nine important species are 1,1-dichloroethylene (5.4 ± 6.0%), 1,1,2,2-tetrachloroethane (5.3 ± 8.3%), pentene (5.2 ± 5.7%), pentane/isopentane (3.5 ± 9.3%), methyl benzoate (3.3 ± 9.3%), butene (3.3 ± 4.5%), tetrachloroethylene (3.3 ± 4.5%), toluene (3.3 ± 6.0%), and trimethylbenzene (3.3 ± 4.8%), respectively. During the real-time monitoring, species with a maximum concentration of over 1000 μg/m3 include methyl benzoate (9417.7 μg/m3), phenylamine (3107.2 μg/m3), xylene/ethylbenzene (2151.8 μg/m3), isoprene (1545.8 μg/m3), butene (1029.2 μg/m3).
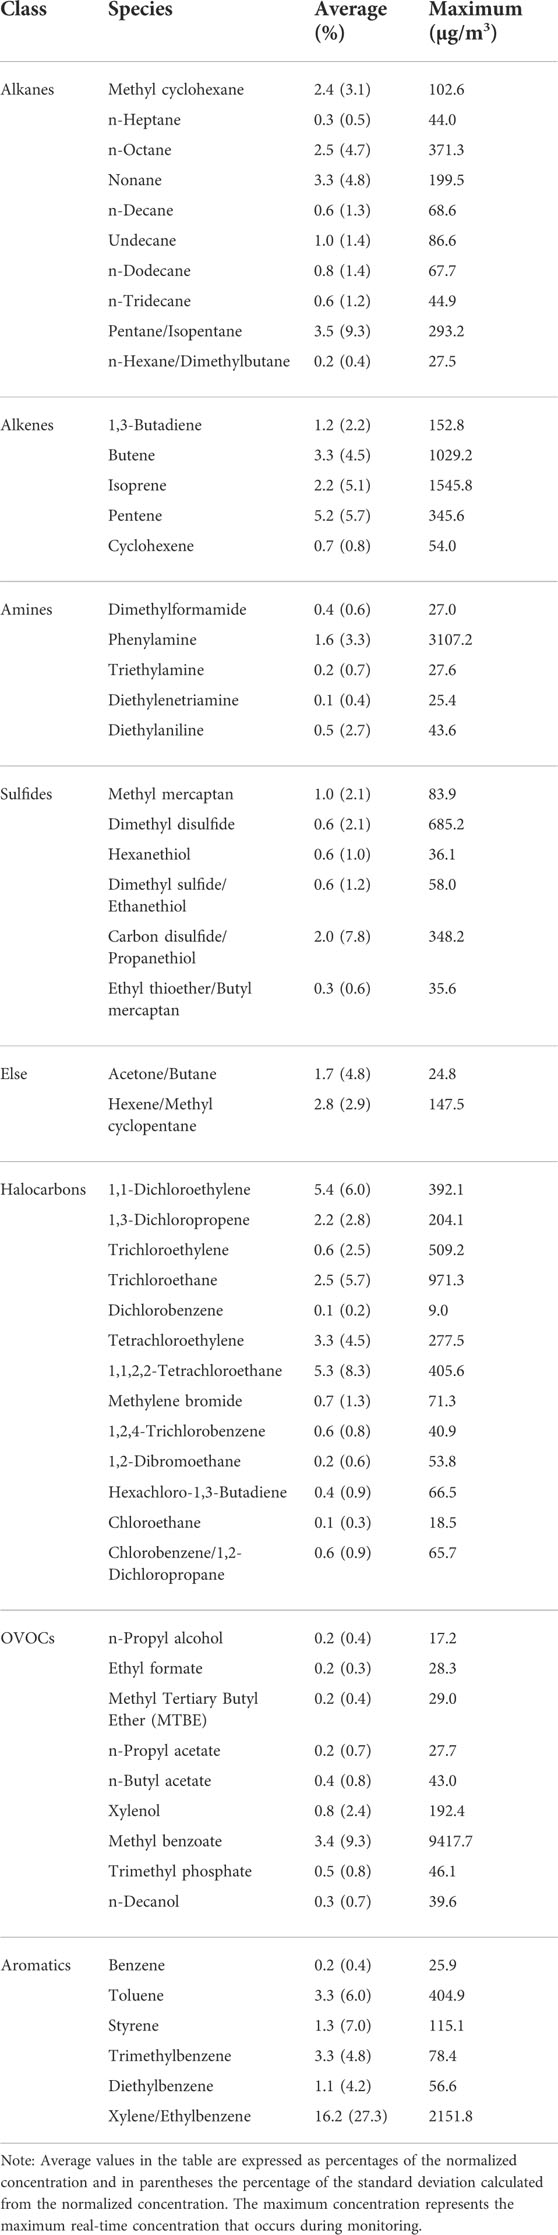
TABLE 2. Summary of VOCs concentration from cruise monitoring in Jilin Province.
Local sources profiles of volatile organic compounds for Northeast China
Differences in production processes, organic raw and auxiliary materials, end-of-pipe treatment technologies, and other factors (e.g., climate, vegetation, traffic) lead to variability in VOCs across factories within the same industry. Therefore, when establishing a VOC source profile, the monitoring results are expressed as a percentage of the various VOC species relative to the total VOCs concentration. This study presents the local source profiles of VOCs for ten types of industries in Jilin Province based on real-time monitoring data (Figure 2).
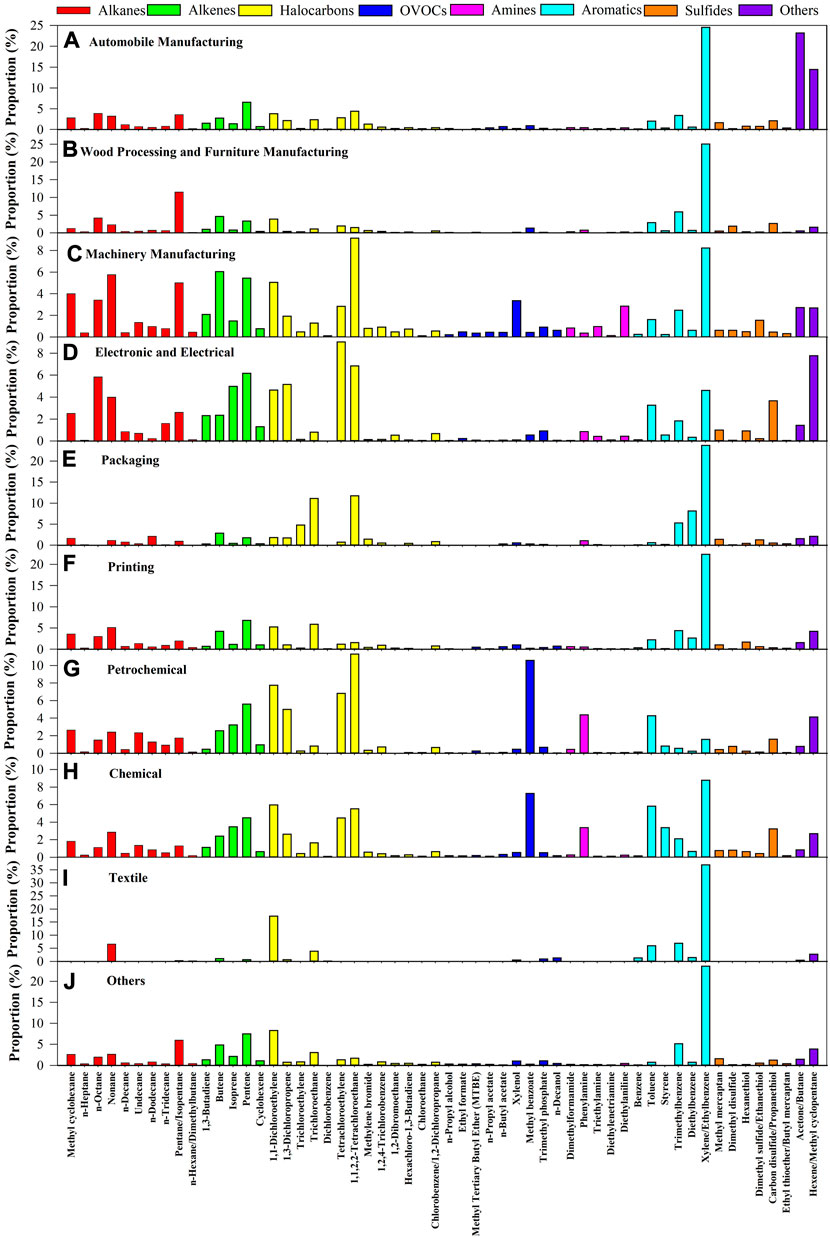
FIGURE 2. Local source profiles with the proportion of 65 VOCs species in various industries of Jilin Province. Due to large differences in the concentration of pollutants in various industries, the ordinate scale is not uniform.
For chemical and petrochemical industries, eight factories emit an average concentration of VOCs above 600 μg/m3, which marks a threshold of high emission. In the petrochemical industry, only above eight factories accounted for 88.9% of high concentrations. In other industries, the number of factories emitting VOCs over 600 μg/m3 includes one in the EE industry (33.3%), one in the packaging industry (16.7%), two in the AM industry (6.9%), and three in the WPFM industry (25%).
For the class of VOC source profiles, AM and WPFM industries are dominated by aromatic pollution (AM: 31.1%; WPFM: 35.4%). VOCs compositions in MM and EE industries are similar, showing significant halocarbon pollution (MM: 24.5%, EE: 28.3%), followed by alkanes (MM: 22.5%, EE: 18.5%) and alkenes (MM: 15.9%, EE: 17.1%). Furthermore, the release of xylene/ethylbenzene in the above four industries cannot be ignored, with the proportion of 24.6% in AM, 25.1% in WPFM, 8.2% in MM, and 4.6% in EE. In the packaging and printing industries, the main pollutants are aromatics with xylene/ethylbenzene (22.4%–23.7%). Furthermore, the halocarbons release cannot be neglected. The halocarbon pollution (35.4%) is similar to the aromatic pollution (38.1%) in the packaging industry, while the percentage of halocarbons (17.9%) is about half that of aromatics (32.1%) in the printing industry. Although the petrochemical and chemical industries are similar in composition, both mainly emit halocarbons (petrochemical: 33.8%; chemical: 22.9%), the second major class is different, i.e., alkanes (13.5%) in the petrochemical industry, and aromatics (20.9%) in the chemical industry. The top three VOCs concentrations in the petrochemical industry are 1,1,2,2-tetrachloroethane, 1,1-dichloroethylene, and methyl benzoate, while in the chemical industry they are 1,1-dichloroethylene, xylene/ethylbenzene, and methyl benzoate. The textile industry is characterized by aromatics, with xylene/ethylbenzene being the most concentrated species in the industry.
Characteristics of volatile organic compounds in the prefecture-level city
The regional distribution of VOCs factories, and because our survey did not cover all VOCs factories resulted in the evident spatiality of VOC pollution on the prefecture-level city scale. Based on the available survey data, the average concentrations of VOCs in each prefecture are: Jilin (1938.0 ± 3811.3 μg/m3) > Songyuan (757.8 ± 382.7 μg/m3) > Baishan (482.4 ± 199.9 μg/m3) > Tonghua (224.6 ± 79.8 μg/m3) > Yanbian (133.3 ± 90.2 μg/m3) > Changchun (112.9 ± 178.5 μg/m3) > Siping (111.2 ± 81.0 μg/m3) > Liaoyuan (85.5 ± 48.9 μg/m3), suggesting higher VOC emissions in central core urban agglomerations. The eastern regions of Tonghua and Baishan have a single industry type, where the VOCs were dominated by halocarbons (35.1%–36.0%). In the cities of the central region (i.e., Jilin, Siping, and Liaoyuan) and western region (i.e., Songyuan), three classes of compounds (i.e., alkanes, alkenes, and halocarbons) occupy approximately half of VOCs composition in various industries (Figure 3). Furthermore, the primary pollutants in the printing and chemical industries in Liaoyuan are aromatics, accounting for 42.9 and 37.6%, respectively. In Jilin City, the WPFM industry mainly emitted aromatics (27.1%), to a level higher than the halocarbons emission (20.8%). In the central provincial city (i.e., Changchun) and eastern city (i.e., Yanbian), major VOC species are aromatics in most industries. However, some industries are dominated by halocarbons in Changchun, such as the EE and the chemical industry.

FIGURE 3. Types of pollutants discharged by various industries. EE, Electronic and Electrical; MM, Machinery Manufacturing; AM, Automobile Manufacturing; WPFM, Wood Processing and Furniture Manufacturing.
Ozone formation potential
To assess the reactivity of various VOCs and their impact on ozone, we calculated the ozone formation potential (OFP) with normalized concentration.
Regarding the composition, OFP in Jilin Province had the following order of aromatics (55.2%) > alkenes (33.7%) > halocarbons (5.9%) > alkanes (3.3%) > amines (1.0%) > OVOCs (0.9%). The top ten VOCs in 65 species accounted for 92.9% of total OFP (Figure 4), and the most abundant species is xylene/ethylbenzene (38.0%). The other nine species are pentene (11.4%), trimethylbenzene (10.7%), butene (9.7%), isoprene (6.9%), 1, 3-butadiene (4.6%), toluene (4.0%), 1,1-dichloroethylene (2.9%), 1,3-dichloropropene (2.8%), and diethylbenzene (1.9%).
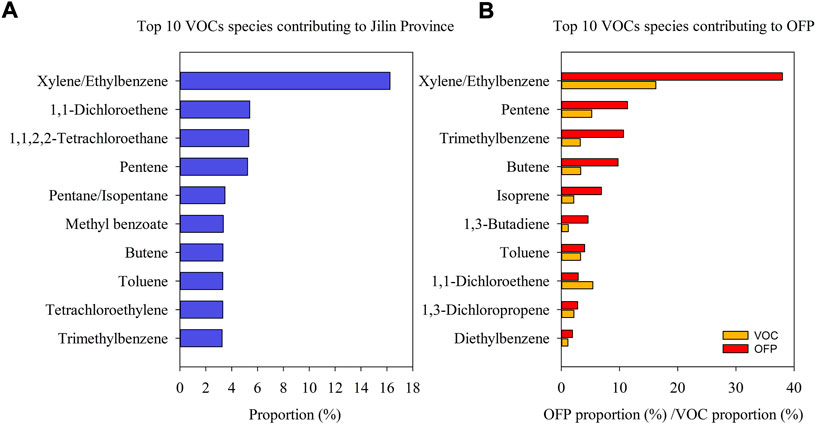
FIGURE 4. Key contributing species to (A) top 10 VOC and (B) OFP in Jilin Province.
For the OFP contribution of each industry, the textile industry had the highest OFP contribution rate of 12.9%, followed by the printing (11.5%), AM (11.2%), WPFM (11.2%), packaging (10.6%), MM (8.6%), EE (8.0%), chemical (7.8%), and petrochemical (5.7%) industries (Figure 5).
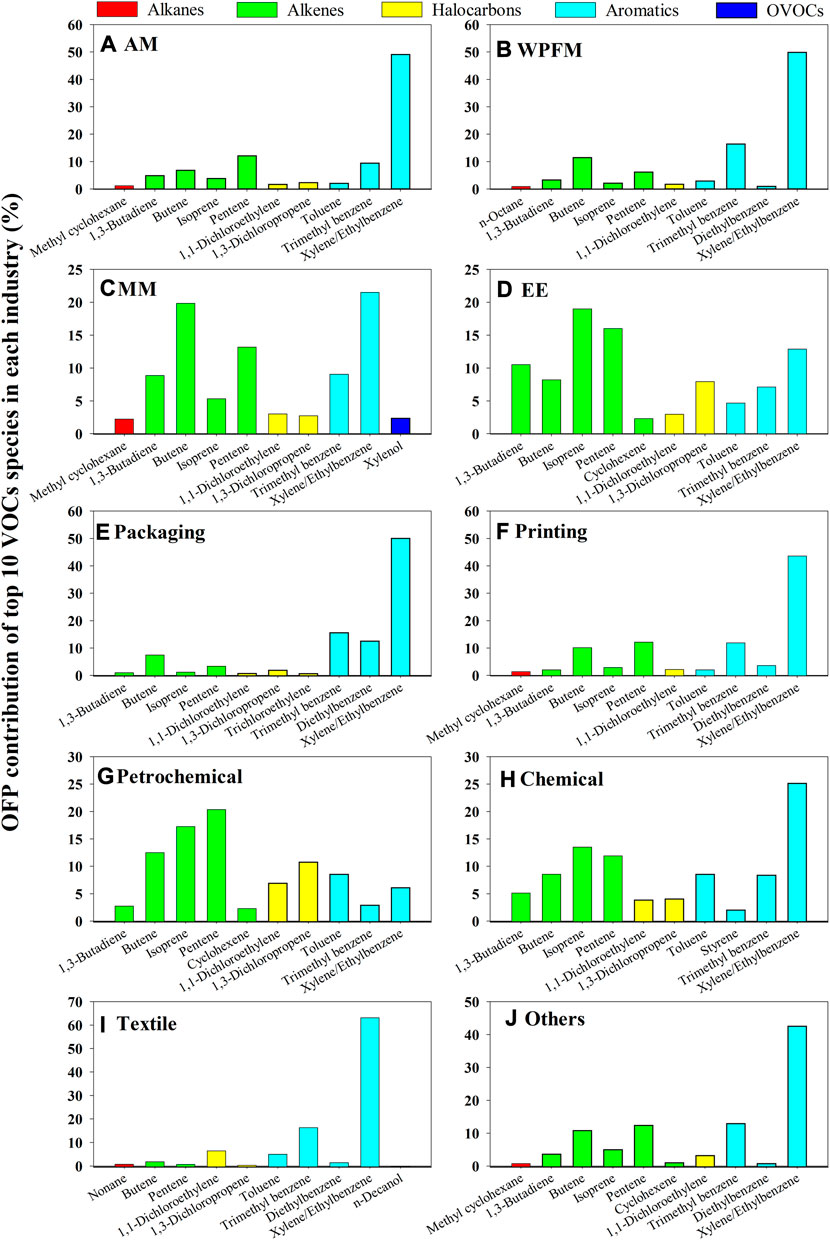
FIGURE 5. OFP contribution of top 10 VOC species in each industry.
Discussion
Characteristics of provincial concentration and compounds
This study is the first systematic survey of atmospheric VOCs concentrations and compounds at the provincial level (i.e., Jilin Province) in Northeastern China, covering most cities and major polluting industries. As the important precursors of ozone formation, VOCs monitoring was mainly conducted in densely populated and economically developed areas (e.g., BTH, YRD, and PRD) (Li et al., 2018; Wang et al., 2020a; Xiong and Du, 2020; Gu et al., 2021). Thus our implementation fills the gap for Northeast China. During the monitoring investigation period, the average VOCs concentration is at the high end, compared to other cities like Beijing [101.5 ± 65.2 μg/m3, (Liu et al., 2021)], Zhengzhou [29.11 ± 15.33 μg/m3, (Li et al., 2020b)], and Shenyang [371.0 ± 132.4 μg/m3, (Liu et al., 2011)]. Such high levels of VOCs concentrations, on the one hand might be due to the close detection location to pollution sources around factories rather than an ambient area; on the other hand, they are associated with more petrochemical and chemical industries in Jilin Province, which emit large quantities of VOCs.
Our study indicates that aromatics were the largest contributing class of VOCs in Jilin Province. They are a significant part of fuel volatilization and solvent use processes. Halocarbons were the second largest contributor to VOC concentrations, ahead of Shanghai (12.5%) (Zhang et al, 2018). Such compounds are closely related to industrial emissions, and solvent use processes (Geng et Al. 2010), and a high proportion of halocarbons in Jilin Province may be related to the petrochemical and packaging industries. The alkanes in the urban environment mainly come from vehicle emissions and fuel volatilization. The relatively high proportion of alkanes is due to their low photochemical reactivity relative to other VOC species, such as methylcyclohexane, nonane, pentane/isopentane (Li et al., 2022). Alkenes are incomplete combustion products, which may be released from intermediate products during the process or from raw materials in this study. Their contribution rate was lower than that of Nanjing and Beijing (26.8% and 15.9%, L. Li, Xie, Zeng, Wu, and Li, 2015). The OVOCs are an important part of the combustion and solvent use process (Mo et al., 2016; Huang et al., 2019). The proportion of OVOCs is significantly smaller than that in Nanjing (22.3%) (Cao et al., 2020), Chengdu (22.0%) (Simayi et al., 2020). This may be related to the monitored petrochemical, printing, and pharmaceutical factories. OVOCs may also originate from photochemical oxidation (Li et al., 2020a), and higher temperatures may accelerate photochemical reactions that lead to the formation of OVOCs and accelerate ozone production (Qu et al., 2021). In terms of VOCs with higher concentrations, the total proportion of dangerous aromatics toluene, ethylbenzene, and xylene (TEX) reached 19.5%, which might aggravate human health risks and cause chronic diseases, such as cancer and asthma (Montero-Montoya et al., 2018). In addition, the high concentration of methyl benzoate occurs near several factories in the chemical industry of Jilin City, which is often used in industry as an intermediate in organic synthesis and as a solvent for resins, such as rubber. Several studies have shown that high concentrations of methyl benzoate are irritating to the skin, and its vapor or mist is equally irritating to the eyes and upper respiratory tract. Another high-concentration species, phenylamine, mainly used in the manufacture of dyes, drugs, resins, and also as a rubber vulcanization accelerator, has high toxicity in blood and can cause hemolytic anemia by entering the human body from the skin and respiratory tract. Because these high concentrations or high percentages of volatile organic compounds are harmful to the human body, more attention must be paid to the research on air pollution control and health effects.
Notably, the spatial distribution characteristics of VOC pollution in Jilin Province are evident. Among the surveyed factories, there are 24 factories with average monitoring concentration exceeding 600.0 μg/m3, and 20 of those high-concentration factories are concentrated in the central cities of Jilin and Changchun. Such high levels are mainly influenced by the petrochemical and chemical industries, which are associated with a more developed economy, intensive industrial activities, and a high density of population and road network in a limited space in the central region. The spatial characteristics indicate that the follow-up study must focus on the central cities of Jilin Province.
Local sources profiles of volatile organic compounds for the cold region of Northeast China
The industrial painting process is employed in AM, WPFM, EE, and MM industries (Zhou et al., 2020). Benzenes, such as TEX, are typical species of paints and thinners, and the VOC composition of industrial paints is more variable than in other studies due to differences in product requirements and paint use standards in specific areas. The AM industry emits aromatics such as xylene/ethylbenzene and halocarbons, although Yuan et al. (2010) focused on aromatics such as m/p-xylene and toluene. However, MM and WPFM industries are dominated by aromatics, which is consistent with the study by Junyu et al. (2013) (Zheng et al., 2013). The high concentrations of benzene emitted indicate that the VOC composition characteristics of these four industries are highly correlated with the raw and auxiliary materials used. However, Junyu et al. (2013) reported that the impact of OVOCs cannot be neglected, and the differences among the results are related not only to various VOC species in the raw materials, but also to the inconsistency of the tested species in these studies. As a typical solvent-using source, VOC concentration characteristics from the printing industry exhibited significant variations from those of industrial painting. Yuan et al. (2010) found that the printing industry in Beijing is also dominated by aromatics, particularly xylene. The printing industry in Beijing is affected by heavy hydrocarbons such as n-decane (16.9%), n-nonane (14.8%), and n-undecane (13.0%), whereas the printing industry in Jilin Province is dominated by halocarbons, such as trichloroethane (5.9%) and 1,1-dichloroethylene (5.3%). The use of organic solvents such as adhesives and detergents may cause similar aromatic pollution, but these species may vary according to the type of solvent used in different areas and the printing process used by the monitoring factories. The petrochemical industry, including the petroleum refining industry and petrochemical industry, is one of the industries with the highest concentration of VOC emissions in Jilin Province. Previous studies reported that alkanes were the main VOCs class in the petrochemical industry in both Shandong province (Lv et al., 2021) and YRD (Mo et al., 2015), while our study mainly comprised halocarbons and alkanes, indicating regional differences in species tracers for the same industry. Propane (19.9%), propylene (11.7%), ethane (9.5%), and isobutane (9.2%) were the dominant species in the YRD, however, these species are not detected in this study due to different monitoring species in these two studies. The source profiles from Shandong suggested the higher concentrations of cis-2-butene (14.5%), n-pentane (10.2%), n-butane (7.4%), isopentane (6.5%), and MTBE (5.9%). In contrast, these occurrence of species in Jilin province are low (0.2%–5.6%). Moreover, there are also significant differences in the source profiles of Shandong and the YRD. Key species vary depending on the production process and changes in source profile synthesis may also explain these differences. In addition, the high proportion of alkanes in Mo et al. (2015) and Lv et al. (2021) studies is highly correlated with the type of feedstock and products used in specific process facilities. The factories were analyzed without considering the specific process unit in this study, which may be another important factor of species variation. The chemical industry is another source of high VOC concentration in Jilin Province, including petroleum, coal and other fuel processing industry, chemical raw materials and chemical products industry, rubber and plastic products industry, pharmaceutical manufacturing industry, and chemical fiber manufacturing industry. The chemical industry is mostly concentrated in Jilin City, where the average monitoring concentrations are above 600 μg/m3 in 17 factories, with the highest concentration reaching up to 17151.0 μg/m3. These high real-time concentrations indicate the possibility of serious fugitive leaks from chemical factories, which explains the high pollution concentration levels in the chemical industry. Therefore, due to the complexity of the types of petrochemical and chemical factories in Jilin Province and the possible leakage, high concentration industries must be subject to continuous monitoring.
This study shows that the contribution of each industry to regional VOC emissions varies in different regions because of the diversity in industrial structure, production, and population. Further, the same industry in Jilin Province had various VOC compositions in each region, which is caused by the factors of organic raw and auxiliary materials, production processes, product types, and governance equipment. Taking the case of the WPFM industry located in Jilin, Liaoyuan, Changchun, and Yanji, wood is a natural source of VOCs, which can cause differences between the composition of VOCs and regions depending on the type of wood used by the industry. The concentration of VOCs in wood depends to a large extent on wood compounds as well as on the boundary conditions (drying, storage, etc.) or the levels of VOC species in various processes (Boren et al., 2018). Then, there is the chemical industry, which is distributed in Jilin, Tonghua, Liaoyuan, Siping, Yanji, and Changchun. Unlike other cities, Tonghua has a single type of chemical industry with only pharmaceutical factories. Our detection showed TVOC levels ranging from 159.3 to 389.0 μg/m3, with real-time levels exceeding 600 μg/m3 in four enterprises during the monitoring period. Pharmaceutical factories contributed halocarbons (Cheng et Al. 2021), but YRD emitted aromatics, whereas this study was dominated by alkanes and alkenes. The difference is related to the various target products of the monitored factories and APIs (Active Pharmaceutical Ingredients).
In summary, through systematic comparison and analysis, the local VOCs concentration and composition in Jilin Province are complicated due to evident differences in the regional, industry, as well as industrial structure, and process. Thus, further research is needed on industries with local characteristics and high pollution levels.
Assessment of ozone formation potential
As an important indicator, OFP is used to evaluate the correlation between VOCs and ozone. Based on the OFP calculation results, this study shows that aromatics and alkenes are the key components of O3 formation, which is higher than that in the PRD (80%) (Louie et al., 2013). Previous studies reported that alkenes are the most abundant class of the OFP in most regions, such as Shandong (59.4%) (Gao et al., 2021) and Wuhan (49.5%) (Hui et al., 2020). In their studies, alkenes such as ethene (31.1%) (Hui et al., 2020) and propene (39.4%) (Gao et al., 2021) were not included within the monitored species in this study. We also calculated and compared the ratio of OFP for each industry, presenting that textile, AM, printing, WPFM were the four industries that have the strongest influence on ozone formation. They can be considered as the major industrial sources of regional ozone. Furthermore, these four industries are all related to the process of solvent usage. Moreover, the OFP of some observed VOCs was not examined, because their related factors were unavailable. Thus, the total OFP was underestimated.
In the view of chemical reactivity, alkenes ranked fourth in concentration, but second in OFP contribution, which indicates the considerable proportion of hydrocarbons reactivity by alkenes. On the contrary, the concentration ratio of alkanes and halocarbons was higher than that of alkenes, but the proportion of OFP was significantly lower, which demonstrated the relatively low chemical reactivity of these two classes. Moreover, the top ten VOC species contributing to OFP accounted for 92.9% of the total OFP, but only 52.2% of the concentration (Figure 4). This is attributed to the divergent chemical reactivity of individual species, and the fact that species with a large concentration rate are not necessarily equally significant for OFP, i.e., there are variations between species based on the concentration and OFP proportion.
The above results supporting VOCs’ elaborative control policies must be developed by the industry in future research. In brief, during the process of regional ambient ozone prevention and control, it is essential to control not only the concentration of VOC, but also specified species that significantly contribute to ozone formation.
Through the analysis of this observation, a preliminary understanding of VOC and OFP in Jilin Province was obtained. Due to the short duration of the cruise monitoring, the analysis of the “normalized” distribution pattern of pollutants in the study area is insufficient, and the contribution of each industry needs to be further analyzed. It is suggested that VOC monitoring and analysis should be continuously strengthened for different seasons and industries in the future to obtain a clearer and more comprehensive VOC pollution spectrum in Jilin Province.
Conclusion and implications
The study, for the first time, surveys the VOCs background covering most emission industries at the provincial level in Northeast China characterized by the highest latitudes, heavy industrial area, and longest heating period. The urban pollution status of VOCs in various types, local source profiles, and the ozone formation potential for different species was obtained. We find large variations in VOC concentrations and compositions between industries and cities, and also between processes and materials in the same industry. In terms of spatial distribution, the highest VOC concentrations are found in central urban agglomeration with chemical, AM, and WPFM industries. On the provincial scale, three main compounds including alkanes, alkenes, and halocarbons contribute to more than 50% of TVOC. Local source profiles present high concentrations contribution from xylene/ethylbenzene during industrial coating process (e.g., AM, WPFM, EE, and MM) and solvent use process (e.g., printing and packaging), while the petrochemical and chemical industries are dominated by halocarbons. For OFP, aromatics (55.2%) and alkenes (33.7%) are the most abundant VOC species, and textile, AM, printing, WPFM are the greatest contributors to Jilin Province. These results suggest that highly polluted cities (i.e., Changchun, and Jilin) and highly polluting processes in industries (i.e., petrochemical, and chemical) must focus on regulation technology in the future.
Throughout the cruise monitoring process, the system overcomes the adverse environmental factors such as bad road conditions and vehicle bumping to obtain reliable data and meet the requirements of data measurement and environmental adaptability. VOCs cruise vehicles usually travel on the road, there is a certain distance from the source of pollution. The monitoring concentration is affected by the meteorological conditions and the natural diffusion of pollutants. The meteorological conditions (e.g., temperature, humidity, wind speed, and wind direction) have certain effects on the results of atmospheric VOC monitoring, such as temperature affects the photochemical reaction of VOCs in the atmosphere, and wind speed has both an increasing and diluting effect on pollutant concentrations. Considering these factors, we chose our monitoring period in clear weather and weak wind meteorological conditions for monitoring. Due to the short duration of cruise monitoring, VOCs cruise monitoring results and traditional off-line sampling laboratory analysis results should be further verified and improved.
Data availability statement
The original contributions presented in the study are included in the article/Supplementary Material, further inquiries can be directed to the corresponding author.
Author contributions
YS: Conceptualization, methodology, software, investigation, visualization, writing—original draft. WC: Resources, Supervision, project administration, writing—review and editing. QB: Resources, data curation. YY: Resources, data curation, investigation. XP: Conceptualization, methodology, software. YZ: Conceptualization, methodology. LG: Conceptualization, funding acquisition, project administration, supervision. JF: Formal analysis, visualization. WF: Formal analysis, visualization.
Funding
This work was supported by the Key Research Program of Frontier Sciences, Chinese Academy of Sciences (No. QYZDB-SSW-DQC045), the Strategic Priority Research Program (B) of the Chinese Academy of Sciences (Grant No. XDB05020304), and Land Observation Satellite Supporting Platform of National Civil Space Infrastructure Project (CASPLOS-CCSI).
Conflict of interest
The authors declare that the research was conducted in the absence of any commercial or financial relationships that could be construed as a potential conflict of interest.
Publisher’s note
All claims expressed in this article are solely those of the authors and do not necessarily represent those of their affiliated organizations, or those of the publisher, the editors and the reviewers. Any product that may be evaluated in this article, or claim that may be made by its manufacturer, is not guaranteed or endorsed by the publisher.
Supplementary material
The Supplementary Material for this article can be found online at: https://www.frontiersin.org/articles/10.3389/fenvs.2022.1055886/full#supplementary-material
References
Alabdulhadi, A., Ramadan, A., Devey, P., Boggess, M., and Guest, M. (2019). Inhalation exposure to volatile organic compounds in the printing industry. J. Air Waste Manag. Assoc. 69, 1142–1169. doi:10.1080/10962247.2019.1629355
Bahri, M., and Haghighat, F. (2014). Plasma-based indoor air cleaning technologies: The state of the art-review. Clean. Soil Air Water 42, 1667–1680. doi:10.1002/clen.201300296
BoréN, E., Larsson, S. H., Thyrel, M., Averheim, A., and BroströM, M. (2018). VOC off-gassing from pelletized steam exploded softwood bark: Emissions at different industrial process steps. Fuel Process. Technol. 171, 70–77. doi:10.1016/j.fuproc.2017.11.007
Cao, M. Y., Lin, Y. C., and Zhang, Y. L. (2020). Characteristics and source apportionment of atmospheric VOCs in the nanjing industrial area in autumn. Huan Jing Ke Xue 41, 2565–2576. doi:10.13227/j.hjkx.201910154
Carter, W. P. L. (2012). Development of ozone reactivity scales for volatile organic compounds. Air & Waste 44, 881–899. doi:10.1080/1073161x.1994.10467290
Chang, Z. S., Wang, C., and Zhang, G. J. (2020). Progress in degradation of volatile organic compounds based on low-temperature plasma technology. Plasma process. Polym. 17, 1900131. doi:10.1002/ppap.201900131
Chen, W., Tong, D. Q., Dan, M., Zhang, S., Zhang, X., and Pan, Y. (2017). Typical atmospheric haze during crop harvest season in northeastern China: A case in the Changchun region. J. Environ. Sci. 54, 101–113. doi:10.1016/j.jes.2016.03.031
Dominutti, P., Keita, S., Bahino, J., Colomb, A., Liousse, C., and Yoboue, V. (2019). Anthropogenic VOCs in abidjan, southern west Africa: From source quantification to atmospheric impacts. Atmos. Chem. Phys. 19, 11721–11741. doi:10.5194/acp-19-11721-2019
Fang, X. Z., Xiao, H. Y., Sun, H. X., Liu, C., Zhang, Z. Y., and Xie, Y. J., (2020). Characteristics of ground-level ozone from 2015 to 2018 in BTH area, China. Atmosphere 11, 130. doi:10.3390/atmos11020130
Galano, A., and RaúL Alvarez-Idaboy, J. (2008). Atmospheric reactions of oxygenated volatile organic Compounds+OH radicals: Role of hydrogen-bonded intermediates and transition states. Appl. Theor. Methods Atmos. Sci.55.doi:10.1016/S0065-3276(07)00212-2
Gao, Y. Q., Li, M., Wan, X., Zhao, X. W., Wu, Y., Liu, X., and Li, X. (2021). Important contributions of alkenes and aromatics to VOCs emissions, chemistry and secondary pollutants formation at an industrial site of central eastern China. Atmos. Environ. 244, 117927. doi:10.1016/j.atmosenv.2020.117927
GarzóN, J. P., Huertas, J. I., MagañA, M., Huertas, M. E., CáRDENAS, B., Watanabe, T., Maeda, T., and Wakamatsu, S. (2015). Volatile organic compounds in the atmosphere of Mexico City. Atmos. Environ. 119, 415–429. doi:10.1016/j.atmosenv.2015.08.014
Gu, S., Guenther, A., and Faiola, C. (2021). Effects of anthropogenic and biogenic volatile organic compounds on los angeles air quality. Environ. Sci. Technol. 55, 12191–12201. doi:10.1021/acs.est.1c01481
Guan, Y. N., Zhang, Y. H., Zhang, Y. S., Wang, X. L., Han, J., Song, W., and Duan, E., (2020). Pollution characteristics and key reactive species of volatile organic compounds in beijing-tianjin-hebei area, China. Aerosol Air Qual. Res. 20, 1886–1897. doi:10.4209/aaqr.2019.11.0595
He, K., Shen, Z. X., Sun, J., Lei, Y. L., Zhang, Y., and Wang, X. (2020). Spatial distribution, source apportionment, ozone formation potential, and health risks of volatile organic compounds over a typical central plain city in China. Atmosphere 11, 1365. doi:10.3390/atmos11121365
Huang, X. F., Wang, C., Zhu, B., Lin, L. L., and He, L. Y. (2019). Exploration of sources of OVOCs in various atmospheres in southern China. Environ. Pollut. 249, 831–842. doi:10.1016/j.envpol.2019.03.106
Hui, L. R., Liu, X. G., Tan, Q. W., Feng, M., An, J. L., Qu, Y., Zhang, Y., and Deng, Y., (2020). VOC characteristics, chemical reactivity and sources in urban Wuhan, central China. Atmos. Environ. 224, 117340. doi:10.1016/j.atmosenv.2020.117340
Ku, Y. Y., Ren, W. H., Su, C. C., and Yu, X. N. (2021). Pollution characteristics and ozone formation potential of ambient VOCs in different functional zones of Shenyang, China. Huan Jing Ke Xue 42, 5201–5209. doi:10.13227/j.hjkx.202101137
Li, C., Li, Q., Tong, D., Wang, Q., Wu, M., Sun, B., and Su, G. (2020). Environmental impact and health risk assessment of volatile organic compound emissions during different seasons in Beijing. J. Environ. Sci. 93, 1–12. doi:10.1016/j.jes.2019.11.006
Li, J., Deng, S., Li, G., Lu, Z., Song, H., Gao, J., and Sun, Z. (2022). VOCs characteristics and their ozone and SOA formation potentials in autumn and winter at Weinan, China. Environ. Res. 203, 111821. doi:10.1016/j.envres.2021.111821
Li, Y., Yin, S., Yu, S., Yuan, M., Dong, Z., Zhang, D., Yang, L., and Zhang, R. (2020). Characteristics, source apportionment and health risks of ambient VOCs during high ozone period at an urban site in central plain, China. Chemosphere 250, 126283. doi:10.1016/j.chemosphere.2020.126283
Li, Z., Li, C. L., Ye, X. N., Fu, H. B., Wang, L., Yang, X., Wang, X., Zhao, Z., Kan, H., Mellouki, A., and Chen, J. (2018). Air quality in the middle and lower reaches of the Yangtze River channel: A cruise campaign. Atmos. Chem. Phys. 18, 14445–14464. doi:10.5194/acp-18-14445-2018
Lian, X., Xiaofeng, C., Yuan, F., Jing, W., Meng, S., and Wei, W., (2020). Application of VOCs cruise observation in urban pollution sources investigation. Environ. Monit. China 36, 205–213.
Liu, B., Ji, J., Zhang, B., Huang, W., Gan, Y., and Leung, D. Y. C., (2022). Catalytic ozonation of VOCs at low temperature: A comprehensive review. J. Hazard. Mat. 422, 126847. doi:10.1016/j.jhazmat.2021.126847
Liu, H., Zhang, M., and Han, X. (2020). A review of surface ozone source apportionment in China. Atmos. Ocean. Sci. Lett. 13, 470–484. doi:10.1080/16742834.2020.1768025
Liu, Y. F., Kong, L. W., Liu, X. G., Zhang, Y. P., Li, C. L., and Zhang, Y. Y., (2021). Characteristics, secondary transformation, and health risk assessment of ambient volatile organic compounds (VOCs) in urban Beijing, China. Atmos. Pollut. Res. 12, 33–46. doi:10.1016/j.apr.2021.01.013
Liu, Y. T., Peng, Y., Bai, Z. P., Zhang, B. S., Shi, J. W., and Zhao, L. J. (2011). Characterization of atmospheric volatile organic compounds in Shenyang, China. Huan Jing Ke Xue 32, 2777–2785.
Louie, P. K. K., Ho, J. W. K., Tsang, R. C. W., Blake, D. R., Lau, A. K. H., Yu, J. Z., Yuan, Z., and Wang, X. (2013). VOCs and OVOCs distribution and control policy implications in Pearl River Delta region, China. Atmos. Environ. 76, 125–135. doi:10.1016/j.atmosenv.2012.08.058
Lu, X., Zhang, S. J., Xing, J., Wang, Y. J., Chen, W. H., and Ding, D., (2020). Progress of air pollution control in China and its challenges and opportunities in the ecological civilization era. Engineering 6, 1423–1431. doi:10.1016/j.eng.2020.03.014
Lv, D., Lu, S., Tan, X., Shao, M., Xie, S., and Wang, L. (2021). Source profiles, emission factors and associated contributions to secondary pollution of volatile organic compounds (VOCs) emitted from a local petroleum refinery in Shandong. Environ. Pollut. 274, 116589. doi:10.1016/j.envpol.2021.116589
Ma, Z. Q., Xu, J., Quan, W. J., Zhang, Z. Y., Lin, W. L., and Xu, X. B. (2016). Significant increase of surface ozone at a rural site, north of eastern China. Atmos. Chem. Phys. 16, 3969–3977. doi:10.5194/acp-16-3969-2016
Mo, Z., Shao, M., Lu, S., Qu, H., Zhou, M., and Sun, J., (2015). Process-specific emission characteristics of volatile organic compounds (VOCs) from petrochemical facilities in the Yangtze River Delta, China. Sci. Total Environ. 533, 422–431. doi:10.1016/j.scitotenv.2015.06.089
Mo, Z. W., Shao, M., and Lu, S. H. (2016). Compilation of a source profile database for hydrocarbon and OVOC emissions in China. Atmos. Environ. 143, 209–217. doi:10.1016/j.atmosenv.2016.08.025
Mohd Napi, N. N. L., Abdullah, S., Ahmed, A. N., Mansor, A. A., and Ismail, M. (2020). Annual and diurnal trend of surface ozone (O3) in industrial area. IOP Conf. Ser. Earth Environ. Sci. 498, 012062. doi:10.1088/1755-1315/498/1/012062
Montero-Montoya, R., Lopez-Vargas, R., and Arellano-Aguilar, O. (2018). Volatile organic compounds in air: Sources, distribution, exposure and associated illnesses in children. Ann. Glob. Health 84, 225–238. doi:10.29024/aogh.910
Qu, H., Wang, Y., Zhang, R., Liu, X., Huey, L. G., and Sjostedt, S., (2021). Chemical production of oxygenated volatile organic compounds strongly enhances boundary-layer oxidation chemistry and ozone production. Environ. Sci. Technol. 55, 13718–13727. doi:10.1021/acs.est.1c04489
Rajabi, H., Hadi Mosleh, M., Mandal, P., Lea-Langton, A., and Sedighi, M. (2020). Emissions of volatile organic compounds from crude oil processing - global emission inventory and environmental release. Sci. Total Environ. 727, 138654. doi:10.1016/j.scitotenv.2020.138654
Shen, X. L., Zhao, Y., Chen, Z. M., and Huang, D. (2013). Heterogeneous reactions of volatile organic compounds in the atmosphere. Atmos. Environ. 68, 297–314. doi:10.1016/j.atmosenv.2012.11.027
Simayi, M., Shi, Y., XI, Z., Li, J., Yu, X., and Liu, H., (2020). Understanding the sources and spatiotemporal characteristics of VOCs in the Chengdu Plain, China, through measurement and emission inventory. Sci. Total Environ. 714, 136692. doi:10.1016/j.scitotenv.2020.136692
Simon, H., Beck, L., Bhave, P. V., Divita, F., Hsu, Y., Luecken, D., Mobley, J. D., and Pouliot, G. A. (2010). The development and uses of EPA's SPECIATE database. Atmos. Pollut. Res. 1, 196–206. doi:10.5094/apr.2010.026
Tiwari, V., Hanai, Y., and Masunaga, S. (2010). Ambient levels of volatile organic compounds in the vicinity of petrochemical industrial area of Yokohama, Japan. Air Qual. Atmos. Health 3, 65–75. doi:10.1007/s11869-009-0052-0
Wang, M., Qin, W., Chen, W. T., Zhang, L., Zhang, Y., Zhang, X. Z., and Xie, X. (2020). Seasonal variability of VOCs in Nanjing, Yangtze River delta: Implications for emission sources and photochemistry. Atmos. Environ. 223, 117254. doi:10.1016/j.atmosenv.2019.117254
Wang, S., Cui, J. S., Feng, Y. P., Liu, D. X., Chen, J., Tian, L., Feng, C., and Wang, M.X. (2020). Characteristics and source apportionment of VOCs and O3 in shijiazhuang. Huan Jing Ke Xue 41, 5325–5335. doi:10.13227/j.hjkx.202005302
Wang, Y., Gao, W., Wang, S., Song, T., Gong, Z., Ji, D., Wang, L., and Liu, Z. (2020). Contrasting trends of PM2.5 and surface-ozone concentrations in China from 2013 to 2017. Natl. Sci. Rev. 7, 1331–1339. doi:10.1093/nsr/nwaa032
Wang, Y. H., Hu, B., Tang, G. Q., Ji, D. S., Zhang, H. X., and Bai, J. H., (2013). Characteristics of ozone and its precursors in northern China: A comparative study of three sites. Atmos. Res. 132, 450–459. doi:10.1016/j.atmosres.2013.04.005
Wei, W., Ren, Y., Yang, G., Cheng, S., and Han, L. (2019). Characteristics and source apportionment of atmospheric volatile organic compounds in Beijing, China. Environ. Monit. Assess. 191, 762. doi:10.1007/s10661-019-7813-5
Wu, X. C., Huang, W. W., Zhang, Y. X., Zheng, C. H., Jiang, X., and Gao, X., (2015). Characteristics and uncertainty of industrial VOCs emissions in China. Aerosol Air Qual. Res. 15, 1045–1058. doi:10.4209/aaqr.2014.10.0236
Xing, J., Wang, S. X., Jang, C., Zhu, Y., and Hao, J. M. (2011). Nonlinear response of ozone to precursor emission changes in China: A modeling study using response surface methodology. Atmos. Chem. Phys. 11, 5027–5044. doi:10.5194/acp-11-5027-2011
Xiong, Y., and DU, K. (2020). Source-resolved attribution of ground-level ozone formation potential from VOC emissions in Metropolitan Vancouver, BC. Sci. Total Environ. 721, 137698. doi:10.1016/j.scitotenv.2020.137698
Xu, Z. N., Huang, X., Nie, W., Chi, X. G., Xu, Z., Zheng, L. F., Sun, P., and Ding, A., (2017). Influence of synoptic condition and holiday effects on VOCs and ozone production in the Yangtze River Delta region, China. Atmos. Environ. 168, 112–124. doi:10.1016/j.atmosenv.2017.08.035
Yan, Y. Y., Lin, J. T., Pozzer, A., Kong, S. F., and Lelieveld, J. (2019). Trend reversal from high-to-low and from rural-to-urban ozone concentrations over Europe. Atmos. Environ. 213, 25–36. doi:10.1016/j.atmosenv.2019.05.067
Yuan, B., Shao, M., Lu, S. H., and Wang, B. (2010). Source profiles of volatile organic compounds associated with solvent use in Beijing, China. Atmos. Environ. 44, 1919–1926. doi:10.1016/j.atmosenv.2010.02.014
Zhang, D., He, B., Yuan, M., Yu, S., Yin, S., and Zhang, R. (2021). Characteristics, sources and health risks assessment of VOCs in Zhengzhou, China during haze pollution season. J. Environ. Sci. 108, 44–57. doi:10.1016/j.jes.2021.01.035
Zhang, Y. L., Guo, H., Wang, X. M., Simpson, I. J., Barletta, B., and Blake, D. R., (2010). Emission patterns and spatiotemporal variations of halocarbons in the Pearl River Delta region, southern China. J. Geophys. Res. 115, D15309. doi:10.1029/2009jd013726
Zhang, Y. L., Wang, X. M., Zhang, Z., Lu, S. J., Shao, M., and Lee, F. S. C., (2013). Species profiles and normalized reactivity of volatile organic compounds from gasoline evaporation in China. Atmos. Environ. 79, 110–118. doi:10.1016/j.atmosenv.2013.06.029
Zhang, Y., Wang, X., Barletta, B., Simpson, I. J., Blake, D. R., and Fu, X., (2013). Source attributions of hazardous aromatic hydrocarbons in urban, suburban and rural areas in the Pearl River Delta (PRD) region. J. Hazard. Mat. 250-251, 403–411. doi:10.1016/j.jhazmat.2013.02.023
Zhang, Y., Yang, W., Simpson, I., Huang, X., Yu, J., Huang, Z., Wang, Z., and Zhang, Z. (2018). Decadal changes in emissions of volatile organic compounds (VOCs) from on-road vehicles with intensified automobile pollution control: Case study in a busy urban tunnel in south China. Environ. Pollut. 233, 806–819. doi:10.1016/j.envpol.2017.10.133
Zheng, J., Yu, Y., Mo, Z., Zhang, Z., Wang, X., Yin, S., Peng, K., Yang, Y., and Feng, X. (2013). Industrial sector-based volatile organic compound (VOC) source profiles measured in manufacturing facilities in the Pearl River Delta, China. Sci. Total Environ. 456-457, 127–136. doi:10.1016/j.scitotenv.2013.03.055
Zhong, Z., Sha, Q., Zheng, J., Yuan, Z., Gao, Z., Ou, J., Zheng, Z., and Li, C. (2017). Sector-based VOCs emission factors and source profiles for the surface coating industry in the Pearl River Delta region of China. Sci. Total Environ. 583, 19–28. doi:10.1016/j.scitotenv.2016.12.172
Zhou, J., You, Y., Bai, Z., Hu, Y., Zhang, J., and Zhang, N. (2011). Health risk assessment of personal inhalation exposure to volatile organic compounds in Tianjin, China. Sci. Total Environ. 409, 452–459. doi:10.1016/j.scitotenv.2010.10.022
Zhou, M. M., Jiang, W., Gao, W. D., Zhou, B. H., and Liao, X. C. (2020). A high spatiotemporal resolution anthropogenic VOC emission inventory for Qingdao City in 2016 and its ozone formation potential analysis. Process Saf. Environ. Prot. 139, 147–160. doi:10.1016/j.psep.2020.03.040
Keywords: volatile organic compounds, Jilin province, characteristics, ozone formation potential, cruise monitoring
Citation: Shang Y, Chen W, Bao Q, Yu Y, Pang X, Zhang Y, Guo L, Fu J and Feng W (2022) Characteristics and source profiles of atmospheric volatile organic compounds (VOCs) in the heavy industrial province of Northeast China with cruise monitoring. Front. Environ. Sci. 10:1055886. doi: 10.3389/fenvs.2022.1055886
Received: 28 September 2022; Accepted: 26 October 2022;
Published: 10 November 2022.
Edited by:
Biwu Chu, Research Center for Eco-environmental Sciences, CAS, ChinaReviewed by:
Yuan Cheng, Harbin Institute of Technology, ChinaNicholas Kiprotich Cheruiyot, Cheng Shiu University, Taiwan
Copyright © 2022 Shang, Chen, Bao, Yu, Pang, Zhang, Guo, Fu and Feng. This is an open-access article distributed under the terms of the Creative Commons Attribution License (CC BY). The use, distribution or reproduction in other forums is permitted, provided the original author(s) and the copyright owner(s) are credited and that the original publication in this journal is cited, in accordance with accepted academic practice. No use, distribution or reproduction is permitted which does not comply with these terms.
*Correspondence: Weiwei Chen, Y2hlbndlaXdlaUBpZ2EuYWMuY24=