 Haotian Zhang1
 Pengfei Tian1
 Chenliang Kang1
 Yumin Guo1Zeren Yu1Gefei Lu1Chenguang Tang1Tao Du1Jiayun Wang1Zhida Zhang1
 Xianjie Cao1Jiening Liang1
 Jinsen Shi1,2*
- 1Key Laboratory for Semi-Arid Climate Change of the Ministry of Education, College of Atmospheric Sciences, Lanzhou University, Lanzhou, China
- 2Collaborative Innovation Center for Western Ecological Safety, Lanzhou University, Lanzhou, China
The transport of air pollutants from areas surrounding the Tibetan Plateau (TP) has recently been studied. However, the major sources of atmospheric total suspended particulate matter (TSP) on the central TP remain unclear due to a lack of in-situ observations on aerosol physico-chemical properties. Therefore, to quantitatively investigate the physico-chemical properties and reveal the major sources of atmospheric aerosols, a comprehensive field campaign was conducted at the site of Nam Co from August 6 to September 11, 2020. Aerosol loading was low during the campaign with average TSP mass concentration, scattering coefficient at 550 nm, and absorption coefficient at 670 nm being 10.11 ± 5.36 μg m−3, 1.71 ± 1.36 Mm−1, and 0.26 ± 0.20 Mm−1, respectively. Organic matter (63.9%) and mineral dust (27.8%) accounted for most of the TSP mass concentrations. The average scattering Ångström exponent of 0.59 ± 0.14 reflected the influence of mineral dust, and the elemental fractions and the results of enrichment factor illustrated that crustal materials were the main contributors of mineral dust. The organic to elemental carbon ratio of 15.33 is probably caused by the aging that occurs during the transport of aerosols. The strong correlation between organic carbon and Ca2+ and the results of the electron microscopy analysis of single particles indicated that organic carbon and mineral dust had the same sources; however, the weak relation between mineral dust and wind speed indicated that local wind erosion was not the main contributor to the mineral dust. The potential source contribution function further illustrated that the summertime TSP in the central TP was mainly characterized by background biomass and mineral dust aerosols originating regionally from the ground within the TP.
Introduction
The Tibetan Plateau (TP), known as the “Third Pole,” covers a large area with altitudes of over 4000 km (Kang et al., 2010a; Yao et al., 2012; Bian et al., 2020). It is a region that exerts an important influence on weather, climate, environment, and ecosystems both regionally and globally (Qiu, 2008). Its unique topography (high altitude and lack of oxygen), relatively low population density, and low rate of industrialization make the TP a climate-sensitive region that facilitates studies on the interactions between natural and anthropogenic activities (Lawrence, 2011). Atmospheric aerosols directly and indirectly modulate the energy budget of the Earth-atmosphere system by scattering and absorbing solar radiation (Tian et al., 2018; IPCC, 2021). For example, small amounts of absorbing aerosols in this region may lead to greater warming because the troposphere is thinner over the plateau (Qiu, 2008).
A quantitative estimation of the radiative effects of atmospheric aerosols requires detailed information regarding their optical properties (such as the extinction and absorption coefficients and single scattering albedo), which are related to their size distribution and chemical composition. It is known that the elemental carbon (EC) of carbonaceous aerosols is the second largest contributor to global warming after CO2 (Ramanathan and Carmichael, 2008), and major water-soluble ions such as sulfate, nitrate, and ammonium have an impact on the hygroscopic quality and acidity of aerosols, which in turn affects aerosol optical properties (Lau et al., 2006; Pathak et al., 2009; Gao et al., 2011). Therefore, it is necessary to conduct field campaigns on atmospheric aerosols in the TP region to better understand their physico-chemical properties, conduct reasonable source analyses, and to accurately estimate their radiative effects.
Sources of atmospheric aerosols over the TP have been studied over the past few decades. Mountains with high altitudes are considered barriers to the transport of air pollutants from the surrounding regions (Wang and French, 1994). However, studies have suggested that transport of aerosols from the surrounding regions to the Tibetan Plateau occurs (Hindman and Upadhyay, 2002; Zheng et al., 2017; Dhungel et al., 2018; Xu J. et al., 2018; Zheng et al., 2020; Zhang L. et al., 2021; Li et al., 2021; Xiang et al., 2021). For example, it is known that during the pre-monsoon season, South Asia and West Asia are the main sources of pollutants from the Himalayas (Gul et al., 2022), and the results from a WRF-Chem model simulation indicated that black carbon (BC) emissions from residential areas in South Asia contributed the most to BC on the TP (Yang et al., 2020). In addition, field observations have shown that approximately 64.2% of the BC in the non-monsoon Qomolangma-Everest region originated in India and Nepal in South Asia (Xiang et al., 2021). However, carbon isotopic composition studies conducted at remote sites on the eastern TP have reflected an important local emissions contribution (Li et al., 2022). Other studies have revealed local emissions from urban vehicles and residential activities (Hu et al., 2017). Secondary aerosol formation has also been suggested to be an important aerosol source in the TP region (Wu et al., 2020).
The physico-chemical properties and composition of atmospheric aerosols have been the key focus of research conducted on plateaus. Previous research has shown that the main components of aerosols over plateaus are dust, BC, and sulfate/nitrate; however, the main composition varies based on location (Tian et al., 2017; Zhao et al., 2020). Field observations are essential to quantitatively study the physico-chemical properties of atmospheric aerosols. Despite the high altitude and harsh environment, attempts have been made to conduct field observations in the Tibetan Plateau. For example, the aerosol mass concentration and chemical species have been quantitatively estimated by collecting offline filter samples from different sites in the Tibetan Plateau region (Decesari et al., 2010; Zhao et al., 2013; Cong et al., 2015; Xu et al., 2015; Shang et al., 2018; Arun et al., 2019), and the concentrations and sources of black carbon in the TP region have been studied (Ming et al., 2010; Li et al., 2016; Li et al., 2017), and the chemical species of submicron aerosols have also been revealed using high-resolution time-of-flight aerosol mass spectrometry at a few sites (Xu et al., 2015; Zheng et al., 2017). Several field observation studies have also been conducted in the Central Highlands region. For example, the column aerosol optical properties were investigated using sun photometer measurements at Nam Co (Cong et al., 2009), and advanced instruments (Arun et al., 2019). Studies on aerosol elements (Cong et al., 2007; Li et al., 2007), analysis of sources of water-soluble organic carbon (Li et al., 2021), and studies on the effects of cow dung combustion aerosols on the local atmospheric environment have been conducted (Chen et al., 2015). However, combined in-situ observations of the physical parameters and chemical compositions are insufficient for making accurate calculations and analyzing the sources and the radiative effects (Zhang L. et al., 2021).
Although, the physical properties, chemical compositions, and sources of fine (PM2.5) and submicron (PM1) aerosols have been studied in detail within the TP region, those of total suspended particulate matter (TSP) remain unknown. In addition, most current studies on pollutant sources on the TP have focused on urban stations, and few observations of inland areas have been made, which limit our understanding of regional background atmospheric and aerosol sources on the TP. Therefore, to better understand the physico-chemical properties and reveal the sources of atmospheric aerosols in the central TP region, a comprehensive field campaign of the physical and chemical properties of TSP was conducted at Nam Co from August 6, 2020, to September 11, 2020.
Data and methodology
Site description
The experiments were conducted at the Nam Co Station for Multisphere Observation and Research, Chinese Academy of Sciences (30.46° N, 90.58° E, 4730 m.a.s.l.), which is located in the central region of the Tibetan Plateau and is a typical station of the area because of its high altitude, low anthropogenic activity, and absence of industry (Wu et al., 2018). The Nam Co region has typical geomorphological features, such as glaciers, lakes, rivers, and meadows (Figure 1), dominated by alpine meadows and barren areas. Nam Co Station is located southeast of Nam Co Lake, which is in the northern boundary of the Nyainqentanglha mountain range, and is the second largest inland lake in the Tibet Plateau (TP) region.
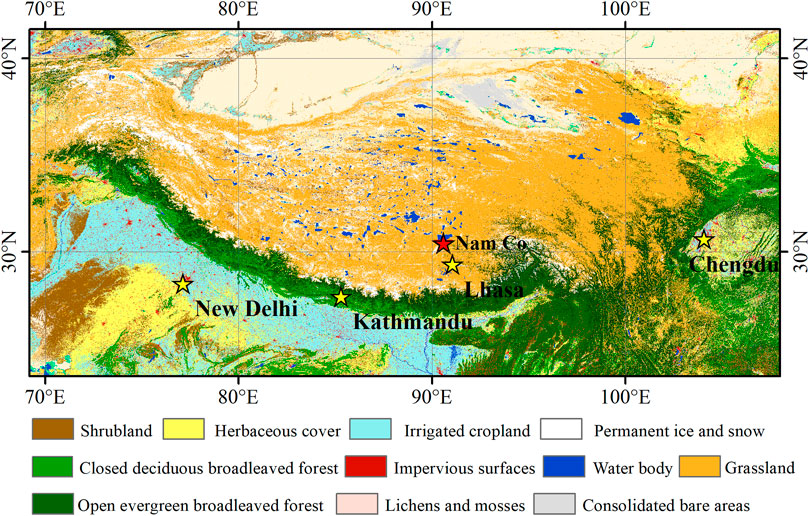
FIGURE 1. Nam Co Station (red), land cover data from the Global Land Cover with Fine Classification System at 30 m in 2020 (GLC_FCS30-2020) of the Institute of Spatial Information Innovation (Zhang et al., 2021b), Chinese Academy of Sciences.
The aerosol levels are very low at the Nam Co station (annual mean AOD of 0.029 at 500 nm) and the local population is also low (approximately 1000) because of the harsh climate; the population density within 25 km of the station is less than one person/km2 (Cong et al., 2009). The nearest town to the Nam Co station is Dangxiong, which is located approximately 70 km from the station (Xu J. et al., 2018). Pollutant transport from Lhasa and Dangxiong is limited by the high mountain ridges (Xu X. et al., 2018). Residents within the region use both simple stoves without chimneys and chimney stoves for cooking and heating, and cow dung is the only biomass fuel used in tents or houses in the region (Xiao et al., 2015). Pollution from anthropogenic sources is low, which makes this site ideal for studying the physicochemical properties of background atmospheric aerosols and pollution on the plateau associated with both natural and anthropogenic emissions. In spring, Nam Co Station is affected by dust transport from the upwind sand zone (Fang, 2004), and from June to September by the Indian monsoon system (Kang et al., 2010b). During the observation period, the overall climate was cold and windy, with southerly winds and northwesterly winds dominating during the night and day, respectively.
Online instrumentation
This experiment utilized a set of instruments with online observation capability at the Semi-Arid Climate and Environment Observatory of Lanzhou University (Supplementary Table S1) to conduct online observations of aerosols in the Nam Co region from August 6, 2020, to September 11, 2020. The instrument included a multi-angle absorption photometer (MAAP, model 5012), which can directly measure the concentration of black carbon at 670 nm. The absorption coefficient was calculated by measuring the absorption and scattering of light at 670 nm through the filter membrane. The detection limit of MAAP was 3.5 × 10⁻⁴ absorbance units, and the uncertainty of the absorbance was ±12% (Petzold and Schönlinner, 2004). Integrating a nephelometer (model 3563, TSI Inc.) can measure the scattering coefficients of atmospheric TSP at 450, 550, and 700 nm wavelengths online. The scattering angle of aerosols observed by the nephelometer ranged from 7° to 170°, with blind areas of <7° and >170°; therefore, the scattering coefficients observed by the instrument had truncation errors, which can be calibrated according to Anderson’s method (Anderson and Ogren, 1998). The uncertainty in the measurement of the air scattering coefficient for the integrating nephelometer was 0.24% (Anderson et al., 1996). All the online instruments were placed in a room at a temperature of approximately 20°C to ensure stable operation.
Offline instrumentation
TSP samples were collected approximately 2 m above the ground using a Laoshan Electronic Instrument Factory Model 2030 medium-flow air sampler and aerosol samples were collected on 90 mm quartz fiber filters (model 1851-090, Whatman Inc.). The sampling period was from August 5, 2020, to September 14, 2020, starting at 09:00 a.m., with a flow rate of 100 L/min for 47 h. The accuracy of sampling flow is no more than ±2%, the uncertainty of flow repeatability is less than 2%, and the uncertainty of flow stability is less than 5%. The total suspended particulate concentration is obtained from offline sampling data and is calculated as (weight of filter membrane after sampling - weight of filter membrane before sampling)/volume of gas flow at the time of collection. A total of 24 TSP samples and four blank samples were collected for this experiment.
The inorganic water-soluble ions (Na+, NH4+, K+, Ca2+, Mg2+, Cl−, NO3−, and SO42-) were determined with an ion chromatograph (Dionex ICS-600). Organic carbon (OC) and elemental carbon (EC) were measured using a Desert Research Institute Model 2001 thermo-optical carbon analyzer following the IMPROVE A program. Metallic elements (Ca, Al, Mg, Fe, and Ti) were measured using inductively coupled plasma atomic emission spectrometry (ICP-AES).
Calculation method
The extinction of aerosol particles, including scattering and absorption, can affect atmospheric visibility and climate (Ackerman et al., 2000). The particle single scattering albedo (SSA) is a key parameter used to study the optical and microphysical properties of atmospheric aerosols, and scattering (Bscat) and absorption coefficients (Babs) are two important optical parameters describing the scattering and absorption cross-sections per unit volume of air at wavelength λ. Where the sum of Bscatt and Babsis is the particle extinction coefficient (Bext), which determines light. The SSA is defined as the ratio of Bscat/Bext (Bodhaine, 1995
Therefore, in this study, the absorption and scattering coefficients at 670 nm were used to calculate the SSA.
The aerosol scattering Ångström index (αsp) was used to characterize the wavelength-dependent variation in the absorption coefficient σsp (Anderson and Ogren, 1998; Pandolfi et al., 2018), and it was calculated as follows,
where σsλ is the aerosol scattering coefficient at wavelength λ.
Potential source contribution function model
A (PSCF analysis was performed using the GIS-based software TrajStat, to estimate pollutant pathways by analyzing pollution trajectories at high concentrations, where Euclidean or angular distances were employed as a clustering model to identify potential pollutant source areas (Wang et al., 2009) using the following,
where ij is a grid point, nij indicates the total number of trajectory endpoints in that grid point, mij is the number of trajectory endpoints with pollutant concentration higher than the threshold value, and the median concentration is set as the threshold value in this study. After calculating the PSCF value, the weighting function was used to reduce the uncertainty caused by trajectories with fewer endpoints (Polissar, 1999). The meteorological field data were obtained from the Global Data Assimilation Forecast System used by the National Centers for Environmental Prediction Global Forecast System model. It is also possible to use a potential source factor analysis in the plateau region. Past studies have used the PSCF method to identify heavy metal sources in the Yaze region of the southeastern TP (Xu et al., 2022) and to analyze the potential source area of perfluoroalkyl acids in precipitation on the TP (Chen et al., 2021).
Enrichment factor
To determine the source of elements in aerosols, the EF of elements in aerosols relative to crustal material was calculated (Zoller et al., 1974). The EF of an element is defined as,
where x is the element of interest, R is the reference element, CX is the concentration of X, CR is the concentration of the reference element, EFX is the EF of X, and aerosol and crustal subscripts refer to the elements in aerosol samples and in the crust, respectively. Elements with an EF close to one are usually considered to be strongly influenced by natural components, whereas EF values greater than one indicate possible anthropogenic influences (Cong et al., 2007). A reference element is often selected as a crustal element, because the pollution level is low, aluminum (Al) was chosen as the reference element in the EF calculation in this study, and its average upper continental crustal component was chosen as the crustal element.
Results and discussion
Aerosol scattering and absorption properties
The mean values of the atmospheric aerosol scattering coefficients of TSP at 450, 550, and 700 nm during the observation period were 1.97 ± 1.63, 1.71 ± 1.36, and 1.50 ± 1.14 Mm−1, respectively. The mean SAE derived from the 450 nm and 700 nm scattering coefficients was 0.59 ± 0.14. The standard deviation of the scattering coefficients was large, and the diurnal variation showed a clear bimodal pattern (Figure 2A), with two peaks in the morning (06:00) and evening (19:00) and one trough in the afternoon. No peak was observed for the absorption coefficient at night.
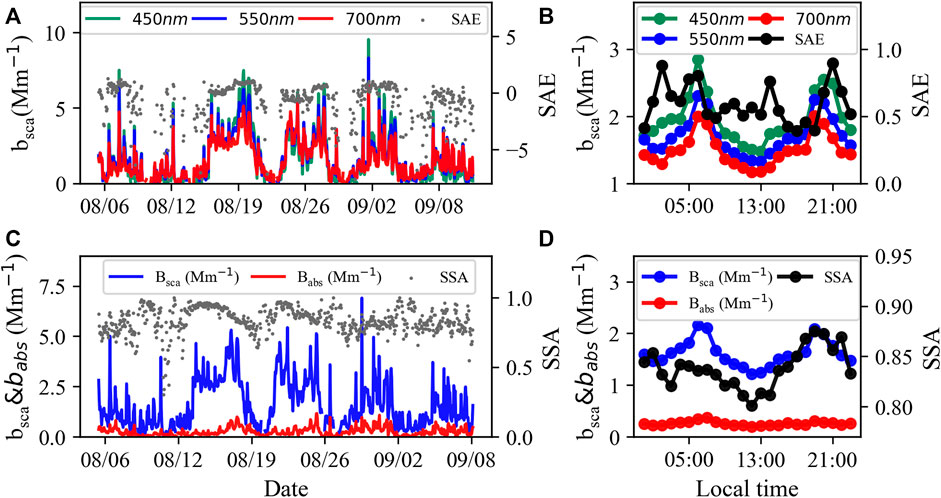
FIGURE 2. Time series of aerosol scattering coefficient and SAE at 450, 550 and 700 nm (A) and diurnal variation (B) time series of aerosol scattering coefficient, absorption coefficient and SSA at 670 nm (C) and diurnal variation (D).
The aerosol scattering Ångström index (SAE) is related to the average particle size of aerosols, and it ranges from 4 (Rayleigh atmosphere) to 0 (large particles), with negative values for large dust particles. The SAE of Gobi Desert aerosols is 0.52 ± 0.31 (Wang et al., 2018), and the SAE of the Granada region in Spain is 1.1 ± 0.03 for dust weather and 1.6 ± 0.03 for non-dust weather (Valenzuela et al., 2015). An East Asian tropospheric aerosol study in Beijing, China, showed that the SAE of dust, biomass burning, fresh (industrial) stack plume, other coal combustion pollution, and relatively clean (background) air are 0.59 ± 0.41, 1.52 ± 0.18, 1.49 ± 0.11, 1.39 ± 0.20, and 1.58 ± 0.18, respectively (Yang et al., 2009). The SAE for biomass combustion and relatively clean (background) air are similar. The SAE in this study was similar to that of sand aerosols, and this shows that mineral dust (MD) at the Nam Co station is likely the largest contributor to the SAE.
The average particle single scattering albedo (SSA) of TSP was 0.84 ± 0.02 at 670 nm, and the average absorption and scattering coefficients of TSP at this wavelength were 0.26 ± 0.20 Mm−1 and 1.61 ± 1.18 Mm−1, respectively. The wavelength dependence of SSA depends on the particle size, chemical composition, and mixing state (Gyawali et al., 2012). In general, the SSA of urban aerosols ranges from 0.80 to 0.98 and that of fresh biomass combustion smoke ranges from 0.72 to 0.88. Fine mode aerosols measured using an aircraft were found to have moderate absorption (single scattering albedo at 550 nm of 0.88 ± 0.03) and moderate hygroscopicity, whereas coarse-mode dust was found to have very low absorption (SSA = 0.96 ± 0.01) and almost no hygroscopicity (Anderson, 2003). Thus, the SSA in the present study was representative of a mixture of fresh biomass burning and coarse-mode dust. From the diurnal variation, SSA reached the lowest value at 12:00 and showed an increasing trend from 16:00 to 20:00, but was still less than 0.85 (Figure 2D). This was probably due to the anthropogenic activities in the area that generated the burning of fresh biomass, which increased the SSA.
Aerosol chemical compositions
The optical properties of aerosols at the Nam Co station, the influence of dust aerosols on the region was large, but the composition of aerosols in the central plateau was complex; Optical properties alone were not enough to explain the aerosol composition. To clarify the components, nature, and sources of aerosols in the Nam Co region, off-line sampling was conducted in the region for 1 month, and the chemical composition of the collected aerosol samples was analyzed. During the study period, the mean mass concentration of TSP in the region was 10.11 ± 5.36 μg m−3, whereas that measured in the Himalayas was 20.65 ± 11.17 μg m−3 (Arun et al., 2019), and that measured at the Shiquanhe station in the Ali region was 15.71 ± 5.92 μg m−3 (Zhang L. et al., 2021). The Nam Co station is located, at a higher altitude than other areas on the Tibetan Plateau (TP), and there is no industrial activity in the surrounding region. The TSP concentration was lower than that at other areas on the TP; however, this could be attributed to the surrounding mountains hindering aerosol transport. A low TSP concentration was characteristic of the TP region, which is characterized by low background pollution and sensitive changes. Therefore, studying the aerosol composition and sources in this region can help to clarify the effects of natural and anthropogenic emissions and external transport within the central TP.
Carbonaceous aerosols are an important component of atmospheric aerosols and consist of elemental carbon and organic carbon, which affect the incident solar radiation by scattering and absorption (Sun et al., 2007). OC can be either released directly into the atmosphere from anthropogenic and biogenic sources, and biomass combustion, and secondary formation in the atmosphere, whereas EC is mainly derived from biomass and incomplete combustion of fossil fuels (Pachauri et al., 2013). Owing to the remote location and high altitude of the Tibet Plateau, carbonaceous aerosols may have significant climatic impacts in this region. The average mass concentrations of OC and EC at Nam Co station in the summer were 1.84 ± 0.83 and 0.12 ± 0.13 μg m−3, (Figure 3A) respectively.
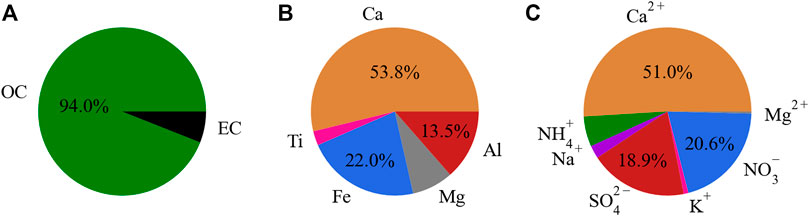
FIGURE 3. The relative mass contributions of mass concentrations of (A) OC, EC, (B) metallic elements, and (C) WSII.
OC/EC ratios are often used to distinguish the relative contributions of fossil fuel or biomass combustion sources, where lower OC/EC ratios (<2.0) are characteristic of a higher share of vehicle and industrial emissions. OC/EC ratios of 3.8–13.2 indicate the predominance of biomass combustion, a greater abundance of carbonaceous aerosols in OC from biomass combustion sources, results in much higher OC/EC values. The value of OC/EC in the Nam Co area in this study was 15.33, which is much higher than that in Lhasa (6.5), an urban plateau (Zhang et al., 2008), and that at the Yulong Snow Mountain station on the southern slope of the plateau (2.06) (Niu et al., 2018). Higher OC/EC values indicate a more significant impact of biomass burning in the region, and because the study site is located in a near-pristine environment, local residential emissions in the area may be an important contributor to biomass burning. The relatively similar OC/EC values of cow dung aerosols in the Nam Co area also indicate that the local source is not negligible (Chen et al., 2015). On the other hand, the aging that occurs with the transport process of aerosols also increases the OC/EC values (Arun et al., 2019). In addition, a higher OC/EC (>2.0) is generally considered to indicate the presence of secondary organic aerosols (SOA) (Chow et al., 1996). Therefore, biomass aerosols in the region are likely to be dominated by combustion emissions from the generation of OC and the secondary generation of aerosols.
Previous studies have considered that mineral dust was considered one of the main aerosol components in the central Himalayas (Decesari et al., 2010) and in the central TP (Cong et al., 2007; Kang et al., 2016). The mean mass concentrations of metallic elements Ca, Ti, Fe, Al, and Mg measured in the present study were 0.27 ± 0.17, 0.014 ± 0.02, 0.11 ± 0.07, 0.067 ± 0.05, and 0.039 ± 0.03 μg m−3, respectively. Ca accounted for the majority of the metallic elements by mass (53.8%), followed by Fe (22.0%), Al (13.5%), Mg (7.9%), and Ti (2.8%). Everest station has 34.8% of Fe and 23.1% of Ca as metallic elements (Arun et al., 2019). Ca, Fe, and Si are major fractions of crustal elements; the values obtained for Ca and Fe in this study prove that Nam Co station is similar to Everest station and mineral dust is an important component of aerosols in the region.
The EFs of each element in the TSP samples from the Nam Co station are shown in Figure 4. The EFs of Al, Ti and K were approximately one, which indicates that they were primarily derived from natural sources, such as soil and dust. However, the values of Cu, Zn, and Sb were significantly higher (Buzica et al., 2006, which indicates that some of these elements may have originated from human activities, such as fossil fuel combustion, industrial metallurgical processes, and traffic emissions, and that they may have been deposited in the Nam Co region via long-distance transport.
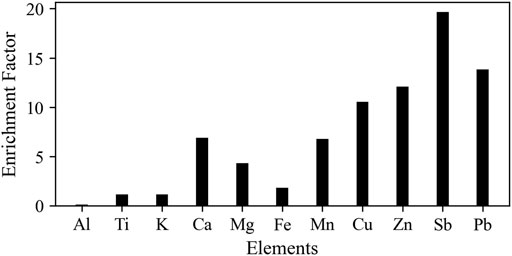
FIGURE 4. Enrichment factors of various elements during the study period.
K+, Mg2+, and Ca2+ are the main components of atmospheric aerosols, and their contribution to PM2.5 (particulate matter with an aerodynamic diameter ≤2.5 µm) can reach 77% (Xu et al., 2019). In the present study, the mean mass concentrations of SO42-, NO3−, Mg2+, Ca2+, NH4+, Na+, and K+ were 0.70 ± 0.38, 0.77 ± 0.22, 0.01 ± 0.01, 1.90 ± 0.83, 0.22 ± 0.15, 0.09 ± 0.04, and 0.03 ± 0.02 μg m−3, respectively. The main contributions of the inorganic ions were Ca2+ (51.0%), NO3− (20.6%), SO42- (18.9%), and NH4+(5.8%). The main ion sources in the central plateau have been identified in previous studies; for example, SO42- and Ca2+ are considered typical ions from combustion emissions and mineral dust, respectively (Kang et al., 2010b). Compared to the Nepal Climate Observatory-Pyramid Station (Decesari et al., 2010) on the southern slope of the Himalayas, where the Ca2+ concentration during the monsoon was 0.34 μg m−3, The relative concentration of Ca2+ in the TSP samples in this study (1.90 ± 0.83 μg m−3) was higher than that in the Nepal Climate Observatory-Pyramid Station (0.50 μg m−3) and that at the Everest station during the monsoon (Cong et al., 2015), reflecting a heavier dust impact in the central plateau. Furthermore, the higher mass concentrations of SO42- and NO3− indicate that anthropogenic combustion emissions have less of an impact than dust emissions on the central plateau.
Discussion on aerosol sources
To clarify the composition of aerosols at the Nam Co station and further analyze the source of aerosols in the region, a reconstruction of the mass concentration of aerosols at the Nam Co station was conducted using organic matter (OM), EC, MD, and water-soluble inorganic ions (nd-WSII) of non-sand dust. The water-soluble inorganic ion concentration of non-sand dust was the sum of the SO42-, NO3−, NH4+, and K+ concentrations. It is necessary to determine the OM/OC ratio of to calculate the OM mass concentration (Guinot et al., 2007), and that measured at the Nam Co station from May to July 2015 was 2.28 (Xu J. et al., 2018); as this study was conducted within a relatively short time period (August to September 2020), the OM/OC value of 2.28 was used to calculate the OM mass.
Calculations of the MD concentration are commonly more accurate when multiple metallic and nonmetallic elements are combined with weighting factors (Marcazzan et al., 2001), and the equation for MD was thus revised to consider the effect of carbonates present in ionic equilibrium (Zhang L. et al., 2021).
where [Si] = 4 [Al] (Wang et al., 2018), [K] = 0.6 [Fe] (Malm et al., 1994), and the factor 1.15 represents the mass of the other metal oxides that compensate for not being measured. The mass concentration of MD in the region was calculated using this equation was 1.02 μg m−3, whereas that at Shiquanhe station in the Ali region was 4.61 μg m−3, the mass MD concentration measured at a background site in the western Himalayas was 3.1 μg m−3 (Arun et al., 2019).
The reconstructed mass concentrations correlated well with the measured mass (Supplementary Figure S1). Concentrations of r = 0.89 indicated that the reconstructed mass concentrations were reasonable, and reconstructed mass concentrations of OM, EC, MD, and nd-WSII were 4.20 ± 1.90, 0.12 ± 0.13, 1.83 ± 1.24, and 0.42 ± 0.15 μg·m-3, respectively, with the largest contribution from OM (63.9%), followed by MD (27.8%), and the smallest contribution (Figure 5) from EC (1.8%).
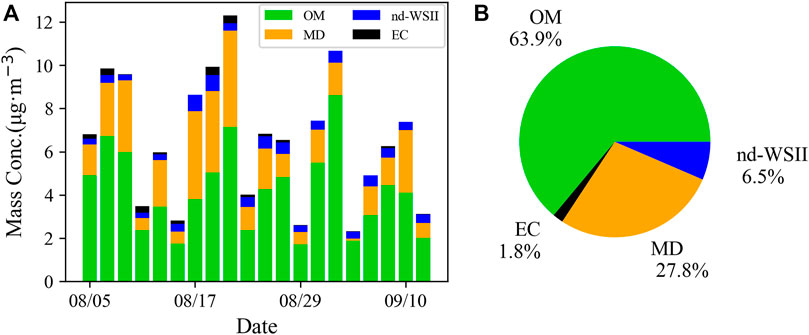
FIGURE 5. (A) The time series of mass concentrations of OM, EC, nd-WSII, and MD; (B) Proportion of each component of reconstructed mass concentration.
To better understand the sources of aerosols on the central plateau, the correlations between aerosol chemicals were investigated. K+ is a tracer of biomass combustion emissions (Zhang et al., 2018); EC had almost no linear correlation with K+ (r = −0.06), while OC had a higher correlation coefficient with K+ (r = 0.22) (Figure 6C). Because K+ is often considered to come from plant burning, the weak correlation between OC and K+ may be since most of the biomass aerosols in the region come from cattle dung burning or exotic transport. Ca2+ is often used as a tracer of mineral dust and represents the influence of mineral dust, with a correlation of 0.32 between OC and Ca2+ was measured at the Shiquanhe station in the Ali region during summer (Supplementary Figure S2) and only a slight correlation measured year-round at the eastern Himalayas remote high-altitude station (Arun et al., 2019). The correlation between WSOC and Ca2+ was measured by year-round offline sampling at the Nam Co station was 0.59 (Li et al., 2021). The strong correlation between OC and Ca2+ and Ca in this study indicates that they are homologous.
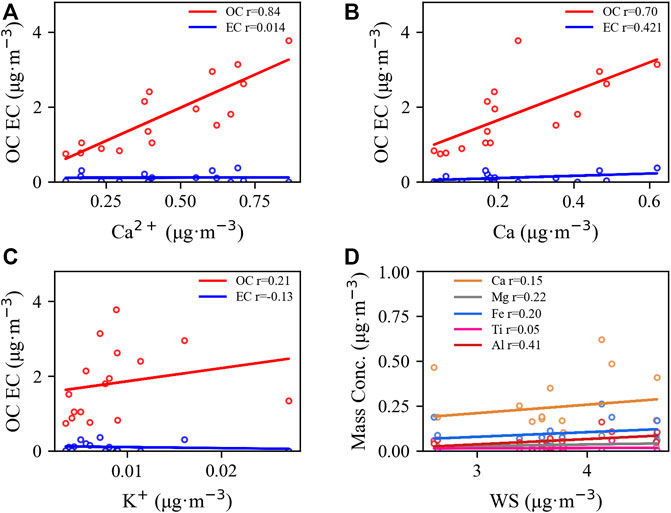
FIGURE 6. (A) Fitting curves of OC, EC, and K+; (B) Fitting curves of OC, EC, and Ca; (C) Fitting curves of OC, EC, and Ca2+; (D) Fitting curves of WS and metallic elements.
To verify whether the MD aerosols in the region were dominated by local influences, a metal elements and wind speed correlation analysis was conducted and the results showed a very low correlation coefficient between the two. When the wind speed increased, the metal element concentration increased, but the results were not significantly, indicating that the aerosol impact of the local wind-induced sand rising on the Nam Co station is small. According to previous studies at the Nam Co station, the size distribution of OC and EC concentrations showed a bimodal variation, with the main peak of OC occurring in coarse particles, which may be due to dust particles and bioaerosols, whereas the main peak of EC in coarse particles may be caused by the resuspension of soil/dust particles containing EC (Wan et al., 2015). Another study also suggested that WSOC in the TSP during the monsoon period is influenced by fine surface soil particles within the TP (Li et al., 2021). Therefore, the same source of OC and Ca at the Nam Co station indicates that OC is primarily derived from soil OM transported with dust.
Single-particle sampling was conducted from August 16 to 18, 2020 using a DKL-2 single-particle sampler. The results showed (Figure 7) that during the sampling period, OM and MD accounted for 53.7% and 14.3% of particles, respectively. In addition, mixed particles of dust and biomass were observed (Supplementary Figure S4), which also provides evidence for the homology between biomass aerosols and dust.
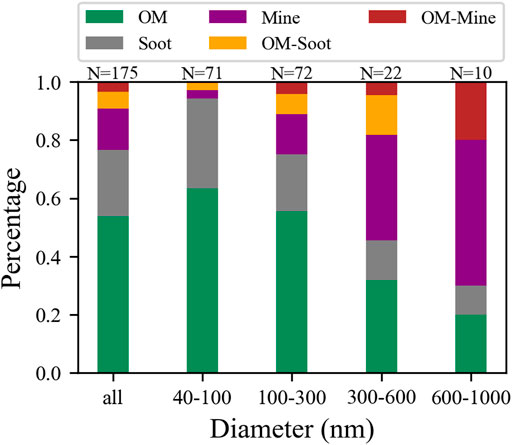
FIGURE 7. Composition ratios of collected single particle aerosols of different particle sizes.
To determine the sources of OC and Ca, the potential source regions of both components were analyzed using PSCF (Figure 8). The higher PSCF values in the interior of the plateau indicated that OC and Ca had similar source area distributions, and both originated primarily from the interior of the plateau, which explains the high correlation between OC and Ca in the TSP. Some studies have also suggested that dust from the Ali region of the plateau can be transported to the central part of the southern section. The strong influence of local emissions from the southeastern part of the plateau can also be demonstrated using isotope-tracing methods. These results also prove the non-negligible presence of local emission sources in the plateau region.
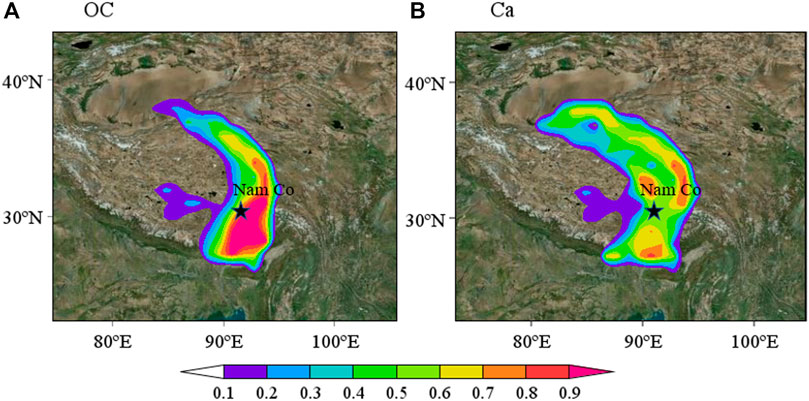
FIGURE 8. Potential source regions of OC (A) and Ca (B) in aerosols at Nam Co.
Summary and conclusions
This study studied the optical properties, chemical composition, and sources of total suspended particulate matter (TSP) at the Nam Co station in the central Tibetan Plateau (TP) region. The main results of this study are as follows:
1) The mean mass concentration of TSP was 10.11 ± 5.36 μg m−3, the mean single scattering albedo (SSA) was 0.84 ± 0.09, and the mean aerosol scattering Ångström index (SAE) was 0.59 ± 0.14. The SAE of mineral dust aerosols was relatively close, indicating that aerosols in the Nam Co area are affected by sand; however, dust lowers the SAE.
2) The average mass concentrations of organic carbon (OC) and elemental carbon (EC) were 1.84 ± 0.83 μg m−3 and 0.12 ± 0.13 μg m−3, respectively, and the mass concentration of carbonaceous aerosols was dominated by OC, which accounted for 94% of the total carbon (TC). In addition, the EC content was low, which indicated that the biomass aerosols in the region were primarily composed of OC and the secondary generation of aerosols. The OC/EC ratio of 15.33 is probably caused by the aging that occurs during the transport of aerosols.
3) Of the metallic elements, calcium accounted for most of the metallic elements by mass (53.8%), followed by iron (22.0%), and aluminum (13.5%), with mean mass concentrations of 0.27 ± 0.17 μg m−3, 0.11 ± 0.07 μg m−3, and 0.067 ± 0.05 μg m−3, respectively. This suggests that crustal materials are the main contributors to the TSP in this region. The enrichment factor EF of elements such as Al, Ti and K was approximately one, indicating that the natural sources in the Nam co region are a major source of aerosols. And the EF values of elements such as Cu, Zn and Sb were obviously high, which shows that pollution from human activities may reach the area through long-distance transport.
4) With respect to the composition of water-soluble ions, Ca2+ comprised the largest inorganic ion concentration (51.0%), followed by NO3− (20.6%), and SO42- (18.9%), with average mass concentrations of 1.90 ± 0.83 μg m−3, 0.77 ± 0.22 μg m−3, and 0.70 ± 0.38 μg m−3, which reflects the influence of heavy mineral dust on the central part of the plateau and indicates that the influence of natural dust in the region is greater than that of anthropogenic fossil fuel combustion.
5) Based on the offline sampling mass reconstruction of aerosols at the Nam Co station, the mass concentrations of organic matter (OM), elemental carbon (EC), sand dust (MD), and water-soluble ions (nd-WSII) removed from sand dust were 4.20 ± 1.90, 0.12 ± 0.13 μg m−3, 1.83 ± 1.24 μg m−3, and 0.42 ± 0.15 μg m−3, respectively, with the largest contribution from OM (63.9%), followed by MD (27.8%) and the smallest contribution from EC (1.8%). Therefore, OM and MD accounted for 91.7% of the TSP mass and were the main components of summer TSP in the Nam Co region.
6) The correlation coefficient between OC and K+ was low (r = 0.22), and this was probably due to the low percentage of plant material being burned in the area. The strong correlation between OC and Ca2+ indicated that OM and MD had the same sources, and the electron microscopy images of single particles also showed the mixed transport of biomass with sand and dust. The low correlation between metal elements and wind speed indicated that the TSP did not originate locally, and the PSCF analysis illustrated that OM and mineral dust originated within the TP.
Based on the results of this study, we can conclude that the summertime TSP in the central TP is primarily characterized by background biomass and mineral dust aerosols originating regionally from the ground within the TP. These results provide a better understanding of atmospheric aerosols and will contribute to estimations of aerosol radiative effects on the TP. However, future studies are required to quantitatively estimate the contribution of internal and external sources of atmospheric aerosols in the TP region.
Data availability statement
The datasets presented in this study can be found in online repositories. The names of the repository/repositories and accession number(s) can be found below: https://data.tpdc.ac.cn/zh-hans/data/2f32c881-3ed0-45c3-83c8-86fc2a5deddb/.
Author contributions
HZ: Methodology, Software, Validation, Data Curation, Visualization, Formal analysis, Writing—Original Draft, Writing—Review and Editing. PT: Conceptualization, Funding acquisition, Supervision, Investigation, Validation, Formal analysis, Resources, Project administration, Writing—Original Draft, Writing—Review and Editing. CK: Data Curation, Investigation. YG: Data Curation, Investigation. ZY: Data Curation, Investigation. GL: Data Curation, Investigation. CT: Investigation. TD: Investigation. JW: Investigation. ZZ: Investigation. XC: Investigation, Supervision JL: Investigation, Supervision JS: Data curation, Resources, Project administration. Conceptualization, Funding acquisition, Supervision, Investigation, Validation, Formal analysis, Resources, Project administration, Writing—Original Draft, Writing—Review and Editing.
Funding
This research was supported by the Second Tibetan Plateau Scientific Expedition and Research Program (STEP), Grant no. 2019QZKK0602. PT was also funded by the National Natural Science Foundation of China (42175093 and 41905017).
Acknowledgments
We would like to thank the staff of Nam Co Station for Multisphere Observation and Research and Chinese Academy of Sciences for their help during the field campaign. The Semi-Arid Climate and Environment Observatory of Lanzhou University (SACOL) is acknowledged for the mobile aerosol observation system. The original data used in this research are available at the National Tibetan Plateau Data Center (https://data.tpdc.ac.cn/en/).
Conflict of interest
The authors declare that the research was conducted in the absence of any commercial or financial relationships that could be construed as a potential conflict of interest.
Publisher’s note
All claims expressed in this article are solely those of the authors and do not necessarily represent those of their affiliated organizations, or those of the publisher, the editors and the reviewers. Any product that may be evaluated in this article, or claim that may be made by its manufacturer, is not guaranteed or endorsed by the publisher.
Supplementary material
The Supplementary Material for this article can be found online at: https://www.frontiersin.org/articles/10.3389/fenvs.2022.1055673/full#supplementary-material
References
Ackerman, A. S., Toon, O. B., Stevens, D. E., Heymsfield, A. J., Ramanathan, V. V., and Welton, E. J. (2000). Reduction of tropical cloudiness by soot. Science 288, 1042–1047. doi:10.1126/science.288.5468.1042
Anderson, T. L., Covert, D. S., Marshall, S. F., Laucks, M. L., Charlson, R. J., Waggoner, A. P., et al. (1996). Performance characteristics of a high-sensitivity, three-wavelength, total scatter/backscatter nephelometer. J. Atmos. Ocean. Technol. 13 (5), 967–986. doi:10.1175/1520-0426(1996)013<0967:pcoahs>2.0.co;2
Anderson, T. L., and Ogren, J. A. (1998). Determining aerosol radiative properties using the TSI 3563 integrating nephelometer. Aerosol Sci. Technol. 29, 57–69. doi:10.1080/02786829808965551
Anderson, T. L. (2003). Variability of aerosol optical properties derived from in situ aircraft measurements during ACE-Asia. J. Geophys. Res., 108(D23). doi:10.1029/2002jd003247
Arun, B. S., Aswini, A. R., Gogoi, M. M., Hegde, P., Kumar Kompalli, S., Sharma, P., et al. (2019). Physico-chemical and optical properties of aerosols at a background site (∼4 km a.s.l.) in the Western Himalayas. Atmos. Environ. 218, 117017. doi:10.1016/j.atmosenv.2019.117017
Bian, J., Li, D., Bai, Z., Li, Q., Lyu, D., and Zhou, X. (2020). Transport of Asian surface pollutants to the global stratosphere from the Tibetan Plateau region during the Asian summer monsoon. Natl. Sci. Rev. 7, 516–533. doi:10.1093/nsr/nwaa005
Bodhaine, B. A. (1995). Aerosol absorption measurements at barrow, mauna loa and the south pole. J. Geophys. Res. 100, 8967. doi:10.1029/95jd00513
Buzica, D., Gerboles, M., Borowiak, A., Trincherini, P., Passarella, R., and Pedroni, V. (2006). Comparison of voltammetry and inductively coupled plasma-mass spectrometry for the determination of heavy metals in PM10 airborne particulate matter. Atmos. Environ. 40, 4703–4710. doi:10.1016/j.atmosenv.2006.04.015
Chen, M., Wang, C., Gao, K., Wang, X., Fu, J., Gong, P., et al. (2021). Perfluoroalkyl substances in precipitation from the Tibetan Plateau during monsoon season: Concentrations, source regions and mass fluxes. Chemosphere 282, 131105. doi:10.1016/j.chemosphere.2021.131105
Chen, P., Kang, S., Bai, J., Sillanpää, M., and Li, C. (2015). Yak dung combustion aerosols in the Tibetan Plateau: Chemical characteristics and influence on the local atmospheric environment. Atmos. Res. 156, 58–66. doi:10.1016/j.atmosres.2015.01.001
Chow, J. C., Watson, J. G., Lu, Z., Lowenthal, D. H., Frazier, C. A., Solomon, P. A., et al. (1996). Descriptive analysis of PM2.5 and PM10 at regionally representative locations during SJVAQS/AUSPEX. Atmos. Environ. 30, 2079–2112. doi:10.1016/1352-2310(95)00402-5
Cong, Z., Kang, S., Kawamura, K., Liu, B., Wan, X., Wang, Z., et al. (2015). Carbonaceous aerosols on the south edge of the Tibetan plateau: Concentrations, seasonality and sources. Atmos. Chem. Phys. 15, 1573–1584. doi:10.5194/acp-15-1573-2015
Cong, Z., Kang, S., Liu, X., and Wang, G. (2007). Elemental composition of aerosol in the Nam Co region, Tibetan Plateau, during summer monsoon season. Atmos. Environ. 41, 1180–1187. doi:10.1016/j.atmosenv.2006.09.046
Cong, Z., Kang, S., Smirnov, A., and Holben, B. (2009). Aerosol optical properties at Nam Co, a remote site in central Tibetan Plateau. Atmos. Res. 92, 42–48. doi:10.1016/j.atmosres.2008.08.005
Decesari, S., Facchini, M. C., Carbone, C., Giulianelli, L., Rinaldi, M., Finessi, E., et al. (2010). Chemical composition of PM&lt;sub&gt;10&lt;/sub&gt; and PM&lt;sub&gt;1&lt;/sub&gt; at the high-altitude Himalayan station Nepal Climate Observatory-Pyramid (NCO-P) (5079 m a.s.l.). Atmos. Chem. Phys. 10, 4583–4596. doi:10.5194/acp-10-4583-2010
Dhungel, S., Kathayat, B., Mahata, K., and Panday, A. (2018). Transport of regional pollutants through a remote trans-Himalayan valley in Nepal. Atmos. Chem. Phys. 18 (2), 1203–1216. doi:10.5194/acp-18-1203-2018
Fang, X. (2004). Dust storms and loess accumulation on the Tibetan plateau: A case study of dust event on 4 march 2003 in Lhasa. Chin. Sci. Bull. 49, 953. doi:10.1360/03wd0180
Gao, X., Yang, L., Cheng, S., Gao, R., Zhou, Y., Xue, L., et al. (2011). Semi-continuous measurement of water-soluble ions in PM2.5 in Jinan, China: Temporal variations and source apportionments. Atmos. Environ. 45, 6048–6056. doi:10.1016/j.atmosenv.2011.07.041
Guinot, B., Cachier, H., and Oikonomou, K. (2007). Geochemical perspectives from a new aerosol chemical mass closure. Atmos. Chem. Phys. 7, 1657–1670. doi:10.5194/acp-7-1657-2007
Gul, C., Kang, S., Puppala, S. P., Wu, X., He, C., Xu, Y., et al. (2022). Measurement of light-absorbing particles in surface snow of central and Western himalayan glaciers: Spatial variability, radiative impacts, and potential source regions. Atmos. Chem. Phys. 22 (13), 8725–8737. doi:10.5194/acp-22-8725-2022
Gyawali, M., Arnott, W. P., Zaveri, R. A., Song, C., Moosmüller, H., Liu, L., et al. (2012). Photoacoustic optical properties at UV, VIS, and near IR wavelengths for laboratory generated and winter time ambient urban aerosols. Atmos. Chem. Phys. 12, 2587–2601. doi:10.5194/acp-12-2587-2012
Hindman, E. E., and Upadhyay, B. P. (2002). Air pollution transport in the Himalayas of Nepal and Tibet during the 1995–1996 dry season. Atmos. Environ. 36 (4), 727–739. doi:10.1016/s1352-2310(01)00495-2
Hu, Z., Kang, S., Li, C., Yan, F., Chen, P., Gao, S., et al. (2017). Light absorption of biomass burning and vehicle emission-sourced carbonaceous aerosols of the Tibetan Plateau. Environ. Sci. Pollut. Res. 24, 15369–15378. doi:10.1007/s11356-017-9077-3
IPCC (2021). Climate change 2021: The physical science basis. Contribution of working group I to the sixth assessment report of the intergovernmental panel on climate change S. L. Connors, C. Péan, S. Berger, N. Caud, Y. Chen, L. Goldfarb, M. I. Gomis, M. Huang. Cambridge: Cambridge University Press.
Kang, S., Chen, P., Li, C., Liu, B., and Cong, Z. (2016). Atmospheric aerosol elements over the inland Tibetan plateau: Concentration, seasonality, and transport. Aerosol Air Qual. Res. 16, 789–800.
Kang, S., Xu, Y., You, Q., Flügel, W.-A., Pepin, N., and Yao, T. (2010a). Review of climate and cryospheric change in the Tibetan Plateau. Environ. Res. Lett. 5, 015101. doi:10.1088/1748-9326/5/1/015101
Kang, S., Zhang, Y., Zhang, Y., Grigholm, B., Kaspari, S., Qin, D., et al. (2010b). Variability of atmospheric dust loading over the central Tibetan Plateau based on ice core glaciochemistry. Atmos. Environ. 44, 2980–2989. doi:10.1016/j.atmosenv.2010.05.014
Lau, K. M., Kim, M. K., and Kim, K. M. (2006). Asian summer monsoon anomalies induced by aerosol direct forcing: The role of the Tibetan plateau. Clim. Dyn. 26, 855–864. doi:10.1007/s00382-006-0114-z
Lawrence, M. G. (2011). Asia under a high-level Brown cloud. Nat. Geosci. 4, 352–353. doi:10.1038/ngeo1166
Li, C., Bosch, C., Kang, S., Andersson, A., Chen, P., Zhang, Q., et al. (2016). Sources of black carbon to the Himalayan-Tibetan Plateau glaciers. Nat. Commun. 7, 12574. doi:10.1038/ncomms12574
Li, C., Kang, S., and Cong, Z. (2007). Elemental composition of aerosols collected in the glacier area on Nyainqêntanglha Range, Tibetan Plateau, during summer monsoon season. Chin. Sci. Bull. 52, 3436–3442. doi:10.1007/s11434-007-0445-0
Li, C., Yan, F., Kang, S., Chen, P., Han, X., Hu, Z., et al. (2017). Re-Evaluating black carbon in the Himalayas and the Tibetan plateau: Concentrations and deposition. Atmos. Chem. Phys. 17 (19), 11899–11912. doi:10.5194/acp-17-11899-2017
Li, C., Zhang, C., Yan, F., Kang, S., Xu, Y., Liu, Y., et al. (2022). Importance of local non-fossil sources to carbonaceous aerosols at the eastern fringe of the Tibetan plateau, China: Δ14C and δ13C evidences. Environ. Pollut. 311, 119858. doi:10.1016/j.envpol.2022.119858
Li, Y., Yan, F., Kang, S., Zhang, C., Chen, P., Hu, Z., et al. (2021). Sources and light absorption characteristics of water-soluble organic carbon (WSOC) of atmospheric particles at a remote area in inner Himalayas and Tibetan Plateau. Atmos. Res. 253, 105472. doi:10.1016/j.atmosres.2021.105472
Marcazzan, G. M., Vaccaro, S., Valli, G., and Vecchi, R. (2001). Characterisation of PM10 and PM2.5 particulate matter in the ambient air of Milan (Italy). Atmos. Environ. 35, 4639–4650. doi:10.1016/s1352-2310(01)00124-8
Ming, J., Xiao, C., Sun, J., Kang, S., and Bonasoni, P. (2010). Carbonaceous particles in the atmosphere and precipitation of the Nam Co region, central Tibet. J. Environ. Sci. 22 (11), 1748–1756. doi:10.1016/s1001-0742(09)60315-6
Niu, H., Kang, S., Wang, H., Zhang, R., Lu, X., Qian, Y., et al. (2018). Seasonal variation and light absorption property of carbonaceous aerosol in a typical glacier region of the southeastern Tibetan Plateau. Atmos. Chem. Phys. 18, 6441–6460. doi:10.5194/acp-18-6441-2018
Pachauri, T., Singla, V., Satsangi, A., Lakhani, A., and Kumari, K. M. (2013). Characterization of carbonaceous aerosols with special reference to episodic events at Agra, India. Atmos. Res. 128, 98–110. doi:10.1016/j.atmosres.2013.03.010
Pandolfi, M., Alados-Arboledas, L., Alastuey, A., Andrade, M., Angelov, C., Artiñano, B., et al. (2018). A European aerosol phenomenology – 6: Scattering properties of atmospheric aerosol particles from 28 ACTRIS sites. Atmos. Chem. Phys. 18, 7877–7911. doi:10.5194/acp-18-7877-2018
Pathak, R. K., Wu, W. S., and Wang, T. (2009). Summertime PM&lt;sub&gt;2.5&lt;/sub&gt; ionic species in four major cities of China: Nitrate formation in an ammonia-deficient atmosphere. Atmos. Chem. Phys. 9, 1711–1722. doi:10.5194/acp-9-1711-2009
Petzold, A., and Schönlinner, M. (2004). Multi-angle absorption photometry—A new method for the measurement of aerosol light absorption and atmospheric black carbon. J. Aerosol Sci. 35 (4), 421–441. doi:10.1016/j.jaerosci.2003.09.005
Polissar, A. (1999). The aerosol at barrow, Alaska: Long-term trends and source locations. Atmos. Environ. 33, 2441–2458. doi:10.1016/s1352-2310(98)00423-3
Ramanathan, V., and Carmichael, G. (2008). Global and regional climate changes due to black carbon. Nat. Geosci. 1, 221–227. doi:10.1038/ngeo156
Shang, D., Hu, M., Zheng, J., Qin, Y., Du, Z., Li, M., et al. (2018). Particle number size distribution and new particle formation under the influence of biomass burning at a high altitude background site at Mt. Yulong (3410 m), China. Atmos. Chem. Phys. 18 (21), 15687–15703. doi:10.5194/acp-18-15687-2018
Sun, H., Biedermann, L., and Bond, T. C. (2007). Color of Brown carbon: A model for ultraviolet and visible light absorption by organic carbon aerosol. Geophys. Res. Lett. 34, L17813. doi:10.1029/2007gl029797
Tian, P., Cao, X., Zhang, L., Sun, N., Sun, L., Logan, T., et al. (2017). Aerosol vertical distribution and optical properties over China from long-term satellite and ground-based remote sensing. Atmos. Chem. Phys. 17, 2509–2523. doi:10.5194/acp-17-2509-2017
Tian, P., Zhang, L., Ma, J., Tang, K., Xu, L., Wang, Y., et al. (2018). Radiative absorption enhancement of dust mixed with anthropogenic pollution over East Asia. Atmos. Chem. Phys. 18, 7815–7825. doi:10.5194/acp-18-7815-2018
Valenzuela, A., Olmo, F. J., Lyamani, H., Antón, M., Titos, G., Cazorla, A., et al. (2015). Aerosol scattering and absorption Angström exponents as indicators of dust and dust-free days over Granada (Spain). Atmos. Res. 154, 1–13. doi:10.1016/j.atmosres.2014.10.015
Wan, X., Kang, S., Wang, Y., Xin, J., Liu, B., Guo, Y., et al. (2015). Size distribution of carbonaceous aerosols at a high-altitude site on the central Tibetan Plateau (Nam Co Station, 4730ma.s.l.). Atmos. Res. 153, 155–164. doi:10.1016/j.atmosres.2014.08.008
Wang, B., and French, H. M. (1994). Climate controls and high-altitude permafrost, qinghai-xizang (tibet) Plateau, China. Permafr. Periglac. Process. 5, 87–100. doi:10.1002/ppp.3430050203
Wang, X., Wen, H., Shi, J., Bi, J., Huang, Z., Zhang, B., et al. (2018). Optical and microphysical properties of natural mineral dust and anthropogenic soil dust near dust source regions over northwestern China. Atmos. Chem. Phys. 18, 2119–2138. doi:10.5194/acp-18-2119-2018
Wang, Y., Zhang, X., and Draxler, R. R. (2009). TrajStat: GIS-based software that uses various trajectory statistical analysis methods to identify potential sources from long-term air pollution measurement data. Environ. Model. Softw. 24, 938–939. doi:10.1016/j.envsoft.2009.01.004
Wu, G., Wan, X., Gao, S., Fu, P., Yin, Y., Li, G., et al. (2018). Humic-like substances (HULIS) in aerosols of central Tibetan plateau (Nam Co, 4730 m asl): Abundance, light absorption properties, and sources. Environ. Sci. Technol. 52, 7203–7211. doi:10.1021/acs.est.8b01251
Wu, G., Wan, X., Ram, K., Li, P., Liu, B., Yin, Y., et al. (2020). Light absorption, fluorescence properties and sources of Brown carbon aerosols in the Southeast Tibetan Plateau. Environ. Pollut. 257, 113616. doi:10.1016/j.envpol.2019.113616
Xiang, Y., Zhang, T., Liu, J., Wan, X., Loewen, M., Chen, X., et al. (2021). Vertical profile of aerosols in the Himalayas revealed by lidar: New insights into their seasonal/diurnal patterns, sources, and transport. Environ. Pollut. 285, 117686. doi:10.1016/j.envpol.2021.117686
Xiao, Q., Saikawa, E., Yokelson, R. J., Chen, P., Li, C., and Kang, S. (2015). Indoor air pollution from burning yak dung as a household fuel in Tibet. Atmos. Environ. 102, 406–412. doi:10.1016/j.atmosenv.2014.11.060
Xu, J., Zhang, Q., Shi, J., Ge, X., Xie, C., Wang, J., et al. (2018a). Chemical characteristics of submicron particles at the central Tibetan plateau: Insights from aerosol mass spectrometry. Atmos. Chem. Phys. 18, 427–443. doi:10.5194/acp-18-427-2018
Xu, J., Zhang, Q., Wang, Z., Yu, G., Ge, X., and Qin, X. (2015). Chemical composition and size distribution of summertime PM&lt;sub&gt;2.5&lt;/sub&gt; at a high altitude remote location in the northeast of the qinghai–xizang (tibet) plateau: Insights into aerosol sources and processing in free troposphere. Atmos. Chem. Phys. 15, 5069–5081. doi:10.5194/acp-15-5069-2015
Xu, Q., Wang, S., Jiang, J., Bhattarai, N., Li, X., Chang, X., et al. (2019). Nitrate dominates the chemical composition of PM2.5 during haze event in Beijing, China. Sci. Total Environ. 689, 1293–1303. doi:10.1016/j.scitotenv.2019.06.294
Xu, X., Zhang, H., Lin, W., Wang, Y., Xu, W., and Jia, S. (2018b). First simultaneous measurements of peroxyacetyl nitrate (PAN) and ozone at Nam Co in the central Tibetan plateau: Impacts from the PBL evolution and transport processes. Atmos. Chem. Phys. 18, 5199–5217. doi:10.5194/acp-18-5199-2018
Xu, Y., Li, Q., Xie, S., Zhang, C., Yan, F., Liu, Y., et al. (2022). Composition and sources of heavy metals in aerosol at a remote site of Southeast Tibetan Plateau, China. Sci. Total Environ. 845, 157308. doi:10.1016/j.scitotenv.2022.157308
Yang, J., Kang, S., and Ji, Z. (2020). Critical contribution of south Asian residential emissions to atmospheric black carbon over the Tibetan plateau. Sci. Total Environ. 709, 135923. doi:10.1016/j.scitotenv.2019.135923
Yang, M., Howell, S. G., Zhuang, J., and Huebert, B. J. (2009). Attribution of aerosol light absorption to black carbon, Brown carbon, and dust in China – interpretations of atmospheric measurements during EAST-AIRE. Atmos. Chem. Phys. 9, 2035–2050. doi:10.5194/acp-9-2035-2009
Yao, T., Thompson, L. G., Mosbrugger, V., Zhang, F., Ma, Y., Luo, T., et al. (2012). Third Pole environment (TPE). Environ. Dev. 3, 52–64. doi:10.1016/j.envdev.2012.04.002
Zhang, X., Wang, Y., Zhang, X., Guo, W., and Gong, S. (2008). Carbonaceous aerosol composition over various regions of China during 2006. J. Geophys. Res. 113, D14111. doi:10.1029/2007jd009525
Zhang, N., Cao, J., Wang, Q., Huang, R., Zhu, C., Xiao, S., et al. (2018). Biomass burning influences determination based on PM 2.5 chemical composition combined with fire counts at southeastern Tibetan Plateau during pre-monsoon period. Atmos. Res. 206, 108–116. doi:10.1016/j.atmosres.2018.02.018
Zhang, L., Tang, C., Huang, J., Du, T., Guan, X., Tian, P., et al. (2021a). Unexpected high absorption of atmospheric aerosols over a western Tibetan plateau site in summer. Geophys. Res. Atmos. 126 (7). doi:10.1029/2020jd033286
Zhang, X., Liu, L., Chen, X., Gao, Y., Xie, S., and Mi, J. (2021b). GLC_FCS30: Global land-cover product with fine classification system at 30 m using time-series landsat imagery. Earth Syst. Sci. Data 13, 2753–2776. doi:10.5194/essd-13-2753-2021
Zhao, C., Yang, Y., Fan, H., Huang, J., Fu, Y., Zhang, X., et al. (2020). Aerosol characteristics and impacts on weather and climate over the Tibetan Plateau. Natl. Sci. Rev. 7, 492–495. doi:10.1093/nsr/nwz184
Zhao, Z., Cao, J., Shen, Z., Xu, B., Zhu, C., Chen, L. W. A., et al. (2013). Aerosol particles at a high-altitude site on the southeast Tibetan plateau, China: Implications for pollution transport from South Asia. J. Geophys. Res. Atmos. 118, 360. doi:10.1002/jgrd.50599
Zheng, H., Kang, S., Chen, P., Li, Q., Tripathee, L., Maharjan, L., et al. (2020). Sources and spatio-temporal distribution of aerosol polycyclic aromatic hydrocarbons throughout the Tibetan Plateau. Environ. Pollut. 261, 114144. doi:10.1016/j.envpol.2020.114144
Zheng, J., Hu, M., Du, Z., Shang, D., Gong, Z., Qin, Y., et al. (2017). Influence of biomass burning from South Asia at a high-altitude mountain receptor site in China. Atmos. Chem. Phys. 17, 6853–6864. doi:10.5194/acp-17-6853-2017
Keywords: atmospheric aerosols, sources, mineral dust, in-situ observation, Tibetan Plateau
Citation: Zhang H, Tian P, Kang C, Guo Y, Yu Z, Lu G, Tang C, Du T, Wang J, Zhang Z, Cao X, Liang J and Shi J (2022) Regional organic matter and mineral dust are the main components of atmospheric aerosols over the Nam Co station on the central Tibetan Plateau in summer. Front. Environ. Sci. 10:1055673. doi: 10.3389/fenvs.2022.1055673
Received: 28 September 2022; Accepted: 21 November 2022;
Published: 02 December 2022.
Edited by:
Longlei Li, Cornell University, United StatesReviewed by:
Cenlin He, National Center for Atmospheric Research (UCAR), United StatesChaoliu Li, State Key Laboratory of Cryospheric Science (CAS), China
Copyright © 2022 Zhang, Tian, Kang, Guo, Yu, Lu, Tang, Du, Wang, Zhang, Cao, Liang and Shi. This is an open-access article distributed under the terms of the Creative Commons Attribution License (CC BY). The use, distribution or reproduction in other forums is permitted, provided the original author(s) and the copyright owner(s) are credited and that the original publication in this journal is cited, in accordance with accepted academic practice. No use, distribution or reproduction is permitted which does not comply with these terms.
*Correspondence: Jinsen Shi, c2hpanNAbHp1LmVkdS5jbg==