 Haipeng Guo1,2*
 Aibing Hao1,2Wenpeng Li1,2Xisheng Zang1,2Yunlong Wang1,2Juyan Zhu1,2Liya Wang3Ye Chen4
- 1Hebei Cangzhou Groundwater and Land Subsidence National Observation and Research Station, Cangzhou, China
- 2China Institute of Geo-Environment Monitoring, Beijing, China
- 3Beijing Institute of Geo-Environment Monitoring, Beijing, China
- 4School of Water Resources and Environment, China University of Geosciences, Beijing, China
Land subsidence is a typical geo-hazard in Cangzhou, North China Plain, having caused severe damages to transportation networks, public utilities, and other civil infrastructures. The mechanism of land subsidence and its affecting factors were revealed by theoretical model analysis, and doing geotechnical tests and monitoring of soil deformation as well as groundwater level. Theoretical analysis shows that groundwater withdrawal from both unconfined and confined aquifers can lead to land subsidence. Land subsidence of the Cangzhou Plain is mainly caused by the exploitation of deep confined groundwater. Geotechnical tests show a general trend that the compressive modulus increases with the increase of soil depth. The strata of the Upper Pleistocene and Holocene are mostly normally consolidated and partially under-consolidated, which are prone to produce large compression after pumping. Land subsidence in the Cangzhou Plain has a strong hysteresis because of seepage consolidation and creep. The deformation characteristics of strata change at different depth. The shallow aquifers are mainly elastic deformation. The area of severe land subsidence in the Cangzhou Plain is closely related to rainfall, mainly because the large amount of water are used for agricultural irrigation. InSAR results show a sudden change in regional subsidence across the Cangdong fault, which is caused by the difference in the thickness of Quaternary sediments and the difference in the deep confined groundwater level.
1 Introduction
Land subsidence, leading to the decrease in ground elevation within a certain area, is a geological phenomenon that the underground loose rock layers are consolidated and compressed due to factors such as extraction of underground fluids. As a geological disaster, land subsidence has serious negative effects in many countries and regions in the world (Hu et al., 2004; Ovando-Shelley et al., 2007; Motagh et al., 2008; Pacheco-Martínez et al., 2013). The North China Plain (NCP) is the largest affected area with the fastest subsiding rate in China. In recent decades, soil deformation mechanism with the influence of groundwater level change in aquifer systems has received great attention from scholars. Researches mainly focus on the rheological characteristics of soil layers, especially clay layers, and the quantitative research on soil stress-strain relationship. He et al. (2020) designed physical model tests to study the deformation characteristics of sand and clay layers and the change of pore water pressure caused by groundwater recharge and discharge, and proposed three groundwater development models that were conducive to alleviate the development of land subsidence. With the deepening of researches on land subsidence, more and more researchers gradually realized that the soil compression induced by water pumping contains a certain proportion of rheological deformation, and not only clayey soil may creep (Sivasithamparam et al., 2015; Sexton et al., 2016), but also sand or gravel aquifers may creep (Enomoto et al., 2015; Zhu et al., 2018). Test results showed that the creep deformation of sand could reach 10% of the total deformation under monotonic load (Augustesen et al., 2004). Terzaghi’s consolidation theory is a simple elastic deformation model, which has been widely used in soil compression analysis due to the simple mechanism and the linear characteristics of the governing equations. If the field monitoring and laboratory test data of soil deformation can be obtained, a more realistic soil deformation constitutive model may be established and used for land subsidence simulation and prediction (Gambolati and Teatini, 2015). Tsai and Hsu (2018) proposed a visco-elasto-plastic (VEP) model, which consisted of a visco-elastic model and a visco-plastic model, and the use of the visco-plastic model was controlled by a single-pole double-throw (SPDT) switch. It has been verified that the calculation results of this model have a small relative error. Based on the Euler formula, Zhuang et al. (2020) obtained the analytical solution of the elastic deformation of an overconsolidated aquitard driven by the change of the groundwater level in the aquifer, and used it to evaluate the vertical hydraulic conductivity and elastic skeletal specific storage of a 35.54 m thick aquitard in Shanghai. Results showed that the analytical method could quantitatively explain the hysteresis characteristics of land subsidence and effectively evaluate the hydraulic parameters of overconsolidated aquitards. Land subsidence caused by pumping and drainage is actually a coupling problem of seepage field and stress field. In recent years, researchers have explored the numerical calculation methods of fully coupled models (Tsai, 2015; Asadi and Ataie-ashtiani, 2016), and have successfully applied them to the simulation and prediction of land subsidence in Venice, Las Vegas, Shanghai, etc. (Hernandez-marin and Burbey, 2012; Castelletto et al., 2015; Ye et al., 2016). Pham et al. (2019) developed the program module SUB+ based on the elastic mechanics theory of porous media, which could realize fully coupled water-stress simulation.
Land subsidence is a typical geo-hazard in the Cangzhou Plain. The strata in the Cangzhou Plain are mainly composed of clay and silty clay with relatively high plasticity, it thus easy to form permanent subsidence (Guo et al., 2015). The occurrence and development of land subsidence in the Cangzhou Plain are closely related to the history of groundwater exploitation. Due to the complex affecting factors of land subsidence, the development rate and scope of land subsidence have great differences in different spaces and times. From the 1970s to the 1990s, the demand for water resources for industrial and agricultural development in the Cangzhou Plain increased with years. Due to serious over-exploitation and slow replenishment, the deep groundwater level dropped seriously, forming a large area of deep groundwater depression cones and induced land subsidence disasters. The substantial increase in groundwater extraction in small and medium-sized cities and rural areas caused land subsidence to expand from urban to rural areas and to consolidate regionally. In the 21st century, land subsidence in the urban area of Cangzhou had been gradually controled due to the closure of groundwater wells, but it was still developing in other areas.
With the advancement of science and technology, monitoring methods of land subsidence have been improved, which has continuously expanded the depth and breadth of land subsidence research. Since the 1990s, the synthetic aperture radar interferometry (InSAR) technology has become increasingly mature and has become an important technical means to monitor the temporal and spatial changes of regional land subsidence (Khan et al., 2013; Tomas et al., 2014; Amighpey and Arabi, 2016; Castellazzi et al., 2016; Chaussard et al., 2017). InSAR, GPS, leveling, borehole extensometers and other ground and underground monitoring technologies complement each other, and have become important components of the land subsidence monitoring system in the North China Plain as well as the Cangzhou Plain. The main objective of this paper is to put forward new understandings on the mechanism of land subsidence in Cangzhou Plain, and provide reference for the prevention and control of land subsidence in the future. At first, a five-layer conceptual model is established to investigate the characteristics and of soil deformation driven by groundwater level variations. Multiple correlation analysis is performed to explore the relationship among land subsidence, groundwater level and groundwater extraction. Based on geotechnical tests, the influence of soil mechanical parameters such as compression modulus and soil consolidation degree on land subsidence are estimated and discussed. Then, we rely on water well and extensometer data to analyze the deformation characteristics of strata with different buried depths in the subsidence center of the central urban area. Finally, we discuss the relationship between rainfall and land subsidence, and the control effect of faults on land subsidence.
2 Study area
The Cangzhou Plain, the plain area of Cangzhou City, Hebei Province, is located in the central and eastern part of the NCP and adjacent to Bohai Sea (see Figure 1). Cangzhou Plain is about 181 km from east to west and 165 km from north to south, with a total area of 14,000 km2 (the central urban area is 195 km2), accounting for 10% of the total area of the NCP. The terrain in this region is low and flat, and inclines from southwest to northeast, with a slope of 0.07‰–0.13‰. The ground elevation is generally 2–15 m, and the ground elevation along the coastline in the east is 1–4 m. This region belongs to a warm temperate continental monsoon climate, with an average annual rainfall of about 600 mm. The rainfall is unevenly distributed throughout the year with great inter-annual variation. Generally, the flood season starts from June to September. The rainfall during the flood season accounts for about 75% of the annual rainfall. Due to limited precipitation and the construction of upstream reservoirs, most rivers in the Cangzhou Plain have been seasonally or even dried up. Therefore, groundwater has been the main source of water for agriculture, industry and domestic use.
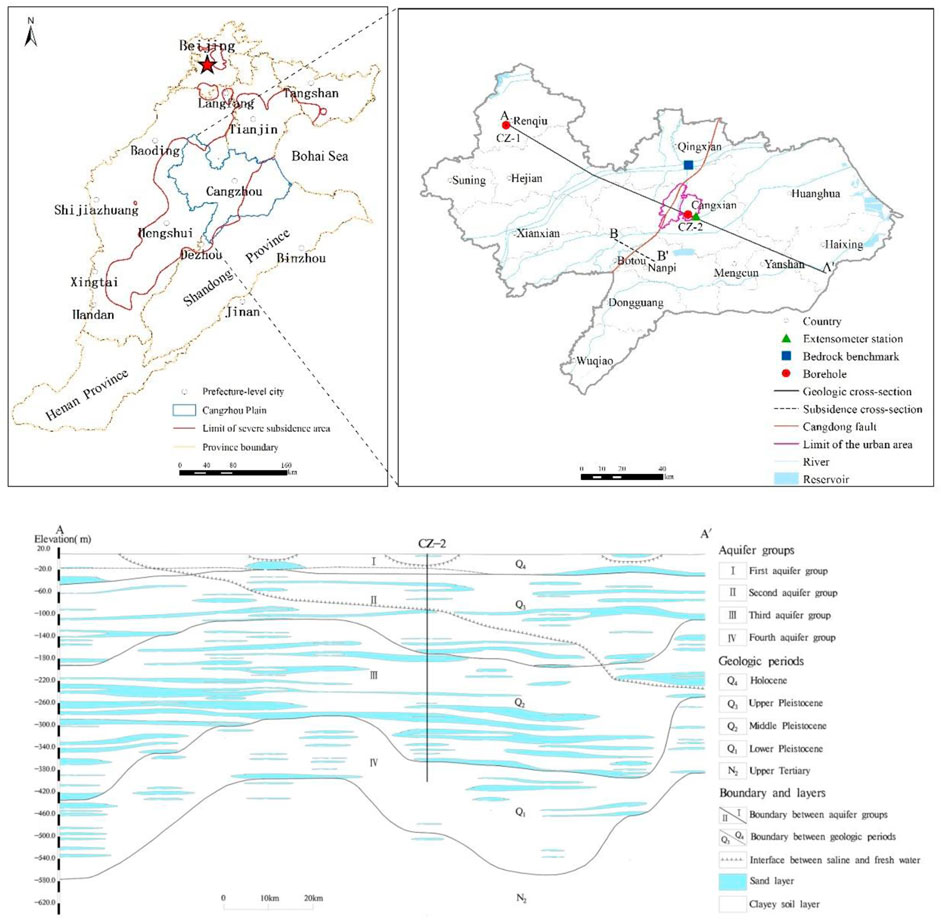
FIGURE 1. Sketch map of the North China Plain and the Cangzhou Plain showing distribution of the major land subsidence areas, and a hydrogeological cross section A-A′.
The Cangzhou Plain contains two distinct hydrogeological settings in Quaternary sediments: an alluvial plain with many abandoned river channels and a coastal plain zone around the Bohai Sea (Foster et al., 2004). The main strata in this region are loose unconsolidated Quaternary sediments with the thickness ranging from 350 m to over 550 m, mainly composed of sand, silt and clay. The main type of groundwater is pore water in loose Quaternary sediments. Aquifer system is composed with multiple sand aquifers which separated by extensive and thick aquitards of silt or clay (Figure 1). Freshwater aquifers of the aquifer system are overlaid by saline/brackish aquifers, increasing in thickness from tens of meters in the west to over 200 m in the coastal areas (Figure 1). The stratigraphy can be divided into four aquifer groups. The bottom depth of the first aquifer group is 20–30 m, which roughly correspond to the bottom boundary of the Holocene (Q4) and the upper part of the Upper Pleistocene (Q3). The first aquifer group has good conditions for precipitation infiltration, runoff and recharge. The bottom depth of the second aquifer group is 120–170 m, corresponding to the bottom boundary of Q3. The vertical infiltration recharge condition is poor, and the underground runoff is stagnant. The lower boundary of the third aquifer is located between 250 and 350 m underground, corresponding to the bottom boundary of Middle Pleistocene (Q2). The third aquifer group has poor recharge conditions, which is the main exploitation layer of deep confined groundwater in the Cangzhou Plain. The water abundance (represented by yield of single well) in the central and western regions of Cangzhou is generally between 1,000 m3/d and 2000 m3/d, the water abundance in the central and eastern regions is generally between 500 m3/d and 1,000 m3/d, and the water abundance in some regions of Huanghua is less than 500 m3/d. The bottom boundary of the fourth aquifer group is buried at a depth of 350–550 m, with a local depth of 600 m, corresponding to the bottom boundary of Lower Pleistocene (Q1). The permeability and water richness are poor, and the lateral runoff supply is weak. The first and second aquifer groups have unconfined or semi-confined hydraulic properties, and the third and fourth aquifer groups have confined hydraulic properties.
3 Materials and methods
3.1 Theoretical models
3.1.1 The influence of water level drop on land subsidence
The principle of effective stress by Terzaghi can be described as following (Craig, 2004):
where
When no tectonic stresses are present, the total stress can be expressed as the sum of the loading on the soil surface and the geostatic stress (Poland and Davis 1969; Zeitoun and Wakshal 2013).
and the hydrostatic stress can be expressed as following:
where
Figures 2, 3 show a typical aquifer structure, one unconfined aquifer and two confined aquifers separated by two confining units, respectively. With Eqs 1–4, the variation of effective stresses in response to water level changes in the unconfined and confined aquifers can be summarized in Table 1 (Poland and Davis, 1969; Zhou, 2012; Guo et al., 2015).
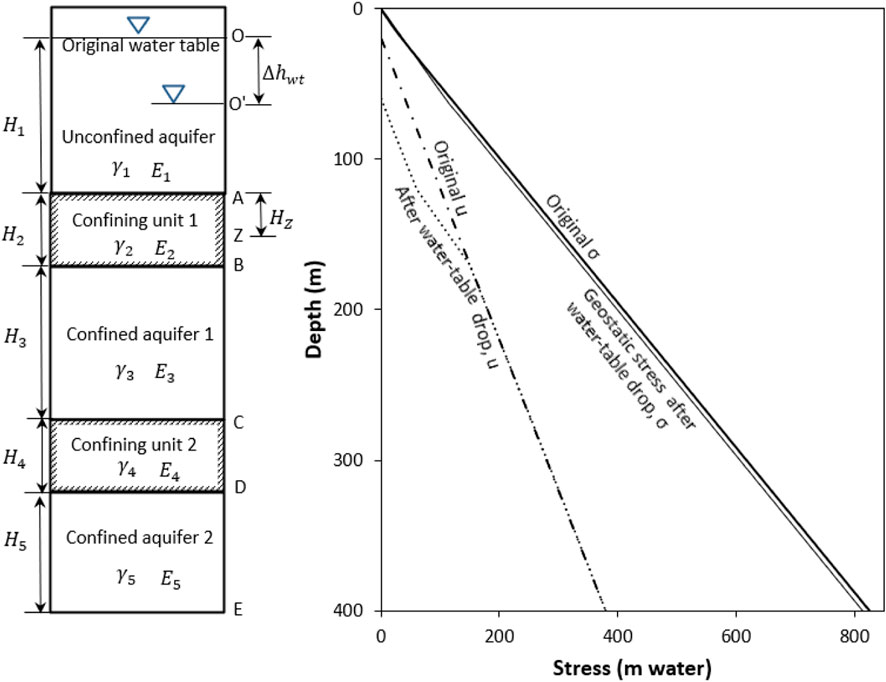
FIGURE 2. Stress diagrams for a water table drop of 40 m in an unconfined aquifer (
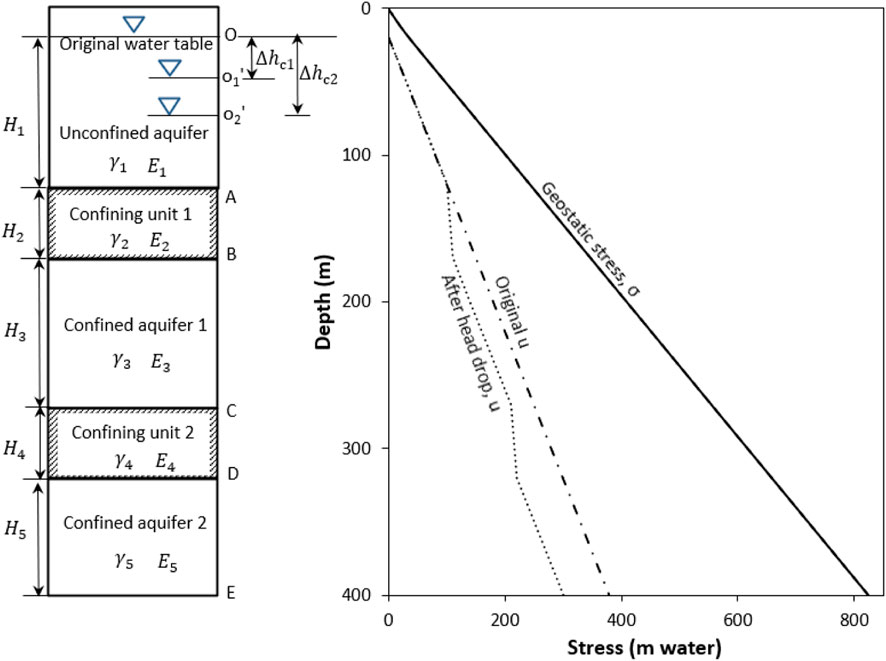
FIGURE 3. Stress diagrams for a water head drop of 40 m in confined aquifer 1, and 80 m in confined aquifer 2 (
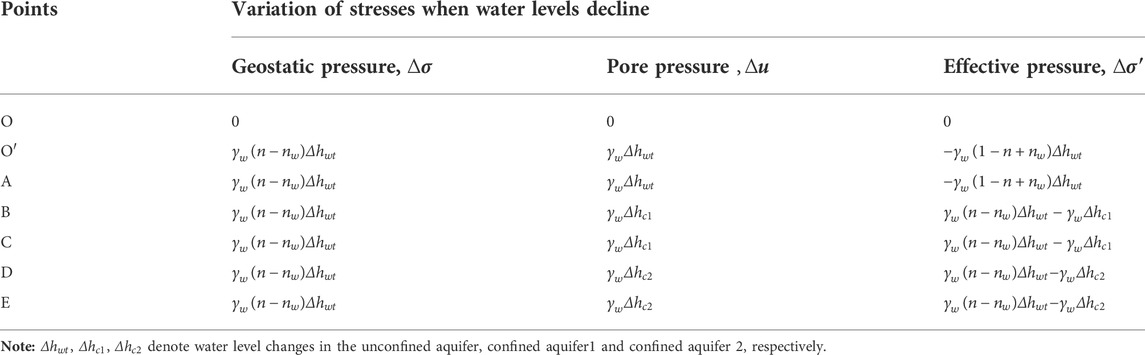
TABLE 1. Variation of stresses due to water level changes in the aquifer.
When water-level drops in the unconfined aquifer, the land subsidence can be calculated as:
where
Figure 2 indicates the relationships between geostatic, hydrostatic and effective stresses and the changes after a water table drop of 40 m in the unconfined aquifer when fluid-pressure equilibrium is reached. The effective stress in the unconfined aquifer increases 29.2 m and that in confined aquifers and confining unit 2 decreases by only 10.8 m. The point Z is calculated as 0.73
When water levels in the confined aquifers fall, the land subsidence can be calculated as following:
Figure 3 indicates variation of geostatic, hydrostatic and effective stresses as water head drops 40 m in confined aquifer 1 and declines 80 m in confined aquifer 2. After the water head decreases, the effective stress of the unconfined aquifer remains unchanged, and the effective stress of the confined aquifer 1 and confined aquifer 2 increases by 40 m and 80 m, respectively. The effective stress of confining unit 1 and confining unit 2 increases by 20 m and 60 m on average, respectively.
3.1.2 Pumping induced soil deformation in a confined aquifer
When a well is pumped in a completely confined aquifer, the water is obtained from the elastic or specific storage of the aquifer. The elastic storage is water that is released from storage by the expansion of the water as pressure in the aquifer is reduced and by expulsion as the pore space is reduced as the aquifer compacts. The drawdown
When
where
Then the following equation can be obtained:
where
One can easily see from Eq. 13 that the compression amount of the aquifer increases with
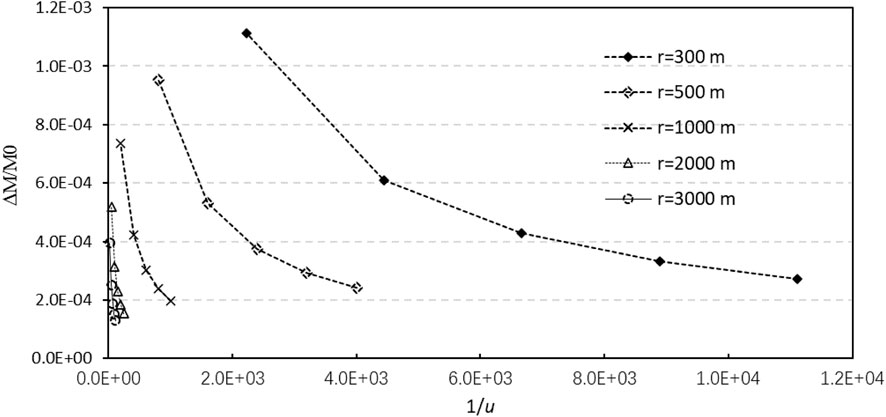
FIGURE 4. Plots of dimensionless compression
3.1.3 Delay in draining aquitards
Residual compaction in aquitards may continue long after the heads are initially lowered in adjacent aquifers. Riley (1969) pointed out that the time of delay in a doubly draining aquitard, representing the time required for 93% of the excess pore water within a confining unit to dissipate, could be expressed as following:
where
3.2 Multiple correlation analysis
Given variables x, y, and z, the multiple correlation coefficient can be defined as following (Schmuller, 2009):
where x and y are viewed as the independent variables and z is the dependent variable, and
3.3 Soil sample collection and testing
Two boreholes with the drilling depth of 400 m are located in Renqiu and the central urban area, numbered CZ-1 and CZ-2, respectively (see Figure 1 for the borehole locations). Clay samples were cut 30 cm from borehole cores, placed in soil sample cylinders, sealed with wax and wrapped with tape before being sent to the laboratory. A specimen with a diameter of 61.8 mm and a height of 20 mm was prepared by a ring cutter for consolidation test, and the remaining soil was used for the determination of physical parameters. Consolidation tests were performed using an electronic compression rheometer to study the time-dependent behavior of the clayey soil during one-dimensional consolidation. The experimental data were used to estimate the preconsolidation pressure, compression modulus and consolidation coefficient of test specimens at different depths. During the consolidation tests, the lateral movement of the soil was prevented by containing the soil in a hard metal ring. A series of pressures were applied to the specimen, each held for 24 h, during which time deformation readings were taken at appropriate intervals. During the test, the room was kept at constant temperature and humidity.
4 Discussion
4.1 Variation of compressive modulus with pressure and depth
Physico-mechanical properties of ten soil specimens taken from boreholes CZ-1 and CZ-2 are shown in Table 2. The relation between compression module and applied pressures for the above ten specimen are shown in Figure 5. It can be seen from Figure 5 that with the increase of pressure, the variation of compression modulus can be divided into 4 stages. The following is an example of soil specimen CZ-2-25. In the first stage (0–160 kPa), the compression modulus under the first and second pressure increments is very small due to the stress relief generated by the sampling and sample preparation process, which is shown as a rapid increase of the compression modulus in the compression modulus-pressure curves. The second stage (about 160–640 kPa) is the compression stage before the soil structure yields, and the growth of the compression modulus in this stage is slower than that of the first stage. The third stage (about 640–1,280 kPa) is the yield stage of the soil structure, the compression modulus decreases with the increase of pressure, and the soil structure is destroyed; the pre-consolidation pressure obtained by the Casagrande method on the e-lgP curve is 767 kPa, which is within the pressure variation range at this stage. The fourth stage (after 1280 kPa) is the compression stage after the structure yields, and the compression modulus increases gradually with the increase of the load. It should be noted that sometimes no obvious structural yield stage exists due to excessive loading ratio, such as specimen CZ-1-22 in Figure 5A.
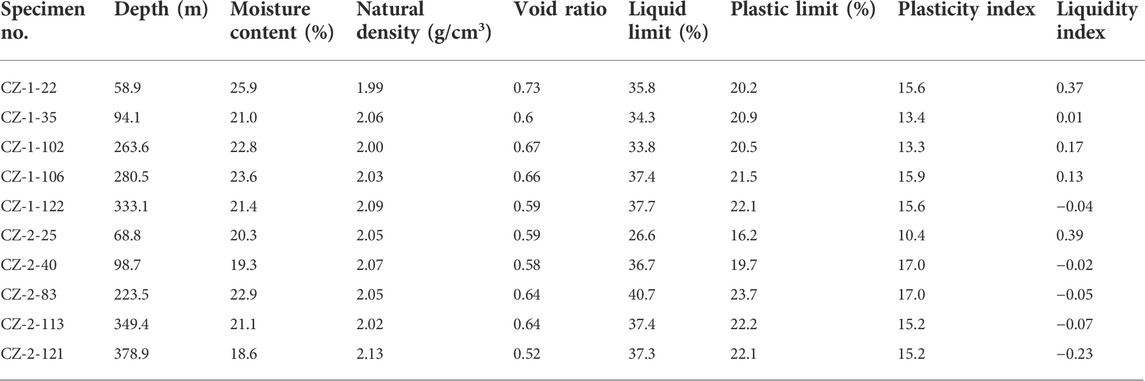
TABLE 2. Physico-mechanical properties of ten soil specimens taken from borehole CZ-1 and CZ-2.
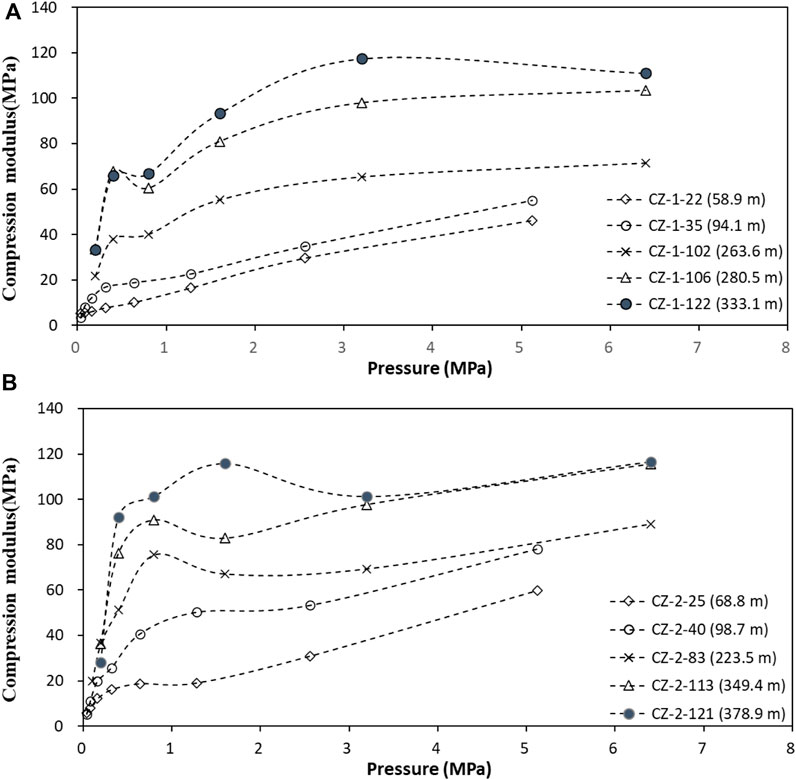
FIGURE 5. Compression modulus of soil samples at different depths in boreholes CZ-1 (A) and CZ-2 (B) as a function of pressure.
The above analysis shows that there is a stress release and compensation stage for the soil specimens in the first stage, and the compression modulus of this stage cannot represent the real situation of the soil. Therefore, the compression modulus of the second to third stages is selected to analyze the variation of the compressive modulus with depth. Figure 5 shows a general trend that in the same pressure range, the compressive modulus increases with the increase of soil depth as a whole. Due to the exploitation of groundwater, the pore pressure of the clayey soil decreases, and the soil layer is consolidated under the action of the effective stress due to its own weight. The deep soil has a higher effective stress, resulting in a higher degree of consolidation and a relatively large compression modulus.
According to Table 1, when the water table decreases, the increase of effective stress in the unconfined aquifer and the upper part of the confining 1 is much greater than the decrease of effective stress in the underlying aquifer or confining units. In general, the resilience modulus of the soil layer is much larger than the compression modulus, and the deformation modulus of the deep soil is larger than that of the shallow soil (Figure 5). Therefore, according to Eqs 6–8, the compression of the OZ section (Figure 2) caused by the drop of the phreatic level is greater than the rebound of the underlying strata, so groundwater extraction from unconfined aquifers may also lead to land subsidence.
4.2 Deep confined groundwater extraction is the major reason of land subsidence
The Cangzhou Plain is an extremely water-deficient area under the dual pressure from population and environment. Due to the lack of surface water and the large-scale distribution of saline/brackish water in shallow aquifers, the whole region mainly relies on overexploitation of deep groundwater to maintain the growing needs of national economic development. Surface water accounts for about 20% of the total utilization of water resources in Cangzhou, while groundwater accounts for the rest 80%. In the whole groundwater exploitation, deep water takes up to the ration of 70%. Deep groundwater is mainly pumped for the use of agriculture, which accounts for 66.1% in 2013 (Li, 2015). The development and utilization of deep groundwater in the Cangzhou Plain began in the mid-1960s when the groundwater could spew out of the ground surface due to the high groundwater heads. With the increase of the number of machine-operated wells and the increase of the mining volume, the groundwater level dropped, and the regional groundwater level depression cone was gradually formed. As a result, the pore water pressure of the aquifer decreased and the clayey soil layers lost water due to compaction, resulting in land subsidence. From 1976 to 1980, the average annual mining volume was 2.6 × 10⁸ m3, which did not require for a large amount of groundwater. From 1981 to 1995, the annual average mining volume was between 4.4 × 10⁸ and 5.2 × 10⁸ m3. Rapid economic and agricultural development had greatly increased groundwater consumption. After 1996, the mining volume increased continuously. The average annual mining volume during this period was 6.5 × 10⁸ m3, and it reached as high as 9.2 × 10⁸ m3 during 2001–2003 (Li, 2015).
In recent 5 years, land subsidence in the Cangzhou Plain has gradually slowed down. The most serious land subsidence occurred in 2017, with the area of severe land subsidence (the area with subsidence rate greater than 50 mm/year) reaching 1,400 km2. At present, the area of severe subsidence in Cangzhou covers an area of about 300 km2, mainly distributed in the west and south of Cangzhou. The maximum cumulative subsidence of the central urban area is more than 2.5 m (Bai et al., 2022), and the urban areas of Qingxian, Renqiu, Hejian, Suning, Huanghua, Botou, and Nanpi also have great cumulative subsidence exceeding 1.0 m. Damages caused by land subsidence began to appear in the central urban area of Cangzhou City in 1972. By 2005, the accumulated subsidence in the subsidence center had exceeded 2 m. To mitigate land subsidence, local government had implemented policies since 2005 to limit the extraction of confined groundwater and to increase the supply of surface water from the Dalangdian Reservoir and the South-to-North Water Diversion Project. From 2005 to 2007, the self-provided wells were closed in the central urban area, the groundwater level recovered, and the subsidence rate was basically controlled within the range of 10–20 mm/year.
It can be seen from Table 1 that the effective stress increment of the unconfined aquifer caused by the drop of water table is smaller than that of the confined aquifer caused by equivalent drop of the confined water level. Furthermore, when the same amount of groundwater is pumped, the water level drop in the confined aquifer is greater than that in the unconfined aquifer. Also, the recharge condition of unconfined aquifers is better than that of the confined aquifers, and the water table generally does not drop significantly. It should be noted that the Cangzhou Plain mainly relies on the extraction of deep groundwater to maintain the needs of national economic development due to the large amount of saline/brackish water distributed in the shallow aquifer. Therefore, the land subsidence in the Cangzhou Plain is mainly caused by abstraction of deep groundwater. In addition, fine clays and silts with organic matter in confined aquifers typically demonstrates high compressibility and strorativity and low transmissivity, which is conductive to trigger the land subsidence (Figure 4). Hence serious land subsidence has occurred in the Cangzhou Plain.
The exploitation of confined groundwater in the central urban area of Cangzhou is mainly from the third aquifer group, which is also the main cause of land subsidence. During the rapid development of land subsidence (1991–2010), the annual groundwater extraction of the second, third and fourth aquifer groups was 30, 310, and 75 million m3, respectively, of which the third aquifer group accounted for 75%. As shown in Figure 6, the development of the land subsidence of the subsidence center in the central urban area has gone through three main stages. Prior to 2001, the rate of land subsidence continued to increase as groundwater extraction and water level depth increased in the third aquifer group (i.e., the main groundwater abstraction layer). In 2001, the groundwater level was buried at a depth of about 90 m, and the subsidence rate exceeded 100 mm/year. From 2001 to 2007, the subsidence rate decreased significantly due to the closure of self-contained wells and the reduction of groundwater extraction. After 2007, the subsidence rate decreased slowly and stabilized. Multiple correlation analysis indicates that the land subsidence rate (S), groundwater withdrawal (Q) and groundwater level depth (D) of the Cangzhou subsidence center have a good correlation, which can be described as Eq. 17. The coefficient of determination (R2 or R-square) is calculated as 0.94, indicating that the goodness of fit is high.
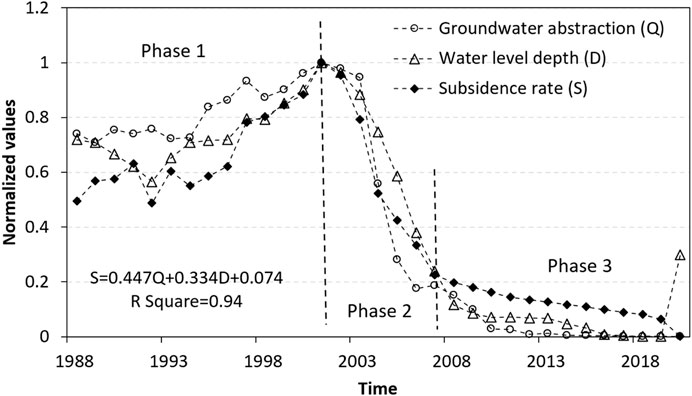
FIGURE 6. Temporal variation of groundwater abstraction and the water-level depth and subsidence rate of the subsidence center in the central urban area of Cangzhou City (All the values are normalized).
4.3 The relation between the recorded soil compaction and the variation of groundwater levels
Highly sensitive borehole extensometers can provide data that define the compression characteristics of the compacting aquifer systems. In 2003, a bedrock benchmark was installed in the northern part of Cangzhou Plain (Figure 1). Since 2010, borehole extensometers were installed at several sites throughout the region. The monitoring data from the extensometer in the central urban area (Figure 1) are used to illustrate the variation characteristics of groundwater level and soil deformation.
A geophysical log interpretation from the borehole CZ-2 (see Figure 1 for borehole location), indicates alternating sand and clay layers scattered throughout the vertical aquifer sections (Figure 7). Extensometer site S1 is near borehole CZ-2, with 5 extensometers installed at depths of 5 m, 69 m, 196 m, 253 m, and 375 m to measure consolidation (vertical deformation) in each two depth intervals. The extensometers are numbered as F1, F2, F3, F4, and F5, respectively. In addition, four groundwater monitoring wells numbered as W1, W2, W3, and W4, respectively, were also installed to measure the groundwater level variations in the first aquifer group, the second aquifer group, the upper and lower parts of the third aquifer group. These four monitoring wells have the screen depths of 10–30 m, 128–193 m, 208–252 m, and 274–371 m, which are within the depth range of the soil compression layers F1-2, F2-3, F3-4, and F4-5, respectively. Figure 8A shows, in the uppermost plot, the history of groundwater depths in W1, and that of compaction between 5 m and 69 m below land surface (the first compression layer F1-2), an interval corresponds approximately to the first aquifer group and the upper part of the second aquifer group. Figure 8B shows, in the middle plot, the history of groundwater depths in W3, and compaction between 196 m and 253 m below land surface (the third compression layer F3-4), an interval corresponds approximately to the upper part of the third aquifer group. Figure 8C shows, in the lowermost plot, the history of groundwater depths in W4, and compaction between 253 m and 375 m below land surface (the fourth compression layer F4-5), an interval corresponds approximately to the lower part of the third aquifer group.
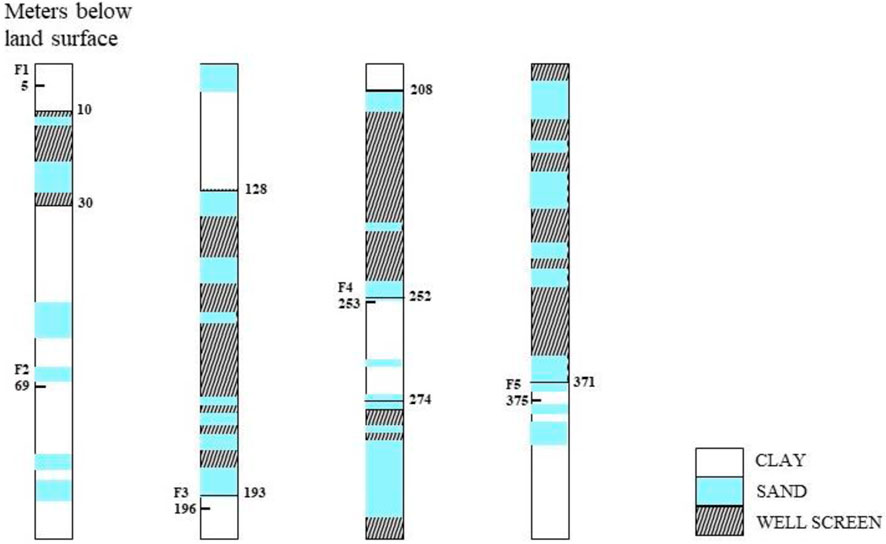
FIGURE 7. Soil profile: the central urban area of Cangzhou. Solid vertical lines indicate the interval of well perforation.
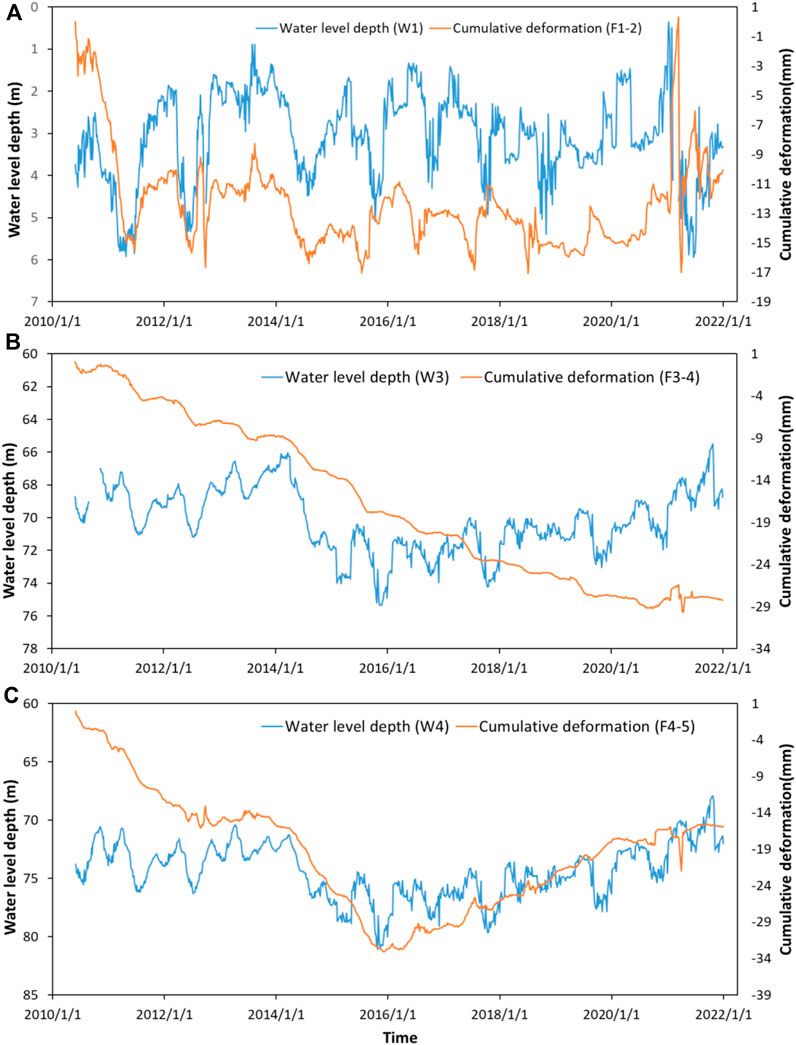
FIGURE 8. Hydrographs and cumulative deformation: (A) well W1 and compression layer F1-2; (B) well W3 and compression layer F3-4; (C) well W4 and compression layer F4-5. The negative sign in the cumulative deformation indicates compression.
Due to the difference in stratum lithology and stress loading process (pattern of groundwater level change), the deformation characteristics of soil layers with different buried depths under groundwater level changes are quite different, showing elastic, visco-elastic, and visco-elastic-plastic characteristics. The first compression layer, F1-2, exhibits obvious elastic deformation characteristics (Figure 8A). The water levels of the aquifer fluctuated seasonally, and the weakly permeable layer or the aquifer containing low-permeability lens was subjected to repeated loading and unloading. With the increase of the number of cycles, the soil layer presented a deformation characteristic dominated by elastic deformation. Despite the fact that the effective stress fluctuated with years, each major episode of stress was accompanied by additional permanent compaction in F3-4 (Figure 8B). During fall and winter seasons of water level recovery, the effective stresses declined and compaction ceased, and a slight expansion of the aquifer system was recorded (Figure 8B). Apparently, the expansion of the aquifer is masked by the continued compaction of the interbedded aquitards, as water continues to be drained under the influence of the high pore pressure maintained in the middle region of the clay beds. As the water head of the aquifer rises, the thinnest and most permeable aquitards with the least excess pore pressure will rapidly respond elastically; however, the thickest and least permeable clay layers may continue to compact at a decreasing rate during most or even all the period of head recovery. Since November 2015, groundwater levels began to increase in a slow rate and the subsiding rate, the slope of the cumulative deformation, diminished gradually (Figure 8B). The groundwater level of W4 shows similar variation characteristics to W3; but soil compaction in F4-5, which has different characteristics compared to F3-4, stopped in December 2015 and then continued to rebound as the water level continued to rise (Figure 8C).
The degree of soil consolidation is an important indicator that affects soil compression. Under-consolidated strata have not yet been consolidated under the self-weight pressure. Even if no external load exists, under the action of self-weight load, such strata will slowly consolidate and drain, causing the strata to slowly compress and cause land subsidence. For normally consolidated strata, as long as there is an external additional load or a drop in the groundwater level, the strata can be compressed, resulting in land subsidence. Only when the additional load is greater than the difference between the pre-consolidation pressure and the self-weight pressure, the over-consolidated strata will produce obvious compression and deformation and cause land subsidence. The Upper Pleistocene and Holocene strata in the Cangzhou Plain are mostly in a normal consolidation state, while in the deep strata, due to the significant drop in groundwater levels, the pore water in the corresponding aquitards or lens has been gradually discharged, and the effective stress increases. As a result, the deep strata are mostly over-consolidated after continuous compression. The first compression layer F1-2 mainly distributes saline/brackish water, and the amount of groundwater exploitation is small, but it still contributes 12% to the land subsidence. The main reason is the low degree of consolidation in this layer, which is mostly normally consolidated and partially under-consolidated (Figure 9).
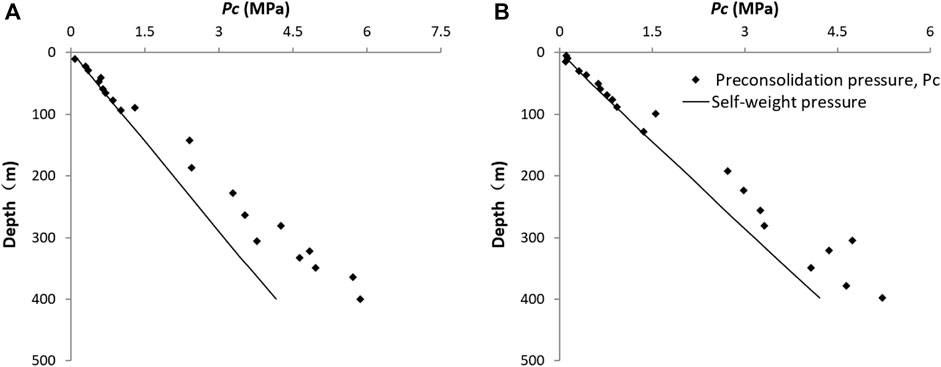
FIGURE 9. Change of Pc with depth in the borehole CZ-1 (A) and CZ-2 (B).
The monitoring data of borehole extensometers show that the land subsidence has a strong hysteresis, which means that the land subsidence will continue even if the groundwater level stops falling or even rises. The delay of land subsidence in Cangzhou Plain is mainly due to the delayed drainage of low permeability aquitards (or aquifers sandwiched by low-permeability lens). As shown in Eq. 14, the time of delay increases with the thickness and the specific storage of the aquitards, and decreases with the increase of the vertical hydraulic conductivity. Thus, the length of the lag time depends on the stratum structure such as the thickness of the clayey soil layers and horizontal continuity, as well as the mineral composition and the degree of soil consolidation. Pumping tests show that the hydraulic conductivities of the confining layers are significantly lower compared with the aquifers in the study area; thus, land subsidence may lag behind the groundwater level after groundwater level changes. From the autumn of 2010 to the spring of 2014, although the water level in well W3 rose slightly during this period, the compressive deformation of the strata in the third compression layer F3-4 continued to increase (Figure 8B), indicating that the soil layer has not only residual plastic deformation, but also creep deformation that develops over time. The soil consolidation test results show that the soil in the middle and late Pleistocene strata in the Cangzhou Plain has obvious creep characteristics under different loading conditions. The strain-log(t) curve of the silty clay sample at a depth of 70 m in the central urban area of the Cangzhou City is shown in Figure 10, which proves the existence of creep. Studies have shown that not only clay soils may creep, but also sands. However, to well define creep exists in the sandy layers in the study area, further research should be done.
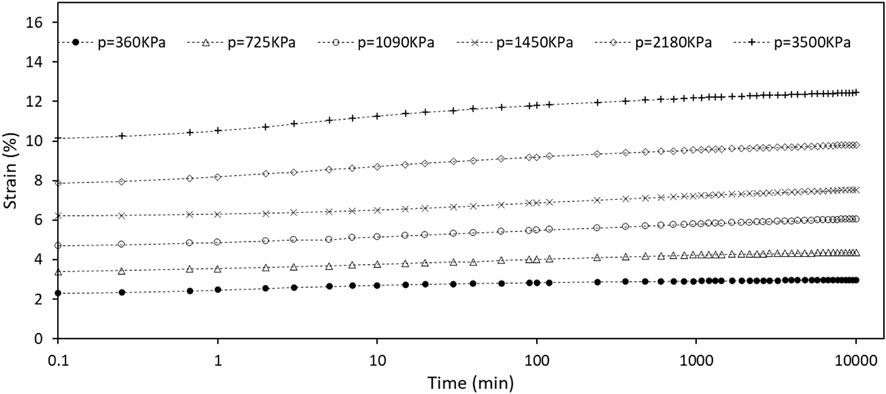
FIGURE 10. The creep curves for a silt clay sample at 70 m depth taken in the central urban area of the Cangzhou Plain.
4.4 Other affecting factors of land subsidence in the Cangzhou Plain
Population growth and economic development have led to excessive exploitation of groundwater, especially deep confined groundwater, which is the main cause of inducing land subsidence in the Cangzhou Plain. However, people often ignore or underestimate the indirect impact of climate change on land subsidence. Drought climate has a dual impact on groundwater level change. On the one hand, it reduces groundwater recharge; on the other hand, in order to meet water supply needs during droughts, more groundwater is pumped to make up for the lack of surface water supply. Under the dual influence of drought, the groundwater level will fall significantly and the land subsidence will increase accordingly. The groundwater in the Cangzhou Plain is mainly used for agricultural irrigation, so the influence of climate is more significant. It can be seen from Figure 11 that the proportion of severe subsidence area to total area in Cangzhou Plain has a good correlation with rainfall, and the severe subsidence area here refers to the area with subsidence rate greater than 50 mm/year. In general, the area of severe land subsidence decreases when the rainfall increases, and vice versa. In 2020, the Cangzhou Plain is a wet year with the rainfall of 579 mm, increased by 125 mm compared with 2019. At the same time, due to the comprehensive control of groundwater over-exploitation, the South-to-North Water Diversion and other factors, the development trend of land subsidence has further slowed down, and the area of severe land subsidence has decreased by more than 50% year-on-year (Figure 11).
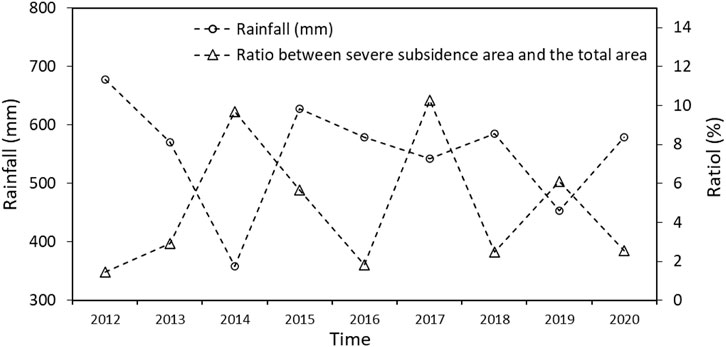
FIGURE 11. Temporal variation of rainfall and the ratio between severe subsidence area and the total area of the Cangzhou Plain.
Engineering construction is a new factor affecting land subsidence of the Cangzhou Plain in recent years. With the continuous acceleration of the urbanization process, the renovation of old urban areas and the expansion of new urban areas have led to an increase in the number and height of buildings, resulting in an increase in ground loads. Under-consolidated soils or soft soils tend to consolidate under heavy loads, thereby inducing land subsidence. The development of underground resources such as oil and natural gas leads to the compaction of the Tertiary under-consolidated oil and gas layers, which is also an affecting factor for the development of land subsidence.
The spatial distribution of land subsidence is often controlled by faults. InSAR results show that the Cangdong fault in Botou (see Figure 1 for the fault location) has an obvious effect on the spatial distribution of ground subsidence, and the ground subsidence rate on both sides of the fault changes abruptly (Figure 12), which provides a good indication for the understanding of the development and characteristics of the fault. Abrupt areal changes in subsidence can be the result of faults separating compressible from less-compressible deposits or acting as barriers to groundwater flow, creating groundwater level differences across the faults (Galloway, et al., 1999). Analyses of lithological and geophysical logs of wells provide clues about the observed subsidence patterns that terminate or change features near the fault. We collected audiomagnetotellurics (AMT) data along a profile across the fault, using the Geometrics StrataGem EH4 system, a four-channel, natural and controlled-source tensor system recording in the range of 10–92,000 Hz (Geometrics, 2000). The AMT method is used to reveal subsurface structure and stratigraphy, results showing that the thickness difference of Quaternary sediments on both sides of the fault can reach about 80 m. According to monitoring data, the deep confined groundwater level in the southeast is several to 10 m lower than that in the northwest. The compressibility and thickness differences of sediments and the groundwater level difference may be the main reasons for the abrupt areal changes in subsidence across the fault.
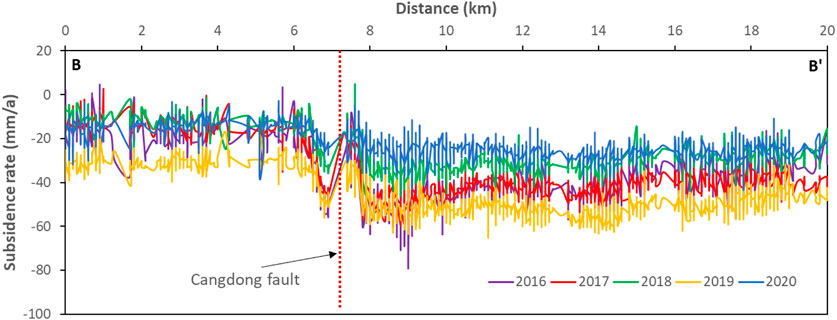
FIGURE 12. Variation of subsidence rate with distance from 2016 to 2020 for the BB′ section (see Figure 1 for the section location).
5 Summary and conclusion
By collecting monitoring data of land subsidence, soil deformation, groundwater levels, etc., the mechanism of land subsidence in the Cangzhou plain was studied using theoretical model analysis and multiple correlation analysis. The main conclusions are as follows:
1) A five-layer conceptual model was constructed, consisting of an unconfined aquifer, confining unit 1, confined aquifer 1, confining unit 2, and confined aquifer 2. Theoretical analysis shows that when the water level of the unconfined aquifer decreases, the effective stress of the unconfined aquifer increases, while the effective stress of the confined aquifers and the confining unit 2 decreases slightly. Note that there is a critical point in confining unit 1 where the effective stress remains unchanged. After the water head in confined aquifers declines, the effective stress of the unconfined aquifer remains unchanged, and the effective stress of both confined aquifers and confining units increases. Ground subsidence occurs whether groundwater is pumped from unconfined or confined aquifers.
2) The land subsidence of the Cangzhou Plain is mainly caused by the exploitation of deep confined groundwater. After taking measures to close the self-provided wells, the land subsidence in the central urban area of Cangzhou City has been gradually controlled. The monitoring data of the land subsidence center in the central urban area show that land subsidence has a very good correlation with groundwater extraction and groundwater level.
3) Geotechnical tests show that the change in compressive modulus with increasing pressure can be divided into 4 stages, and that the compressive modulus increases with the increase of soil depth as a whole. The degree of soil consolidation is an important index that affects soil compression, and soil layers with low degree of consolidation are easy to compress. Land subsidence in the Cangzhou Plain has a strong hysteresis because the excess pore water pressure dissipating in the low-permeability aquitards needs long time. At the same time, the creep characteristics of soil under different load conditions are obvious, which is also a reason for the delay of land subsidence. Therefore, the creep factor of clayey soil layers should be considered in the calculation model of land subsidence. The deformation characteristics of strata driven by groundwater level variations change greatly with buried depths, and those of the shallow aquifer are mainly elastic.
4) The area of severe land subsidence is closely related to rainfall. Reduced rainfall will lead to reduced groundwater recharge and increased groundwater abstraction, which will exacerbate the development of land subsidence. The thickness difference of Quaternary sediments and deep confined groundwater level differences across the fault may be the main reasons for the abrupt areal changes in subsidence across the Cangdong fault. InSAR results can provide a good indication for understanding the development and characteristics of the fault.
Data availability statement
The original contributions presented in the study are included in the article/Supplementary Material, further inquiries can be directed to the corresponding author.
Author contributions
Conceptualization, HG, AH, and WL; data curation, HG; formal analysis, HG, AH, and WL; funding acquisition, HG; investigation, HG, XZ, YW, and YC; methodology, HG; supervision, XZ, JZ, LW, and YC; writing—original draft, HG; writing—review and editing, HG, AH, WL, XZ, and LW. All authors have read and agreed to the published version of the manuscript.
Funding
This work was supported by the National Natural Science Foundation of China (Grant No. 41877294) and the China Geological Survey (Grant Nos. DD20160235 and DD20190679).
Conflict of interest
The authors declare that the research was conducted in the absence of any commercial or financial relationships that could be construed as a potential conflict of interest.
Publisher’s note
All claims expressed in this article are solely those of the authors and do not necessarily represent those of their affiliated organizations, or those of the publisher, the editors and the reviewers. Any product that may be evaluated in this article, or claim that may be made by its manufacturer, is not guaranteed or endorsed by the publisher.
References
Amighpey, M., and Arabi, S. (2016). Studying land subsidence in Yazd province, Iran, by integration of InSAR and levelling measurements. Remote Sens. Appl. Soc. Environ. 4, 1–8. doi:10.1016/j.rsase.2016.04.001
Asadi, R., and Ataie-Ashtiani, B. (2016). Numerical modeling of subsidence in saturated porous media: A mass conservative method. J. Hydrol. X. 542, 423–436. doi:10.1016/j.jhydrol.2016.09.024
Augustesen, A., Liingaard, M., and Lade, P. V. (2004). Evaluation of time-dependent behavior of soils. Int. J. Geomech. 4 (3), 137–156. doi:10.1061/(asce)1532-3641(2004)4:3(137)
Bai, L., Jiang, L., Zhao, Y., Li, Z., Cao, G., Zhao, C., et al. (2022). Quantifying the influence of long-term over exploitation on deep groundwater resources across Cangzhou in the North China Plain using InSAR measurements. J. Hydrol. X. 605, 127368. doi:10.1016/j.jhydrol.2021.127368
Castellazzi, P., Martel, R., Galloway, D. L., Longuevergne, L., and Rivera, A. (2016). Assessing groundwater depletion and dynamics using GRACE and InSAR: Potential and limitations. Groundwater 54 (6), 768–780. doi:10.1111/gwat.12453
Castelletto, N., Gambolati, G., and Teatini, P. (2015). A coupled MFE poromechanical model of a large-scale load experiment at the coastland of Venice. Comput. Geosci. 19 (1), 17–29. doi:10.1007/s10596-014-9450-y
Chaussard, E., Milillo, P., Bürgmann, R., Perissin, D., Fielding, E. J., and Baker, B. (2017). Remote sensing of ground deformation for monitoring groundwater management practices: Application to the Santa Clara Valley during the 2012–2015 California drought. JGR. Solid Earth 122 (10), 8566–8582. doi:10.1002/2017jb014676
Enomoto, T., Koseki, J., Tatsuoka, F., and Sato, T. (2015). Creep failure of sands exhibiting various viscosity types and its simulation. Soils Found. 55 (6), 1346–1363. doi:10.1016/j.sandf.2015.10.002
Foster, S., Garduno, H., Evans, R., Olson, D., Tian, Y., Zhang, W., et al. (2004). Quaternary aquifer of the north China plain—Assessing and achieving groundwater resource sustainability. Hydrogeol. J. 12 (1), 81–93. doi:10.1007/s10040-003-0300-6
Galloway, D. L., Jones, D. R., and Ingebritsen, S. E. (1999). Land subsidence in the United States: US Geological Survey Circular 1182, 177. Reston, VA, USA: US Geological Survey.
Gambolati, G., and Teatini, P. (2015). Geomechanics of subsurface water withdrawal and injection. Water Resour. Res. 51 (6), 3922–3955. doi:10.1002/2014wr016841
Geometrics, Inc. (2000). Operation manual for stratagem systems running IMAGEM. Ver. 2. 16. San Jose, U.S.A.Geometrics, Inc
Guo, H., Zhang, Z., Cheng, G., Li, W., Li, T., and Jiao, J. J. (2015). Groundwater-derived land subsidence in the north China plain. Environ. Earth Sci. 74 (2), 1415–1427. doi:10.1007/s12665-015-4131-2
He, G. F., Yan, X. X., Zhang, Y., Yang, T. L., Wu, J. C., Bai, Y., et al. (2020). Experimental study on the vertical deformation of soils due to groundwater withdrawal. Int. J. Geomech. 20 (7), 4020076. doi:10.1061/(asce)gm.1943-5622.0001709
Hernandez-Marin, M., and Burbey, T. J. (2012). Fault-controlled deformation and stress from pumping-induced groundwater flow. J. Hydrol. X. 428, 80–93. doi:10.1016/j.jhydrol.2012.01.025
Hu, R. L., Yue, Z. Q., Wang, L. C., and Wang, S. J. (2004). Review on current status and challenging issues of land subsidence in China. Eng. Geol. 76 (1-2), 65–77. doi:10.1016/j.enggeo.2004.06.006
Khan, A. S., Khan, S. D., and Kakar, D. M. (2013). Land subsidence and declining water resources in Quetta Valley, Pakistan. Environ. Earth Sci. 70 (6), 2719–2727. doi:10.1007/s12665-013-2328-9
Li, J. (2015). Analysis on the effect of groundwater mining restriction in Cangzhou City. Water Conservancy Sci. Technol. Econ. 21 (12), 4–6. (in Chinese).
Motagh, M., Walter, T. R., Sharifi, M. A., Fielding, E., Schenk, A., Anderssohn, J., et al. (2008). Land subsidence in Iran caused by widespread water reservoir overexploitation. Geophys. Res. Lett. 35, L16403. doi:10.1029/2008GL033814
Ovando-Shelley, E., Ossa, A., and Romo, M. P. (2007). The sinking of Mexico City: Its effects on soil properties and seismic response. Soil. Dyn. Earthq. Eng. 27 (4), 333–343.
Pacheco-Martínez, J., Hernandez-Marín, M., Burbey, T. J., González-Cervantes, N., Ortíz-Lozano, J. Á., Zermeño-De-Leon, M. E., et al. (2013). Land subsidence and ground failure associated to groundwater exploitation in the Aguascalientes Valley, México. Eng. Geol. 164, 172–186. doi:10.1016/j.enggeo.2013.06.015
Pham, H. T., Rühaak, W., Schuster, V., and Sass, I. (2019). Fully hydro-mechanical coupled Plug-in (SUB+) in FEFLOW for analysis of land subsidence due to groundwater extraction. SoftwareX 9, 15–19. doi:10.1016/j.softx.2018.11.004
Poland, J. F., and Davis, G. H. (1969). “Land subsidence due to withdrawal of fluids,” in Reviews in engineering geology, 2. Editors D. J. Varnes, and G. Kiersch (Boulder, CO: Geological Society of America) 187–269.
Riley, F. S. (1969). “Analysis of borehole extensometer data from central California,” in Land subsidence, 89, no.2. Editor L. J. Tison (Washington, D. C, USA: International Association of Scientific Hydrology), 423–431.
Sexton, B. G., McCabe, B. A., Karstunen, M., and Sivasithamparam, N. (2016). Stone column settlement performance in structured anisotropic clays: The influence of creep. J. Rock Mech. Geotechnical Eng. 8 (5), 672–688. doi:10.1016/j.jrmge.2016.05.004
Sivasithamparam, N., Karstunen, M., and Bonnier, P. (2015). Modelling creep behaviour of anisotropic soft soils. Comput. Geotech. 69, 46–57. doi:10.1016/j.compgeo.2015.04.015
Tomás, R., Romero, R., Mulas, J., Marturià, J. J., Mallorquí, J. J., López-Sánchez, J. M., et al. (2014). Radar interferometry techniques for the study of ground subsidence phenomena: A review of practical issues through cases in Spain. Environ. Earth Sci. 71 (1), 163–181. doi:10.1007/s12665-013-2422-z
Tsai, M. S., and Hsu, K. C. (2018). Identifying poromechanism and spatially varying parameters of aquifer compaction in Choushui River alluvial fan, Taiwan. Eng. Geol. 245, 20–32. doi:10.1016/j.enggeo.2018.07.025
Tsai, T. L. (2015). A coupled one-dimensional viscoelastic–plastic model for aquitard consolidation caused by hydraulic head variations in aquifers. Hydrol. Process. 29 (22), 4779–4793. doi:10.1002/hyp.10524
Ye, S., Luo, Y., Wu, J., Yan, X., Wang, H., Jiao, X., et al. (2016). Three-dimensional numerical modeling of land subsidence in Shanghai, China. Hydrogeol. J. 24 (3), 695–709. doi:10.1007/s10040-016-1382-2
Zeitoun, D. G., and Wakshal, E. (2013). Land subsidence analysis in urban areas: The bangkok metropolitan area case study. Springer Science & Business Media.Singapore
Zhou, Z. (2012). Mechanism research of land subsidence caused by groundwater extraction. Geotechnical Investigation Surv. 3, 22–26. (in Chinese ).
Zhu, C., Zhang, Y., He, G. F., and Sun, T. (2018). In-situ tests of land subsidence caused by pumping in the Tianjin Binhai New Area. Hydrogeology Eng. Geol. 45 (2), 159–164. (in Chinese ).
Keywords: Cangzhou, land subsidence, soil deformation, groundwater level, confined aquifer
Citation: Guo H, Hao A, Li W, Zang X, Wang Y, Zhu J, Wang L and Chen Y (2022) Land subsidence and its affecting factors in Cangzhou, North China Plain. Front. Environ. Sci. 10:1053362. doi: 10.3389/fenvs.2022.1053362
Received: 25 September 2022; Accepted: 18 October 2022;
Published: 31 October 2022.
Edited by:
Lichun Wang, Tianjin University, ChinaCopyright © 2022 Guo, Hao, Li, Zang, Wang, Zhu, Wang and Chen. This is an open-access article distributed under the terms of the Creative Commons Attribution License (CC BY). The use, distribution or reproduction in other forums is permitted, provided the original author(s) and the copyright owner(s) are credited and that the original publication in this journal is cited, in accordance with accepted academic practice. No use, distribution or reproduction is permitted which does not comply with these terms.
*Correspondence: Haipeng Guo, cGVuZ2ZlaTc5NzFAc29odS5jb20=