
95% of researchers rate our articles as excellent or good
Learn more about the work of our research integrity team to safeguard the quality of each article we publish.
Find out more
ORIGINAL RESEARCH article
Front. Environ. Sci. , 10 November 2022
Sec. Environmental Informatics and Remote Sensing
Volume 10 - 2022 | https://doi.org/10.3389/fenvs.2022.1052930
This article is part of the Research Topic Geophysical, Climatological and Anthropogenic Hazards and Disaster: Vulnerability, Risk Assessment, and Sustainability View all 11 articles
 Bo Tang1*
 Zechuang Tan1,2
Resilience city, a new concept of city sustainable development, becomes one of the important subjects of high-quality development research. Compared to the traditional urban disaster mitigation approach, resilient cities focus more on the organizational capacity and coordination within the urban systems. Taking Guangzhou metropolitan area as an instance, which is featured a highly developed economy and society and frequently happened hazards and disturbances, the paper constructs an evaluation index system from four city subsystems, including economy, society, ecology, and engineering. Meanwhile, by applying the methods of global entropy weight, variation coefficient, geographic information system, and obstacle degree model, the paper explores the time changes, space evolution, and obstacle degree factors of city resilience in the Guangzhou metropolitan area from 2010 to 2020. The research results show that: (1) There is a significant change in the time difference of city comprehensive resilience of the Guangzhou metropolitan area. The resilience of each city’s resilience subsystem has grown steadily, of which the development level of economic resilience, social resilience, and engineering resilience has been steadily improved, and ecology resilience level shows a slight decline among a steadily increasing. (2) The overall city resilience of the Guangzhou metropolitan area shows a radial pattern taking Guangzhou as the core, of which the city economy, society, and engineering resilience grades mainly show a medium and low resilience level, the ecology resilience mainly shows a medium and high resilience level, and the general performance of resilience space distribution level is high in the southeast and low in the northwest. (3) Social resilience and ecological resilience are the main driving subsystems in the early and late stages of city resilience development in Guangzhou metropolitan area during the research period, and engineering resilience is the main constraint subsystem. (4) Water and soil loss control area and population density are the main obstacle factors in the early and late stages of city resilience in the Guangzhou metropolitan area. The density of the city drainage pipeline and the total import and export volume are the basic resilience barrier factors. The paper analyzes the spatial-temporal pattern and influencing factors of city resilience in the metropolitan area from a multi-dimensional perspective, provides a new thinking and analysis framework for the management and sustainability of city resilience in the metropolitan area, and provides a reference for the coordinated development of the metropolitan area.
As the main place for human activities and the energy flow cycle space carrier, the city is constantly challenged by its systems and external environment. Meanwhile, the city is a comprehensive society-economy-ecology system with certain “Resilience” and is capable of resisting external interference and reducing disaster losses with its capabilities to make the system realize a new balance status through adaptation or recovery (Zhao, et al., 2020). City resilience, an emerging concept in the field of ecology and environment, mainly focuses on the relationships between the structural complexity and functional diversity of the city and nature, economy, and society (Xu et al., 2018). The research on resilience theory and resilience city launched early and developed rapidly in foreign countries. Through exploring the potential problems and risks of the city system and improving the city’s reaction capability to uncertain disturbances and shocks, the concept of city resilience has increasingly been cared for worldwide under the support of international organizations, government agencies, and private foundations. The concept analysis, index construction, and research methods of resilience city in foreign countries are relatively perfect, and many research achievements have been obtained in the fields of natural science, engineering technology, and society economy (Herrera et al., 2016; Lorenz, 2013; Meerow et al., 2016). Based on this, the paper proposes and plans, and builds “Resilient City” (Turner et al., 2003) and “Resilient Community” (Colclough et al., 2021) in a targeted manner, and actively promotes interdisciplinary research and cross-field cooperation. The concept of city resilience was proposed at the American Ecological Academic Year Meeting in 2002. There is still no broad consensus on its scientific definition, which is mainly because the composition and characteristics of the city system are highly different on the global, regional, and even local scales, and the city system is subject to the disturbance factors of the external environment with diversity and dynamics (Müller, 2010), including various natural disasters, public health, and public safety events. Meanwhile, with global climate change, cities have begun to vigorously promote carbon peaking and carbon neutrality, deepen ecological civilization and promote green and low-carbon lifestyles to improve their ability to cope with weather and climate extremes and adapt to the adverse effects of climate change (Osman, 2021). Scholars focus on global environmental issues caused by different sectors (e.g., production, construction, shipping, manufacturing, etc.) (Zhang et al., 2021; Dulebenets, 2018), actively explore the mechanisms of energy consumption structure, industrial development degree, technical equipment, energy efficiency and other factors on urban ecological environment, and deepen the study of the resilience of urban ecosystem (Grzegorz et al., 2021; Liang et al., 2021). In terms of research content, there are different levels and dimensions involved. For instance, the City Resilience Index (CRI) published by the Rockefeller Foundation is a city resilience evaluation system with a relative influencing power at present (Marjolein and Bas, 2017). There are four dimensions in CRI: health and well-being, economy and society, infrastructure construction and environment, and leadership and strategy, which combines qualitative and quantitative methods to evaluate and has a relatively comprehensive index system. Desouza and Flanery (2013) thought that the deficiencies of the city could be understood through resilience evaluation. Through three intervention activities of planning, designing, and managing, the dynamics and physical factors inside a resilient city could be influenced. From four perspectives of infrastructure resilience, policy resilience, economic resilience, and social resilience, Jabareen (2013) studied multidisciplinary and complex city resilience. In terms of research methods, attention was paid to the improvement of the conceptual framework, the index system, and data analysis (Paulo and Luís, 2019). For instance, the “Global 100 Resilient Cities” plan puts emphasizes the complexity and diversity of the system and constructed a general framework with seven characteristics, including reflection, resource availability, inclusiveness, integrity, robustness, surplus, and plasticity, reflecting resilience city to manage with sudden disturbances and slow pressure (Amirzadeh et al., 2022). Through establishing an index system to evaluate community resilience, Simon et alapplied the interview to determine the index level to evaluate the infrastructure status of slum communities. This method can be applied to quickly evaluate community resilience, making the evaluation results more general and comprehensive (Simon et al., 2016). During the study of community anti-seismic resilience, Michel et al(2012) innovatively established a functional model of infrastructure resilience probability and resilience recovery time to obtain city infrastructure resilience through quantitative calculation and analysis. With the continuous accumulation of city big data and the continuous progress of cloud computing technology, it is promising that the quantitative evaluation mode, urban systems abstraction hierarchy (USAH), and simulation dynamic analysis method and technology of resilience city can be realized (Mcclymont et al., 2022).
The theoretical research on resilient cities in China launched relatively late. In recent years, with the national attention on public safety, many achievements have been accumulated on the research ideas, research objects, and research methods of resilient cities based on different perspectives (Li, 2017). However, it is still in the initial exploration stage, lacking systematisms and standardization, and the relevant theoretical framework needs improvement. In terms of theoretical research, the construction of a domestic city resilience evaluation index system is mainly based on the three perspectives of city basic elements, city resilience characteristics, and the staging process of resilience development (Ni and Li, 2021). Xu and Shao (2015) made a comprehensive analysis of the connotation of a resilient city, what characteristics a resilient city shall have, and how to shape a city’s resilience, which provides a new idea for managing crisis. Standing at the perspective of the social ecology system, Sun et al(2017) analyzed and obtained the city resilience status and space differentiation characteristics of each region in the Yangtze River Delta region from four levels, including economy, society, ecology, and municipal facilities. Wu and Chen (2018) divided the recovery capacity of resilient cities into four stages, including resilience recovery, recovery capacity loss, recovery capacity enhancement, and recovery capacity loss, to reveal its evolution mechanism and summarize the social significance of the recovery capacity of the resilient city. In terms of case studies, taking provinces and city agglomerations as research objects, scholars mainly evaluated city resilience characteristics and influencing factors from different research perspectives. Bai et al(2019) constructed a comprehensive city resilience measurement index system from four systems, including economy, society, ecology, and infrastructure to quantitatively evaluate cities’ resilience above the prefecture level in China. In terms of research methods, there are prevailing methods, including the analytic hierarchy process, TOPSIS entropy weight, cloud model risk matrix, and neural network. The construction of city resilience reflects the risk awareness and bottom-line thinking of city development and is the basic guarantee for constructing a new development pattern and promoting high-quality city development (Liu, 2021). In recent years, with the progressive impact of natural disasters and public health events on cities, research on resilience regulation and management has been gradually gaining the attention of scholars. The research objects of city resilience governance in China mainly focus on city risks, the construction of a resilience governance system around the evaluation system, and the resilience governance path centered on sustainable development (He et al., 2022). The rapid development of urbanization in China urgently needs to improve city resilience through city and rural planning. City resilience can be improved by standing at four dimensions of nature, function, space, and governance, and combining material aspects of planning technology and construction standards and social aspects of social regulation and public participation (Fei et al., 2014). These resilience management measures have played an important role in the city’s response to natural disasters and public health emergencies (Yang et al., 2019).
Standing at the perspective of the city system, foreign scholars analyze the composition and combination of city resilience under different scales, pay close attention to the influence of natural disasters on the city system, and focus on the study of community resilience of city human settlements. Domestic scholars pay more attention to resilience evaluation based on the basic elements of cities. Based on quantitative statistical analysis methods, they study city resilience development under different spatial scales and propose relevant city resilience planning concepts. In conclusion, there are numerous efforts and work have been performed on city resilience for concept connotation, theoretical framework, and evaluation methods at home and abroad, which have obtained numerous inspirations. The research scale on city resilience is gradually diversified. In terms of the index system, multi-disciplinary crossover and integration are conducted to break through the constraints of “Internal Risks”, and gradually expand to external factors, including nature, society, economy, and ecology. However, there is difficulty in reaching a consensus on the theoretical framework of city resilience, and the rapid changes and uncertainties of constituent factors, functional linkage structure, and regional and internal and external environments of the city have increased the complexity of the city resilience evaluation systems and evaluation process (Ni and Li, 2021). Currently, there is still room for improvement in specific research as follows, including insufficient analysis of the development process and changing characteristics of city resilience; the research scales are mostly concentrated at the macro level (country, province) and micro level (community), and there are few research on the city resilience of metropolitan areas in the middle scale field; there are few analysis on the restrictive factors restricting the comprehensive resilience of cities, and insufficient attention paid to the regulation and management of resilience.
With the rapid urbanization process, lagging construction of supporting facilities, and lack of urban emergency and response systems and social governance mechanisms, urban vulnerability is very obvious. Secondly, since the types of risks faced by cities in different regions vary greatly, a uniform risk management mechanism cannot effectively mitigate crises. Therefore, it has become a pressing issue to study how cities can cope with “uncertainty disturbances” and enhance urban resilience. The Metropolitan area, an important node in the construction of city agglomerations in China, is important in realizing area-integrated and regional coordinated development. The Guangzhou metropolitan area is a key area in the economic development plan of Guangdong Province. Evaluating its city resilience and grasping the development path of city resilience can effectively prevent serious losses caused by city public safety issues. Therefore, adopting the global entropy weight method, taking time sections of 2010, 2012, 2014, 2016, 2018, and 2020, and starting from the basic factors of the four resilient dimensions, including economy, society, ecology, and engineering, the paper conducts a dynamic spatial-temporal evolution. Meanwhile, combining with system factor and the obstacle degree factor of city resilience development in the Guangzhou metropolitan area, the paper analyzes its influence mechanism, aiming at providing a reference for the general development and planning of cities in the Guangzhou metropolitan area in the future and achieving the optimization of resource allocation to promote the resilient development of Guangzhou metropolitan area. Furthermore, the paper can offer experience and suggestions for the development of city resilience in other metropolitan areas in Guangdong Province, as well as a reference for the high-quality development of cities in Guangdong Province.
Figure 1 shows the study area. The Guangzhou metropolitan is the largest one of the five major metropolitan areas in Guangdong Province. It includes six cities, Guangzhou, Foshan, Zhaoqing, Qingyuan, Yunfu, and Shaoguan, with a total area of 71,171 km2, accounting for 39.6% of Guangdong Province. By the end of 2020, the resident population of the Guangzhou metropolitan area was 41.59 million, and the total Gross Domestic Product (GDP) was 422,805 billion, accounting for 32.94% and 38.17% respectively of Guangdong Province. The development within the Guangzhou metropolitan area is fast, but the economic growth, ecological environment, social conditions, and infrastructure development are unbalanced and insufficient. The Guangzhou metropolitan area will become a core area for developing advanced manufacturing industries, and strategic emerging industries and their supporting industries, it is the main area for Guangdong to move towards high-quality and regional coordinated development.
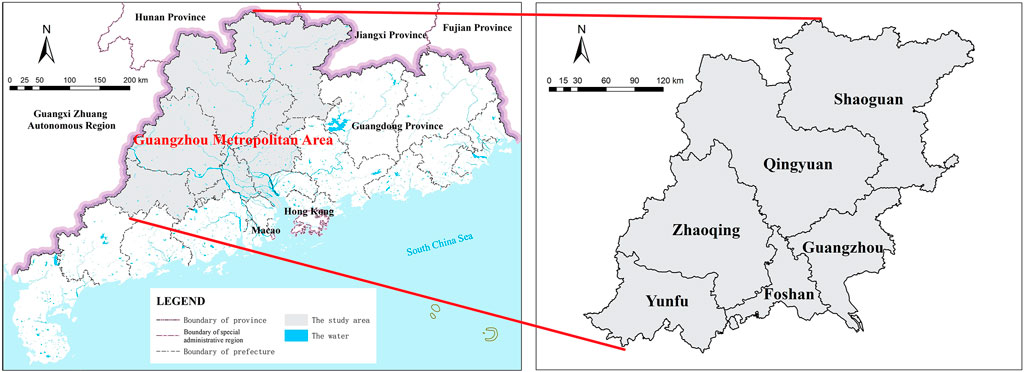
FIGURE 1. Study area.
The indicator statistics of this study mainly involve six cities within the Guangzhou metropolitan area and apply the content of 28 indicator evaluation factors for 6 years in 2010, 2012, 2014, 2016, 2018, and 2020. The specific indicator data were obtained from 2011, 2013, 2015, 2017, 2019, and 2021 Guangdong Statistical Yearbook, Guangdong Rural Statistical Yearbook, China Urban Statistical Yearbook, and each city’s statistical yearbook national economic and social development statistical bulletin. The ecological environment condition index is obtained from the environmental quality and monitoring bulletin of the department of ecology and environment of Guangdong province (http://gdee.gd.gov.cn/sthjzs/index.html). The number of Internet broadband access users has been obtained from the China urban statistical yearbook and China entrepreneur Investment Club (CEIC) statistical database (https://www.ceicdata.com/en). In the case of missing data from individual indicators, the mean value method is applied to make up the data according to the adjacent years.
Initially applied in the field of mechanical engineering, resilience was later introduced into ecological research. Defined as the capability of a system to return to its original equilibrium state after being subjected to external perturbations, resilience is used as a term to describe the characteristics of an ecosystem in its stable form (Li, 2017). At present, the theory of resilience has evolved from the engineering resilience of single homeostasis to the ecological resilience of multiple equilibria, and then to the continuous evolutionary resilience of complex fitness systems. It encompasses three theories of perturbation, systemic and adaptive capacity (Yang et al., 2021). The concept of a resilient city represents the integration of resilience theory with urban planning and management theory. In definition, an urban system can resist change, recover stability, and even reach a new equilibrium state through learning and adaptation, thus maintaining fundamental structures, critical functions, and significant features in response to internal disturbances and external shocks. Through an in-depth study of the theory and connotation of a resilient city, it is found that it is characterized mainly by redundancy, dynamic balance, diversity, adaptability, and others. Redundancy means that when damage is caused to the essential facilities of the urban system, there are backup facilities in place to ensure the normal operation of the urban system under exceptional circumstances. Dynamic equilibrium means the improvement and disturbance involved in the process of urban design. As for the overall balance and stability, they mean that the urban system consists of multiple subsystems that can withstand different risks. Adaptability is referred to as the capability of the urban system to deal with various threats through learning and improvement (Xu et al., 2019). To sum up, these elements provide general guidance on building the evaluation index system. At the same time, urban resilience evaluation plays a role in connecting theory with practice, the implication of which is two-fold. On the one hand, it is necessary to focus on the impact of uncertainty perturbations and the limited capacity of a city; on the other hand, it is essential to ensure the integrity of urban patterns and the continuity of functional operation. Urban resilience is inseparable from the support of the natural system, human system, and environmental system, including ecological, economic, social, institutional, facility and disaster dimensions (Zhang and Wang, 2019). As a territorial spatial organization of fusion, cross-border, and proximity, the urban resilience of the metropolitan area is coupled and dynamic. The analysis of the spatial and temporal evolution of urban resilience and the influencing factors can help coordination and cooperation within the metropolitan area, enhance the risk regulation ability of the metropolitan area, and realize the high-quality development of the metropolitan area. Figure 2 shows the theoretical basis for the research method in this study.
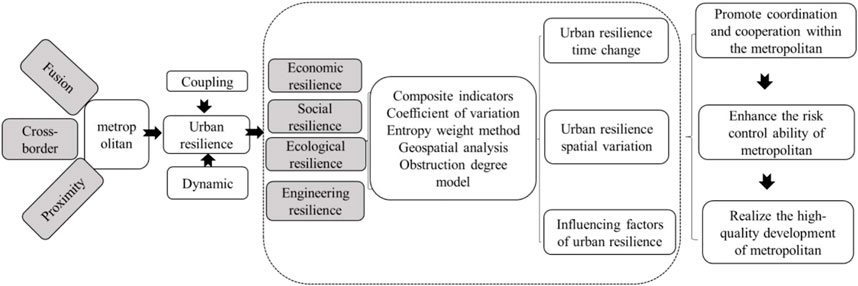
FIGURE 2. Research framework.
Urban resilience is a new idea of integrated regional risk response and governance, focusing on improving the ability of urban cluster systems to organize themselves, coordinate their functions, and adapt to uncertainty (Abid, 2016), emphasizing the plasticity, responsiveness, and evolution of changes in natural elements and human factors. The current urban resilience evaluation mainly focuses on three different scales: community, city, and region, and the evaluation focus of different scales are different, which leads to differences in the evaluation system (Shao and Xu 2015; Fang and Wang, 2015). Based on the concept of the resilient city, concerning summarizing the current literature research results (Turner et al., 2003; Marjolein and Bas 2017; Yang et al., 2019), and combined with the development characteristics of the Guangzhou metropolitan area and urban elements, the city resilience evaluation system is constructed from four criteria layers of economic, social, ecological, and engineering. Table 1 is the urban resilience evaluation index system in this study.
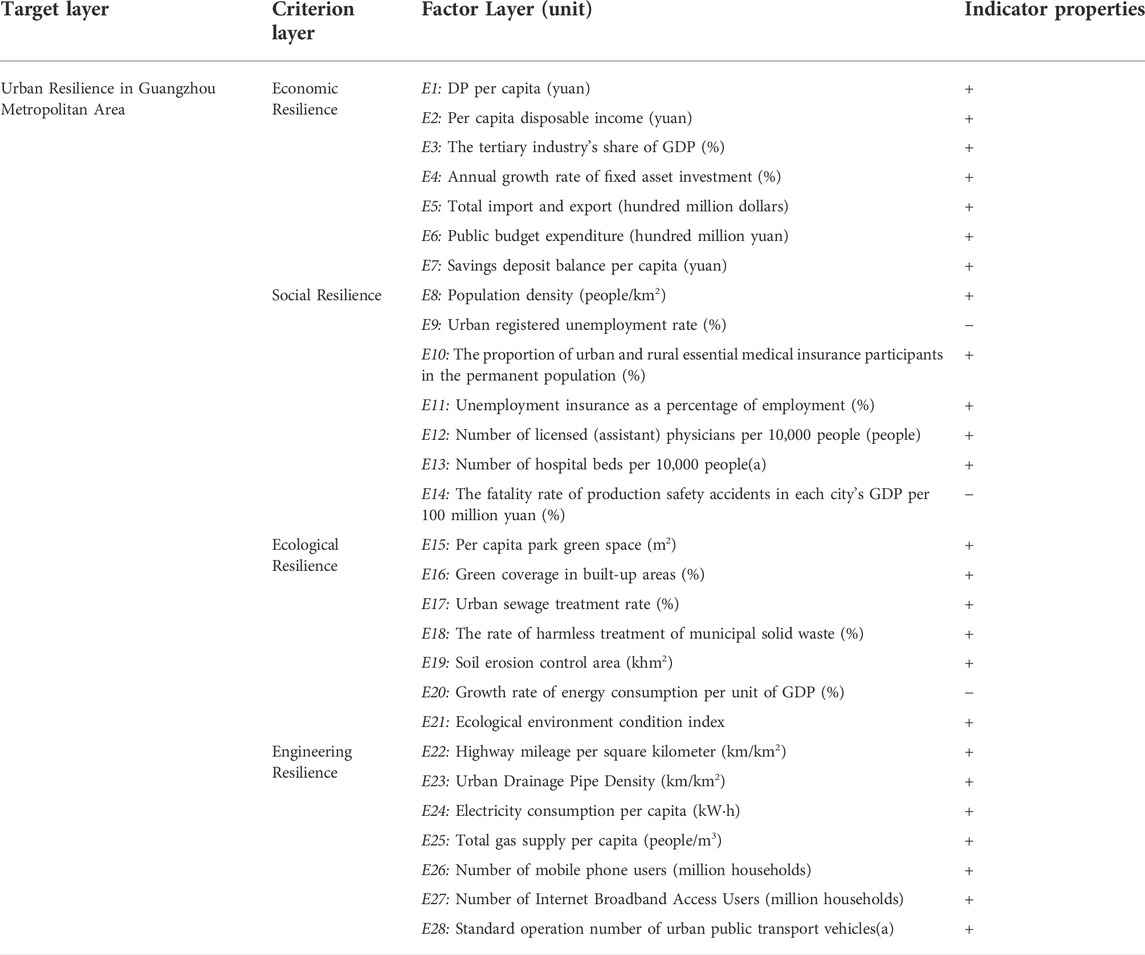
TABLE 1. Urban resilience evaluation index system in the Guangzhou metropolitan area.
By identifying and analyzing the factors of each urban resilience domain, the effect of each element on the development of urban resilience is explored below:
(1) Economic factors: The economic level of a city is the vane of its development and determines the development speed of its emergency system. High economic resilience systems often support cities with high comprehensive resilience to guarantee the coordination and adaptability among subsystems within the town. The economic indicators represented by GDP per capita can reflect the level of development of the city society, the degree of action, and the comprehensive macroeconomic operation; in addition, the per capita disposable income and the per capita savings balance can indicate the high standard of living of the residents and their property reserves, respectively. The public budget expenditure level reflects the investment in public utilities. The proportion of tertiary industry to GDP reflects the layout of the modern service industry in the city, and the expanding market scale of the tertiary sector can be the leading force in driving economic growth and absorbing employment. As the southern gate of China, Guangdong Province is the frontline of China’s reform and opening up and an essential window for attracting investment. Its inner cities, such as Guangzhou, Shenzhen, and Foshan, are famous for their robust commercial and financial environment.
(2) Social factors: social stability is the cornerstone of the long-term stability of the country and the city, and maintaining urban security and social stability is the top priority for development. Since 2019, the sudden health event represented by the new crown pneumonia epidemic has been the primary problem common to all countries worldwide. The fight against the epidemic has become a massive test of the world’s governance capacity, in which the number of licensed (assistant) physicians and the number of hospital beds directly affect the city’s relief for the infected population and the stability of the economic and social side of the city. The urban registered unemployment rate is the percentage of the registered unemployed population in a region, which reflects the unemployment status of urban residents. The ratio of the number of people insured by unemployment insurance to the number of employed people and the balance of the number of people insured by urban and rural basic medical insurance to the resident population can effectively reflect the ability of urban residents to effectively manage risk through insurance as a contractual economic relationship when experiencing unemployment and suffering from illness. Population density reflects the basic situation of the number of people per unit area in a region. The mortality rate of production and safety accidents with a gross domestic product of 100 million yuan can effectively reflect the level of investment and attention to safety production in cities, curbing the occurrence of safety accidents and maintaining social stability. It is worth noting that studies have shown that population mobility between cities, and between rural and urban areas are gradually becoming an important cause of regional land use, resource development, environmental change, and public health, and these are among the important drivers for studying urban resilience (Morrow, 1999). At the same time, population mobility also involves the issue of efficient transfer and sharing of public services, such as the employment market, housing market, medical and education system, infrastructure, and security management (Wang et al., 2012). Therefore, it is necessary to strengthen the scientific research and analysis of the mobile population at a later stage and to track and analyze the important outflow and inflow areas to better improve urban resilience (Betty et al., 2017).
(3) Ecological environment factors: The ecological environment is the material basis for human survival and the basic premise of development. Its ability to resist disasters and the quality of the green product directly affect the level of human survival and growth. The per capita park green area and the greening coverage rate of the built-up regions can reflect the level of urban residents living environment and quality of life. The rate of urban sewage treatment and the rate of harmless treatment of urban domestic waste can indicate the city’s ability to treat sewage and solid waste, which can help reduce urban pollutants in the ecological environment, improve the ecological resilience of the city and establish an environmentally sustainable city. Guangdong region is hot and rainy all year round, and soil erosion is joint on mountain slopes. The area of soil erosion control can indicate the city’s ability to reduce regional soil erosion and guarantee the stability of the regional ecological environment. The growth rate of energy consumption per unit of GDP reflects the change in energy consumption by regional living and production, concentrates on the sustainable development ability of the region, and is an essential indicator of comprehensive energy utilization efficiency. The ecological condition index reflects the multi-level complete ecological level of urban vegetation cover, biodiversity, and ecosystem stability, and the size of its index value is positively correlated with ecological resilience.
(4) Engineering facilities factor: Municipal infrastructure is the fundamental guarantee for the daily life of urban residents and is the indispensable material foundation for the survival and development of the city. Guangdong is prone to rain and floods in summer and the higher the density of urban drainage pipes, the stronger the city’s resilience to floods. Information and communication technology and development is an essential metric for urban resilience evaluation, which can enhance the ability of urban basic service facility system and community to cope with external disturbances (Song, 2020), and the number of cell phone users and Internet broadband access users better reflect the level of residents’ condition on essential information communication and exchange. The total gas supply and electricity consumption per capita reflect the city’s energy demand. Road mileage per square kilometer, the number of urban public transport vehicles standard operation demonstrates the level of function of urban road traffic and public transport; it’s within a specific limit, the more road mileage, the more public transport operations, the higher the operational efficiency of urban transportation, the higher the engineering resilience.
The global entropy weighting method is based on the traditional one, adding the time dimension for longitudinal comparison to determine the index weights. For the analysis of the original data, the greater the indicator dispersion, the greater the practical information of the indicator, the greater the entropy value, the higher the weight value, and vice versa smaller (Fang and Wang, 2015); the weighting results are shown in Table 2. The specific steps are as follows:
(1) Building the original matrix
where
(2) Standardizing the data

TABLE 2. The results of the weights.
Assuming that the evaluation index
(3) Calculate the ratio
(4) Calculate the entropy value
(5) Calculate the weight
The obstacle degree analyzes the diagnosis of regional urban resilience development disorders by three indicators: factor contribution, index deviation, and obstacle degree (Ma et al., 2014).
(1) Calculating factor contribution
(2) Calculating the indicator deviation
(3) Calculating the degree of obstacle
The results of the temporal evolution of the economic resilience degree of the Guangzhou metropolitan area are shown in Table 3. The standard deviation value of economic resilience of the Guangzhou metropolitan area also increases from 0.0478 to 0.0737 from 2010 to 2020, indicating that the absolute difference in economic resilience of the Guangzhou metropolitan area gradually expands. The coefficient of variation of economic resilience of the Guangzhou metropolitan area shows a decreasing trend year by year during the study period, with a decrease of nearly 26.06% in 2020 compared with 2010, indicating that the gap between the economic resilience of cities within Guangzhou metropolitan area gradually decreases, but the relative difference is still significant.
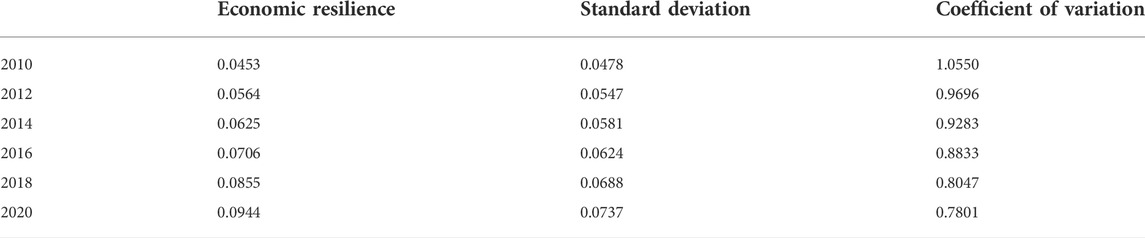
TABLE 3. Standard deviation and coefficient of variation of economic resilience in the Guangzhou metropolitan area from 2010 to 2020.
Figure 3 shows the temporal changes in economic resilience in the Guangzhou metropolitan area. Each city’s overall economic resilience degree shows an upward trend, but the increase rate of economic resilience degree is more variable. The cities represented by Guangzhou and Foshan have a significant increment of economic resilience during the study period. The overall annual growth rate is around 10%, with a more stable change. The cities represented by Zhaoqing show fluctuating changes in their economic resilience growth rates, with economic resilience growth slowing down during 2014–2016 to a rapid increase in urban economic resilience during 2016–2018, after which the economic resilience growth rates slow down to normal levels. Yunfu, Qingyuan, and Shaoguan have relatively small increments of economic resilience during the study period. Still, their underlying economic resilience is low, with an overall annual growth rate of about 20%, which is a more significant growth rate.
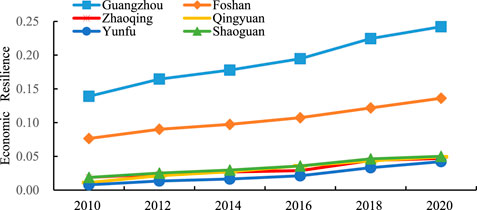
FIGURE 3. Temporal change of urban economic resilience in the Guangzhou metropolitan area.
Guangzhou and Foshan, as one of the most developed regions in the country in terms of the private economy and foreign trade, are ranked among the top in the Pearl River Delta region in terms of trade strength and openness intensity. The enormous total import and export volume can make the area enter the international market through exporting goods, which can also create foreign exchange income while making full use of production capacity and also ease the economic use of some of the strained resources through imported goods and develop city economy, to drive the city’s economic resilience to improve. Shaoguan and Qingyuan, in recent years, relying on the existing natural environment and humanities and history, and other tourism resources, vigorously develop the tourism service economy; the economy has introduced several measures to promote the development of high-end service industry clusters, boosting the growth of economic resilience of measures. In 2012, Zhaoqing New District began construction through a series of investments, actively strengthening the industrial chain aggregation and upgrading; Zhaoqing elevated its gross regional product and tertiary industry development and became the main driving force of economic resilience development. The main economic resilience degrees in Yunfu city during 2010–2014 benefited from the annual growth rate of fixed asset investment. The per capita savings deposit balance and the share of tertiary industry in GDP grow faster in the later period, reflecting that the focus of economic development in Yunfu city gradually moves to the tertiary sector as a new economic resilience growth point.
As depicted in Table 4, social resilience has a higher index in all years. The social resilience of the Guangzhou metropolitan area shows a shift from rapid increase to steady improvement during the study period, rising from 0.0640 in 2010 to 0.1243 in 2020, which is 1.94 times that in 2010. Among them, the highest average annual growth rate of 31.42% was recorded from 2010 to 2012, and the lowest average growth rate of only 5.56% was recorded from 2018 to 2020. The standard deviation of social resilience of the Guangzhou metropolitan area shows a “V” shape change, decreasing from 0.0587 to 0.0719 from 2010 to 2014 and then increasing to reach 0.0719 in 2020 gradually, indicating the absolute difference in social resilience of the Guangzhou metropolitan area decreases first and then increases. At the same time, the coefficient of variation of social resilience in the Guangzhou metropolitan area shows a fluctuating downward trend, and the coefficient of variation of social resilience reached the lowest value of 0.5611 in 2014, indicating that the relative difference in social resilience of Guangzhou metropolitan area cities fluctuates and changes significantly.
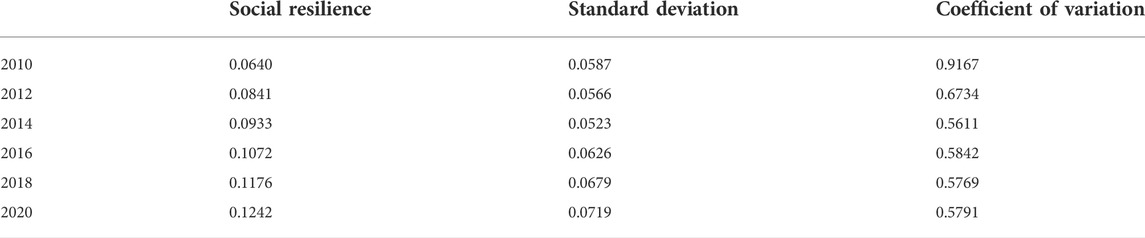
TABLE 4. Standard deviation and coefficient of variation of social resilience in the Guangzhou metropolitan area.
Figure 4 is the temporal change of social resilience. As depicted in Figure 4, the overall social resilience of each city showed a steady trend of improvement, but the rate of increase in social resilience varied widely among cities. As represented by Zhaoqing, Qingyuan, and Yunfu, the increase rate of social resilience in these cities showed an explosive increase in the early period, and the change rate tended to slow down in the middle and late periods. The annual growth rates of social resilience in Guangzhou and Foshan are the same during the study period, both showing a steady increase in the early period, a constant change in the middle period, and a gradual rise in the late period; the increment of social resilience in both cities is significant, but their social resilience base is extensive, with an overall annual growth rate around 10%. Social resilience of Shaoguan developed in an “S” curve, with a relatively small general increment. However, its base social resilience was lower, with an overall annual growth rate of 10% or less, and the growth rate was more significant. Each city is influenced by its social development foundation, and the main contributing factors of social resilience are different, but the overall change from pursuing a quantity to quality improvement. For example, Shaoguan increased focus on health care and primary health insurance has expanded its social resilience capacity. Guangzhou and Foshan focus on population density, recognizing that urban social resilience spirals from concern for groups to individuals to groups, protecting the safety and health of workers and ensuring the stable development of social fundamentals. On the other hand, Qingyuan, Yunfu, and Zhaoqing avoid economic losses due to disease risks by implementing urban and rural basic medical insurance coverage and preventing sick members of society from becoming “sick and poor.”
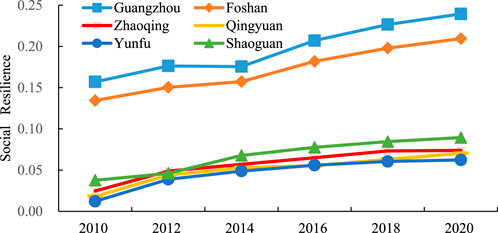
FIGURE 4. Temporal change of social resilience in the Guangzhou metropolitan area.
Table 5 is the standard deviation and coefficient of variation of ecological resilience. As shown in Table 5, the overall trend of ecological resilience is gradually increasing. From 0.0629 in 2010 to 0.1486 in 2018 and then declined to 0.1447 in 2020, the overall improvement is 0.0818, which is 2.30 times of 2010, with the highest average annual growth rate of 37.70% in 2016–2018 and the lowest average annual growth rate of −2.65% in 2018–2020. The standard deviation value shows a steady increasing trend, from 0.0160 in 2010 to 0.58 in 2020, with a significant increase, indicating that the absolute difference in ecological resilience of the Guangzhou metropolitan area gradually expands. The coefficient of variation of ecological resilience in the Guangzhou metropolis tan area shows a fluctuating trend, indicating that the relative differences between the ecological resilience degrees of cities within the Guangzhou metropolitan area fluctuate significantly.
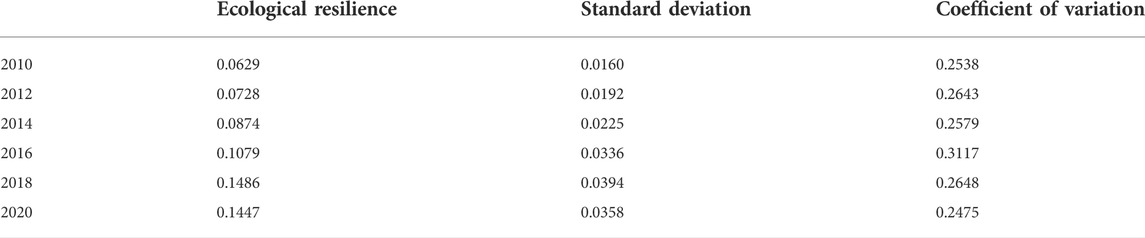
TABLE 5. Standard deviation and coefficient of variation of ecological resilience in the Guangzhou metropolitan area.
Figure 5 is the temporal change of ecological resilience. As shown in Figure 5, the overall ecological resilience of each city generally showed a trend of stepwise jumping improvement. The ecological resilience degree of Yunfu city increased more during 2014–2016, and after that, its ecological resilience degree changed more steadily; the ecological resilience degrees of Guangzhou, Foshan, Zhaoqing, Qingyuan, and Shaoguan increased faster during 2016–2018, and after that, the ecological resilience degrees of their cities increased and decreased to different degrees, but the overall changes were not significant. The increased rate of ecological resilience degree varies widely among cities. In Qingyuan and Shaoguan, ecological resilience increased steadily in the first period, decreased to different degrees in the middle period due to disturbances, and increased significantly and remained relatively stable later. The annual growth rates of ecological resilience in Guangzhou and Zhaoqing were the same, showing a steady increase in the early stage, a jump in the middle and late stages, and a slight decline in the late stage, with an average annual growth rate of 22%. The ecological resilience of Foshan City showed an “S” curve development, with minor changes in the early and late stages, a steady increase in the middle stage, and a relatively small increase overall. Still, its ecological resilience is low, and the annual average ecological resilience growth rate is around 20%. During the study period, influenced by the natural primary environmental conditions, the cities’ green, environmental protection, and sustainability requirements increased. Qingyuan, Yunfu, and Shaoguan have a more significant increase in the ecological and environmental condition index on the ecological resilience level of the cities, focusing on soil erosion management. Guangzhou and Foshan are mainly influenced by the ecological resilience degree from the harmless treatment rate of urban domestic waste and urban sewage treatment to the area of green park space per capita, reflecting the shift of Guangzhou’s concern for ecological resilience from the macro level of environmental protection and sustainability to the micro level of human living environment. Zhaoqing’s ecological resilience degree, on the other hand, focuses on green park space per capita to the ecological environment and ecological management construction of soil erosion, which also reflects China’s inevitable requirements and development goals for environmental and resource protection and ecological cities.
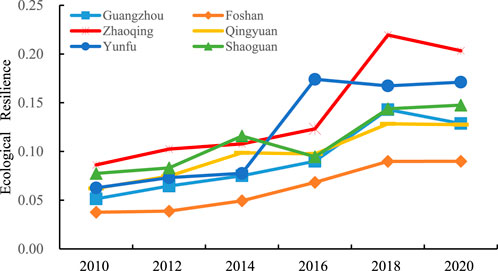
FIGURE 5. Temporal change of ecological resilience in the Guangzhou metropolitan area.
As shown in Table 6, the evolution of engineering resilience is in a stepwise development. The engineering resilience degree increases year by year during 2010–2020, from 0.0327 in 2010 to 0.0817 in 2020, an increase of 0.049, which is 2.49 times that in 2010, and there are two times when the city has a significant increase in engineering resilience degree, which are the average annual growth rate of 42.77% from 2010 to 2012 and the average annual growth rate of 2016–2018 growth rate of 30.88%. Same to the time-domain changes of the metropolitan area engineering resilience, the standard deviation values show a stepwise increase, with more significant gains in 2010–2012 and 2016–2018, indicating the absolute difference of the Guangzhou metropolitan area engineering resilience has experienced “expanding-stabilizing-expanding” dynamic change. The coefficient of variation of engineering resilience in the Guangzhou metropolitan area shows a trend of small fluctuation changes, indicating that the relative differences between the engineering resilience degrees of cities in the Guangzhou metropolitan area fluctuate significantly, and the changes in the evolution pattern of time-domain differences are not noticeable.
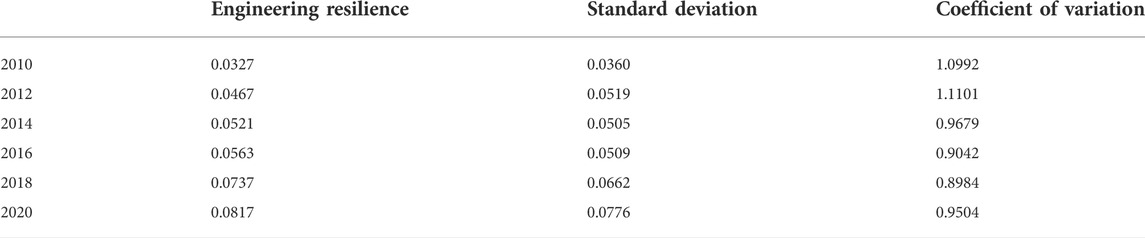
TABLE 6. Standard deviation and coefficient of variation of engineering resilience in the Guangzhou metropolitan area.
Figure 6 is the temporal change of engineering resilience level. As shown in Figure 6, each city’s engineering resilience growth pattern shows two patterns of stepped growth and stable improvement. Guangzhou and Foshan have a stepped growth pattern, and their annual growth rate of engineering resilience is significant during 2010–2012, reaching about 40%; the change in yearly growth rate tends to stabilize in the middle term and then ushers in a substantial increase in the annual growth rate of engineering resilience during 2016–2020. Except for Qingyuan in 2010–2012 and Zhaoqing in 2018–2020, where the engineering toughness declined, the cities represented by Zhaoqing, Qingyuan, Yunfu and Shaoguan showed a steady increase in the annual rate of growth in engineering toughness during the study period, reflecting the increase in the demand for infrastructure by regional residents and the strengthening of the local government’s investment in and maintenance of public facilities. The main contributing factors of engineering resilience vary among cities with different infrastructure coverage and perfection during the study period. As an important industrial city in Guangdong, the degree of supply and security of Shaoguan for industrial and domestic electricity can considerably bring considerable industrial infrastructure advantages and contribute to the city’s engineering resilience. As an important node city in the Pearl River-Xijiang River Economic Belt, the scale of its road construction and development and the density of its transportation network plays a vital role in the circulation of its urban resource elements and economic development. The engineering toughness of Guangdong and Florida cities is mainly concerned with the operation of urban public transportation and the construction of urban drainage pipes at a later stage to improve the overall structure of urban flood resistance and prevention after solving the flow of urban population elements. The engineering resilience of Qingyuan and Zhaoqing cities shows concern for infrastructure projects, such as road mileage, the number of Internet groups, and the supply management of primary energy for residents and enterprises.
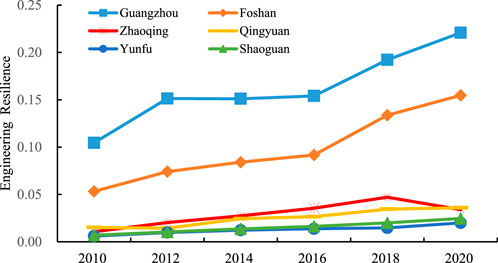
FIGURE 6. Temporal change of engineering resilience in the Guangzhou metropolitan area.
As shown in Table 7, the comprehensive resilience shows a balanced growth during the study period, rising from 0.2049 in 2010 to 0.4449 in 2020, 2.17 times that of 2010, with the highest average growth rate of 28.69% from 2010 to 2012 and lowest average growth rate of only 4.46% from 2018 to 2020. The value of the standard deviation of the comprehensive resilience of the Guangzhou metropolitan area shows an overall increasing trend year by year except for a decline in 2014, reaching 0.2017 in 2020, indicating the absolute difference of the comprehensive resilience shows an overall increasing development. The coefficient of variation of social resilience in the Guangzhou metropolitan area offers a “V-shaped” rebound trend during the study period, with the coefficient of variation decreasing year by year from 2010 to 2018, reaching a minimum value of 0.4947 in 2014 and increasing in 2020 after that, indicating that the relative differences between the comprehensive resilience of cities within Guangzhou metropolitan area experience a process of The coefficient of variation decreases year by year from 2010 to 2018, reaching the lowest value of 0.4947 in 2014, and then increases in 2020, indicating that the relative differences among cities within Guangzhou metropolitan area experience a process of decreasing and then increasing.
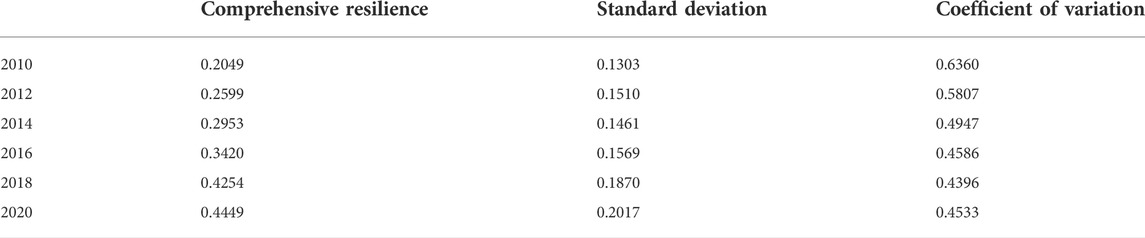
TABLE 7. Standard deviation and coefficient of variation of comprehensive resilience in the Guangzhou metropolitan area.
Figure 7 is the temporal change of the comprehensive resilience level of cities in the Guangzhou Metropolitan Area. As can be seen from Figure 7, the overall comprehensive resilience of each city shows a balanced growth trend, but the increased rate of complete annual resilience varies widely among cities. Guangzhou and Foshan experienced two rapid and two stable increases in the growth rate of integrated resilience during the study period, and the average value of their annual growth rate of integrated resilience was about 13%. Qingyuan, Yunfu, Zhaoqing, and Shaoguan, whose overall increase in comprehensive resilience is relatively tiny, but their essential comprehensive resilience is lower, with an overall annual growth rate of 20% or less, the growth rate is more significant.
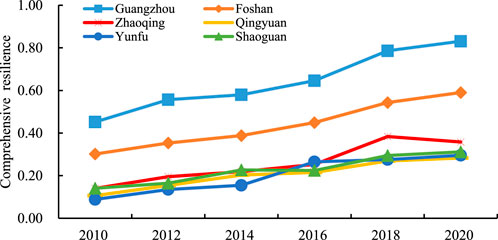
FIGURE 7. Temporal change of comprehensive resilience of cities in the Guangzhou metropolitan area.
Figure 8 is the trend of urban comprehensive resilience in the Guangzhou Metropolitan Area from 2010 to 2020. As shown in Figure 8, the primary driving subsystem of urban resilience development is social resilience in the early stage, and ecological resilience is the primary driving subsystem of resilience development in the later stage. Under the guidance of people-oriented and people-centered development ideology, the people’s growing need for a better life has changed from the pursuit of a quantity to quality, and maintaining the stability of social fundamentals has dramatically improved the development level of urban resilience, which is manifested in the significant improvement of the city’s public health care, residents’ employment work security services and other capabilities, prompting the people’s sense of national identity and happiness of life This has led to a significant increase in the people’s sense of national identity and well-being, which has led to the development of urban social resilience. In the late stage of the study period, thanks to the correct assertion that “mountains, water, forests, fields, lakes, grasses, and sand are a community of life,” the scientific concept that “Lucid waters and lush mountains are invaluable assets” and the “river chief system, lake chief system”. Since the 18th Party Congress, the Guangzhou metropolitan area has improved significantly in terms of urban green space system level and ecological environment condition, and became the primary driving subsystem of the Guangzhou metropolitan area in 2016, surpassing the social resilience level. However, engineering resilience is the primary constraining subsystem for developing urban resilience. As the lifeline of the urban system, the completeness of the facilities of urban infrastructure directly affects the resilience level of the urban system. With the improvement of urban residents’ living standards, residents have put forward higher requirements for urban infrastructures such as transportation, energy, communication, water supply, and drainage, which are essential for living and production activities. These contradictions can affect other urban resilience areas in a chain and thus restrict the development of urban resilience.
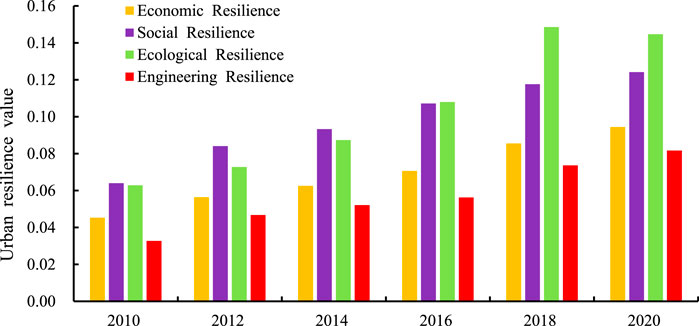
FIGURE 8. The trend of urban resilience in the Guangzhou metropolitan area from 2010 to 2020.
According to the changes in economic, social, ecological, engineering, and comprehensive resilience levels of the Guangzhou metropolitan area during 2010–2020, the natural break point method was applied to classify the resilience levels into five types: low resilience, lower resilience, moderate resilience, high resilience, and higher resilience, as shown in Table 8.
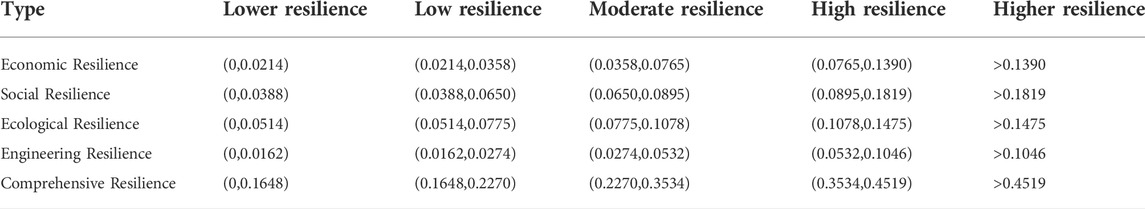
TABLE 8. Classification of urban resilience in the Guangzhou metropolitan area.
Figure 9 is the spatial evolution of economic resilience. As can be seen from Figure 9, the economic resilience of cities in the Guangzhou metropolitan area from 2010 to 2016 is dominated by lower resilience and low resilience; the economic toughness level from 2018 to 2020 is dominated by moderate resilience. The economic resilience level in the region is dominated by lower and moderate resilience, showing a spatial distribution pattern of high in the southeast and low in the northwest. From the geographical location of the cities, the economic resilience development of Zhaoqing, Qingyuan, and Shaoguan in the northern region is highly synchronized, mainly due to the unique geographical advantage of the three cities adjacent to the highly developed economy of Guangzhou and Foshan, forming a series of economic cooperation such as the Guangzhou-Foshan-Zhaoqing economic circle, Guangzhou-Shaoguan strategic collaboration, and Guangzhou-Qingyuan special price cooperation zone, which substantially promotes the related economic development and improve the level of economic resilience. Guangzhou, as the core city of the Guangzhou metropolitan area, is far ahead of the surrounding cities in terms of its level of urban economic resilience development, which has a radiation-driven effect on the economic resilience development of the surrounding cities. In addition, under the background of regional integration construction, Guangzhou and Foshan break through the administrative barriers between the two cities through economic interaction and promote the synergistic development of Guangzhou and Foshan using industrial complementation, resource sharing, and shared culture; therefore, their is also a synchronous effect on the economic resilience development of the two cities.
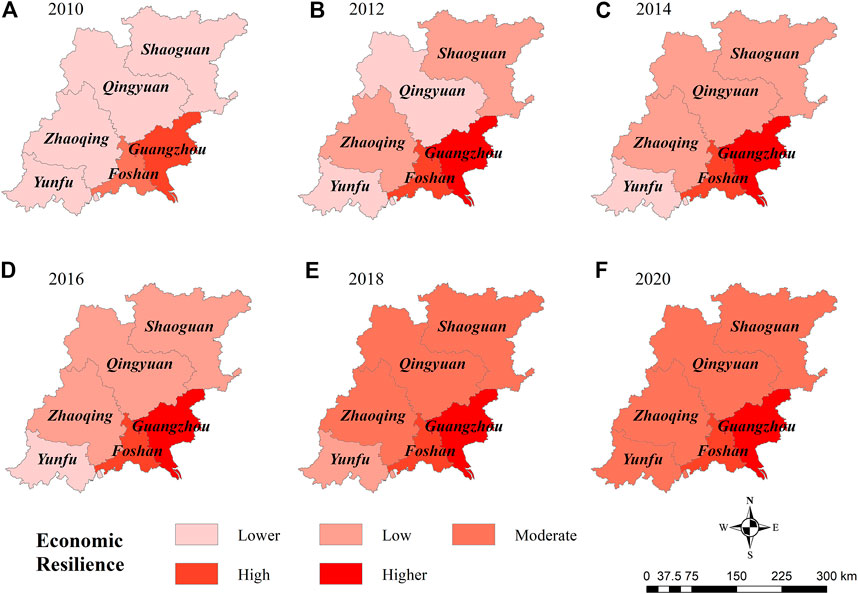
FIGURE 9. Spatial evolution of economic resilience in the Guangzhou metropolitan area in (A) 2010, (B) 2012, (C) 2014, (D) 2016, (E) 2018 and (F) 2020.
Figure 10 is the spatial evolution of social resilience in the Guangzhou Metropolitan Area from 2010 to 2020. As seen in Figure 10, the social resilience of cities has steadily improved, among which the social resilience of Zhaoqing, Qingyuan, and Shaoguan in the north has improved the most, from lower social resilience in 2010 to moderate social resilience in 2020. The spatial distribution of social resilience evolved from high southeast and low northwest in 2010, to a high east and familiar west layout in 2014–2016, and then presented a spatial pattern of high southeast and low northwest in 2020, with the distribution of the northwest-southeast axis of Guangzhou-Foshan. Guangzhou and Foshan’s social resilience level changes synchronized, which is mainly influenced by the role of the Guangzhou-Foshan co-city, the two cities in the medical insurance, and social security information are gradually achieving mutual recognition due to the existence of knowledge-intensive industries in Guangzhou and labor-intensive industries in Foshan complementary role, prompting the construction of modern enterprises in Guangzhou and Foshan to accelerate, providing more jobs for city residents and stabilizing people’s livelihood. Shaoguan has had a high level of social resilience development since 2014. It has implemented primary medical insurance for urban and rural residents, which has expanded the population covered by significant diseases and improved medical security.
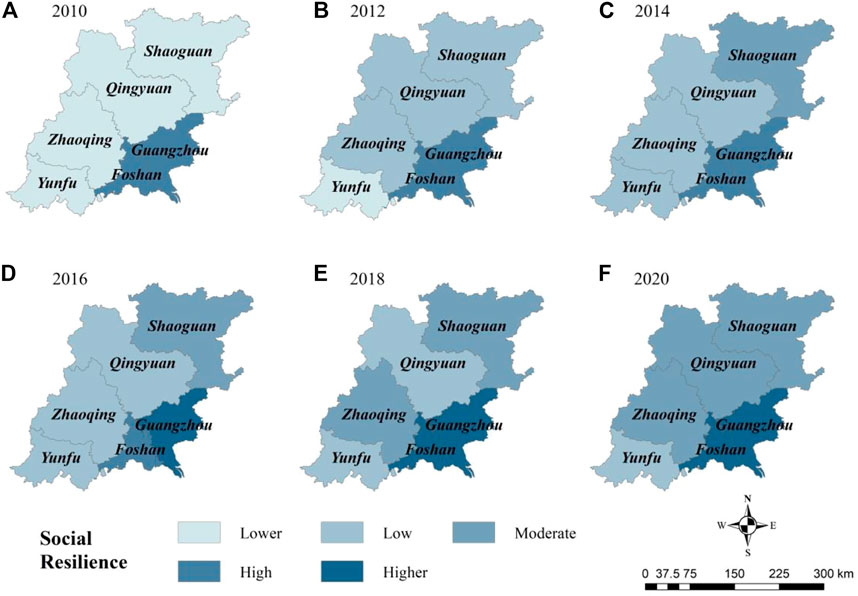
FIGURE 10. Spatial evolution of social resilience in the Guangzhou metropolitan area in (A) 2010, (B) 2012, (C) 2014, (D) 2016, (E) 2018 and (F) 2020.
Figure 11 is the Spatial evolution of ecological resilience, as shown from Figure 11, the spatial pattern of ecological resilience varies greatly. It differs significantly from the spatial distribution of urban economic and social resilience. From 2010 to 2012, the ecological resilience was high in the northwest and low in the southeast, developed into a north-high-south-low trend in 2014, and finally evolved into a west-high-east-low distribution pattern from 2016 to 2020. From the analysis of each city’s ecological resilience evolution, Guangzhou and Foshan have lower urban ecological resilience grades, mainly because the two cities belong to large cities with high population concentration and high industrial concentration. The metropolitan built-up area increases year by year, which significantly damages the natural ecosystem environment, especially Foshan, as the manufacturing capital and building materials capital in China, its processing and production activities also cause certain damage to the environment and weaken the overall ecological resilience. During the study period, the general urban ecological resilience level of Shaoguan in the northeastern part of the metropolitan area gradually increased. Still, its ecological resilience level decreased from higher to moderate from 2014 to 2016, due to the decrease in ecological construction treatments for soil erosion. Zhaoqing maintains a high level of ecological resilience especially since 2010 because Zhaoqing has established the River Chief System, Lake Chief System, and Forest Chief System to force industrial transformation through environmental protection and realize the harmonious coexistence of humans and nature.
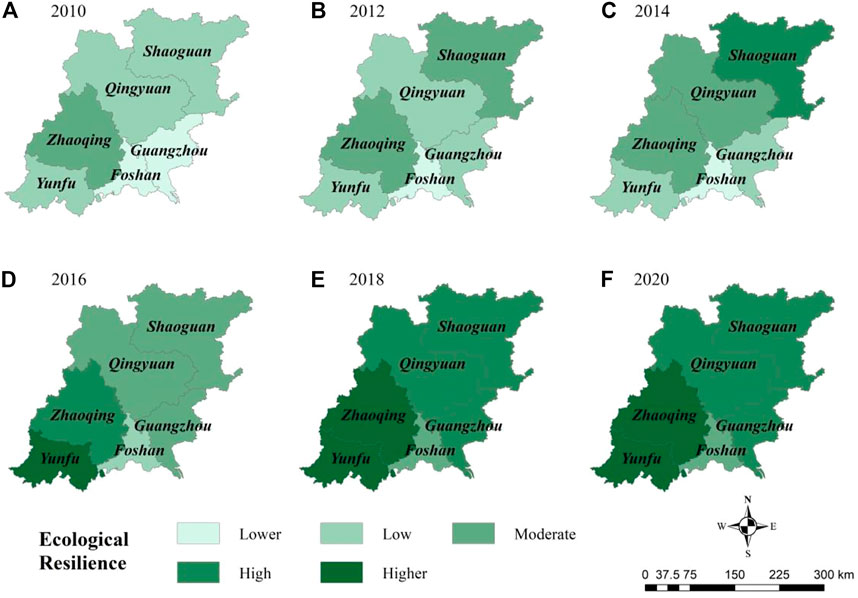
FIGURE 11. Spatial evolution of ecological resilience in the Guangzhou metropolitan area in (A) 2010, (B) 2012, (C) 2014, (D) 2016, (E) 2018 and (F) 2020.
As shown in Figure 12, the urban engineering resilience level of the Guangzhou metropolitan area mainly showed a spatial distribution of high in the southeast and low in the northwest. During 2012–2016, the southeast-northwest engineering resilience development axis was mainly formed, radiating the engineering resilience level of Zhaoqing and Qingyuan in the vicinity of Guangzhou-Foshan; in 2018–2020, a symmetrical distribution of urban engineering resilience level was finally formed with southeast to the northwest as the axis, and the distribution pattern of decreasing urban resilience level from inside to outside along the axis direction was presented. Zhaoqing and Qingyuan are influenced by the “Guang-Fo-Zhao economic circle” and Guangzhou-Qingyuan integration construction, which introduced advanced industries and built integrated infrastructure (eg: the Guang-Fo-Zhao intercity railroad and Guangzhou-Qingyuan intercity railroad) to improve regional transportation operation capacity and communication technology level, prompting the restricted resource endowment to be fully utilized and improving the overall engineering resilience level. The construction of the Guangzhou-Foshan co-city influences Guangzhou and Foshan, and the two cities are integrated into the transportation road network planning and construction. The infrastructure construction resources are shared, forming a peaceful development of complementary industrial development advantages, further making the synchronization development of urban engineering resilience.
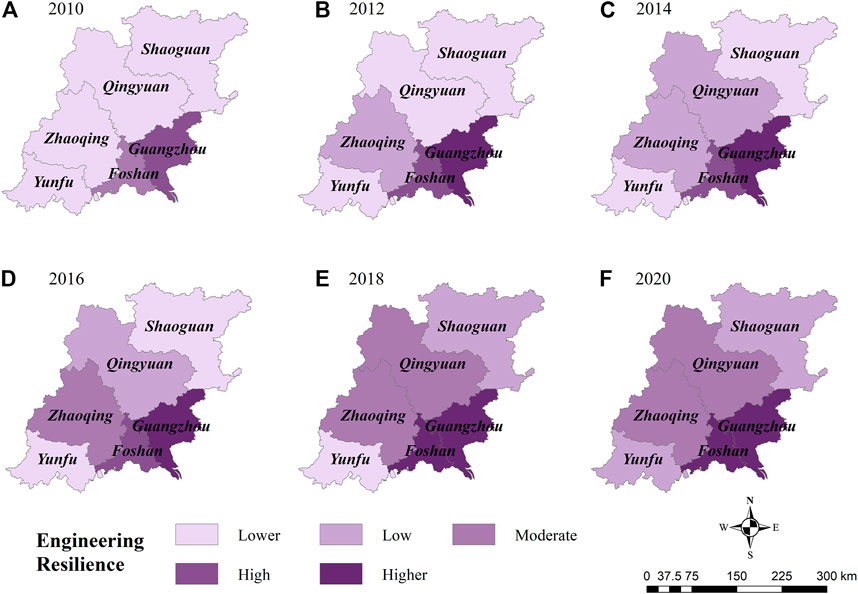
FIGURE 12. Spatial evolution of engineering resilience in the Guangzhou metropolitan area in (A) 2010, (B) 2012, (C) 2014, (D) 2016, (E) 2018 and (F) 2020.
Figure 13 is the spatial evolution of comprehensive resilience from 2010 to 2020. As can be seen from Figure 13, the comprehensive resilience of the cities in the Guangzhou metropolitan area has increased year by year. 2010–2014, the comprehensive resilience was mainly lower and low resilience, with an overall distribution pattern of high in the southeast and low in the northwest; after that, comprehensive resilience was mainly moderate and high resilience in 2016, with an overall spatial layout of high in the south and low in the north; in 2018–2020, which had a temporary increase in 2018 except Zhaoqing; the comprehensive resilience level in the range was mainly medium and higher, and generally reverted to the spatial distribution of high southeast and low northwest. During the early 2010–2014 period, Zhaoqing, Qingyuan, and Shaoguan had better development of comprehensive urban resilience, which was mainly due to the integrated development of economic, social, ecological, and engineering; Zhaoqing had an outstanding performance in economic resilience and ecological resilience, Shaoguan had higher levels of social resilience and ecological resilience, Qingyuan had high engineering resilience. In late 2016–2020, Yunfu practiced the concept of ecological civilization development and made full use of ecological advantages, to improve the city’s comprehensive resilience level. Zhaoqing was affected by the new crown pneumonia epidemic in 2020, and its infrastructure development rate decreased, which decreased the city’s comprehensive resilience level. As the leading cities in the Guangzhou metropolitan area, Guangzhou and Foshan have a high resilience capacity, which radiates the simultaneous resilience development of the surrounding cities and the coordinated development of the region was enhanced.
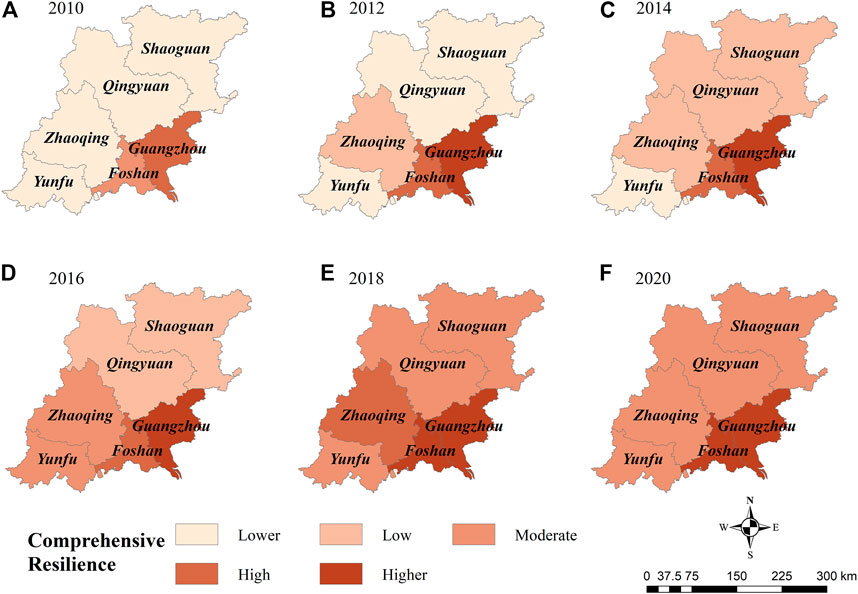
FIGURE 13. Spatial evolution of comprehensive resilience in the Guangzhou metropolitan area in (A) 2010, (B) 2012, (C) 2014, (D) 2016, (E) 2018 and (F) 2020.
Table 9 is the resilience obstacle of urban subsystems in the Guangzhou Metropolitan Area from 2010 to 2020. As can be seen from Table 9, the engineering factor hinders the development of urban resilience the most, followed by the economic sector, while the social and ecological habitat impedes the development of urban resilience to a relatively small extent.
(1) The economic subsystem obstacle has a slight overall increase in the barrier degree during 2010–2020, and the average value of the barrier degree in all years is 27.07%. Since the international financial crisis in 2008, countries worldwide have fallen into an economic downturn. The fundamentals of China’s economy have also undergone substantial changes, entering a new normal stage of China’s economic development since 2010. In this context, the total imports and export in the urban economic field of the Guangzhou metropolitan area are affected by the downward pressure of the external economy, and the growth rate of senses and export slows down year by year, which has a holding effect on the economic resilience development of Guangzhou, Foshan and other large commercial cities.
(2) The social subsystem obstacle shows an overall fluctuating decline in the degree of barriers during the study period, except for a significant increase in 2016–2018, with an average value of 22.58% for the degree of barriers in all years. The fundamental reason is that influenced by the transformation of the leading social contradictions in China since the 19th Party Congress, people’s demands for medical and employment security, urban living environment, etc. Have been increasing, from the original order for quantity to qualitative improvement, and their contradictions have experienced the spiral of “generation-solution-again.” Therefore, the hindering effect of social factors on the development of urban resilience has been maintained at a high level.
(3) The ecological subsystem obstacle showed a significant decrease in the barrier degree during the study period, with a mean value of 21.46% for the barrier degree in all years. There was polarization in the barrier degree of the factors in their domains, with the erosion control area factor having a more significant constraint on the development of urban resilience and the rest having a minor restriction. Since the implementation of the amendment to the Environmental Protection Law of China, which was called the most stringent in history in 2015, Guangzhou metropolitan area cities have performed outstandingly in the factors of soil erosion control, per capita park green space construction, sewage treatment rate and household waste recycling and harmless treatment, which led to a significant decrease in the degree of ecological domain factor barriers within the region and reached the lowest value of 17.64% in 2018, after 2020, the degree of ecological domain barriers in the metropolitan area increases due to insufficient investment in the comprehensive environmental management of soil erosion.
(4) The engineering subsystem obstacle degree increases steadily during the study period, and the average value of the barrier degree in all years is 28.87%, which has the most restrictive effect on the development of urban resilience in the metropolitan area. Influenced by the density of urban drainage pipes, public transportation operation, and mobile communication, the infrastructure of cities in the Guangzhou metropolitan area fail to meet the daily needs of citizens, especially in the low density of urban drainage pipes in the metropolitan area and the failure to realize rainwater and sewage diversion measures, which leads to the inability of cities to maximize the role of flood drainage and flood removal when suffering from heavy rainfall and flooding and causes particular water pollution in the region. Environmental pollution problems play a restrictive part in improving urban engineering resilience.
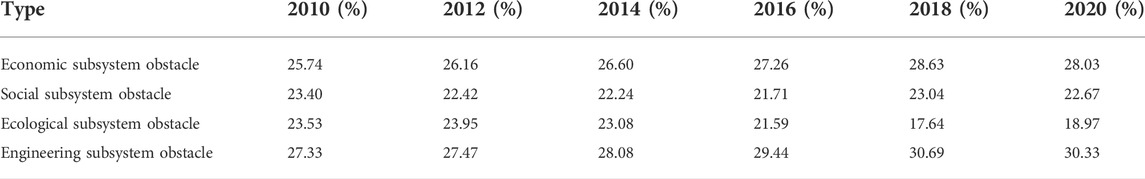
TABLE 9. Resilience obstacle of urban subsystems in the Guangzhou metropolitan area from 2010 to 2020.
Table 10 is the major obstacle factors and levels of urban resilience in the Guangzhou Metropolitan Area from 2010 to 2020. Table 10 shows that the primary obstacle of factors is E19 (erosion control area) in the early stage and E8 (population density) in the later stage. However, with the increase of local government’s unprecedented investment in the last period, the constraining effect on the development of urban resilience gradually diminishes. E8 (population density) fluctuates and strengthens over time as an obstacle to the development of urban resilience, increasing from 10.08% obstacle degree in 2010 to 12.45% in 2020, an increase of 2.37%. The reason for this phenomenon is mainly due to the influence of the interaction of the development of cities within the Guangzhou metropolitan area, for Zhaoqing, Qingyuan, Yunfu and Shaoguan, their E8 (population density) growth is slow due to the siphon effect of the neighboring mega such as Guangzhou-Foshan, which shows a severe phenomenon of population loss, making the gap in economic development between them and the Guangzhou-Foshan region further widen, which is not conducive to coordinated action within the metropolitan area (Wu and Sun, 2017), and secondly, for Guangzhou and Foshan, their co-location construction makes their economic volume and industrial structure more rationalized, which attracts a large inflow of foreign population and significantly increases E8 (population density), but their ability to optimize the allocation of urban resources does not fully meet the needs of unfamiliar people, which leads to a series of urban diseases such as traffic congestion and housing tension, and restricts the resilient development of the cities. E23 (density of urban drainage pipes) and E5 (total import and export) are the essential resilience obstacle factors of Guangzhou metropolitan area, which fluctuate and change during the study period, but generally remain in the top 4 obstacle factors. E5 (total import and export): With the large proportion of the export-oriented economy in the Guangzhou metropolitan area, the growth rate of import and export is slowing down year by year due to the downward pressure of the external economy, which has a restraining effect on the economic resilience development of Guangzhou, Foshan and other large commercial cities.
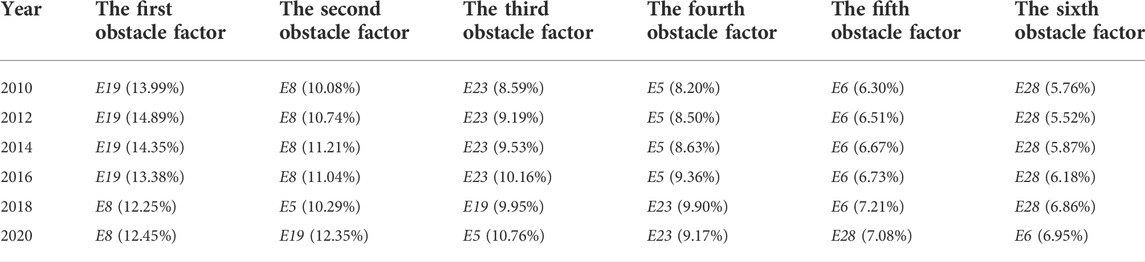
TABLE 10. The top 6 major obstacle factors and levels of urban resilience in the Guangzhou Metropolitan Area from 2010 to 2020.
The critical limiting factors of urban resilience development in the Guangzhou metropolitan area during 2010–2020 are E6 (public finance budget expenditure) and E28 (standard number of urban public vehicles operating). The growth of public finance budget expenditures in cities in the Guangzhou metropolitan area is relatively stable. Still, the ability to respond to new social changes in the actual implementation process is low, affecting the improvement of urban resilience’s adaptive capacity. For the cities of Yunfu, Zhaoqing, Qingyuan, and Shaoguan in northern Guangdong, which were previously in the stage of a rapid transition to urbanization, there is still a lack of urban public transportation planning and construction and information and communication penetration, leading to a series of underutilized resources and information in the process of urban development. For Guangzhou and Foshan, with the promotion of Guangzhou-Foshan co-city construction, the economic and industrial exchanges between the two cities are active, and the population frequently flows, the original public transportation operation system cannot fully meet the needs of the citizens’ daily production activities and plays a restraining role in the improvement of urban resilience.
During the study period, the sum of the top 6 significant barriers to urban resilience in the Guangzhou metropolitan area has been steadily increasing yearly. The sum of the obstacles has increased from 52.92% in 2010 to 58.76% in 2020, with an increase of 5.85% before and after, which fully indicates that with the development of urban resilience level in the Guangzhou metropolitan area, the significant barriers of urban resilience. The regional government should focus on the first six significant barriers, analyze the impact of specific resilience barriers, prevent potential problems and external threats, and improve the city’s overall resilience.
As the hinterland of human activities and the spatial carrier of energy circulation, cities have been constantly faced with threats from hidden dangers and the external environment. Given the insufficient and unbalanced development of resilience in Chinese cities, the concept of a “resilient city” is adopted in this paper to evaluate urban resilience, which provides a theoretical reference for disaster prevention and control, urban governance, and the sustainable development of cities by establishing a scientific index system and conducting a thorough analysis of the resilience characteristics and components of cities. According to the relevant literature on urban resilience evaluation, the influencing factors for economic, social, ecological, and engineering resilience of the Guangzhou metropolitan area are identified. On this basis, an urban resilience assessment model is constructed to explore the spatial and temporal changes in urban resilience in the Guangzhou metropolitan area. Besides, an analysis is conducted regarding the barriers to the development of urban resilience in the Guangzhou metropolitan area, which contributes a new perspective to the research on urban resilience evaluation and sustainable development in those metropolitan cities. In addition, it also enriches the connotation of urban resilience research while promoting the multidisciplinary and cross-disciplinary analyses of resilience research. However, urban resilience evaluation involves a comprehensive and complex research process, this paper has the following shortcomings: Firstly, due to the limited availability of data, there are some flaws in the resilience evaluation index system, the impact of indicators such as population mobility, cultural governance, policies, and institutions on urban resilience can be analyzed in depth. Secondly, the formation mechanism and management of resilience are not deeply studied. The research on the theoretical framework, research methods, and management of urban resilience can be further supplemented and deepened at a later stage to enhance the applicability of urban resilience. In future research, attention will be paid to micro-scale resilience studies (e.g., communities). Efforts will be made to explore research content such as identifying vulnerable populations, constructing healthy community environmental systems, and quantitative evaluation of community resilience. At the same time, in face of the impact and challenges of the Covid-19 pandemic, there is a concern about how to further improve the resilience system of Chinese metropolitan cities and realize the restructuring and functional optimization of cities under multiple risk scenarios to enhance the response capacity of cities to cope with public risk emergencies and public health events.
(1) The resilience of each subsystem in an individual city has improved steadily, and the comprehensive resilience has been enhanced significantly.
During the study period, the resilience of the Guangzhou metropolitan area improved steadily in different ways. To be specific, economic resilience showed a steady improvement, social resilience improved substantially, ecological resilience was enhanced at a varying pace, and engineering resilience improved progressively. The comprehensive urban resilience of the Guangzhou metropolitan area improved significantly from 0.2049 in 2010 to 0.4449 in 2020, with the annual growth rate reaching 17.05% on average. As a measure of the absolute difference in urban resilience development, the standard deviation increases by 54.75% from 0.1303 in 2010 to 0.2017 in 2020. The coefficient of variation is used to characterize the relative difference in the urban resilience level, whose value shows a “V-shaped” change. From 2010 to 2018, the coefficient of variation decreased year on year, reaching a minimum of 0.4396 in 2014. Then, it recovered in 2020, indicating a steady increase in the absolute difference in comprehensive resilience between the cities within the Guangzhou metropolitan area. The relative difference showed a decreasing trend and then an increasing trend.
(2) The urban resilience in the Guangzhou metropolitan area shows a spatial pattern of radioactive development with Guangzhou as the core, with the spatial distribution of resilience level being typically high in the southeast and low in the northwest.
Economic, social, engineering, and comprehensive resilience support the radial improvement of resilience with Guangzhou as the core. In terms of urban ecological resilience, Guangzhou and Foshan perform less well. At the same time, Yunfu, Zhaoqing, and Shaoguan attach more significance to preserving the ecological environment, reducing soil erosion, strengthening ecosystem construction, and promoting the spontaneous resistance and self-healing ability of the local ecosystem for improved urban ecological resilience. In addition, the level of urban engineering resilience is low in Yunfu, Zhaoqing, Qingyuan, and Shaoguan, and the overall improvement of urban engineering and infrastructure resilience has not yet been brought into play. There is a disconnect between their urban engineering resilience levels and those of Guangzhou and Foshan. Yunfu shows limited growth in terms of per capita GDP, per capita disposable income, and public budget expenditure, which constrains the enhancement of its urban economic resilience, thus leading to a city with limited economic resilience. In addition, except for ecological resilience, the spatial distribution of urban subsystem resilience and comprehensive resilience in the Guangzhou metropolitan area is high in the southeast and low in the northwest. Among them, the level of urban economic, social, and engineering resilience is mainly affected by medium resilience, and ecological resilience is primarily in the order from medium to high.
(3) Social resilience and ecological resilience as the main driving subsystems in the early and late stages of urban resilience improvement, engineering resilience is the primary constraining subsystem during the study period.
Social resilience, as the primary driving subsystem in the early stage of urban resilience improvement in the Guangzhou metropolitan area, is reflected in the shift of people’s growing need for a better life from the pursuit of a quantity to that quality under the guidance of people-centered development ideology. This is manifested in the significant improvement of public health care, employment, and job security services in the city, which has played a crucial role in substantially enhancing the sense of national identity and happiness among people in their life. As a result, social resilience improves considerably in the city. In the late stage of the study period, given the advanced assertion that “mountain, water, forest, lake, lake, grass, and sand are a community of life,” the scientific ideology that “Lucid waters and lush mountains are invaluable assets” and the effective initiatives such as the “river chief system and lake chief system” launched since the 18th Party Congress, the Guangzhou metropolitan area has witnessed a significant improvement in terms of urban green space system and ecological environment. Becoming the primary driving subsystem in 2016, it surpassed the social resilience level. Engineering resilience is the primary constraint on the improvement of urban resilience. Currently, residents have stronger demands for such urban infrastructures as transportation, energy, communication, water supply, and drainage, all of which are essential for living and production activities. This evidences the development of resilience.
(4) Soil erosion control area and population density are the primary obstacles in the early and late stages, respectively, the essential resilience factors include urban drainage pipe density and total import and export.
Due to the limited capacity of erosion control construction in the early stage in the Guangzhou metropolitan area, soil erosion caused by human activities and natural disasters occurs on some hills and slopes, thus resulting in casualties and property losses. In the later period, the “siphon effect” manifested in the big cities imposes certain constraints on the inflow and outflow of the population. The above resilience factors have improved over time, and the adverse effect on the development of urban resilience has become more significant. In addition, the 6 most significant barriers to urban resilience in the Guangzhou metropolitan area have been steadily increasing over time, which indicates that the significant barriers to urban resilience gradually concentrate with the rise of urban resilience level. Furthermore, among the urban resilience subsystems, the engineering domain factor is the most significant constraint on urban resilience improvement, followed by the economic domain. In contrast, the social and ecological environments are relatively less obstructive to improving urban resilience. The overall urban subsystem domain obstacle degree shows a trapezoidal distribution from top to bottom.
(1) Strengthen the overall development of urban system resilience, highlight the story of resilience in critical areas, and make up for the shortcomings of resilience. The current thinking of urban subsystems in coping with risks and disturbances has changed from a model that focuses on short-term disaster prevention and mitigation to a concept that focuses on long-term safety and security. The embodiment of urban resilience capacity is the result of the organic action of each urban subsystem coordinating and cooperating, so the development of urban resilience should adhere to the idea of highlighting the key areas and making up the short boards, taking the outstanding areas of resilience as the breakthrough of urban resilience development and the temporary board areas of resilience as the focus of urban resilience development. Taking Yunfu, Zhaoqing, and Shaoguan as examples, the ecological resilience of the cities is high during the study period. The comprehensive resilience of the town fully proves the scientific assertion that green water and green mountains are the silver mountains of gold. As the core city of the Guangzhou metropolitan area, Guangzhou is significantly ahead of the surrounding cities in economic, social, and engineering resilience, but its urban ecological resilience is poor.
(2) Pay attention to the top-level design of resilient city planning and construction in the Guangzhou metropolitan area, and promote the flow of resources and information within the metropolitan area. In the context of the new development pattern of the post-epidemic era, with the domestic circulation as the main body and the domestic and international double circulation promoting each other, the resilient urban development of the Guangzhou metropolitan area should be based on the domestic and foreign perspectives, taking into account the effect of urban economy, society, ecology, engineering and other fields from the policy level, improving institutions and policies to guarantee the high-quality development of resilient cities (Jiang and Meng, 2021). Guangzhou, as the core city in the metropolitan area, should take the initiative to break its spillover barriers, enhance the flow of resources and information exchange with neighboring cities, realize the development of diffusion from point to point, and then make the organic joint resistance to risks and disturbances among cities in Guangzhou metropolitan area improve (Zhu and Sun, 2020). At the same time, urban resilience planning and construction should focus on how to improve the resistance of the urban system to disasters and risks; rather than reducing the economic and property losses caused by a particular disaster, we cannot just pursue zero risk, we must clearly understand that risk control is required to be integrated. Power is needed when the risk exceeds the acceptable level.
(3) To build a scientific and reasonable urban resilience evaluation system according to local conditions to guide the planning and construction of resilient cities. Currently, the urban resilience evaluation index system structure is similar at all levels in each region, failing to highlight the characteristics of regional resilience factor development. As different urban areas face different types of disasters and other urban resilience background conditions, the comprehensive resilience capacity of their cities is additional. Therefore, it is necessary to scientifically construct the urban resilience index system and reasonably determine the index weights according to the actual situation of the evaluation object. In addition, as a new urban development concept, the ultimate destination of the resilient city should be in practice and abandon the original pursuit of large city scale, complex urban functions, and a high concentration of resources unreasonable phenomenon. Through rational analysis and evaluation of the current situation of urban resilience development, digging out the shortcomings and deficiencies of urban resilience development, taking into account the effect of each urban subsystem, actively practicing and exploring urban resilience planning and construction, striving to avoid, contain and eliminate risks from the root, and helping to promote the high-quality development of urban resilience (Zhai et al., 2022).
The raw data supporting the conclusions of this article will be made available by the authors, without undue reservation.
Conceptualization, BT and ZT; methodology, ZT; data curation, ZT; writing—original draft preparation, BT and ZT; writing—review and editing, BT and ZT; funding acquisition, BT. All authors have read and agreed to the published version of the manuscript.
This research was funded by project of the 14th five-year plan for the development of Philosophy and Social Sciences in Guangzhou in 2021 (Grant No. 2021GZYB22); Project of Special Innovation Classes for Regular Universities in Guangdong Province (Grant No. 2020WTSCX136); College students’ innovative entrepreneurial training program (Grant No. 202213902008); Guangzhou Xinhua University’s Educational Reform Project (Grant No. 2022J002).
The authors declare that the research was conducted in the absence of any commercial or financial relationships that could be construed as a potential conflict of interest.
All claims expressed in this article are solely those of the authors and do not necessarily represent those of their affiliated organizations, or those of the publisher, the editors and the reviewers. Any product that may be evaluated in this article, or claim that may be made by its manufacturer, is not guaranteed or endorsed by the publisher.
Abid, M. (2016). Of resilient places: Planning for urban resilience. Eur. Plan. Stud. 24 (2), 407–419. doi:10.1080/09654313.2015.1082980
Amirzadeh, M., Sobhaninia, S., and Sharifi, A. (2022). Urban resilience: A vague or an evolutionary concept? Sustain. Cities Soc. 81, 103853. doi:10.1016/J.SCS.2022.103853
Bai, L. M., Xiu, C. L., Feng, X. H., Mei, D. W., and Wei, Y. (2019). Comprehensive assessment of city resilience in China and its spatial and temporal differentiation characteristics. World Reg. Stud. 28 (6), 77–87. doi:10.3969/j.issn.1004-9479.2019.06.2018403
Betty, P., Richard, L. V., and Rose, L. P. (2017). A conceptual framework to enhance community resilience using social capital. Clin. Soc. Work J. 45 (2), 102–110. doi:10.1007/s10615-015-0556-z
Colclough, G., Gonzalez-Gomez, A., Velasco, M., Stevens, J., Goodey, P., Henderson, R., et al. (2021). Governance of city resilience. Int. J. Urban Plan. Smart Cities 2 (2), 70–93. doi:10.4018/ijupsc.2021070105
Desouza, K. C., and Flanery, T. H. (2013). Designing, planning, and managing resilient cities: A conceptual framework. Cities 35 (4), 89–99. doi:10.1016/j.cities.2013.06.003
Dulebenets, M. A. (2018). A comprehensive multi-objective optimization model for the vessel scheduling problem in liner shipping. Int. J. Prod. Econ. 196, 293–318. doi:10.1016/j.ijpe.2017.10.027
Fang, C. L., and Wang, Y. (2015). A comprehensive assessment of urban vulnerability and its spatial differentiation in China. Acta Geogr. Sin. 70 (2), 234–247. doi:10.11821/dlxb201502005
Fei, X., Wen, J. H., Du S, Q., and Xu, H. (2014). Advances in natural disaster resilience research. J. Nat. Hazards (6), 19–31. doi:10.13577/j.jnd.2014.0603
Grzegorz, I., Katarzyna, M., Dawid, S., Konstantinos, M., Anna, W. K., and Katarzyna, C. (2021). Potential environmental pollution from copper metallurgy and methods of management. Environ. Res. 197, 111050. doi:10.1016/J.ENVRES.2021.111050
He, J. X., Meng, Y. H., and Zheng, P. Q. (2022). Research progress and trends of urban resilience governance in China(2000-2021)——visual analysis based on CiteSpaceV. J. Catastrophology 37 (3), 148–154.
Herrera, M., Abraham, E., and Stoianov, I. (2016). A graph-theoretic framework for assessing the resilience of sectorised water distribution networks. Water Resour. manage. 30 (5), 1685–1699. doi:10.1007/s11269-016-1245-6
Jabareen, Y. (2013). Planning the resilient city: Concepts and strategies for coping with climate change and environmental risk. Cities 31 (2), 220–229. doi:10.1016/j.cities.2012.05.004
Jiang, X., and Meng, L. J. (2021). Mainly inner circulation, outer circulation empowerment and higher level double circulation: International experience and Chinese practice. Manag. World 37 (1), 1–19. doi:10.3969/j.issn.1002-5502.2021.01.001
Li, T. Y. (2017). New progress in study on resilient cities. Int. Urban Plan. 32 (5), 15–25. doi:10.22217/upi.2015.284
Liang, X. D., Lin, S. F., Bi, X. Y., Lu, E. F., and Li, Z. (2021). Chinese construction industry energy efficiency analysis with undesirable carbon emissions and construction waste outputs. Environ. Sci. Pollut. Res. 28 (13), 15838–15852. doi:10.1007/s11356-020-11632-z
Liu, Y. P. (2021). Urban resilience system development measurement:based on an empirical study of 288 Chinese cities. Urban Dev. Stud. 28 (6), 93–100. doi:10.3969/j.issn.1006-3862.2021.06.020
Lorenz, D. F. (2013). The diversity of resilience: Contributions from a social science perspective. Nat. Hazards (Dordr). 67 (1), 7–24. doi:10.1007/s11069-010-9654-y
Ma, X. D., Shen, Z. P., and Song, X. J. (2014). Analysis of urban and rural public service development gap and its obstacle factors in Jiangsu Province. Hum. Geogr. 29 (1), 89–93. doi:10.13959/j.issn.1003-2398.2014.01.016
Marjolein, S., and Bas, W. (2017). Building up resilience in cities worldwide-Rotterdam as participant in the 100 resilient cities programme. Cities 61, 109–116. doi:10.1016/j.cities.2016.05.011
Mcclymont, K., Bedinger, M., Beevers, L., Visser-Quinn, A., and Walker, G. H. (2022). Understanding urban resilience with the urban systems abstraction hierarchy (USAH). Sustain. Cities Soc. 80, 103729. doi:10.1016/J.SCS.2022.103729
Meerow, S., Newell, J. P., and Stults, M. (2016). Defining urban resilience: A review. Landsc. Urban Plan. 147, 38–49. doi:10.1016/j.landurbplan.2015.11.011
Michel, B., Stephanie, E. C., Ronald, T. E., George, C. L., Thomas, D. O., Andrei, M. R., et al. (2012). A framework to quantitatively assess and enhance the seismic resilience of communities. Earthq. Spectra 19 (4), 733–752. doi:10.1193/1.1623497
Morrow, B. H. (1999). Identifying and mapping community vulnerability. Disasters 23 (1), 1–18. doi:10.1111/1467-7717.00102
Müller, B. (2011). “Urban and regional resilience – a new catchword or a consistent concept for research and practice?,” in German annual of spatial research and policy 2010. German annual of spatial research and policy. Editor B. Müller (Berlin, Heidelberg: Springer). doi:10.1007/978-3-642-12785-4_1
Ni, X. L., and Li, X. Q. (2021). Three types of resilient city evaluation systems and their new development directions. Int. City Plan. 36 (3), 76–82. doi:10.19830/j.upi.2019.07
Osman, T. (2021). A framework for cities and environmental resilience assessment of local governments. Cities 118, 103372. doi:10.1016/J.CITIES.2021.103372
Paulo, J., and Luís, A. (2019). Urban resilience: A conceptual framework. Sustain. Cities Soc. 50, 101625. doi:10.1016/j.scs.2019.101625
Shao, Y. W., and Xu, J. (2015). Urban resilience: A conceptual analysis based on an international literature review. Int. City Plan. 30 (2), 48–54.
Simon, W., John, T., Priti, P., Anna, K., and Tarek, C. (2016). Towards measurable resilience: A novel framework tool for the assessment of resilience levels in slums. Int. J. Disaster Risk Reduct. 19, 280–302. doi:10.1016/j.ijdrr.2016.08.003
Song, L. (2020). Is intelligence compatible with resilience?—the resilience evaluation of smart city construction. J. Soc. Sci. 3, 21–32. doi:10.13644/j.cnki.cn31-1112.2020.03.004
Sun, Y., Zhang, J. C., and Yao, S. M. (2017). Resilience evaluation of prefecture-level cities in the Yangtze River Delta based on the perspective of social ecosystem. China Popul. Resour. Environ. 27 (8), 151–158. doi:10.12062/cpre.20170465
Turner, B. L., Kasperson, R. E., Matson, P. A., Mccarty, J. J., Corell, R. W., Christensen, L., et al. (2003). A framework for vulnerability analysis in sustainability science. Proc. Natl. Acad. Sci. U. S. A. 100 (14), 8074–8079. doi:10.1073/pnas.1231335100
Wang, M. Z., Amati, M., and Thomalla, F. (2012). Understanding the vulnerability of migrants in Shanghai to typhoons. Nat. Hazards (Dordr). 60, 1189–1210. doi:10.1007/s11069-011-9902-9
Wu, B. H., and Chen, A. (2018). Construction of resilient city resilience evaluation model. Sci. Technol. Rev. 36 (16), 94–99.
Wu, K., and Sun, D. Q. (2017). Progress in urban shrinkage research. Econ. Geogr. 37 (11), 59–67. doi:10.15957/j.cnki.jjdl.2017.11.008
Xu, J., and Shao, Y. W. (2015). Resilient city: New ideas for coping with city crisis. Int. City Plan. 30 (2), 1–3.
Xu, Y. Y., Li, G., Cui, S., Xu, Y. P., Pan, J., Tong, N., et al. (2018). Review and perspective on resilience science: From ecological theory to urban practice. Acta eco. Sin. 38 (15), 5297–5304. doi:10.5846/stxb201709081620
Xu, Z. F., Tian, J. F., and Zhang, J. (2019). Evaluation system and optimization strategy of urban resilience from the perspective of disaster prevention. China Saf. Sci. J. 29 (3), 1–7. doi:10.16265/j.cnki.issn1003-3033.2019.03.001
Yang, X. P., Wang, L. K., Li, Y. B., Hou, Y. J., and Niu, J. (2021). Review and prospects of resilient city theory. Geogr. Geo-Information Sci. 37 (6), 78–84. doi:10.16619/j.cnki.rmltxsqy.2022.1112.004
Yang, Y., Lin, L., Zhong, Z. P., Ou, Y. Y., Xu, Q., Meng, M. Y., et al. (2019). Comprehensive evaluation and spatial differentiation of community resilience in Guangzhou based on response of the city to public health hazards. Acta Geogr. Sin. 74 (2), 266–284. doi:10.11821/dlxb201902005
Zang, X. Y., and Wang, Z. (2019). The evolution of the urban resilience concept, and its research contents and development trend. Sci. Technol. Rev. 37 (22), 94–104.
Zhai, G. F., Huang, H., Leng, H., Luo, X., Ma, D. H., W, J., et al. (2022). Scientific planning, improving resilience. Urban Plan. 46 (3), 29–36. doi:10.11819/cpr20220304s
Zhang, X., Jiao, K., Zhang, J., and Guo, Z. (2021). A review on low carbon emissions projects of steel industry in the world. J. Clean. Prod. 306, 127259. doi:10.1016/j.jclepro.2021.127259
Zhao, R. D., Fang, C. L., and Liu, H. M. (2020). Progress and prospect of urban resilience research. Progresses Geogr. Sci. 39 (10), 1717–1731. doi:10.18306/dlkxjz.2020.10.011
Zhou, C. S., Luo, L. J., Shi, C. Y., and Wang, Y. H. (2017). Spatio-temporal evolution characteristics of economic development in the Guangdong-Hong Kong-Macao Greater Bay Area and its influencing factors. Trop. Geogr. 37 (6), 802–813. doi:10.13284/j.cnki.rddl.003011
Keywords: urban resilience, spatial-temporal evolution, global entropy weight method, obstacle degree, Guangzhou metropolitan area
Citation: Tang B and Tan Z (2022) The research on spatial-temporal evolution and influence factors of urban resilience: A case study in the Guangzhou metropolitan area. Front. Environ. Sci. 10:1052930. doi: 10.3389/fenvs.2022.1052930
Received: 24 September 2022; Accepted: 27 October 2022;
Published: 10 November 2022.
Edited by:
Sandipan Das, Symbiosis International University, IndiaReviewed by:
Voltaire Alvarado Peterson, University of Concepcion, ChileCopyright © 2022 Tang and Tan. This is an open-access article distributed under the terms of the Creative Commons Attribution License (CC BY). The use, distribution or reproduction in other forums is permitted, provided the original author(s) and the copyright owner(s) are credited and that the original publication in this journal is cited, in accordance with accepted academic practice. No use, distribution or reproduction is permitted which does not comply with these terms.
*Correspondence: Bo Tang, dGJhbGxlbjE5NkAxNjMuY29t
Disclaimer: All claims expressed in this article are solely those of the authors and do not necessarily represent those of their affiliated organizations, or those of the publisher, the editors and the reviewers. Any product that may be evaluated in this article or claim that may be made by its manufacturer is not guaranteed or endorsed by the publisher.
Research integrity at Frontiers
Learn more about the work of our research integrity team to safeguard the quality of each article we publish.