 Shangpeng Hao
 Xuefeng Liu1†
 Haitao Wang
95% of researchers rate our articles as excellent or good
Learn more about the work of our research integrity team to safeguard the quality of each article we publish.
Find out more
ORIGINAL RESEARCH article
Front. Environ. Sci. , 09 November 2022
Sec. Atmosphere and Climate
Volume 10 - 2022 | https://doi.org/10.3389/fenvs.2022.1052646
This article is part of the Research Topic Physical and Chemical Processes within the Planetary Boundary Layer and Their Impacts on Air Pollution View all 12 articles
The widespread surface of the air-water interface plays a crucial role in the partitioning processes between the atmosphere and the hydrosphere. As one of the prime CWAs (Chemical Warfare Agents) abandoned by Japanese, the unfound 2-Chloroacetophenone posed a severe threat to the Chinese people. In this study, the interface partition constant of 2-Chloroacetophenone was obtained by measuring the mass uptake vapor on different environmental water films with various thicknesses. The surface tension, dissolved organic matter, and salinity of the environmental samples were analyzed. The partition constant of 2-Chloroacetophenone in pure water, river water and sea water samples at 288 K were 1182.2 ± 49.9, 1606.6 ± 101.3 and 408.9 ± 18.3, respectively. Surface adsorption is the predominant mechanism. The results also indicate that the adsorption partitioning ability of 2-Chloroacetophenone at the air/water interface was negatively correlated with surface tension. 2-Chloroacetophenone is more likely to adsorb at the gas/water interface with lower surface tension.
2-Chloroacetophenone, one of the primarily used riot control agents with the military designation of CN, can cause uncontrolled sneezing, coughing, eye irritation and lacrimation (Olajos and Salem, 2001; Blain, 2003). It was first synthesized in 1871 and had served in military action for a long history (Olajos and Salem, 2001). CN was also used as the main active ingredient in a liquid mixture under the tradename “Mace” for riot control and law enforcement.
The chemical formula of CN is shown in Figure 1. At room temperature, CN is colorless crystals solid. CN has low solubility in water but is soluble in alcohols, ethers and other organic solvents. The vapor pressure of CN at 20°C is 4.1 × 10⁻³ mmHg. The hydrolysis of CN in water is very slow. CN acts directly on the mucous membranes. Exposure to high concentrations of CN aerosol can cause intense ocular and respiratory irritation and associated burning and pain sensation in the eyes, nose, throat and lungs. Some symptoms can persist for 20 min. The maximum safe dose for short-term inhalation is 500 mg/m3 (Blain, 2003). And the safety threshold in an aqueous environment is 0.36 μg/L (Hu et al., 2008).
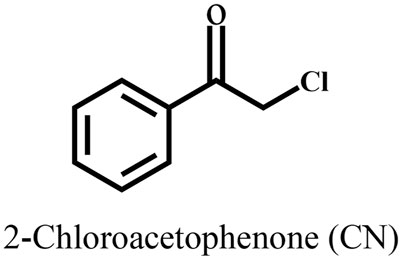
FIGURE 1. Chemical formula of 2-chloroacetophenone (CN).
After World War I, CN began to appear as a chemical warfare agent in military operations and exercises. Since the 1930s, tons of agents called “Midori” or “green color agent” was manufactured and shipped to China by the Japanese army (Tu, 2010; Brombach, 2011). At the end of the war, a large amount of CN was directly dumped into water area in China by the Japanese army to cover up the evidence of their criminal use. These abandoned chemical agents had been found in nearly 100 locations in China. There are still considerable amounts of agents that remain undetected. These agents had become a serious threat to residents, causing severe pollution and ecological damage. This project was undertaken to evaluate the atmospheric fate of CN.
The air-water interface is the most widespread surface in the environment. The uppermost 1 μm to 1 mm of the surface of the ocean and the river, which also call the Surface Microlayer, is mainly composed of various biogenic organics species (Peleg et al., 2016; Stirchak et al., 2021). Some organic compounds, such as n-alkanoic acids (fatty acids) and humic-like substances (HULIS), are surface-active substances and can affect the surface tension of water (Tinel et al., 2016; Chiu et al., 2017). These compounds are also present in atmospheric water films such as fog, mist, dew, cloud droplets surface and can affect the nucleation and the growth of aerosols and the absorption of gas molecules. Cappiello analyzed water-soluble organic matter (WSOC) in fog water samples by MS/MS and found the presence of HULIS (Cappiello et al., 2003).
The main purpose of this study is to develop an understanding of the partitioning processes between the atmosphere and the hydrosphere. The adsorption behavior is strongly associated with the target molecule’s polarity and size and the film surface’s polarity, which could be measured by the air/water partition constant (KAI) (Jing et al., 2006; Goss, 2010; Chen et al., 2011). However, the presence of surfactants may increase the water solubility of gaseous substances through micelle trapping mechanisms or intermolecular interactions. It also may cause a decrease in the permeability of gaseous substances on aqueous surfaces (Chen and Valsaraj, 2007). Furthermore, the spices may be involved in surface reactions to cause unpredictable results. Chen investigated the effect of surfactants on the adsorption of naphthalene at the gas-water interface using Suwannee River fulvic acid (SRFA) (Chen and Valsaraj, 2007). When the concentration of River fulvic acid in water was low, the increase of naphthalene adsorption by aqueous films was limited. And the concentration of naphthalene in aqueous films even exceeded the solubility in pure water when the concentration of SRFA was high, indicating that the presence of HULIS in natural aqueous films promoted the adsorption of naphthalene. Some studies had also shown that long-chain fatty acid monomolecular layers covering the surface of aqueous film inhibit the uptake of N2O5 and anthracene (Thornton and Abbatt, 2005; McNeill et al., 2006).
In this study, a flow-tube reactor was used to obtain the equilibrium concentration of CN between the water film and the gas phase. The objective of this work was to obtain the partition constant of CN and to investigate the impact of different surface samples on the partitioning results.
Standard reagents: Methanol (chromatographic pure, Fisher Chemical, Germany); NaCl (chromatographic pure, Beijing Chemical Manufacturer, China); TENAX TA supporter (60/80 mesh size, BUCHEM BV, Holland); CN (99.89%), provided by the State Key Laboratory of NBC Protection for Civilian (Duan et al., 2020).
Environmental water samples: The river water samples were collected from the Yangtze River in Yichang, Hubei Province (salinity 0.2 g/L); The sea water samples were taken from the surface layer of the South China Sea in Guangdong Province (salinity 17.125 g/L). All environmental water samples used were unfiltered.
Equipment: 7890A Gas chromatograph (equipped with hydrogen ion flame detector, Agilent Technologies, United States); Solid-phase microextraction device (SPME, Supelco, United States); 85 μm CAR/PDMS fiber (Supelco; United States); Magnetic heating stirrer (MS-H-Pro, Dalong Xingchuang Instruments, China); Ultrapure water system (CR- 20B+, Gaosen instrument equipment, China); Thermostat oil-bath cauldron (OSB-2000, EMELA); Flow injection fluorescence (R-6000, Shimadzu, Japan); Laboratory conductivity meter (ST3100C, OHAUS, United States); Optical contact angle meter (OCA-20, Dataphysics, Germany); Electronic balance (CPA225D, Sartorius Group, Germany), Mass flow controller, range 0–500 ml min−1 (SY-9312D, ShengYe Technology Company of Beijing, China).
The adsorption experiments were performed on a flow-tube reactor described in our previous work (Hao et al., 2021). Some modifications have been made in Figure 2 for the detection of CN. The equipment was mainly constant with a vapor saturator device, a flow-tube reactor, and a coolant circulator system. The whole device and the quartz boat were held in a horizontal position. The partition experiment was conducted in the flow-tube reactor. CN is adsorbed on a thin water film coated on the bottom surface of a rectangular quartz trough (length 490 mm, width 30 mm, and height 5 mm). The bottom surface area of the quartz trough is 147 cm2. The circulating coolant in the reactor controls the temperature of the water film. The reactor was sealed using a suitable seal strip. The instrument status was monitored by a variety of sensors. Temperature sensors inserted through the reactor body are placed only millimeters from the glass trough bottom. The temperature of the water film is monitored consistently throughout the experiment. The internal pressure of the reactor was measured by a pressure sensor system. The sensor used ensures the reproducibility and reliability of the experiment.
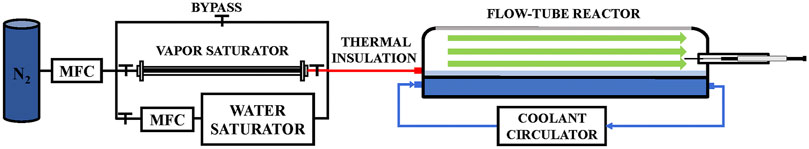
FIGURE 2. Flow tube reactor.
The concentration of gas-phase CN is hard to quantify by the gas chromatograph directly. So, we use SPME technique to capture the CN in the reactor. During the experiment, the SPME fibers were inserted into the reactor and released into the GC inlet for analysis.
The whole system was operated in a ventilated environment. Nitrogen was used as the carrier gas at a flow rate of 60 ml/min. The flow rate was controlled by the SY-9312D mass flow controller. The carrier gas was humidified by passing through a vessel containing water to avoid the volatilization of the water film during the experiment.
The bottom of the quartz boat was soaked in 50% w/v NaOH for 1 h, followed by rinsing with Milli-Q water. The volume of water added controlled the thickness of the film. The temperature of the water film was kept at 15°C which makes the data correspond to the average temperature of the atmosphere. 2, 5, 8, 11, and 15 ml of ultrapure water were added into the quartz trough to form water films with thicknesses of 136, 340, 544, 748, and 1,020 μm, respectively.
The vapor saturator device generated the gas-phase CN. At 20°C, CN is a flaky white crystal, and the vapor needs to be transferred to the flow tube reactor for the partitioning experiment. TENAX TA has been used in riot control agent analysis (Carrick et al., 2001). We present a scheme to spike TENAX TA supporter into a thermal desorption tube. The supporter was coated with CN by mixing it with a CN-methanol solution. Methanol has a lower boiling point (64.8°C), so it was first to evaporate when heated. After that, CN has been adsorbed onto the surface of the supporter and was released in a stream of nitrogen gas. The support was transformed into a stainless-steel tube and covered by glass wool. Since the melting point of CN is 54°C, heating the thermal desorption tube would lead to rapid volatilization of CN. Therefore, the temperature of the vapor generator was kept at 20°C in all experiments.
The quartz boat was covered with water film and placed in the reactor, and then the vapor was passed through to carry out the experiment. The concentration of CN in the gas phase and aqueous phase was measured using SPME separately. The reactor and the lines were purified with pure nitrogen to avoid residues after the experiment.
Environmental water experiment: The effects of mineral content and dissolved organic matter (DOM) on the interfacial partitioning in different environmental water were studied. Experiments were conducted with the samples collected from the Yangtze River and the South China Sea at the same temperature and water film thickness.
In this experiment, SPME combined with GC-FID was used to analyze CN in the gas phase and aqueous phase.
An 85 μm CAR/PDMS fiber was inserted into the flow tube reactor to capture CN in the gas phase. The SPME fiber was exposed for 10 min. And the fiber was inserted into the injection port of the GC for desorption. Samples were collected at 10, 30, and 50 min, respectively.
The aqueous samples were collected at the end of the partitioning experiment. The concentration of CN in aqueous phase was determined using the same fiber. In the previous work, the effects of extraction temperature, extraction time, stirring speed, salinity, and resolution time on the extraction effect were investigated (Hao et al., 2022). The best extraction conditions were obtained as follows: extraction temperature 40°C, extraction time 30 min, stirring speed 1500 r/min, NaCl 2 mol/L, and resolution time 2 min.
Quantification of CN in the aqueous and gas phase was calculated based on two calibration curves. A calibration curve for aqueous samples was obtained by a serial dilution from standard stock solution (10 mg/ml) to the lowest concentration (10 μg/ml) calibration standard. In each analysis, eighty microliters of water samples were diluted to 4 ml with ultrapure water for SPME. These samples were extracted for 30 min under the same extraction conditions to obtain a standard curve for the aqueous phase. The curve for the gas phase was from the standard gas method, which will be described in the following part.
Analysis was conducted on a 7890A gas chromatograph (FID, Agilent Technologies, United States) at 250°C. The injector temperature was set at 250°C. Nitrogen was used as carrier gas at a pressure of 20 psi. Hydrogen and air were used as detector gases at 40 and 300 ml/min flow, respectively. The analytical column was DB-5MS, 30 m × 0.25 m, 0.25 μm thickness (Agilent Technologies). The temperature program of the GC was from 80°C (1 min) to 250°C (8 min) at 20°C/min.
The concentration of CN in the water films was accumulated by both adsorption and absorption processes, which can be described by the following equation (Chen et al., 2011):
where:
According to Eq. 1, the y-axis intercept and slope of the curve are the values of bulk phase concentration (CW) and the partition constant KAI, respectively. In combination with the value of Cg, the interfacial partition constant KAI was obtained.
The samples’ DOM in river water and sea water was measured using a Shimadzu F-6000 fluorescence spectrophotometer from Japan. The sample was placed in a 1 cm quartz cuvette with a scanning speed of 12,000 nm/min. The excitation wavelength (λEx) in the range of 200–900 nm (slit width 5 nm) was used, and fluorescence was recorded (λEm) in the range of 200–900 nm (slit width 5 nm).
The surface tension of ultrapure water and the real samples were measured using the pendant droplet method with a contact angle meter. An inverted pendant drop was suspended from a stainless-steel needle. A digital video camera captured the images of the drops. Ten milliliters of ultrapure water and environmental water were weighed. The density of each sample was measured and used to calculate the surface tension of different samples. The salinity (SAL), total dissolved solids (TDS), and conductivity of environmental water were determined using a laboratory conductivity meter.
The SPME-GC response was obtained using the standard gas method. A gas-tight syringe was used to extract the headspace gas from a vial filled with CN. The temperature of the vial was maintained at 20°C. Then the gas samples were injected into a brown bottle (1.15 L) to get gas mixtures. The bottle was sealed with a sealing film (Parafilm) and placed in a thermostat oil-bath cauldron at 15°C. The concentration of CN in the bottle was calculated by the following equation.
Where: Ps (mmHg) is the saturated vapor pressure of CN (4.1 × 10⁻³ mmHg at 20°C), V (L) is the extraction volume, ns (μg/L) is the amount of the CN introduced into the brown bottle, R is the gas constant, T (K) is the sample temperature.
A glass-tight syringe was used to draw 50, 100, 200, 400, and 500 ml of headspace gas. The CAR/PDMS extraction fiber was inserted into the sealing film and extracted for 10 min. After each set of experiments, the syringe and the bottle were heated to avoid residual. Different concentrations of gas mixtures were prepared for the standard curve and analyzed by GC-FID.
The standard curve for the SPME is y = 16.069x-14.792, and the correlation coefficient is 0.9897, indicating that the method’s linearity is acceptable.
We selected four time periods to explore the rule of gas phase concentration with different water film thicknesses. From the beginning of the experiment, CN was collected from the gas phase at 10–20, 30–40, 50–60 and 70–80 min, respectively. The result is shown in Figure 3. It can be seen from the figure that the concentration of CN in the reactor showed an increasing trend, and the concentration of CN decreased as the thickness of the water film increased. For the water film with a thickness of 136 μm, part of the bottom surface of the quartz boat will be exposed when covered for more than 1 h. So, 60 min was chosen as the experiment time.
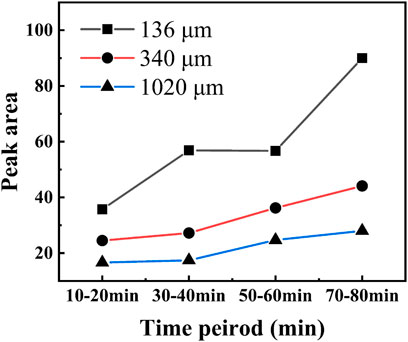
FIGURE 3. Trend of gas phase concentration of CN.
The uptake experiments with ultrapure water were first conducted at 288 K. The thickness of the water films ranged from 136 to 1020 μm. The concentration of CN was plotted as a function of the gas phase concentration/film thickness to determine the partitioning constant (KAI). Figure 4A shows the fitted line of the experimental data.
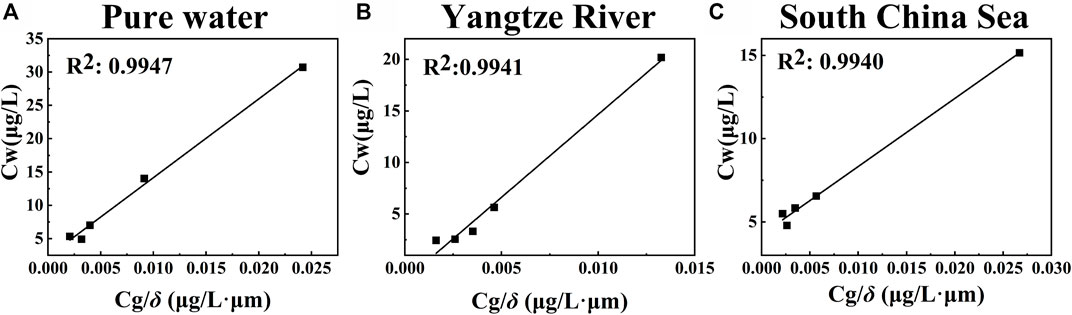
FIGURE 4. Uptake of CN from the gas-phase on water films with varying thicknesses and different sample.
As shown in Table 1, the average gas-phase concentration for different water film experiments ranged from 2.11 to 3.29 mg/L. The overall concentrations of CN in the water film ranged from 4.92 to 30.7 mg/L. The interfacial partition constant KAI at 288 K is 1182.2 ± 49.9. With the increase in film thickness, the overall equilibrium concentration of CN in the aqueous film decreased. Surface adsorption became the dominant partition mechanism as the film thickness decreased. The correlation coefficient of the linear fit was 0.9947, indicating a good correlation between the two parameters.
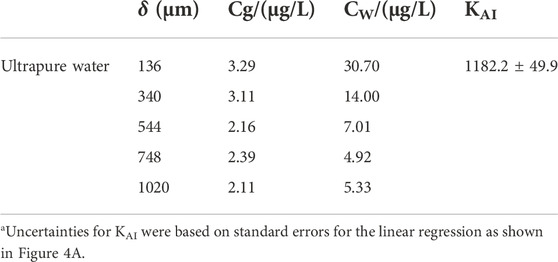
TABLE 1. Interface air-water partition constants of CN for ultrapure water.
Five experiments were performed at 288 K. The bottom surface of the boat was coated with the water sample collected from the Yangtze River. The thicknesses of the river water films were 136, 340, 544, 748, and 1,020 μm, respectively. As can be seen from Table 2, the overall concentrations of CN in water film determined in river water ranged from 1.65 to 20.18 μg/L. The partition constant KAI was 1606.6 ± 101.3 at 288 K. As shown in Figure 4B, the correlation coefficient of the linear fit was 0.9941. The partition constant of CN in river water was higher than that of ultrapure water. CN was easily adsorbed at the air-water interface of river water.
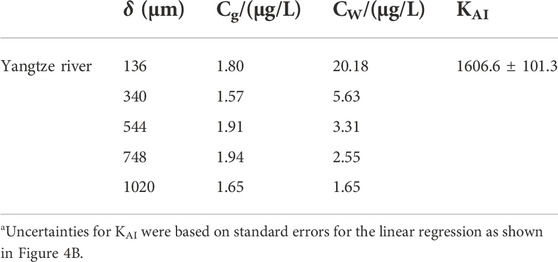
TABLE 2. Interface air-water partition constants of CN for river water.
Five experiments were performed with the surface sample collected from the south China sea in 288 K. The concentration of CN was analyzed using the SPME-GC method. Table 3 below illustrates that the overall concentration of CN ranged from 4.79 to 15.16 μg/L. The results of the correlational analysis are presented in Figure 4C. The correlation coefficient of the two paraments was 0.9940. And the interfacial adsorption partition constant KAI was 408.9 ± 18.3 at 288 K.
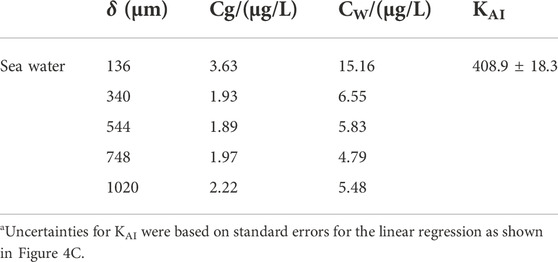
TABLE 3. Interface air-water partition constants of CN for sea water.
The collected environmental water samples were analyzed using a laboratory conductivity meter. As shown in Table 4, the salinity, total dissolved matter content, and conductivity of the seawater were much higher than those of the river water.
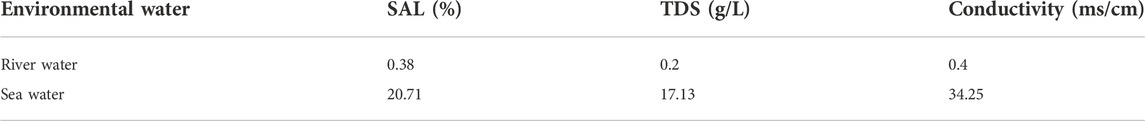
TABLE 4. Salinity, total dissolved solid (TDS) and conductivity of environmental water samples.
Dissolved organic matter (DOM) is the main light-absorbing substance in water, and fluorescence technology has proved to be a valuable tool for providing information on the composition of DOM in water (Stedmon, 2003; Sanchez et al., 2013; Cincotta et al., 2019). The fluorescence spectrophotometer results for ultrapure water, river water, and seawater are shown in Figure 5.

FIGURE 5. Fluorescence intensity measurements of different samples.
Compared to pure water, river water and sea water contains light-absorbing material, and the fluorescence was measured at λEx/λEm = 300/400 nm for sea water. As reported by Fellman and Stedmon, this part of the components was identified as HULIS. The DOM in the collected sea water samples was mainly composed of HULIS (Fellman et al., 2010; Murphy et al., 2010).
As shown in Table 5, the density and surface tension of different samples were measured. Prior studies have noted that the salt in the aqueous cause an increase in surface tension. The result also indicated that the surface tension of seawater was higher than that of salt solution at the same concentration (Zhao and Kang, 2017). It can be seen that river water has slightly lower surface tension than ultrapure water, and the value of surface tension increased with the salinity and the presence of humus.
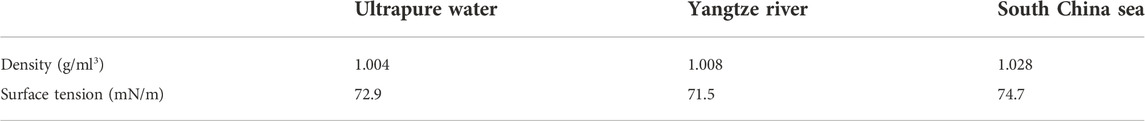
TABLE 5. Surface tension of ambient water.
The overall CN in the aqueous films was accumulated through interfacial adsorption and bulk phase absorption processes. In the previous work, we determined Henry’s constant of CN by a gas-liquid system partitioning device. The experiments were carried out in environmental samples from the same source. As shown in Figure 6, the partition constant and Henry’s constant of CN in the different aqueous samples were different, and the differences were mainly in the river water.
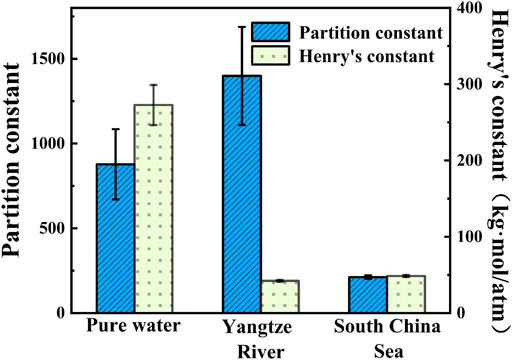
FIGURE 6. Comparison of partition constant and Henry’s constant for CN.
Based on Eq. 1, the intercept of the fitted line in Figure 4 is the value of bulk phase concentration. The least amount of CN was dissolved in the bulk phase of river water, which is consistent with the results of Henry’s constant. As shown in Figure 7, the partition constants of different water samples had a reverse correlation with their surface tensions, and with lower surface tension, CN is more likely to adsorb at the gas/water interface. The surfactant substance in the river reduces the surface tension, and the interfacial adsorption of CN is enhanced by micelle trapping mechanisms or intermolecular bonding. These results match those observed in an earlier study of naphthalene by Jing Chen (Chen and Valsaraj, 2007). The sea water samples have the minimum bulk phase absorption. Although humic substances have been found in seawater from fluorescence measurements, the sea water sample has the highest surface tension, probably because its salinity is significantly higher than that of river water and ultrapure water.
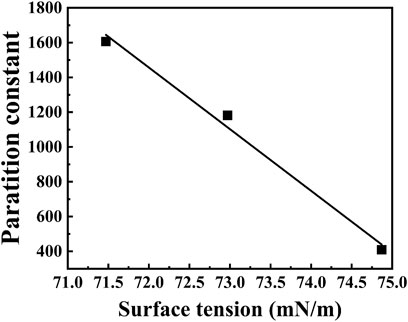
FIGURE 7. Effect of surface tension on partition constant.
The present study suggests that the influence of surface-active substances and ionic strength of environmental water on the bulk phase absorption and interfacial adsorption of CN should be considered comprehensively. The surface tension can be used as a reference to evaluate the adsorption behavior of CN preliminary.
In this study, the interfacial partition constants (KAI) of CN in different film thicknesses and several environmental samples were determined using a flow-tube reactor. SPME was used to uptake and quantify the concentration of CN in the aqueous phase and gas phase. The salinity, DOM and surface tension of different samples were tested, respectively.
Surface adsorption became the dominant absorption mechanism for CN as the film thickness decreased. The adsorption partitioning ability of CN at the air/water interface was negatively correlated with surface tension. CN is more likely to adsorb at the gas/water interface with lower surface tension. The maximum interface adsorption for CN was found at the air/river water interface, and the partition constant at the air/river water interface was 1606.6 ± 101.3. The KAI of CN in ultrapure water and sea water samples at 288 K were 1182.2 ± 49.9, 408.9 ± 18.3. Fluorescence measurements indicated that light-absorbing substances exist in seawater and river water, and humis substances were founded in seawater. The presence of salts and HULIS in seawater reduces the bulk phase uptake and interfacial desorption of CN.
The original contributions presented in the study are included in the article/supplementary material, further inquiries can be directed to the corresponding author.
Conceptualization and design HW, RG; methodology SH, XL; writing original draft preparation, SH, CS; data analysis, SH, XL; manuscript review and editing, HW, XL, SH, CS. All authors have read and agreed to the published version of the manuscript.
This work was supported by the National Key Research and Development Program of China (Grant No. 2021YFB3301100) and the National Natural Science Foundation of China (Grant Nos. 21876202 and 21177158).
The authors declare that the research was conducted in the absence of any commercial or financial relationships that could be construed as a potential conflict of interest.
All claims expressed in this article are solely those of the authors and do not necessarily represent those of their affiliated organizations, or those of the publisher, the editors and the reviewers. Any product that may be evaluated in this article, or claim that may be made by its manufacturer, is not guaranteed or endorsed by the publisher.
Blain, P. (2003). Tear gases and irritant incapacitants. Toxicol. Rev. 22 (2), 103–110. doi:10.2165/00139709-200322020-00005
Brombach, M. (2011). Abandoned chemical weapons in China: The unresolved Japanese legacy. Glob. Green U. S. A. U. S. Affil. Green Cross Int. 21, 1–33.
Cappiello, A., Simoni, E., Fiorucci, C., Mangani, F., Palma, P., Trufelli, H., et al. (2003). Molecular characterization of the water-soluble organic compounds in fogwater by ESIMS/MS. Environ. Sci. Technol. 37 (7), 1229–1240. doi:10.1021/es0259990
Carrick, W., Cooper, D., and Muir, B. (2001). Retrospective identification of chemical warfare agents by high-temperature automatic thermal desorption-gas chromatography-mass spectrometry. J. Chromatogr. A 925 (1-2), 241–249. doi:10.1016/s0021-9673(01)01024-x
Chen, J., Ehrenhauser, F., Liyana-Arachchi, T., Hung, F., Wornat, M., and Valsaraj, K. (2011). Adsorption of gas-phase phenanthrene on atmospheric water and ice films. Polycycl. Aromat. Compd. 31 (4), 201–226. doi:10.1080/10406638.2011.585370
Chen, J., and Valsaraj, K. (2007). Uptake and UV-photooxidation of gas-phase polyaromatic hydrocarbons on the surface of atmospheric water films. 2. Effects of dissolved surfactants on naphthalene photooxidation. J. Phys. Chem. A 111 (20), 4289–4296. doi:10.1021/jp068394p
Chiu, R., Tinel, L., Gonzalez, L., Ciuraru, R., Bernard, F., George, C., et al. (2017). UV photochemistry of carboxylic acids at the air-sea boundary: A relevant source of glyoxal and other oxygenated VOC in the marine atmosphere. Geophys. Res. Lett. 44 (2), 1079–1087. doi:10.1002/2016gl071240
Cincotta, M., Perdrial, J., Shavitz, A., Libenson, A., Shanley, J., Perdrial, N., et al. (2019). Scientific data management in the age of big data: An approach supporting a resilience index development effort. Front. Environ. Sci. 7, 1–13. doi:10.3389/fenvs.2019.00072
Duan, J., Li, B., Liu, H., Gao, R., Zhang, Y., and Wang, H. (2020). Determination of the purity of chloroacetophenone by the monpeak method of differential scanning calorimetry. Chem. Anal. Meterage 29 (05), 11–14. (in Chinese). doi:10.3969/j.issn.1008-6145.2020.05.003
Fellman, J., Hood, E., and Spencer, R. (2010). Fluorescence spectroscopy opens new windows into dissolved organic matter dynamics in freshwater ecosystems: A review. Limnol. Oceanogr. 55 (6), 2452–2462. doi:10.4319/lo.2010.55.6.2452
Goss, K. (2010). The air/surface adsorption equilibrium of organic compounds under ambient conditions. Crit. Rev. Environ. Sci. Technol. 34 (4), 339–389. doi:10.1080/10643380490443263
Hao, S., Sun, C., Zhang, Y., Wang, H., Zhao, W., Wang, X., et al. (2021). Adsorption of gas-phase cyclohexanone on atmospheric water films. Atmosphere 12 (12), 1705. doi:10.3390/atmos12121705
Hao, S., Wang, H., Zhao, W., Sun, C., Gao, R., and Zhang, Y. (2022). Simultaneous determination of trace level riot control agents in environmental water by solid-phase microextraction and gas chromatography coupled with a Flame Ionization Detector. J. Sep. Sci. 45 (14), 2612–2620. doi:10.1002/jssc.202100851
Hu, B., Li, Y., Yang, N., Gao, C., Wang, H., and Zhang, J. (2008). Determination of the environmentally safe threshold value of chloroacetophenone in waters. Acta Sci. Circumstantiae 28 (1), 125–131. (in Chinese). doi:10.3321/j.issn:0253-2468.2008.01.020
Jing, C., Franz, S., Kalliat, T., and Mary, M. (2006). Uptake and UV-photooxidation of gas-phase PAHs on the surface of atmospheric water films. 1. Naphthalene. J. Phys. Chem. A 110 (29), 9161–9168. doi:10.1021/jp062560b
Mcneill, V., Patterson, J., Wolfe, G., and Thornton, J. (2006). The effect of varying levels of surfactant on the reactive uptake of N<sub>2</sub>O<sub>5</sub> to aqueous aerosol. Atmos. Chem. Phys. 6, 1635–1644. doi:10.5194/acp-6-1635-2006
Murphy, K., Butler, K., Spencer, R., Stedmon, C., Boehme, J., and Aiken, G. (2010). Measurement of dissolved organic matter fluorescence in aquatic environments: An interlaboratory comparison. Environ. Sci. Technol. 44 (24), 9405–9412. doi:10.1021/es102362t
Olajos, E., and Salem, H. (2001). Riot control agents: Pharmacology, toxicology, biochemistry and chemistry. J. Appl. Toxicol. 21 (5), 355–391. doi:10.1002/jat.767
Peleg, A., Barak, H., Adina, P., and Eyal, R. (2016). The impact of dry atmospheric deposition on The sea-surface microlayer in the SE mediterranean sea: An experimental approach. Front. Mar. Sci. 3, 222. doi:10.3389/fmars.2016.00222
Sanchez, N., Skeriotis, A., and Miller, C. (2013). Assessment of dissolved organic matter fluorescence PARAFAC components before and after coagulation-filtration in a full scale water treatment plant. Water Res. 47 (4), 1679–1690. doi:10.1016/j.watres.2012.12.032
Stedmon, C., Markager, S., and Bro, R. (2003). Tracing dissolved organic matter in aquatic environments using a new approach to fluorescence spectroscopy. Mar. Chem. 82 (3-4), 239–254. doi:10.1016/S0304-4203(03)00072-0
Stirchak, L., Abis, L., Kalalian, C., George, C., and Donaldson, D. (2021). Differences in photosensitized release of VOCs from illuminated seawater versus freshwater surfaces. ACS Earth Space Chem. 5 (9), 2233–2242. doi:10.1021/acsearthspacechem.1c00063
Thornton, J., and Abbatt, J. (2005). N(2)O(5) reaction on submicron sea salt aerosol: Kinetics, products, and the effect of surface active organics. J. Phys. Chem. A 109 (44), 10004–10012. doi:10.1021/jp054183t
Tinel, L., Rossignol, S., Bianco, A., Passananti, M., Perrier, S., Wang, X., et al. (2016). Mechanistic insights on the photosensitized chemistry of a fatty acid at the air/water interface. Environ. Sci. Technol. 50 (20), 11041–11048. doi:10.1021/acs.est.6b03165
Tu, A. (2010). Chemical weapons abandoned by the imperial Japanese army in Japan and China at the end of World war II. Toxin Rev. 30 (1), 1–5. doi:10.3109/15569543.2011.542111
Keywords: air-water interface, partition constant, 2-Chloroacetophenone, surface microlayer, flow-tube reactor
Citation: Hao S, Liu X, Sun C, Zhang Y, Gao R, Wang H and Wang X (2022) Experimental study of the adsorption of 2-Chloroacetophenone at the air-environmental water interface. Front. Environ. Sci. 10:1052646. doi: 10.3389/fenvs.2022.1052646
Received: 24 September 2022; Accepted: 28 October 2022;
Published: 09 November 2022.
Edited by:
Gen Zhang, Chinese Academy of Meteorological Sciences, ChinaReviewed by:
Jing Chen, Beijing Normal University, ChinaCopyright © 2022 Hao, Liu, Sun, Zhang, Gao, Wang and Wang. This is an open-access article distributed under the terms of the Creative Commons Attribution License (CC BY). The use, distribution or reproduction in other forums is permitted, provided the original author(s) and the copyright owner(s) are credited and that the original publication in this journal is cited, in accordance with accepted academic practice. No use, distribution or reproduction is permitted which does not comply with these terms.
*Correspondence: Runli Gao, Z2FvcnVubGlAMTYzLmNvbQ==; Haitao Wang, ZHJfd2h0QDE2My5jb20=
†These authors have contributed equally to this work
Disclaimer: All claims expressed in this article are solely those of the authors and do not necessarily represent those of their affiliated organizations, or those of the publisher, the editors and the reviewers. Any product that may be evaluated in this article or claim that may be made by its manufacturer is not guaranteed or endorsed by the publisher.
Research integrity at Frontiers
Learn more about the work of our research integrity team to safeguard the quality of each article we publish.