 H. X. Duan
 T. J. Zhang1,2,3
- 1Institute of Arid Meteorology, China Meteorological Administration, Lanzhou, China
- 2Key Laboratory of Arid Climatic Change and Reducing Disaster of Gansu Province, Lanzhou, China
- 3Northwestern Regional Center of Numerical Weather Prediction, China
- 4Changdu Meteorological Bureau of Tibet, Changdu, China
The upper boundary condition of a numerical model can significantly influence the model prediction results. This study used the Weather Research and Forecasting model to introduce the Rayleigh damping layer in the complex terrain of southern Gansu, China. Sensitivity tests are conducted for a strong precipitation process that occurred in 2016. Meanwhile, the effects of the upper gravity-wave damping layer and vertical velocity damping term of different schemes are explored. The results show that the upper gravity-wave damping layer can effectively reduce the error caused by false gravity waves in the complex terrain of southern Gansu Province. Moreover, the applicability of this model in the complex terrain of northwestern China is discussed. Overal, prediction of the precipitation area and intensity is improved. Specifically, the introduction of an implicit gravity-wave damping layer has a more significant damping effect on the upwardly propagating gravity-wave.
Highlights
• The use of upper gravity-wave damping layer can improve the forecast of precipitation area in complex terrain area.
• The use of upper gravity-wave damping layer can reduce the number of false precipitation reports for Tibet plateau slopes.
• Implicit gravity-wave damping layer has a more significant damping effect on the upwardly propagating gravity-wave.
Introduction
Development of gravity-waves can trigger heavy rain on the mesoscale (Uccellini, 1975; Li 1978; Stobie et al., 1983; Uccellini and Koch, 1987; Xu et al., 2013). Many studies have shown that the excitation sources of gravity waves are mostly located in the troposphere, but the fluctuations can propagate vertically to the middle and upper levels, affecting the middle atmosphere circulation and energy balance, and the material exchange and distribution of the entire atmosphere (Bretherton 1969; Holton 1982; Huang 1985). It is quite difficult to accurately reflect the influence of gravity waves on the upper model boundary in a numerical model, which, traditionally including rigid covers and constant pressure surfaces, can completely reflect the energy of upwardly propagating gravity-waves. A feasible improvement is to add a damping layer to optimize the influence of gravity wave energy on the top of the boundary layer. This layer can use the horizontal diffusion or Rayleigh damping, and its damping coefficient increases with height (Klemp and Lilly, 1978; Durran and Klemp, 1983).
Klemp and Durran (1983) proposed a radiation upper boundary condition for a mesoscale numerical model that allows vertically propagating internal gravity-waves to be transmitted out of the computational region with minimal reflection. Klemp et al. (2008) followed by proposing a new technique, in which an implicit Rayleigh damping term is applied only to the vertical velocity, as a final adjustment at the end of each small (acoustic) time step. This technique has immense potential in idealistic experiments and practical numerical forecasting applications.
The damping plays a significant role in the development of atmospheric circulation at the top of the atmosphere. However, they are exclusively based on theoretical research and fail to apply the model in weather forecasting, especially in complex terrains. Accordingly, this study first introduces the data and the mode test design. Subsequently, the influence of Rayleigh damping absorption on a heavy precipitation process in the complex terrain of the central and southern Gansu Province, China is analyzed from the perspectives of precipitation pattern and gravity-wave-related diagnostic quantity. Finally, the influence of Rayleigh damping absorption on heavy precipitation in the complex terrain is summarized and discussed.
Model, experimental design, and data
This study applied the Weather Research and Forecasting model (WRF) 3.9.1, with horizontal resolutions of 27 km, 9 km, and 3 km, and 40 vertical layers. D03 has a total of 562 × 376 grid points. Initial and boundary conditions refer to the 6-h data from the Global Forecast System (GFS) developed by the National Center of Environmental Prediction (NCEP) (http://www2.mmm.ucar.edu/wrf/users/download/get_sources_wps_geog.html). Details about models and areas for simulation can be found in the study by Duan et al. (2018). The specified physical models are as follows: Noah Land Surface Model (Ek et al., 2003), Rapid Radiative Transfer Model (RRTM), Long Wave Radiation Model (Mlawer et al., 1997), Dudhia Short Wave Radiation Model (Dudhia, 1989), Asymmetric Convective (ACM 2) Planetary Boundary Layer Model (Pleim, 2007a; Pleim, 2007b), and Kain-Fritsch Cumulus Convection Scheme (Kain, 2004) and Thompson Microphysics Scheme (Thompson et al., 2008). We did not employ a convective scheme in our smallest domain because the grid spacing of 2 km should be fine enough to handle explicit convection. Table 1 shows the sensitivity test schemes of the upper gravity-wave damping layer or an implicit gravity-wave damping layer (3) vertical velocity damping flagvertical velocity damping.
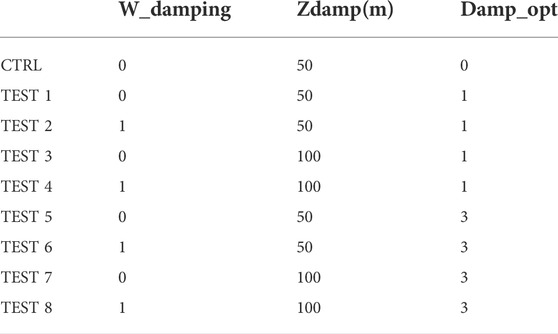
TABLE 1. Test design Damp_opt:0: no diffusion layer; 1: increased diffusion layer; 3: implicit gravity-wave damping layer.
Zdamp is the damping depth (m) from model top. Damp_opt is Upper Damping in WRF model: Either a layer of increased diffusion (damp_opt = 1) or a Rayleigh relaxation layer (2) or an implicit gravity-wave damping layer (3), can be added near the model top to control reflection from the upper boundary.W_damping is vertical velocity damping flag. Vertical motion can be damped to prevent the model from becoming unstable with locally large vertical velocities. (0, is no vertical velocity damping, 1is vertical velocity damping).
Additionally, the data used for verification of gravity-wave diagnostic quantity was drawn from the ERA5 hourly data (https://cds.climate.copernicus.eu/cdsapp#!/dataset/reanalysis-era5-pressure-levels?tab=form).
Results
Impact on precipitation forecasting
An event of large-scale precipitation occurred in the eastern part of northwestern China from 0800 to 2300 BT 22 June 2016. There were showers/thunderstorms in the area to the east of Wuwei City, Gansu Province, China. There were heavy rainfall in the cities of Dingxi, Longnan, Tianshui, and Pingliang. Additionally, downpours were reported in three villages and towns of the Min County, Dingxi City and Dangchang County, Longnan City (Figure 1A). A total of 24 stations received short-term heavy precipitation in cities such as Weinan, Dingxi, Gannan, Pingliang, and Qingyang. The maximum hourly precipitation intensity reached 38.8 mm in Mazichuan Town, Min County (at 2200 BT June 22). Among the 1047 towns and villages that received precipitation in Gansu Province, 342 received moderate rain, 175 heavy rain, 35 rainstorm, and three downpour. Substantial precipitation occurred in Mazichuan Town, Min County (120.4 mm); Awu Town, Dangchang County (111.7 mm); Hadapu Town, Dangchang County (107.9 mm); Jingning County (89.2 mm); Jiahe Town, Jingning County (81.7 mm); and Sigou Town, Min County (78.4 mm). The amount of precipitation in Lanzhou City was 7.7 mm.
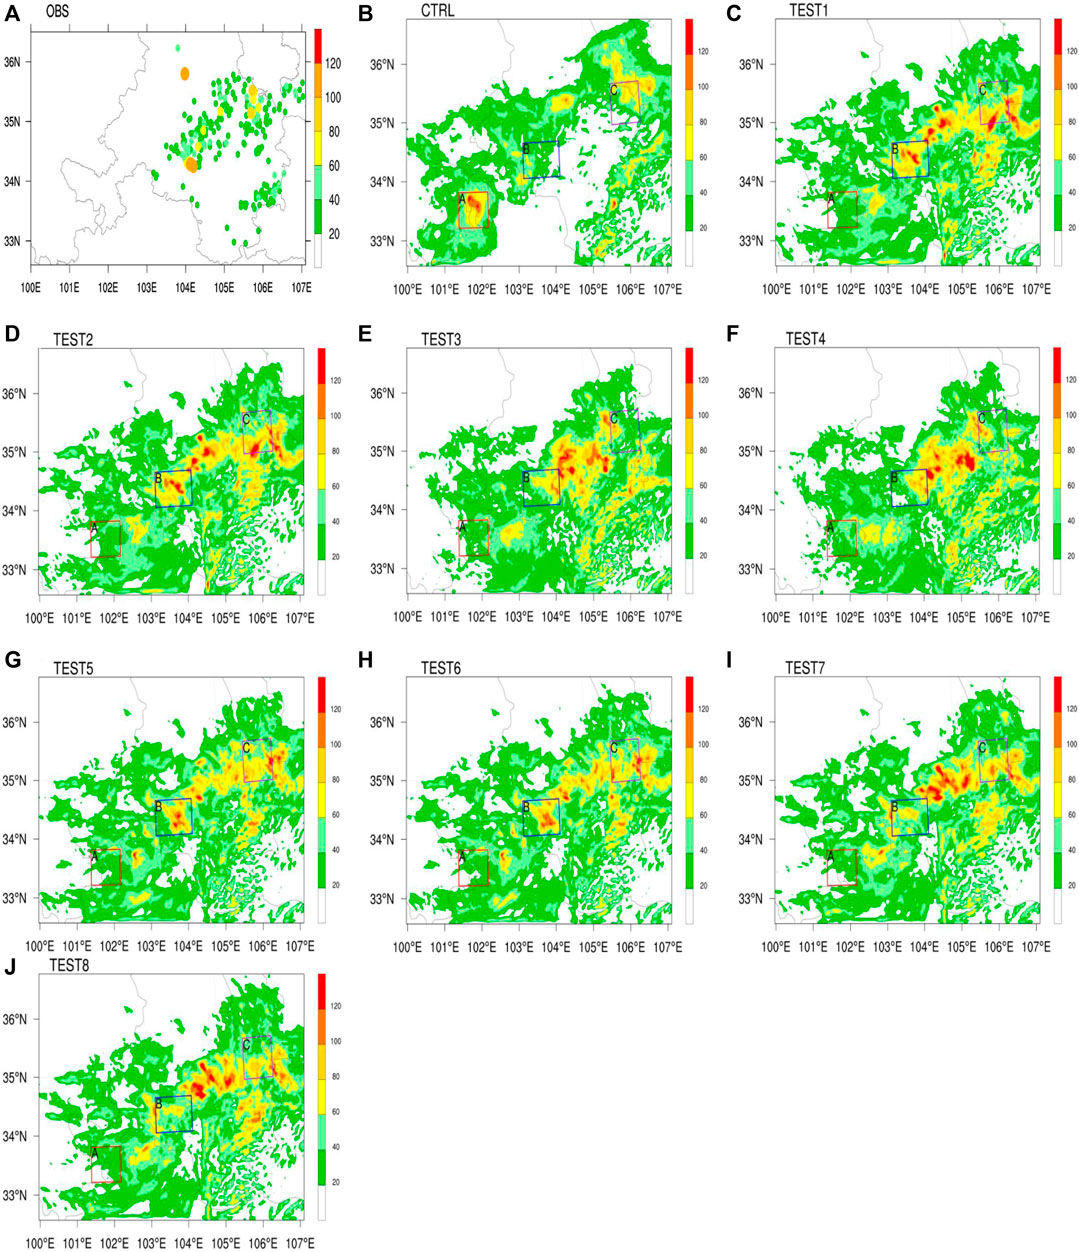
FIGURE 1. 24-h precipitation distribution map (0800 BT June 22 to 0800 BT 23 June 2016, units: mm) (A) Observation by the Gansu Provincial Regional Station (B) CTRL (C–J) TESTs 1–8.
The 24-h precipitation predicted by the CTRL mainly occurred in the eastern part of northwestern China, with moderate rain mainly received in the eastern part of Qinghai Province, the central and eastern parts of Gansu Province, and the central part of Shaanxi Province (Figure 1B). Rainstorms primarily impacted the Gannan, Dingxi, and Pingliang Areas of Gansu Province as well as the southern part of Ningxia Province. Rainstorm-impacted areas in the Longnan and Tianshui Areas of Gansu Provinces were relatively scattered. The maximum 24-h precipitation reached 156 mm—the precipitation center being the Gannan and Ganzi Areas. The CTRL achieved a good forecast effect in terms of the downpour at a single station in the Longnan Area as well as the areas where rain fell in the Tianshui Area. Moreover, two SW-NE extended rainfall belts were successfully predicted by the CTRL, although their actual locations were more northwestern. However, the forecast of strong precipitation in Area A proved to be empty forecasting, and strong precipitation in southern Dingxi was not predicted. After the upper gravity-wave damping/diffusion was introduced, significant changes in the overall precipitation pattern were observed compared to those in the CTRL, although the precipitation conditions of the eight TESTs were not much different (Figures 1C–J). Specifically, precipitation in Area A was significantly reduced from the level of downpour in the CTRL to the level of moderate rain. When the upper gravity-wave layer was a diffusion layer (Figures 1C,D) (that is, TESTs 1 and 2), precipitation in amounts exceeding 25 cm mainly fell in the central and eastern parts of Gansu Province, and rainstorms primarily occurred in the central and southern parts of Dingxi, Tianshui, and west Pingliang. In contrast, when the upper gravity-wave layer was an implicit gravity-wave damping layer with a model layer height of 50 mb (that is, TESTs 5 and 6), the rainfall areas resembled those in TESTs 1 and 2, with certain deviations in the heavy precipitation centers; these deviations in TESTs 5 and 6 mainly occurred in the southern part of the Dingxi Area and the western part of the Pingliang Area. Moreover, scattered precipitation was predicted in the central part of Gansu Province, which was closer to the actual observation. The results show that the precipitation areas predicted by TEST 3/4 are more concentrated, and the heavy precipitation centers are mainly concentrated in the central part of Gansu Province; meanwhile, the prediction intensity of B and C is relatively small. Strong precipitation areas predicted by TESTs 7 and 8 were more concentrated mainly in the northern and central parts of Dingxi, Gansu Province, while scattered and strong precipitation was observed in the Tianshui and Pingliang Areas. Overall, the precipitation predicted in the southern part of Dingxi was actually of weak density.
In general, all the sensitivity tests significantly improved the false forecasting of rainstorm in the southwestern part of Area A in the CTRL, and they had strong predictions regarding the precipitation in the central parts of Dingxi, Tianshui, and Pingliang. From the perspectives of precipitation area and intensity, the results of TESTs 5 and 6 regarding precipitation area and intensity were closer to the observational data in this precipitation process.
Influence on gravity-waves and vertical velocity
Qin et al. (2007) argued that atmospheric gravity-waves at night are more stable than those during daytime, which is more conducive to the excitation of gravity-waves. Shear instability in the lower atmosphere may trigger gravity-waves. Figure 2 shows the vertical profile of the pseudoequivalent potential temperature at 1900 BT 22 June 2016, in Area A with the strongest empty forceasting intensity. This period witnessed the strongest precipitation in Area A. Specifically, the vertical profile of the pseudoequivalent potential temperature of ERA5 data at 2200 BT 22 June 2016 reflects the influence of the upper gravity-wave damping layer on the stability in the complex terrain (Figure 2A). The middle and lower parts of the atmosphere (450–700 mb) above Area A are featured by convective unstable stratification, whereas that at 450–300 mb is characterized by natural stratification. When the height is 300–150 mb, the contour map of the pseudoequivalent potential temperature becomes sparse and relatively flat, with minor fluctuations. In contrast, the contour map above 150 mb is denser and straighter. According to the vertical profile of the pseudoequivalent potential temperature by the CTRL (Figure 2B), the interval below 500 mb is the main host to the unstable convective stratification, whereas the interval of 400–150 mb is mainly dominated by natural stratification, where the contour map of the pseudoequivalent potential temperature is sparse and significantly fluctuates in the whole longitude zone. Meanwhile, the contour map of the pseudoequivalent potential temperature is denser and accompanied by stronger disturbances in the interval above 150 mb, with the disturbance able to reach upwardly until 50 mb. In contrast, the pseudoequivalent potential temperatures of TESTs 1–4 are similar in the interval below 150 mb, but they become dense and straight in the interval above 150 mb, which, together with the strong fluctuation above Area A, demonstrate the upward transmission of the gravity-wave disturbance until 50 mb. Compared to other sensitivity TESTs and ERA5, TEST 3/4 is slightly different from other experiments in that it is more stable in predicting the pseudoequivalent potential temperature over Area A, and the disturbance above 150MB is straighter than in other experiments. TESTs 7 and 8 have similar vertical profiles of pseudoequivalent potential temperatures in the interval below 150 mb. However, the pseudoequivalent potential temperatures of TESTs 7 and 8 are similar to those of ERA5, the contour map of which is dense and straight. Regardless of weak fluctuation in the 150–300 mb interval, there is little fluctuation in the upper atmosphere, which indicates an implicit gravity-wave damping layer for the upper gravity-wave damping layer parameter. Moreover, the model significantly reduces the upward propagation height of the gravity-wave generated by the undulating terrain, when the upper adsorption boundary layer is 100 mb. Correspondingly, the upward propagation of unstable energy is suppressed, accompanied by the eventually reduced occurrence of false precipitation. Additionally, the prediction of the precipitation situation by each TEST suggests the unobvious influence of the vertical velocity damping term on the TEST results.
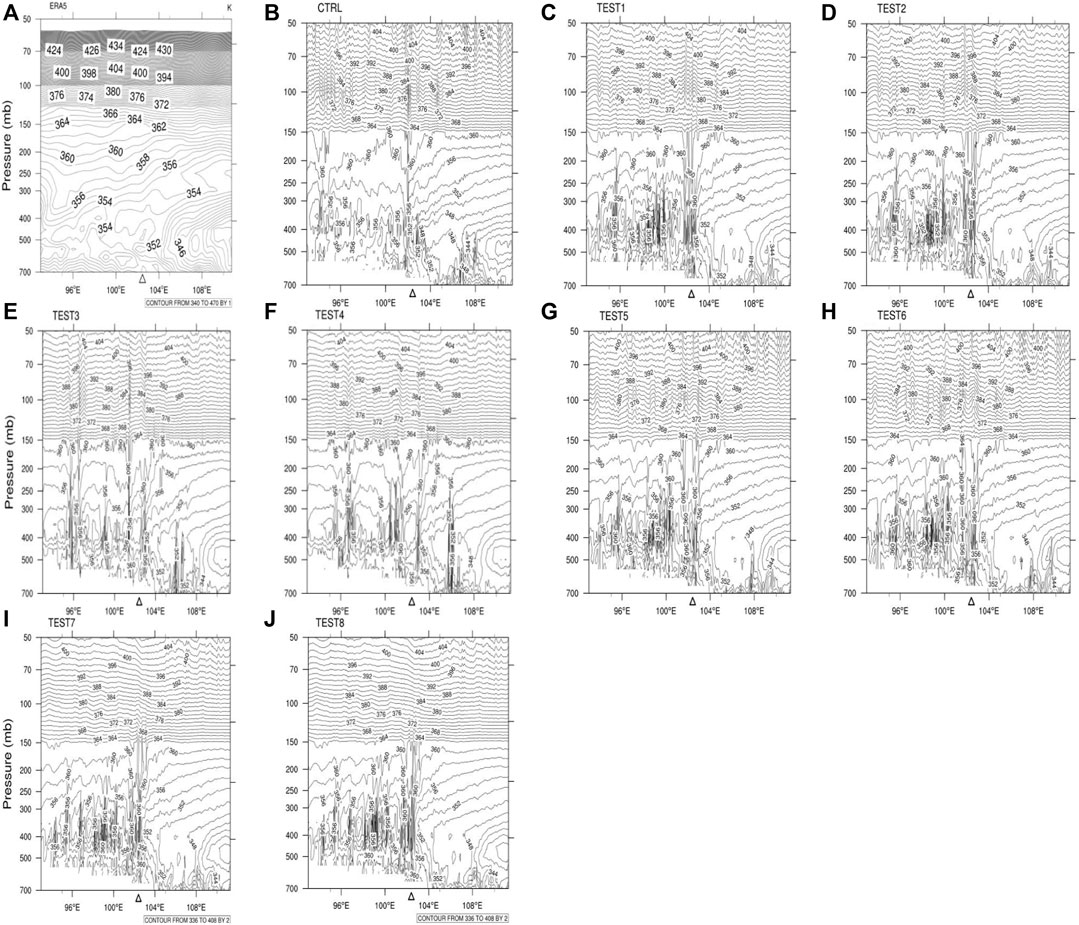
FIGURE 2. Vertical profiles of the pseudoequivalent potential temperature at 1900 on 22 June 2016 over Area A (units: K) (A) ERA5, (B) CTRL, (C–J) TESTs 1–8.
Figure 3 shows the distribution of vertical velocity and potential temperature at 150 hPa. ERA5 shows that Area A has obvious subsidence movement, whereas Areas B and C have no obvious vertical movement (Figure 3A). Additionally, the three areas are not in the high potential temperature area or the dense potential temperature isoline zone. Area A predicted by the CTRL still has a strong upward movement at 150 hPa (Figure 1B). Meanwhile, the area is still in the high potential temperature zone, and the potential temperature isolines are relatively dense. There is weak upward movement in Area B, and the potential temperature isolines are relatively dense, whereas there is little upward movement and no intensive potential temperature isolines in Area C. TEST 1/2/5/6 is similar, both of them have ascending movement in Area. The accending movement area is scattered, and the ascending movement is obviously weaker than that of the CTRL (Figures 3C, D, G, H). The ascending movement in Area B was significantly stronger than that of the CTRL, and there was no ascending movement in Area C. The ascending motion of TEST 3/4 in Areas A and B is weaker than that in other experiments, and there is no obvious vertical motion in Area C (Figures 3E,F). The obvious difference between TEST 7/8 and other experiments is that their predicted potential temperature isolines are more sparse (Figures 3I,J). Additionally, the ascending motion of Areas A and B predicted by the two methods is obviously weaker at 150 hPa, which is similar to other experiments. The common feature of all the experiments is that they can obviously inhibit the strong upward movement of the CTRL in Area A, and adjust the intensity of the upward movement in Area B to make it closer to the actual situation.
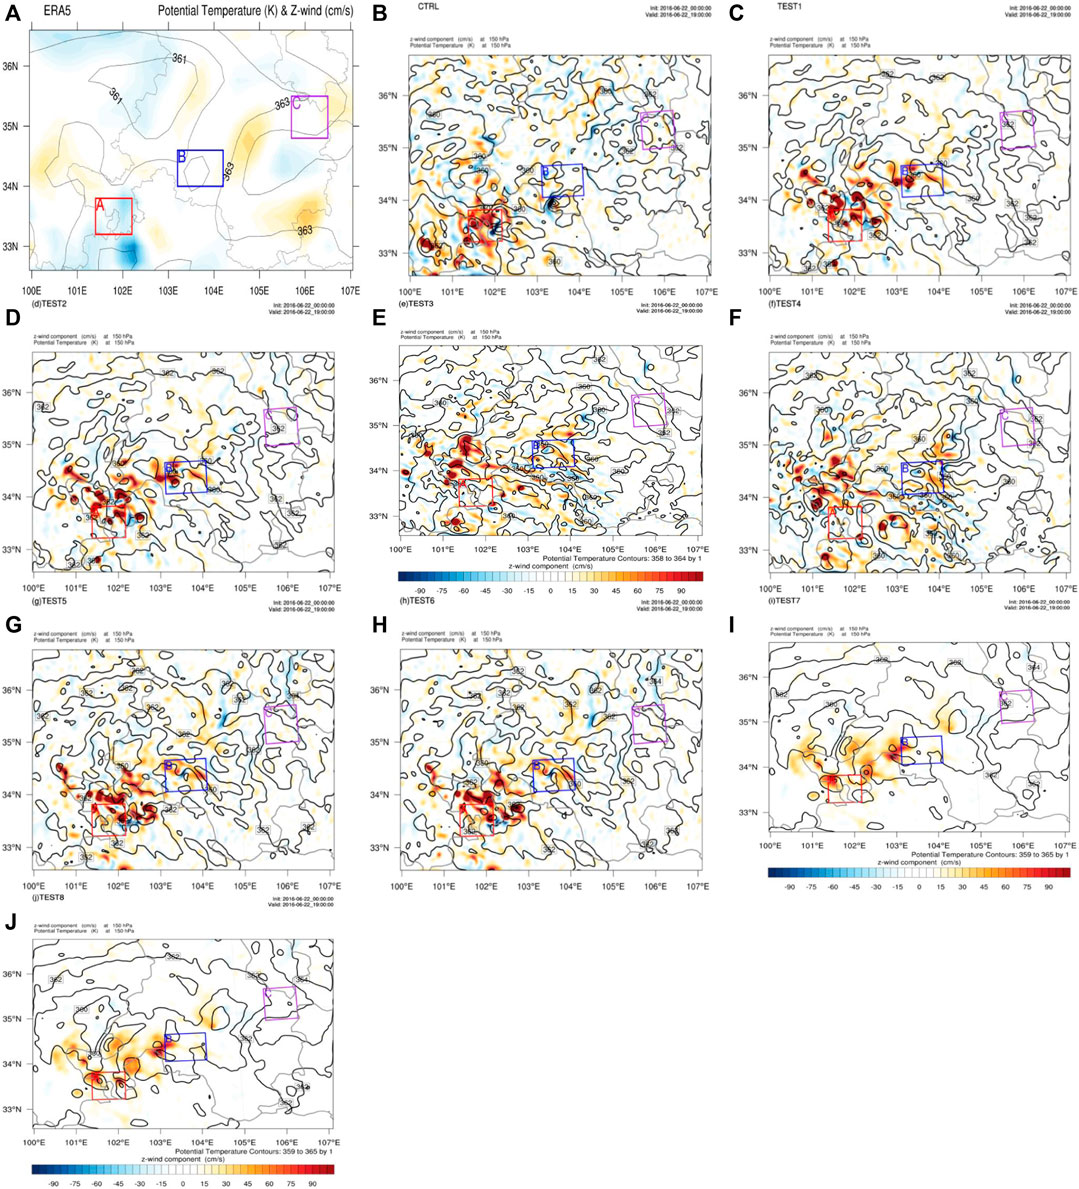
FIGURE 3. 150 hPa pseudoequivalent potential temperature level distribution map (unit: K).
Figure 4 shows the vertical profiles of vertical velocity and wind field over Areas A, B, and C. The result of ERA5 shows a horizontal movement of southwest wind over Area A; the vertical velocity is less than 0.2 m/s and there is little upward movement (Figure 4A). There is an obvious upward movement in Area B and its northeast. There is a weak subsidence over Area C. There is a strong upward movement in Area A predicted by the CTRL without the absorption of upper gravity wave, and the southwest air flow is uplifted here; so, strong precipitation is predicted by the CTRL in Area A (Figure 4B). In contrast, the CTRL has predicted weak ascending motion in Area B, but the ascending motion range is small. There is no ascending movement in Area C, so the CTRL has no good forecast effect on precipitation in Areas B and C. Compared to the CTRL, TEST 1/2 significantly decreased the vertical velocity in Area A, and increased the intensity of vertical velocity in Area B (Figures 4C,D). TEST 3/4 has the smallest prediction of vertical velocity in Areas A, B, and C (Figures 3E,F). There is little ascending movement in Areas A and C, and the prediction of vertical velocity in Area B is obviously weak, which is also a reason for the significant deviation of precipitation in the three areas. The vertical velocity profiles predicted by TESTs 5–8 are similar (Figures 4G–J), which obviously weaken the strong upward movement in Area A of the CTRL, and also enhance the upward movement in Area B. This is also a reason why the four experiments weaken the false precipitation in Area A and enhance the precipitation intensity forecast in Area B. However, none of the eight experiments in TESTs 1–8 predicted a strong upward movement over Area C; thus, the prediction of precipitation in Area C was weaker than the actual situation.
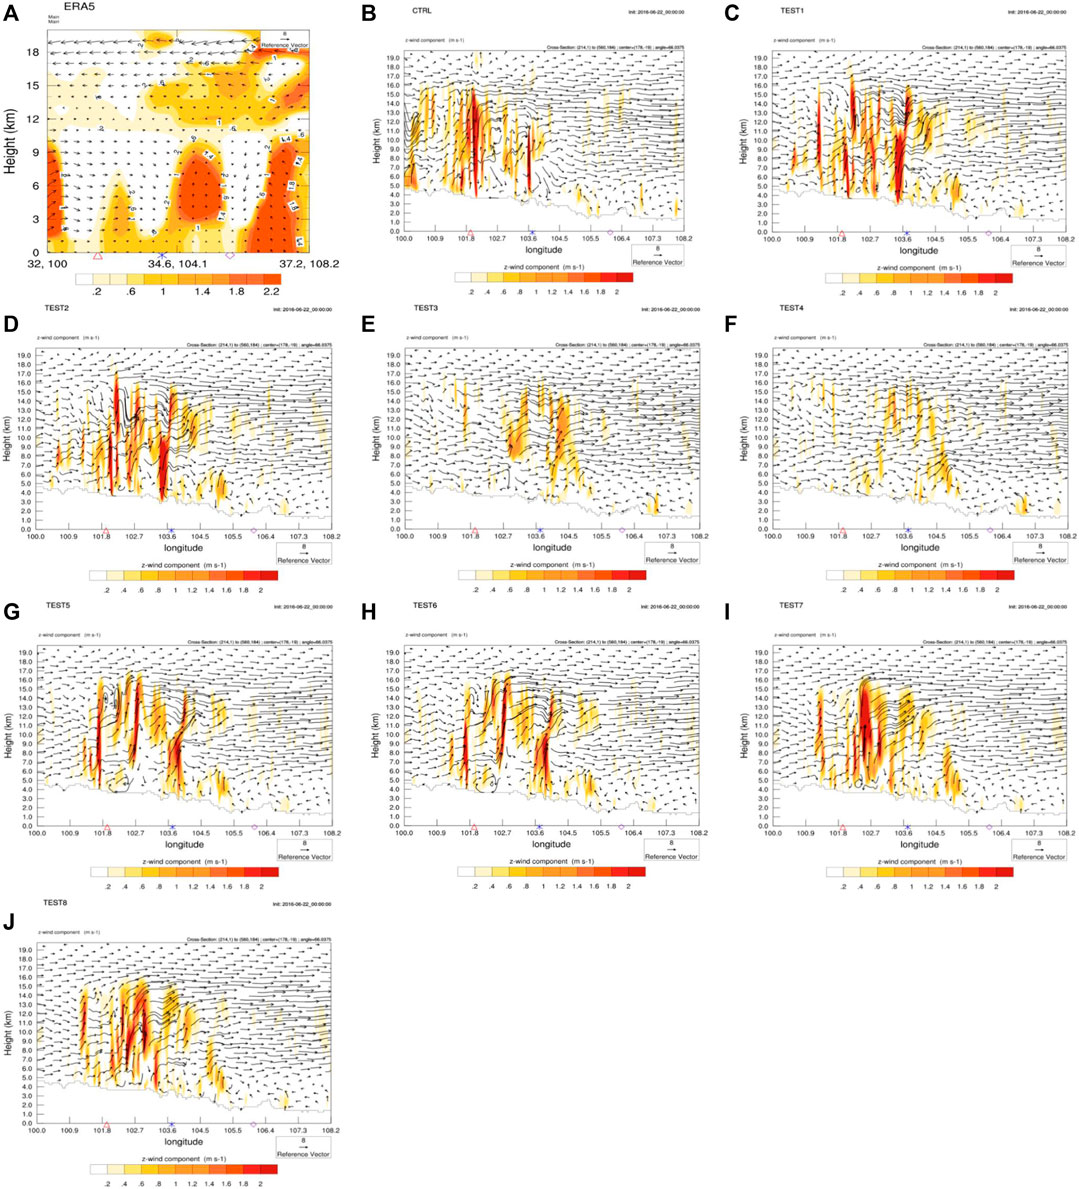
FIGURE 4. Vertical section of vertical velocity (shaded, unit: m/s) and vertical wind field (arrow, unit: m/s) over Area A, China at 19:00 on 22 June 2016 (unit: K) (A) ERA5; (B) CTRL (C-J) TESTs 1–8
Figure 5 shows the variation of the maximum vertical velocity over time for Area A. There was no obvious upward movement over Area A during the entire precipitation period from 0000 BT June 22 to 0000 BT June 23, as shown in the ERA5 data. Therefore, there was also no obvious precipitation in Area A. In contrast, the maximum vertical velocity predicted by the CTRL without the upper gravity-wave damping layer reached a maximum of 20.7 m/s at 1500 BT June 22, which was the largest among all experiments, followed by TESTs 8 and 7 (both 18.3 m/s) and TEST 2/1 (15.8 m/s). The maximum vertical velocity for TEST 3/4, 17 m/s, occurred at 16:00. After 16:00, the maximum vertical speed of all tests is gradually decreasing. The maximum vertical velocity for ERA5, 2.3 m/s, occurred at 2000. At this time, the closest test to ERA5 is TEST8/7. Throughout the process, the maximum vertical speed of all tests was larger than that of ERA5. Therefore, it is safe to conclude that the introduction of upper gravity-wave adsorption can significantly weaken the vertical velocity over a complex terrain. Especially for TESTs 7 and 8, their upper gravity-wave adsorbing layers are implicit gravity-wave damping layers, and they can more obviously absorb the upwardly propagating false gravity-wave generated by the complex terrain, and thus, reduce the false vertical velocity caused by the terrain.
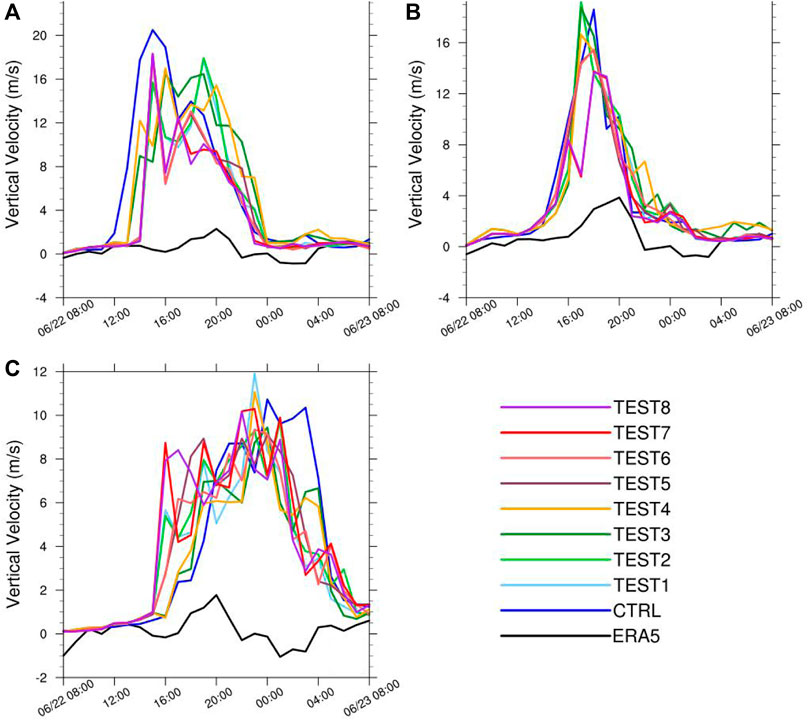
FIGURE 5. Variations in maximum vertical velocity with time in Areas (A) a; (B) b; (C) c (units: m/s).
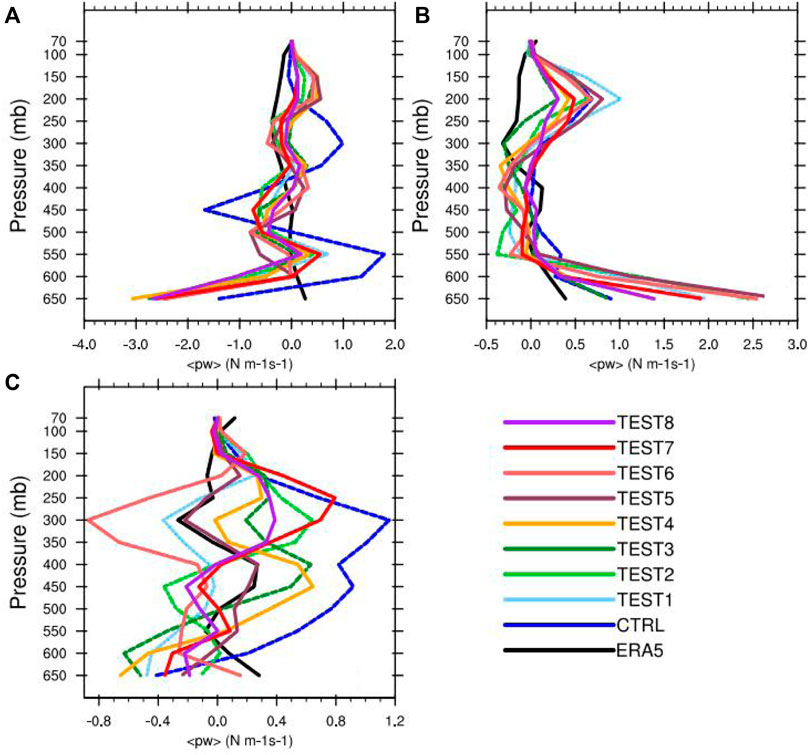
FIGURE 6. Vertical profile of time-averaged energy flux over Areas (A) a; (B) b; (C) c.
ERA5 data showed a strong upward movement over Area B from 1800 to 2000 BT. The upwelling motion in Area B predicted by the nine WRF numerical experiments is 2 hours earlier than that predicted by ERA5, and the intensity is also greater than that predicted by ERA5. Among them, TEST 2/3 is the strongest and TEST 7/8 is the weakest. The ascending movement of Area C reflected by ERA5 was weaker than that reflected by A/B, and there was a sinking movement from 0100 to 0400 BT on June 23. In the numerical experiment, the ascending movement of Area C was continuous from 1600 BT on June 22 to 0400 BT on June 23; however, the ascending movement was weaker than that of Areas A and B.
For a more quantitative assessment, we calculated the vertical energy fluxes from the upper troposphere to the stratosphere in the Area A predicted by these experiments (Figure 4). The flux of the upwardly propagating wave energy is always positive, whereas that of the momentum is positive for the rightward propagating gravity-wave but negative for the leftward propagating one. Therefore, the wave energy flux is more informative than the vertical momentum flux. The energy flux significantly varies because of the response to the pulsating convective updraft. Therefore, a small difference in the evolution of the vertical profile can lead to a significant change in the energy flux distribution in the stratosphere (Klemp et al., 2008). According to the vertical distribution of energy flux in the ERA5 data, all the layers have positive energy flux, which implies upwardly propagating energy flux—except for the troposphere in the 300–250 mb interval. Moreover, the energy flux in the stratosphere above 200 mb is significantly larger than that in the troposphere. For the CTRL, the energy flux is negative at the upper troposphere in the 450–375 mb interval, which suggests downwardly propagating gravity-wave energy; it is positive in the upper troposphere to the middle layer of the stratosphere above 375 mb, reaching a maximum of 23.7 Nm−1s−1 at 300 mb. This indicates obvious upwardly propagating energy wave energy at these heights as predicted by the model. TESTs 1–4 share similar energy flux predictions with the CTRL, namely, the positive energy flux in the interval above 400 mb until the middle stratosphere, with a maximum that is much smaller than that in the CTRL occurring in the 400–350 mb interval. Therefore, it can be inferred that the diffusion layer, when used as the wave damping layer, has a certain diffusion ability for the false gravity-wave energy in the middle and upper layers, which reduces the propagation height of the false gravity-wave in the stratosphere generated by the terrain. In contrast, when an implicit gravity-wave damping layer is used as the upper gravity-wave damping layer (that is, TESTs 7 and 8), the energy flux is only positive in the intervals of 400–300 mb and in the vicinity of 150 mb; this implies that upwardly propagating gravity-wave has weak energy and it is negative in the intervals, suggesting downwardly propagating wave energy. Therefore, it can be said that the implicit gravity-wave damping layer can absorb the false gravity-wave in the middle and upper layers of the model, which further constrains the upward propagation of false gravity-wave, thus effectively reducing
Conclusion
It remains highly challenging to prevent the artificial reflection of gravity-wave energy from the upper boundary of the mesoscale analog domain for numerical weather prediction applications. In the past, research in this area paid more attention to the study of its theory, and less research on its effect in practical application.This study employs a new scheme for the upper gravity-wave adsorption layer to analyze an actual precipitation event. The WRF model is applied to study the effect of the upper gravity-wave damping layer on the strong precipitation in complex terrain through sensitivity tests of a strong precipitation process above the complex terrain of Gansu Province, China, on June 22–23, 2016. A false gravity-wave can propagate until the middle layer of the stratosphere over the complex terrain in the CTRL without introduction of the upper gravity-wave adsorption layer, which implies a strong prediction of vertical velocity, and thus, generation of more false precipitation reports. In contrast, the introduction of an upper gravity-wave adsorption layer can well suppress the upward propagation of the false gravity-wave generated by the complex terrain. Specifically, when the implicit gravity-wave damping layer is used as the upper gravity-wave damping layer, the damping effect on the vertically propagating energy of internal gravity-waves is more significant. Moreover, the vertical velocity damping term has little effect on the test results because of the suppression of vertical movement that improves operational robustness and prevents the model from becoming unstable when a local large vertical velocity is present. This only affects the core of a strong updraft, and therefore, has a minor impact on the results (Klemp et al., 2008).
It is worth noting that as the conclusions of this study are obtained only through a case of precipitation, more cases are required for further verification and more comprehensive evaluation in the future. In addition, the similarities and differences in the role of this upper gravitational wave absorber layer in complex terrain and flat terrain will also be aspects that we need to pay attention to in the future. And, the global warming has exacerbated the instability of the climate system, making certain extreme weather events increasingly likely. Then, what is the effect of this upper gravitational wave absorption on the process of extreme precipitation, which will also be a problem that we need to further study.
Plain language summary
To adapt to the characteristics of terrain height fluctuation and its significant drop in northwest China and to address the problem of false precipitation reports for the steep terrain area of plateau slopes, the absorption parameter of upper gravity wave is added to the model. This parameter can reduce the propagation of false gravity wave caused by terrain to the upper layer of the model. When the upper damping layer of gravity wave is an implicit damping layer, the damping effect on the vertical propagation of gravity wave energy can be more significant. The proposed scheme can improve the forecast of heavy rainfall for the steep terrain of plateau slopes, especially in Area A, while reducing the number of false precipitation reports.
Data availability statement
The raw data supporting the conclusion of this article will be made available by the authors, without undue reservation.
Author contributions
HD initiated the study. HD, TZ, CG, and GZ interpreted the data. HD wrote the article.
Acknowledgments
The first author gratefully acknowledges the funding provided by Northwest Regional Numerical Forecasting Innovation Team Fund (GSQXCXTD-2017-02) and Scientific Research Talents Fund of the Gansu Meteorological Bureau. Natural Science Foundation of Tibet Autonomous Region (XZ202001ZR0028G).
Conflict of interest
The authors declare that the research was conducted in the absence of any commercial or financial relationships that could be construed as a potential conflict of interest.
Publisher’s note
All claims expressed in this article are solely those of the authors and do not necessarily represent those of their affiliated organizations, or those of the publisher, the editors and the reviewers. Any product that may be evaluated in this article, or claim that may be made by its manufacturer, is not guaranteed or endorsed by the publisher.
References
Bretherton, F. P. (1969). Momentum transport by gravity waves. Q. J. R. Meteorol. Soc. 95, 213–243. doi:10.1002/qj.49709540402
Duan, H. X., Li, Y. H., Zhang, T. J., Pu, Z., Zhao, C., and Liu, Y. (2018). Evaluation of the forecast accuracy of near-surface temperature and wind in northwest China based on the WRF model. J. Meteorol. Res. 32 (3), 469–490. doi:10.1007/s13351-018-7115-9
Dudhia, J. (1989). Numerical study of convection observed during the Winter Monsoon Experiment using a mesoscale twodimensional model. J. Atmos. Sci. 46, 3077–3107.
Durran, D. R., and Klemp, J. B. (1983). A compressible model for the simulation of moist mountain waves. Mon. Wea. Rev. 111, 2341–2361. doi:10.1175/1520-0493(1983)111<2341:acmfts>2.0.co;2
Ek, M. B., Mitchell, K. E., Lin, Y., Rogers, E., Grunmann, P., Koren, V., et al. (2003). Implementation of Noah land surface model advances in the National Centers for Environmental Prediction operational mesoscale Eta model. J. Geophys. Res. 108, 2002JD003296. doi:10.1029/2002jd003296
Holton, J. R. (1982). The role of gravity wave induced drag and diffusion in the momentum budget of the mesosphere. J. Atmos. Sci. 39, 791–799. doi:10.1175/1520-0469(1982)039<0791:trogwi>2.0.co;2
Huang, R. H. (1985). The studies on the stratospheric and mesospheric dynamics. Chin. J. Atmos. Sci. (in Chinese) 9 (4), 413–422. doi:10.3878/j.issn.1006-9895.1985.04.11
Kain, J. S. (2004). The Kain–Fritsch convective parameterization: An update. J. Appl. Meteor. 43, 170–181. doi:10.1175/1520-0450(2004)043<0170:tkcpau>2.0.co;2
Klemp, J. B., Dudhia, J., and Hassiotis, A. D. (2008). An upper gravity-wave absorbing layer for NWP applications. Mon. Wea. Rev. 136, 3987–4004. doi:10.1175/2008mwr2596.1
Klemp, J. B., and Durran, D. R. (1983). An upper boundary condition permitting internal gravity-wave radiation in numerical mesoscale models. Mon. Wea. Rev. 111, 430–444. doi:10.1175/1520-0493(1983)111<0430:aubcpi>2.0.co;2
Klemp, J. B., and Lilly, D. K. (1978). Numerical simulation of hydrostatic mountain waves. J. Atmos. Sci. 35, 78–107. doi:10.1175/1520-0469(1978)035<0078:nsohmw>2.0.co;2
Li, M. C. (1978). Studies on the gravity-wave initiation of the excessively heavy rainfall. Chinese J. Atmos. Sci. 2 (3), 201–209.
Mlawer, E. J., Taubman, S. J., Brown, P. D., Iacono, M. J., and Clough, S. A. (1997). Radiative transfer for inhomogeneous atmospheres: RRTM, a validated correlated-k model for the longwave. J. Geophys. Res. 102, 16663–16682. doi:10.1029/97jd00237
Pleim, J. E. (2007a). A combined local and nonlocal closure model for the atmospheric boundary layer. Part I: Model description and TESTing. J. Appl. Meteorol. Climatol. 46, 1383–1395. doi:10.1175/jam2539.1
Pleim, J. E. (2007b). A combined local and nonlocal closure model for the atmospheric boundary layer. Part II: Application and evaluation in a mesoscale meteorological model. J. Appl. Meteorol. Climatol. 46, 1396–1409. doi:10.1175/jam2534.1
Qin, W. J., Shou, S. W., Li, Q. T., Wang, Y. Q., and Peng, J. L. (2001). Research on the dynamics factors influencing development of inertial gravity waves. Plateau Meteorology 26 (3), 519–524.
Stobie, J. G., Einaudi, F., and Uccellini, L. W. (1983). A case study of gravity-waves-convective storms interaction: 9 may 1979. J. Atmos. Sci. 40 (12), 2804–2830. doi:10.1175/1520-0469(1983)040<2804:acsogw>2.0.co;2
Thompson, G., Field, P. R., Rasmussen, R. M., and Hall, W. D. (2008). Explicit forecasts of winter precipitation using an improved bulk microphysics scheme. Part II: Implementation of a new snow parameterization. Mon. Wea. Rev. 136, 5095–5115. doi:10.1175/2008MWR2387.1
Uccellini, L. W. (1975). A case study of apparent gravity wave initiation of severe convective storms. Mon. Wea. Rev. 103 (6), 497–513. doi:10.1175/1520-0493(1975)103<0497:acsoag>2.0.co;2
Uccellini, L. W., and Koch, S. E. (1987). The synoptic setting and possible energy sources for mesoscale wave disturbances. Mon. Wea. Rev. 115 (3), 721–729. doi:10.1175/1520-0493(1987)115<0721:tssape>2.0.co;2
Keywords: upper gravity-wave absorption, complex terrain, precipitation, WRF model, energy flux
Citation: Duan HX, Zhang TJ, Gong CS, Zhou GL and Zhu W (2022) Influence of the upper gravity-wave damping layer on precipitation over complex terrain. Front. Environ. Sci. 10:1044969. doi: 10.3389/fenvs.2022.1044969
Received: 15 September 2022; Accepted: 27 October 2022;
Published: 10 November 2022.
Edited by:
Shao Sun, Chinese Academy of Meteorological Sciences, ChinaReviewed by:
Chenghai Wang, Lanzhou University, ChinaWen Huo, Institute of Desert Meteorology, China
Copyright © 2022 Duan, Zhang, Gong, Zhou and Zhu. This is an open-access article distributed under the terms of the Creative Commons Attribution License (CC BY). The use, distribution or reproduction in other forums is permitted, provided the original author(s) and the copyright owner(s) are credited and that the original publication in this journal is cited, in accordance with accepted academic practice. No use, distribution or reproduction is permitted which does not comply with these terms.
*Correspondence: H. X. Duan, ZHVhbmh4QGlhbWNtYS5jbg==