 Maxwell Chukwudi Udeagha*
 Nicholas Ngepah
- School of Economics, College of Business and Economics, University of Johannesburg, Johannesburg, South Africa
Global warming presents a worrisome condition that necessitates important actions across the planet. One promising strategy is encouraging investments through public–private partnership investment (PPPI) in green ventures. The Environmental Kuznets Curve (EKC) hypothesis framework is used in the current study to examine the relationship between the aforementioned factor and the level of carbon dioxide (CO2) emissions in South Africa between 1960 and 2020. Using the recently developed novel dynamic autoregressive distributed lag (ARDL) simulations framework, the results showed that (i) public–private partnership investment in energy contribute to deteriorating environmental quality; (ii) while the technique effect (TE) improves environmental quality, the scale effect (SE) largely contributes to escalating CO2 emissions, thus confirming that the EKC hypothesis holds; iii) energy consumption, foreign direct investment, trade openness, and industrial growth escalate CO2 emissions, but technological innovation reduces it; and iv) public–private partnership investment in energy, technological innovation, scale effect, technique effect, foreign direct investment, energy consumption, industrial growth, and trade openness Granger-cause CO2 emissions in the short, medium, and long run, showing that these variables are fundamental to determining environmental quality. Our empirical findings suggest that PPPIs should be accomplished in environmentally friendly sectors and industries, and South Africa’s government and policymakers should take further initiatives to ensure the implementation of policies that enable the change from non-renewable energy sources to renewable ones to promote efficiency in the production processes and curtail CO2 emissions in the country.
1 Introduction
The Earth has undoubtedly seen significant repercussions from rising environmental pollution and the consequences of global warming in recent years (Udeagha and Ngepah, 2022a; b). International bodies, such as the United Nations (UN), have hosted different events and established multiple sustainability target initiatives to address the ecological damage throughout the world and its indirect consequences on economies. For example, the Sustainable Development Goals (SDGs) of the 2030 Agenda for Sustainable Development, which integrate economic growth, social progress, and environmental conservation holistically, were embraced at the 2015 UN summit by the member states as one of the phenomenal growing world sustainability plans (Udeagha and Ngepah, 2022c; d). The UN member states adopted 17 main objectives for combating global warming and the greenhouse effect, ranging from reducing the negative effects of poverty, hunger, inequality, and injustice to fostering the development of clean energy that is both affordable and effective, sustainable economic growth, responsible consumption, and social advancement. Additionally, the Paris Agreement was ratified in 2015 at the United Nations Climate Change Conference (COP21), and the parties agreed that a limit of 2°C (ideally 1.5°C) in global warming relative to pre-industrial levels by the year 2100 was feasible. The Paris Agreement strengthens the mitigation goals of greenhouse gas (GHG) emission reductions while safeguarding global environmental sustainability with the aim of limiting global temperature rise to less than 2°C. The Paris Agreement highlights the strong linkage between the effects and responses to global warming, equitable access to sustainable progress, and other goals. The Glasgow Climate Pact, a more recent worldwide agreement, was formed at the 2021 COP26 meeting and incorporated important global goals to make the 2020s a decade of climate legislation and advancements. As was emphasized at the COP26 conference in Glasgow, nations must present aggressive emission reduction goals by 2030 if they hope to reach net zero emissions by the middle of the century. In addition, governments pledged to further decrease CO2 emissions, limit methane emissions by 30%, progressively slash coal utilization, provide financial assistance to emerging and poor countries to deal with the impacts of climate change, switch to the use of renewable energy, and eliminate deforestation by 2030. It was crucial to maintain and review the commitments reached in the prior Paris Agreement during the most recent meeting of UN member nations. In order to help countries achieve their “nationally determined contribution” (NDC) goals while fostering sustainable growth and eliminating pollution, nations should ultimately receive detailed, balanced, and consolidated non-market initiatives that are planned and implemented effectively. Additionally, it has been documented in several recent case studies that the boost in economic growth leads to an increase in energy consumption, which leads to excessive reliance on fossil fuels and an increase in CO2 emissions, which ultimately degrades environmental quality (Udeagha and Breitenbach, 2022). These studies have emphasized the significance of ecologically friendly inventions, renewable resources, energy efficiency, and economic growth, which is ecologically sustainable.
The issue of sustainable development and climate change has captured the interest of the whole world. Environmental degradation may have several severe effects, including coastal flooding, a decline in the global food supply, and an increase in disease-related mortality if significant actions are not done to stop it. These inescapable catastrophes are mostly caused by CO2 emissions, which account for more than 80% of greenhouse gas (GHG) emissions, and are primarily produced by the burning of fossil fuels, such as oil, coal, and gas, for energy production. Most nations continue to rely significantly on fossil fuels, which are mostly to blame for environmental deterioration. As a result, authorities, academics, and corporations globally have been more interested in the change in energy production choices. Two major issues—climate change and the shift to a cleaner energy economy—have caused grave anxiety and provide fresh difficulties for the South African administration. Although South Africa’s energy matrix is among the most renewable in the world and has an excellent energy production infrastructure, South Africa ranks as one of the top 15 carbon dioxide emitters in the world and still uses a lot of fossil fuels (Udeagha and Muchapondwa, 2022a). The nation has committed to reducing GHG emissions through its most recent program, establishing goals for a 37% decrease in emissions by 2025 and a 43% reduction by 2030, based on levels observed in 2005.
Any nation seeking to change to a low-carbon economy must have adequate financial resources, of which investment in low-carbon initiatives is a crucial component. The shift from a large-scale growth model to a low-carbon framework has a systemic difficulty and is multidimensional across the whole economic growth phase. It was first researched in two directions: how to increase energy efficiency and how to create renewable and clean energy. Boosting investments in low-carbon businesses and reducing investments in energy-intensive industries that produce high levels of carbon emissions share the objective of sustainability. However, policymakers have been compelled to work with the private sector and local communities to achieve low-carbon transformation and sustainable energy production owing to the government’s limited resources and the constant rise in energy demand. Cárdenas Rodrguez et al. (2015) stated that the private sector might aid in achieving the future of renewable energy. Decentralization will boost energy capacity, cost savings, sustainability, and environmental quality and raise energy efficiency. Decentralization also boosts the economy by promoting new manufacturing chains, creating employment, and increasing regional revenue. Public–private partnerships (PPPs) that modify the way energy is produced may diversify and balance the energy grid, lessen negative environmental consequences, and promote sustainable growth.
The South African government has traditionally prioritized energy issues to lessen their negative environmental effects (Udeagha and Ngepah, 2022e). Due to its political environment, South Africa had a significant economic recession from 2014 to 2016. Although the relevance of PPP investments in energy production has increased because of globalization, technical advancement, and a lack of government funding, the idea of PPPs has not yet attained widespread acceptance. To achieve a more hopeful outcome than expected by acting alone, governments, non-profit groups, and profit corporations collaborate on specific projects under the umbrella of PPP (Yurdakul et al., 2021). More specifically, it refers to formalizing a long-term partnership (agreement) between the public and private sectors to deliver products and services to the public at reasonable costs. Together with the public sector, the private sector makes investments that allow for the rationalization of interventions, the reduction of costs and risks, and the encouragement of sharing experiences and information. In a broader sense, it includes a variety of short- and long-term management contracts, such as those for planning, investing, building, selling off, and maintaining a property. These management models for PPPs fall under a broad category that encompasses a few distinct subcategories, including private finance initiative (PFI), reconstruct-operate-transfer (ROT), and build-operate-transfer (BOT). By working together, the private sector can partially recoup its investment and effectively serve the public’s needs while working with constrained resources.
In 2016, almost 1 year after submitting its climate pledge or “nationally determined contributions” (NDC) to the Paris climate conference, South Africa joined the Paris Agreement. By 2030, it is desired to cut emissions by 33%–35% from 2005 levels for each unit of economic growth. The government of South Africa has effectively implemented medium- and long-term economic planning measures to achieve the CO2 eradication targets. Energy also fuels CO2 emissions, and South Africa’s rapid economic expansion has been facilitated by heavy energy use. Furthermore, owing to the Kyoto Protocol, traditional energy sources have made way for more sustainable ones in energy generation. The importance of PPPI in renewable energy projects is shown by this scenario. PPPI applies to long-term agreements between public and private organizations to ensure that inhabitants can access crucial general services and commodities. Recently, the South African government has been actively promoting the PPPI approach in initiatives including energy, transportation, spending, and building. The nation has put in place comprehensive laws to support PPPs as a crucial instrument to improve her deeply ingrained environmental, social, political, and socioeconomic issues and fulfill the mandate of realizing the goals of foreign and domestic development initiatives (Udeagha and Ngepah, 2021). PPPs have been extensively used by the nation as a developmental strategy over the years to help it achieve the objectives outlined in the National Development Plan (NDP), Medium-Term Strategic Framework (MTSF), Accelerated and Shared Growth Initiative for South Africa (AsgiSA), and Millennium Development Goals (MDGs). PPPs are used as an alternative to traditional public procurement in South Africa. They increase cost-effectiveness, boost resource allocation efficiency, address the effects of subpar service delivery and central government underperformance under centralized systems that foster a culture of rent-seeking behavior, and tolerate incompetence and failures to meet the public’s demand preferences (Fombad, 2014). South Africa, which has long been in the first stage of the PPP maturity scale that Deloitte and Touche (2006) frequently referred to as the “emerging market,” is the region’s leader in adopting PPPs to accomplish sustainable development. In terms of utilizing PPPs to quicken infrastructure development, the nation has become a key rich market that is rapidly expanding (Pessoa, 2006). According to the World Bank Private Participation in Infrastructure (PPI) database, South Africa was placed 15th out of 25 developing nations evaluated between 1999 and 2003 for their usage of PPPs to speed up the construction of their infrastructure (Thomsen, 2005). Additionally, in 1999, the nation considerably boosted the use of PPPs to solve several issues; 2,500 private infrastructure projects totaling around US$755 billion in private investment were a part of this growth (Udeagha and Ngepah, 2020). In South Africa, PPPs were used to supply around 14% of the public sector infrastructure, including social and health services, prisons, hospitals, water reclamation, schools, and roads (Deloitte and Touche, 2006). Given the supporting data, South Africa is an intriguing case for this investigation. Meanwhile, PPPs in the nation have various facets, including initiatives for transportation infrastructure, urban management, energy, and environmental conservatism. As the 15th highest CO2 emitter in the world and the biggest CO2 emitter in Africa, with an estimated 390 million tonnes in 2020 (World Bank, 2021), South Africa is an excellent candidate for this study to explore the environmental effects of PPPI (which consists of energy initiative, and environmental conservation partnership) and determine whether such initiatives have helped mitigate environmental deterioration in the country over the period of 1960–2020.
Several studies have investigated how PPPs changed South Africa. For instance, Jackson and Hlahla (1999) observed that municipalities are showing increasing interest in municipal service partnerships (MSPs), which use PPPs to increase efficiency and access to capital. They explored the role and obstacles for PPPs in infrastructure service delivery demands.
Fombad (2015) examined the application of the PPP principles with a focus on the Gautrain Rapid Rail Link and discovered that PPPs are effective governance tools that boost tactical representation of costs that are tactically effective in the implementation and planning, stimulate community and social obligations, boost mutual commitment, increase collaboration, ensure responsiveness, facilitate risk allocation, and promote accountability and transparency in South Africa. Ittmann (2017) examined the influence PPPs had in the provision of transportation infrastructure and discovered that effective government involvement and commitment are essential to support PPPs. The use of PPPs as mechanisms for equitable development was critically studied by Houghton (2010), who discovered that PPPs have significantly advanced the design and implementation of major important projects in South African cities, such as Durban. Additionally, Rogerson (2010) examined the role PPPs played in promoting local economic development (LED) in South Africa and underlined the significance of encouraging increased dialog to achieve meaningful collaborations between the local government and the private sector for effective local partnerships, as well as enhancing successful LED. Similarly, Sinanovic and Kumaranayake (2010), who investigated the incentives for participating in PPPs to provide tuberculosis treatment in South Africa and used the new institutional economics approach, discovered that private providers who participated seemed to be motivated financially and non-financially. In a related study, Sinanovic and Kumaranayake (2006a), who used the public–private non-government (PPNG) and public–private workplace (PWP) methods, found that PPPs are a reliable framework for providing the necessary funding for the support of tuberculosis treatment that is cost-effective and effective. In addition, Sinanovic and Kumaranayake (2006b) discovered that providing incentives for growing PPPs was a successful strategy for scaling up TB treatment because it allowed for public–private cooperation, which cut down on the cost for the government to treat a new patient. In a similar vein, Brunne (2009) found PPPs to be a successful method for efficiently reducing the HIV/AIDS pandemic throughout South Africa’s provinces. Brunne (2009) studied PPPs as a mechanism to attenuate the growing trend in HIV/AIDS in South Africa. Additionally, Warshawsky (2016) examined how PPPs affected the growth of the Agri-FoodBank (AFB) CSO in South Africa and discovered PPPs to be mutually beneficial partnerships between the government and Food Bank South Africa (FBSA), in which the government needed political clout and FBSA needed funding.
The impact of public–private partnership investments (PPPI) in energy on promoting environmental quality in South Africa has gone unnoticed, although various empirical studies, as shown previously, have investigated the consequences of PPPs in South Africa. Although just a few studies have attempted to relate PPPI to environmental quality globally, including for China (Khan A. et al., 2020; Shahbaz et al., 2020; Anwar et al., 2021; Cheng et al., 2021), Brazil (Ahmad and Raza, 2020; Akinsola et al., 2022), the United States (Van Song et al., 2021), BRICS1 economies (Caglar et al., 2022), France (Shahbaz et al., 2018), SAARC countries2 (Waqih et al., 2019), developing countries (Raza et al., 2021), East Asian and Pacific region (Adebayo et al., 2021a), India (Kirikkaleli and Adebayo, 2021), and Pakistan (Chunling et al., 2021), to the best of our knowledge, no study has explored the nexus between PPPI and environmental quality for South Africa. Thus, this study fills this vital gap in the literature.
Additionally, the studies that evaluated the PPPI–CO2 emission link while controlling for trade openness, such as the afore-cited ones cited, have come under fire for adopting a one-dimensional trade proxy that misses the underlying environmental impact of trade openness. In earlier studies, trade intensity (TI) has consistently been utilized as a proxy for trade openness. The link between PPPI and environmental quality has been examined using the basic ARDL framework. This research used the ratio of trade (exports + imports) to GDP, which primarily captures “TI” to define and approximate trade openness. Only the country’s relative standing in terms of trade performance inside its own economy is considered for this trade openness measurement. By implication, this metric largely overlooks a nation’s openness to international commerce and fails to accurately represent the environmental effects of trade openness (Squalli and Wilson, 2011). Although this metric seems logical on the surface, it does not solve the ambiguity in the definition and precise assessment of trade openness. The primary drawback of the TI-based measure of trade openness is that it only considers one aspect of trade openness, namely, the relative success of the country’s trade in its own domestic economy. By implication, this metric mostly disregards a nation’s openness to international commerce, failing to accurately represent the environmental impact of trade openness (Squalli and Wilson, 2011). As a result, large and wealthy economies are mistakenly labeled as closed economies, whereas their little and underdeveloped rivals are seen as open economies. Because they are classified as closed economies owing to their higher GDPs, larger and more successful economies, such as South Africa, Japan, China, France, the USA, and Germany, are penalized when adopting TI. However, shockingly, by this metric of trade openness, the extremely underdeveloped nations with low GDPs (e.g., Togo, Nigeria, Ghana, Uganda, Venezuela, Zambia, and Zimbabwe) are categorized as open economies. Additionally, issues with model misspecifications, sampled nations, and disparities in methodological frameworks are some of the causes of the lack of empirical agreement and conflicting (mixed) conclusions on the function of PPPI in preventing environmental deterioration.
Accordingly, this research adds to the body of knowledge on PPPI’s effects on the environment in the following ways: i) a survey of the literature reveals that PPPI’s environmental impact is debatable and has created far more heat than light. Many academics have been inspired to examine the function PPPI plays in promoting environmental quality by utilizing various samples and employing recently established methodology because of these contentious pieces of evidence. Additionally, most of the current research on the PPPI-environmental quality nexus focuses on developing or developed nations. To the best of our knowledge, this is the first research to attempt an empirical evaluation of the dynamic relationship between South Africa’s PPPI and environmental quality. By visualizing the potential role PPPI plays in halting environmental degradation in South Africa, this study offers a fresh viewpoint. ii) Previous studies that investigated the PPPI–CO2 emission relationship globally, like the aforementioned ones, frequently used the basic ARDL framework proposed by Pesaran et al. (2001) and other cointegration approaches, which can only examine the short- and long-term relationships between the variables under consideration. To tackle the drawbacks and difficulties in the implementation of the conventional ARDL methodology, Jordan and Philips (2018) established a novel dynamic ARDL simulation model, which is how this study contributes to the body of methodological literature. In addition to being able to automatically simulate and plot to predict graphs of (negative and positive) changes in the variables, as well as examining the associated short-run and long-run relationships among the variables under consideration, the novel dynamic ARDL simulations model competently overcomes the limitations and challenges in the result interpretations of the simple ARDL approach. As a result, the novel technique used in this study produces accurate and unbiased results. iii) Previous studies that globally investigated the PPPI–CO2 emission link while controlling for trade openness have also come under fire for adopting a one-dimensional trade proxy that misses the full environmental impact of trade openness. By carefully utilizing a novel and innovative trade openness proxy created by Squalli and Wilson (2011) to comprehensively account for two dimensions of trade openness, namely, considering trade share in GDP and capturing the size of trade relative to the world trade, this work further contributes to the body of literature on the relationship between PPPI and environmental quality. Therefore, our findings differ significantly from past research that assessed and proxied trade openness using conventional trade intensity by employing the Squalli and Wilson measure of trade openness. iv) By using the frequency domain causality (FDC) approach, the most effective and efficient testing framework suggested by Breitung and Candelon (2006), the current article further contributes to the existing literature on the link between PPPI and environmental quality. As a result, the FDC framework enables accurate accounting for long-term, short-term, and medium-term persistent causation between variables under investigation. The FDC approach is also used in this study as a robustness test. To the best of our knowledge, past studies of the relationship between PPPI and environmental quality, notably for South Africa, overlooked this reliable testing approach. v) Lastly, this work employs second-generation econometric techniques to efficiently consider and capture the impacts of many structural breakdowns that appear to have been disregarded in earlier research. Since empirical research has shown that structural breaks persist and impact a range of macroeconomic variables, including proxies for PPPI and CO2 emissions, failing to account for them might result in skewed and inconsistent conclusions. Our study employs the structural break unit root test created by Narayan and Popp (2010) to test for structural breakdowns in our dataset.
The remainder of the writing is organized as follows. The relevant literature on the connection between PPPI and environmental quality is reviewed in Section 2. The materials and methodological framework are covered in Section 3. The findings are shown in Section 4, and implications for policy are discussed in Section 5.
2 Literature review
The role that PPPI plays in stimulating infrastructural projects is well investigated in empirical literature in the global context. Different works have been steered to investigate the nexus between PPPI and technological innovation (Liu et al., 2020), PPPI and infrastructure (Lopes et al., 2021), PPPI and information technologies (Nguyen et al., 2020), PPPI and economic growth (Sergi et al., 2019), PPPI and institutional quality (Dao et al., 2020), PPPI and higher education (Borodiyenko et al., 2021), PPPI and foreign direct investment (Domalatov and Turginbayeva, 2022), PPPI and financial development (Morea and Balzarini, 2018), and PPPI and health sector (Kosycarz et al., 2019).
However, empirical studies linking PPPI to environmental quality are limited. For instance, using autoregressive distributed lag (ARDL), fully modified ordinary least squares (FMOLS), and dynamic ordinary least squares (DOLS) techniques, Adebayo et al. (2021a), who investigated the environmental effect of PPPI in East Asian and Pacific region over the period 1992–2015, found that PPPI deteriorates environmental quality. This empirical evidence is supported by Cheng et al. (2021), who used similar approaches, including the canonical cointegrating regression (CCR) technique in the case of China over the period 1991–2017. The authors suggested an improvement in the efficiency of PPPI projects linked to CO2 emissions to improve environmental quality. Similarly, an empirical study by Akinsola et al. (2022) found that PPPI contributes to intensifying environmental pollution in Brazil over the period 1983–2017 using the same technique. Moreover, Van Song et al. (2021) investigated the dynamic effect of PPPI on environmental quality in the United States utilizing the quantile autoregressive distributed lag (QARDL) framework over the period 1990–2015. The authors concluded that PPPI increases CO2 emissions while recommending an efficient promotion of PPPI projects that mitigate environmental quality as a way forward in the United States. Anwar et al. (2021)drew a similar conclusion; they used the QARDL model to study the asymmetric effect of PPPI on CO2 emissions in the transport sector in China. The authors concluded that PPPI significantly escalates the environment through various channels in China. Likewise, Caglar et al. (2022) used the CUP-FM and CUP-BC estimators for BRICS economies over the period 1990–2018 and concluded that PPPI worsens environmental performance. In Pakistan, using the autoregressive distributed lag (ARDL) framework, Chunling et al. (2021) explored the nexus between PPPI and environmental quality (proxied by ecological footprint) over the period 1992–2018. Their empirical findings reveal that PPPI significantly contributes to intensifying environmental degradation in Pakistan. In the cases of developing countries and India, Raza et al. (2021) and Kirikkaleli and Adebayo (2021) found that PPPI contributes to worsening environmental deterioration. Other works that found the pollution-augmenting role of PPPI include Shahbaz et al. (2020) and Khan Z. et al. (2020) for China, Ahmad and Raza (2020) for Brazil, and Waqih et al. (2019) for SAARC countries. However, some empirical studies have found PPPI to contribute to improving environmental quality. In this direction, using research and development to proxy public investment in energy (PI), Shahbaz et al. (2018), who investigated the environmental effect of PPPI, found that PPPI improves the environmental atmosphere by lowering CO2 emissions over the period 1955–2016 in France.
Table 1 shows a synopsis of studies on the relationship between PPPI and environmental quality to capture more comparisons against diverse countries and regions.
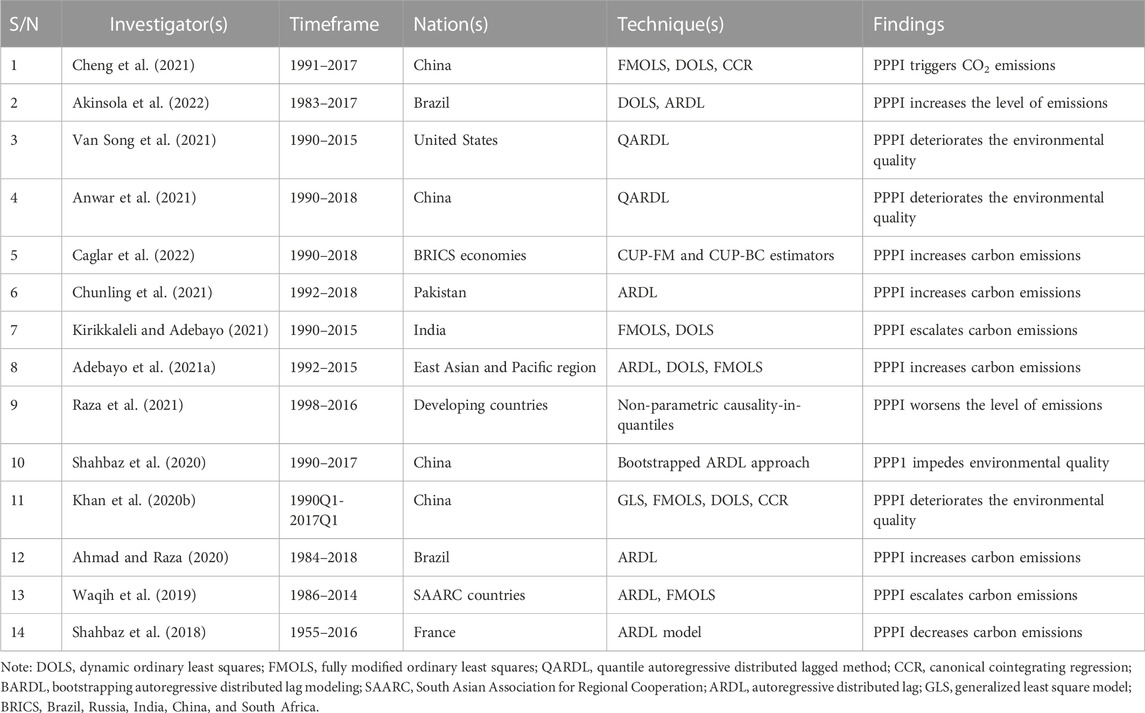
TABLE 1. Synopsis of studies.
3 Material and methods
This study attempts to empirically assess the dynamic association between PPPI and environmental quality for South Africa over the period 1960–2020 by using the novel dynamic ARDL simulations model. Before applying the novel dynamic ARDL simulations model, we begin by discussing the theoretical rationale/background of the study, followed by conducting a unit root test on the variables to investigate their order of integration. Toward this end, this work uses four conventional stationarity tests: Kwiatkowski–Phillips–Schmidt–Shin (KPSS), Augmented Dickey–Fuller (ADF), Phillips–Perron (PP), and Dickey–Fuller GLS (DF-GLS). The work controls for structural breaks using the approach proposed by Narayan and Popp (2010) because structural breaks are common, and failure to control them may lead to biased and inconsistent results. The long- and short-run coefficients of the variables are investigated using the novel dynamic ARDL simulations model. Lastly, this study uses the frequency domain causality (FDC) framework proposed by Breitung and Candelon (2006) to account for permanent causality for long, short, and medium terms among the variables considered in this study. The work also uses the FDC framework for robustness checks.
3.1 Theoretical background
In this section, the study’s theoretical foundation is laid forth as follows: first, the framework incorporates PPPI in accordance with the research of Shahbaz et al. (2020), Khan A. et al. (2020), and Anwar et al. (2021). An increase in PPPI will have a negative effect on the environment. Consequently, PPPI will enhance environmental quality, that is,
Second, moving on to the research’s theoretical foundation, it can be said that when the economy grows, carbon emissions rise because more energy is needed for economic activity, which results in more waste and pollution. However, the amount of pollution and the materials used in production depend on a country’s sectoral structure. Scale, composition, and technique effects (TE) are three separate outcomes of economic expansion that impact the environment. According to the scale effect (SE), economic growth first negatively affects the environment because it demands more energy and resources, which leads to more waste and pollution. The composition effect is a term used to describe the negative effects of economic development on the climate that can be mitigated by structural shifts in economies from the industrial sector to the service sector (Ahmad and Raza, 2020). Last but not least, the technique effect postulates that as an economy becomes prosperous, it adopts cutting-edge technology that boosts production and reduces emissions. Meanwhile, the EKC hypothesis employs an inverted U-shaped link to forecast a turning point between economic growth and environmental deterioration. Therefore, economic growth (as represented by the scale effect) is employed in the investigation. It shows that, initially, economic growth is accompanied by environmental deterioration. However, if a certain threshold is crossed, economic growth is consistent with ecological sustainability. Economic growth, cutting-edge technology, and a change in the economy toward services and light manufacturing will lead to the eventual resolution of environmental challenges. Environmental degradation increases initially because of early industrialization, which requires heavy use of fossil fuels, but deterioration reduces at a certain level of per capita income (a turning point). Education levels rise because of the economy’s transition from an industrial to a service-sector-focused focus, and environmental consciousness grows as a result. Consequently, economic growth has drawn considerable attention from academics for decades as a key indicator of a nation’s progress and development (Naqvi et al., 2021; Sun et al., 2021) because more energy usage and mineral richness (especially from conventional sources of energy) are required by quicker economic expansion, both of which are essential for a nation’s rate of development and long-lasting changes (Minlah and Zhang, 2021). However, such use has negative ecological effects, such as anthropogenic climate change and the ensuing environmental deterioration. The scale effect (economic expansion), as described by other research in energy and environmental economics (Isik et al., 2021; Liu et al., 2021), is considered in this analysis to follow the ecological impact of income. Economic expansion is anticipated to reduce CO2 emissions, which suggests that increased economic expansion will result in a decline in the quality of the environment,
Third, to determine if the EKC hypothesis is true in the case of South Africa, the square of economic growth (represented by the technique effect) is considered. The EKC hypothesis is valid if
Fourth, energy is the most significant input in production and is used as frequently as capital and labor. Continuous energy sources are necessary to sustain and improve the present level of productivity and living standards as energy use in industry is prevalent. In the industrial process, energy consumption is seen as a requirement for long-term economic growth, although any shortfall in energy output has a negative effect on economic growth. The ideal society understands that energy consumption contributes significantly to CO2 emissions, which are the main reason for GHG emissions. Many studies, including those by Udeagha and Ngepah (2019), have examined energy use to understand the impact of energy consumption. Energy consumption is considered to account for its contribution to growing emissions levels because the energy industry is responsible for 75% of global GHG emissions (Udeagha and Breitenbach, 2021), which suggests that increasing energy usage will result in a decline in environmental quality,
Fifth, the relationship between FDI inflow and environmental pollution in host countries is summarized as follows. The “Pollution Haven Hypothesis (PHH)” contends that developing countries are more likely to attract foreign direct investment (FDI) by lowering environmental standards during the early stages of economic growth to build their economies fast. The dirty industries—those with high levels of pollution and energy consumption—move from industrialized to developing countries because of utilizing this method to attract capital. It increases pollution in developing countries. The host country (area) becomes a “pollution refuge” for developed countries. The other view asserts that FDI contradicts the “PHH.” The advanced industrial and environmental technologies provided by FDI benefits local enterprises. Due to the learning, competitiveness, and demonstration effects, local firms reduce the level of environmental deterioration in their industry and even the entire region (Cheng et al., 2021). The positive and negative effects of FDI on the environment of the host nation may be distinguished based on scale, structure, and technical aspects (Chaudhry et al., 2022). Even if foreign direct investment is important for a country’s economic growth, it can harm the environment of the host country, especially when local resources are insufficient to cover domestic financial obligations (Shinwari et al., 2022). Since FDI encourages larger economic firms, which might exacerbate emissions and cause environmental degradation, the research uses FDI to analyze its ecological impact, as suggested by Anser et al. (2021). As a result, FDI influx under PHH causes environmental degradation, that is,
Sixth, the theoretical framework for the environmental effect of trade liberalization was developed by Copeland and Taylor (1994) and Grossman and Krueger (1995). Antweiler et al. (2001), who subsequently extended it, underlined the many factors affecting carbon emissions and the way trade openness may have an influence on the environment. Consequently, the study separates the content, method, and scale impacts of the environmental effects of trade openness. The structural makeup of a country’s industrial production determines the level of environmental degradation. Therefore, the environmental impact of this structural composition is shown by the composition effect. A country with a more carbon-intensive industrial structure will always have more environmental pollution than a country with a less carbon-intensive production structure. As a result, the nature of an economy and its organizational structure affect how well the environment is protected in that country. On the contrary, the scale effect refers to how an increase in income affects emissions. As affluence grows, environmental quality deteriorates because of intensive industry. Environmental restrictions force the private sector to use more advanced, eco-friendly, and clean industrial processes, which improve environmental quality and have an influence on the technique. The technique effect results in a higher quality of the environment because of peoples’ propensity for a clean environment and the execution of stronger environmental regulations as money grows. As proposed by Khan and Ozturk (2021) and Ahmad et al. (2022), trade openness is thus included to track the impact of trade openness on environmental quality in South Africa. Consequently, greater trade openness may either enhance environmental quality, that is,
Seventh, technological innovation is essential to lowering energy use, increasing energy efficiency, and improving the ecological environment (Ahmad and Wu, 2022; Fareed et al., 2022). In order to support sustainable companies and improve environmental sustainability, it is essential to use technology more frequently. As a result, in line with Ahmad and Wu (2022) and Fareed et al. (2022), this research examines the role of technological innovation as one of the major factors affecting environmental quality because it could transform renewable energy sources, such as solar and wind power, from inefficient to environmentally friendly sources. Therefore, it is anticipated that technological progress will enhance environmental quality, that is,
Lastly, the nation’s ecological and overall total emissions are crucial components of the country’s economic sensitivity to industrialization (Rehman et al., 2021). As industrialization advances, mineral wealth is dispersed extremely fast, which affects the ecology and the general standard of living for the expanding population. Therefore, industrial value-added is considered one of the key components in this study to examine its effect on ecological quality, as suggested by Tian et al. (2014) and Hossain (2011). Consequently, it is anticipated that industrial value-added will worsen environmental quality, that is,
3.2 Functional form
This study uses the robust empirical technique applied in previous works by utilizing the conventional EKC hypothesis methodology to investigate the PPPI–CO2 emission nexus for South Africa. The EKC hypothesis suggests that environmental deterioration escalates as economic growth increases, especially during the earlier developmental stage of a society. This is because society focuses more on achieving higher economic growth than realizing lower environmental decay, such that an increase in income brings about an increase in environmental deterioration. This idea intuitively and fundamentally explains the positive relationship between the scale effect (a proxy for economic growth) and environmental quality. However, the industrial stage of development leads to higher levels of environmental decay. As society industrializes to move away from the production activities earlier dominated by agriculture, environmental decay intensifies. Hence, people become more environmentally conscious, leading to the enforcement of higher environmental standards to improve environmental quality. Therefore, people’s predisposition for a clean environment and the implementation of more stringent environmental standards by the government enormously contributed to improving environmental quality during the advanced industrial stage of societal development. Consequently, as income (economic growth) increases, environmental deterioration reduces. This idea intuitively explains the negative nexus between the technique effect (square of economic growth) and the environmental quality.
Therefore, we present the standard EKC hypothesis following Udeagha and Ngepah (2021a, b), Udeagha and Breitenbach (2021), Udeagha and Ngepah (2019), and Cole and Elliott (2003) as follows:
where CO2 denotes CO2 emissions, a proxy for environmental quality; SE represents scale effect, which captures economic growth; and TE stands for technique effect capturing the square of economic growth. When log-linearized, Eq. 1 becomes as follows:
Scale effect (economic growth) contributes to escalating environmental deterioration as income rises. In contrast, the technique effect reduces environmental decay as more stringent environmental standards are implemented (Cole and Elliott, 2003; Ling et al., 2015). Therefore, the validity of the EKC hypothesis requires that
where
3.3. Measuring trade openness
This study uses the composite trade intensity (CTI) proposed by Squalli and Wilson (2011) to effectively address the shortcomings of trade intensity (TI) used previously. The CTI effectively accounts for two dimensions of trade openness: considering trade share in GDP and capturing the size of trade relative to world trade. Therefore, using the Squalli and Wilson measure of trade openness uniquely distinguishes our work from earlier works that measured and proxied trade openness using the traditional TI. Moreover, using this robust way to capture trade openness efficiently addresses the limitations of the conventional TI. Essentially, the novel CTI has more fundamental elements regarding the trade contribution share of a country in relation to the world economy (Squalli and Wilson, 2011). Moreover, this innovative proxy of trade openness mirrors trade outcome reality because it accounts for two dimensions of a country’s ties with the rest of the world. Following Squalli and Wilson (2011), we present the CTI as follows:
where i denotes South Africa, j reflects its trading partners, X represents exports, and M denotes imports. In Eq. 4, while the first segment captures the world trade share, the second portion accounts for South Africa’s trade share.
3.4 Variables and data sources
We use yearly time series data covering the period 1960–2020. In this work, the proxy for environmental quality is CO2 emissions, which is the dependent variable. To validate the existence of the EKC hypothesis, we use the scale effect capturing economic growth and the technique effect representing the square of economic growth. The variable of interest is public–private partnerships in energy (PPPI) measured in current USD. The control variables following empirical studies include industrial value-added to GDP (IGDP), trade openness (OPEN) using a composite trade intensity as illustrated previously, foreign direct investment (FDI), energy consumption (EC), and technological innovation (TECH) using gross domestic spending on R&D. Table 2 summarily presents the definition of variables and data sources.
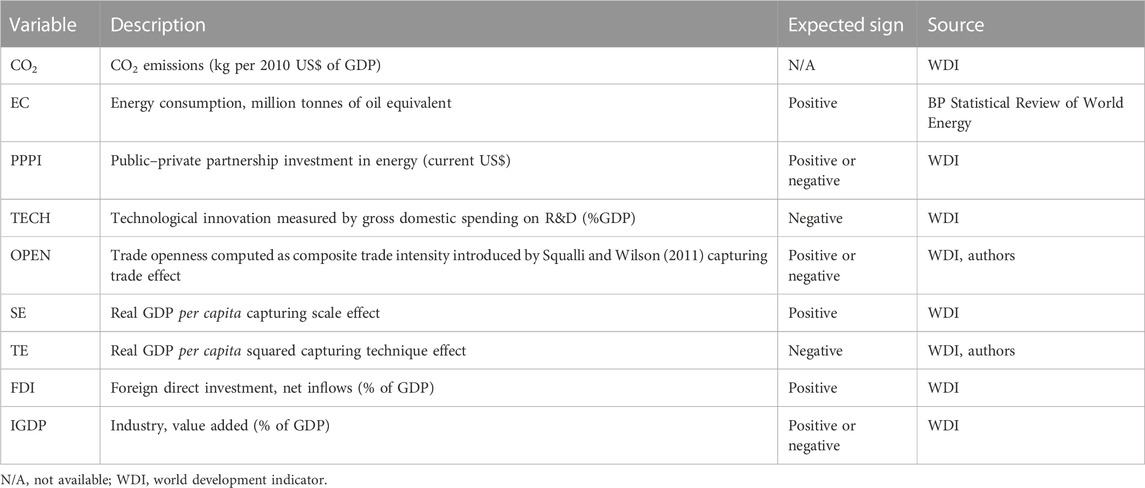
TABLE 2. Definition of variables and data sources.
3.5 Narayan and Popp’s structural break unit root test
As a first step, before applying the novel dynamic ARDL simulations model, we conduct a unit root test on the variables to investigate their order of integration. Toward this end, this work uses four conventional stationarity tests: Kwiatkowski–Phillips–Schmidt–Shin (KPSS), Augmented Dickey–Fuller (ADF), Phillips–Perron (PP), and Dickey–Fuller GLS (DF-GLS). The work controls for structural breaks by using the approach proposed by Narayan and Popp (2010) because structural breaks are common, and failure to control them may lead to biased and inconsistent results.
3.6 ARDL bounds testing approach
We use the bounds test to investigate the PPPI-environmental quality relationship for the long run while controlling for other variables. Following Pesaran et al. (2001), we present the ARDL bounds testing approach as follows:
where
Meanwhile, the value of the calculated F-statistic determines whether the null hypothesis can be accepted or rejected. The null hypothesis is rejected when the value of the calculated F-statistic is above the upper bound, and we conclude that the variables are cointegrated. On the contrary, when the value of the calculated F-statistic is below the lower bound, we accept the null hypothesis and conclude that the variables are not cointegrated. Moreover, the ARDL bounds test becomes inconclusive when the value of the calculated F-statistic lies between the lower and upper bounds. The estimable long-run ARDL model is presented as follows:
The long-run variance of the variables in Eq. 6 is denoted by
The short-run variability of the variables is captured by
3.7 Dynamic autoregressive distributed lag simulations
On the one hand, past studies of the PPPI–CO2 emission connection in the global setting frequently used the traditional ARDL technique developed by Pesaran et al. (2001), which produces long- and short-run estimates. Because of its statistical benefits, the fundamental ARDL technique is frequently used in studies on energy, the economy, and the environment. In the case of smaller sample sizes, the conventional ARDL framework is especially suited, robust, and effective (Pesaran et al., 2001). It has no autocorrelation problems, and selecting the appropriate delays successfully resolves the endogeneity problems (Langnel and Amegavi 2020). Whether the variables under analysis are stationary at level I (0) or at the first difference I (1), the ARDL technique can be applied. This method also gives the error correction model’s long-run and short-run cointegration parameters in a single equation. On the other hand, the novel dynamic ARDL simulation framework for time-series data has sparked much interest in the economics of energy and climate change. As this method successfully lessens the difficulties associated with analyzing the estimates derived using the conventional ARDL approach for measuring long- and short-run coefficients of the variables under study, the dynamic ARDL simulation approach has gained recognition as a reliable method for drawing useful conclusions from time-series models with illogical or “hidden” coefficients (Jordan and Philips, 2018). While considering other factors, the innovative, dynamic ARDL simulations approach accurately analyzes and duplicates and dynamically portrays the true positive and negative impulses in regressors and response variables. The dynamic ARDL simulations technique requires that the response variable be stationary at the initial difference. Additionally, no model independent variable may have an order of integration higher than I (1). Even if the research does not truly require the difficult I (0)/I (1) assessment, all explanatory variables should be evaluated for their explosiveness or seasonal stationarity (Jordan and Philips, 2018). Therefore, the new strategy used in this study yields reliable and accurate results. Since the parameter matrix has a multivariate normal distribution, 1,000 simulations are considered in this paper’s dynamic ARDL error-correcting method. Additionally, the plots are used in this study to evaluate the changes in the explanatory factors and their impact on the response variable. This clever approach has also been applied in a wide range of real-world research to examine both the short- and long-term relationships between the pertinent variables. For instance, Pata and Isik (2021) used this approach to study the effects of energy intensity, per capita income, resource rent, and human capital on the load capacity factor in China between 1981 and 2017, with a focus on environmental issues on the demand and supply sides. Using this method, Li and Ullah (2022) added the impact of human expansion and global economic cooperation to the framework to study the connection between income disparity and environmental integrity. Similarly, Ulucak (2021) used the state-of-the-art ARDL simulation technique to examine how technology may enhance environmental health in the United States and China. The novel dynamic ARDL simulations model is presented as follows:
3.8 Frequency domain causality test
The current study further adds to the extant literature on the relationship between PPPI and environmental quality by adopting the frequency domain causality (FDC) methodology, the most effective and efficient testing framework proposed by Breitung and Candelon (2006). Thus, using the FDC framework permits adequate accounting for permanent causality for the long, short, and medium terms between variables under consideration. In addition, this study uses the FDC methodology as a robustness check. To the best of our knowledge, earlier studies on the nexus between PPPI and environmental quality have ignored this robust testing framework, particularly for South Africa.
4 Empirical results and their discussion
4.1 Summary statistics
The summary statistics of the variables used in this work are analyzed and scrutinized before discussing the results. Table 3 reports the overview of statistics showing that the average value of CO2 emissions is 0.264. The technique effect (TE), the square of GDP per capita has an average mean of 60.316, greater than other variables, followed by foreign direct investment (FDI) with 13.203. In addition to characterizing the summary statistics, Table 3 uses kurtosis to represent the peak, whereas the Jarque–Bera test statistics is used to check for the normality of our data series. Table 3 shows that PPPI, scale effect, trade openness, energy consumption, foreign direct investment, industrial value-added, and technological innovation show a positive trend, whereas the technique effect has a negative trend. The variance in the technique effect (TE) is the highest of all the variables showing the high level of volatility in this variable. The variance in CO2 emissions is less relative to the technique effect showing that CO2 emissions are far more stable. Moreover, the variations in trade openness (OPEN), scale effect (SE), and technological innovation (TECH) are quite greater. In addition, the Jarque–Bera statistics shows that our data series are normally distributed.
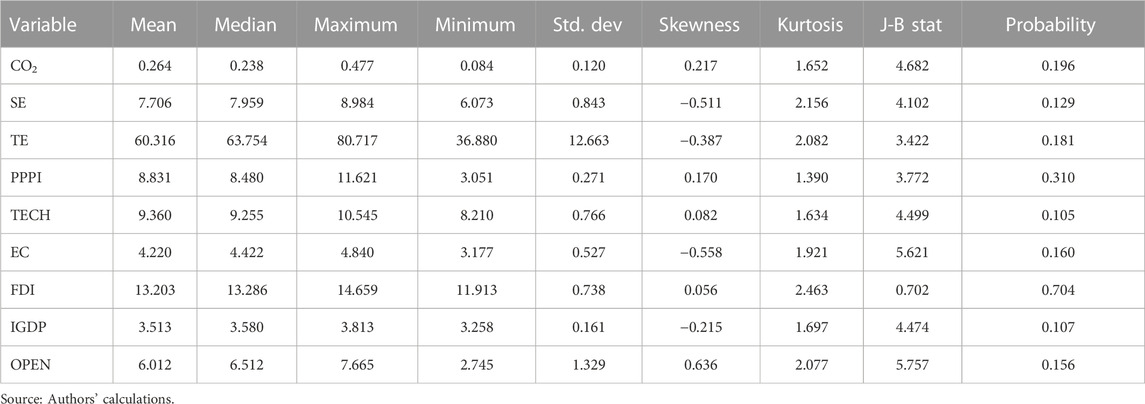
TABLE 3. Descriptive statistics.
4.2 Order of integration of the respective variables
Table 4 reports the results of DF-GLS, PP, ADF, and KPSS, showing that after first differencing, all variables, which are non-stationary in level, become stationary at I (1). This implies that all the series under review are either I (1) or I (0), and none is I (2). The traditional unit root tests reported earlier do not account for structural breaks. Therefore, this work implements a testing strategy capable of accounting for two structural breaks in the variables. The results of Narayan and Popp’s unit root test with two structural breaks are also reported in the right-hand panel of Table 4. The empirical evidence shows that the null hypothesis of the unit root cannot be rejected. Consequently, all data series are integrated of order one and prospective application for the dynamic ARDL bounds testing approach.

TABLE 4. Unit root analysis.
4.3 Lag length selection results
Table 5 reports the findings of different test criteria for lag selection. The use of HQ, AIC, and SIC is documented in empirical literature as the most popular for selecting appropriate lags. In this study, SIC is used for lag selection. Based on this tool, lag one is suitable for our model because the lowest value is obtained at lag one when SIC is used unlike others.

TABLE 5. Lag length criteria.
4.4 Cointegration test results
Table 6 displays the results of the cointegration test utilizing the surface-response regression suggested by Kripfganz and Schneider (2018). As the F- and t-statistics are greater than the upper bound critical values at various significance levels, we reject the null hypothesis. Thus, our empirical evidence suggests that cointegration exists among the variables under consideration.
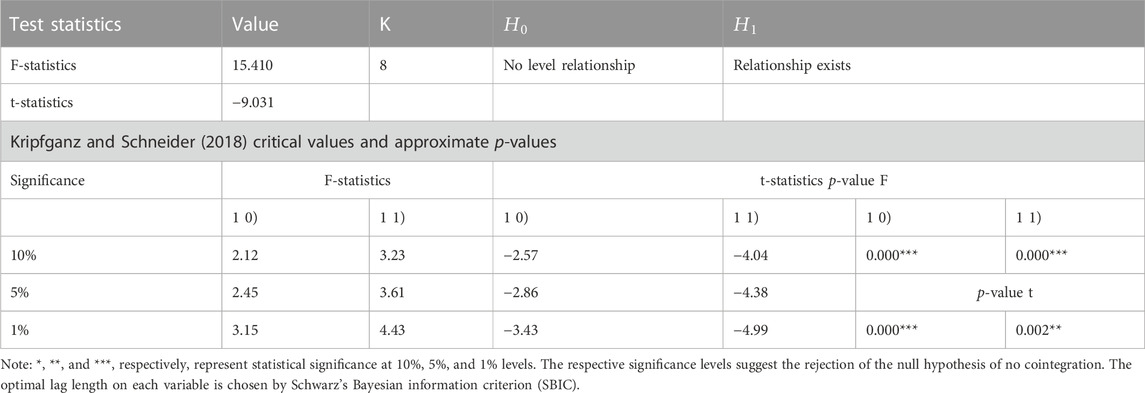
TABLE 6. ARDL bounds test analysis.
4.5 Diagnostic statistics tests
This study uses different diagnostic statistics tests to ensure that our chosen model is reliable and consistent, and their empirical results are reported in Table 7. The empirical results suggest that the used model is well-fitted, having passed all the diagnostic tests. The model does not suffer from the problems of serial correlation and autocorrelation, as confirmed by the Breusch Godfrey LM test. The Ramsey RESET test is used, and evidence shows that the model does not suffer from misspecification. The Breusch–Pagan–Godfrey test and ARCH test are employed to test if there is evidence of heteroscedasticity in the model. The empirical findings suggest that heteroscedasticity is moderate and not a problem. Finally, the Jarque–Bera test result shows that the model’s residuals are normally distributed.
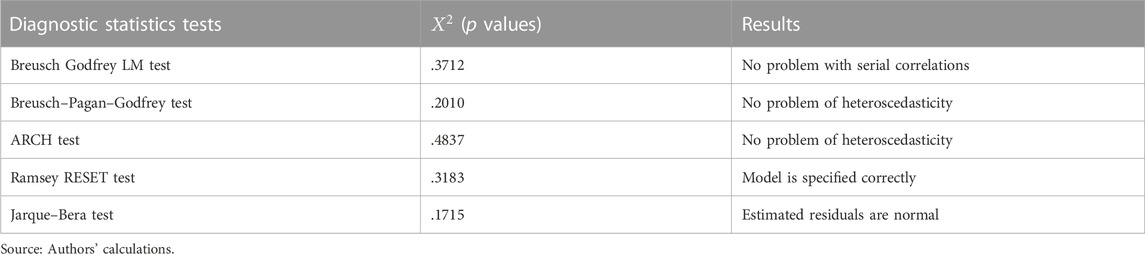
TABLE 7. Diagnostic statistics tests.
4.6 Dynamic ARDL simulations model results
The dynamic ARDL simulations model results are reported in Table 8. Our findings show that scale effect (InSE) and technique effect (InTE) positively and negatively affect CO2 emissions, respectively. The scale effect representing economic growth deteriorates environmental quality, whereas the technique effect has a mitigating effect on the environment. Therefore, empirical evidence suggests that the EKC hypothesis holds in the case of South Africa, where real income grows until a certain threshold level when CO2 emissions start to decline. In the initial stage of economic growth, environmental quality increases as income increases, but after reaching the optimum level, environmental quality starts improving in South Africa. This supports the inverted U-shaped relationship between economic growth and environmental quality. The findings are justifiable for South Africa and associated with structural change and technological advancement in the country. Environmental awareness increases among people as income grows, so environmental regulations are enforced to use energy-efficient technologies to mitigate the pollution. These findings support the findings of Awosusi et al. (2022c) who discovered that economic expansion accelerated environmental deterioration in Colombia between 1970 and 2017. Similar findings were made by Beton Kalmaz and Awosusi (2022), who looked at the factors influencing environmental sustainability and discovered that from 1965 to 2017, environmental quality in Malaysia declined as a result of economic expansion. Moreover, Xu et al. (2022) discovered that economic expansion decreased environmental quality during 1970–2017 when they investigated how the load capacity factor (a measure of environmental quality) was enhanced in Brazil. Additionally, the EKC hypothesis was found by Adebayo et al. (2021b), who investigated the relationship between natural gas, oil, and coal and environmental sustainability in Japan from 1965 to 2019. Our results corroborate those of He et al. (2022), who found that, in the Top 10 Energy Transition Economies between 1990 and 2018, economic growth exacerbated ecological damage. Similar conclusions were reached by Adebayo et al. (2021c), who investigated the relationship between coal energy consumption, economic growth, renewable energy consumption, and CO2 emissions between annual periods of 1980 and 2017 and found that environmental quality in South Africa decreased as a result of economic growth. Furthermore, Yuping et al. (2021), who examined the dynamic impacts of globalization, non-renewable energy consumption, renewable energy consumption, and economic growth on carbon dioxide emission levels in Argentina between 1970 and 2018, uncovered the EKC hypothesis. Likewise, Udeagha and Breitenbach (2021a) highlighted the existence of the EKC hypothesis for the Southern African Development Community (SADC) over the period 1960–2014. Alharthi et al. (2021) also found similar results that the EKC hypothesis exists for the Middle East and North Africa (MENA) countries. Likewise, Bibi and Jamil (2021), who examined the association between air pollution and economic growth, found support for the EKC hypothesis, which suggests an inverted U-shaped link between air pollution and economic growth in six different regions: Latin America and the Caribbean, East Asia and the Pacific, Europe and Central Asia, South Asia, the Middle East and North Africa, and sub-Saharan Africa. Udeagha and Ngepah (2019) also found that the EKC hypothesis exists for South Africa. Our results further reciprocate the findings of Isik et al. (2021) for 8 Organisation for Economic Co-operation and Development (OECD) countries, Liu et al. (2021) for China, Sun et al. (2021) for China, Naqvi et al. (2021) for 155 countries of four different income groups, and Murshed et al. (2021) for six South Asian economies. However, the findings contradict those of Minlah and Zhang (2021), who found that the Environmental Kuznets Curve for carbon dioxide emissions in Ghana is upward sloping, contrary to the standard Environmental Kuznets Curve theory, which postulates an inverted U-shaped relationship between economic growth and environmental degradation. Ozturk (2015), Sohag et al. (2019), and Mensah et al. (2018) also found similar results, showing that the EKC hypothesis does not hold.
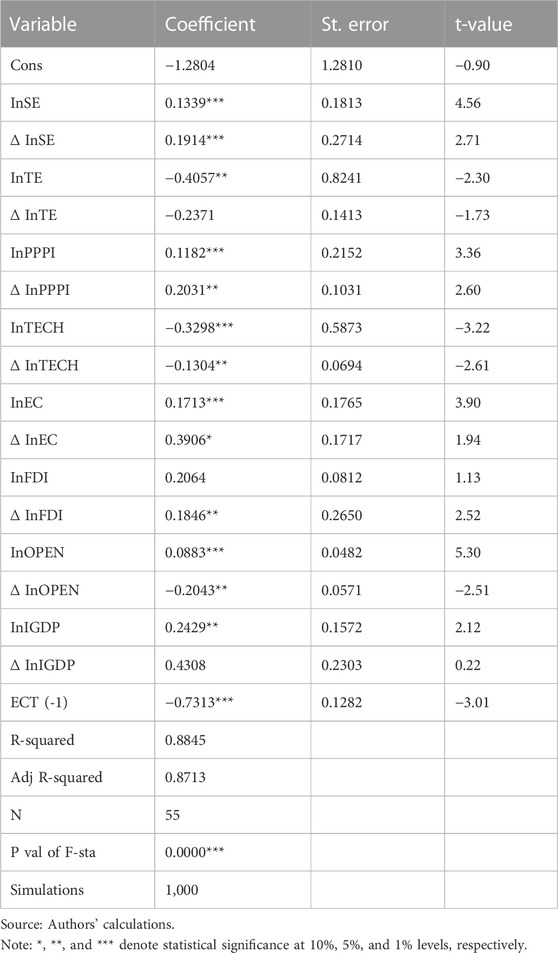
TABLE 8. Dynamic ARDL simulations analysis.
The estimated long- and short-run coefficients on public–private partnership investment in energy (InPPPI) are statistically significant and positive. PPPI is positively associated with CO2 emissions in the short and long run. This implies that, on average, a 0.118% upsurge in CO2 emissions is caused by a 1% increase in PPPI in the long run if other parameters remain constant. Moreover, in the short run, a 0.203% upsurge in CO2 emissions is caused by a 1% increase in PPPI. The reason behind this positive interconnection is that PPPI is strongly connected to non-renewable energy sources that raise carbon emissions. This finding aligns with Adebayo et al. (2021a), who investigated the environmental effect of PPPI in East Asian and Pacific regions and found that PPPI deteriorates environmental quality. This empirical evidence is supported by Cheng et al. (2021) in the case of China. Similarly, an empirical study by Akinsola et al. (2022) found that PPPI contributes to intensifying environmental pollution in Brazil. Moreover, Van Song et al. (2021) investigated the dynamic effect of PPPI on environmental quality for the United States and concluded that PPPI increases CO2 emissions. A similar conclusion was drawn by Anwar et al. (2021) that PPPI significantly escalates the environment through various channels in China. Likewise, the study by Caglar et al. (2022) concluded that PPPI worsens environmental performance. In Pakistan, Chunling et al. (2021) explored the nexus between PPPI and environmental quality (proxied by ecological footprint) and found that PPPI significantly contributes to intensifying environmental degradation. In the case of developing countries and India, Raza et al. (2021) and Kirikkaleli and Adebayo (2021) found that PPPI contributes to worsening environmental deterioration. Other works that found the pollution-augmenting role of PPPI include Shahbaz et al. (2020) for China, Khan et al. (2020) for China, Ahmad and Raza (2020) for Brazil, and Waqih et al. (2019) for SAARC countries. However, the outcome does not correspond with the study by Shahbaz et al. (2018), who found that PPPI improves the environmental atmosphere by lowering CO2 emissions over the period 1955–2016 in France.
The estimated coefficient on technological innovation (InTECH) is statistically significant and negative in the long and short run. Our empirical finding shows that a 1% increase in technological innovation brings about a reduction in CO2 emissions by 0.32% and 0.13% in the long run and short run, respectively. Technological innovations in South Africa effectively reduce CO2 emissions, which could be seen as eco-friendly technological innovation supporting efficient energy utilization and facilitating renewable energy sources at cheaper costs, thus, leading to minimum carbon emissions in South Africa. Technological innovations improve South Africa’s environmental quality through the following ways: i) setting up of end-of-pipe technology crucial for the reduction of carbon emissions, ii) use of production technologies that are more energy efficient, and ii) changes in the fuel mix. Innovations in technology through these channels lead to an increase in energy efficiency, which substantially improves environmental quality in the country. Meanwhile, South Africa’s enormous investments in R&D and changes in technology are among the reasons why innovations in technology have immensely contributed to improving the country’s environmental quality. Moreover, as part of the major key to mitigating the growing levels of carbon emissions, South Africa has implemented several policies aimed at developing robust technologies, which are crucial to minimizing the intensity of emissions from production processes and other economic activities connected to high levels of emissions. Sohag et al. (2015) illustrated that technological innovation creates an avenue that permits a reduction in energy consumption, facilitates energy efficiency, and substantially reduces carbon emissions. Our findings align with those of Ojekemi et al. (2022), who showed how technological innovation helped the BRICS economies cut consumption-based carbon emissions (CCO2) between 1990 and 2018. Equally, Awosusi et al. (2022b), who examined how technological innovation contributes to environmental sustainability in South Africa, discovered that technological innovation had improved environmental quality between 1982 and 2017. Similar findings were reached by Ibrahim and Vo (2021), who showed that, in the case of large developing market nations, technical innovation helps enhance environmental quality. Likewise, Destek and Manga (2021) found that technological innovation reduces carbon emissions over the period 1995–2016 for Big Emerging Market (BEM) countries. Similar results were obtained by An et al. (2021) for belt and road host countries, Guo et al. (2021) for Asian countries, Baloch et al. (2021) for OECD countries, Shan et al. (2021) for Turkey, Yang et al. (2021) for BRICS economies, Anser et al. (2021) for EU countries, Erdogan (2021) for BRICS economies, Töbelmann and Wendler (2020) for EU countries, Rafique et al. (2020) for BRICS economies, Ibrahiem (2020) for African countries, Ahmad and Raza (2020) for America, Zameer et al. (2020) for Asian countries, Godil et al. (2020) for Pakistan, Khan A. et al. (2020) for BRICS economies, Ngepah and Udeagha (2019) for Sub-Saharan African countries, and Altinoz et al. (2021) for big emerging market countries. However, the findings contradict Usman and Hammar (2021), who revealed that technological innovation increases carbon emissions over the period 1990–2017 in the case of Asia Pacific Economic Cooperation. Similar results were found by Dauda et al. (2021) for African countries, Arshad et al. (2020) for South and Southeast Asian region, Khattak et al. (2020) for BRICS economies, Demir et al. (2020) for Turkey, Villanthenkodath and Mahalik (2020) for India, and Faisal et al. (2020) for big emerging market countries.
For energy consumption (InEC), the estimated coefficients in the short and long run are statistically significant and positive, suggesting that energy consumption considerably contributes to increasing CO2 emissions in South Africa. Coal consumption as a major source of energy use in South Africa, although it is crucial to support production and enhance economic development, is a major contributor to the deterioration of environmental quality as South Africa is the seventh biggest country that heavily consumes coal to meet energy demand (World Bank 2021). It is observable that a 1% increase in energy consumption raises CO2 emissions by 0.274% in the long run. South Africa heavily depends on the energy sector, where coal consumption is dominant in production activity. Almost 77% of the primary energy supply and 93% of electricity production are from coal reserves in South Africa (Udeagha and Breitenbach, 2021). Due to the continuous rise in energy demand in South Africa, CO2 emissions have significantly increased over the years, which have severe implications for the environment and are a significant contributor to global climate change. Our empirical evidence is supported by Adebayo et al. (2021a), who found that energy consumption triggers CO2 emissions in South Korea. Similarly, Aslan et al. (2021) found that energy consumption deteriorates environmental quality in 17 Mediterranean countries. Doğanlar et al. (2021) reported that energy consumption escalates CO2 emissions in Turkey. Likewise, Hongxing et al. (2021) concluded that energy consumption increases carbon emissions for 81 Belt and Road Initiative (BRI) economies. Furthermore, Hu et al. (2021) found that aggregate energy consumption increases carbon emissions in Guangdong, China. Our results are contrary to those found by Ponce and Khan (2021), Khan et al. (2021c), Hao et al. (2021), Irfan (2021), and Baye et al. (2021), who observed that energy consumption improves environmental quality.
The short-run estimated coefficient on foreign direct investment (InFDI) is statistically significant and positive. However, the estimated value for the long run, although positive, is insignificant. Therefore, our results suggest that an upsurge in FDI leads to worsening environmental decay in South Africa. The results support evidence of the “pollution have hypothesis” for South Africa. As South Africa has a comparative advantage in the export and production of dirty products, this has massively attracted FDI inflows, which considerably contribute to worsening the country’s environmental condition. The detrimental effect of FDI on South Africa’s environment suggests that FDI inflows enable the country to become one of the “havens” for the highly intensive-pollution industries of the world. Our results are consistent with the findings of Copeland and Taylor (2013), who argued that the highly polluting industries which produce dirty goods have migrated to less developed nations, thereby transferring the pollution problems of the developed nations to these poor countries, and this immensely contributes to worsening their existing environmental decay. Moreover, owing to ineffective environmental standards and corrupt institutions, South Africa has become dirtier as the country specializes in the production of dirty goods that significantly escalate the growing levels of environmental dilapidation. FDI inflows have indeed facilitated the transformation of South Africa into a highly polluted factory of the world, which exports much of what it produces back to the global markets. This empirical evidence reflects the true nature of the South African economy, which is known to be among the fast-emerging economies in Africa. Thus, the policymakers and the stakeholders need to do more to ensure that foreign investors adopt updated, greener, and cleaner technologies to shift from non-renewable energy sources to renewable or less carbon-intensive ones to ensure proficiency in the production processes. Meanwhile, the substitution of non-renewable energy types with alternative sources, such as solar power, will considerably reduce CO2 emissions in South Africa. This will ultimately promote lasting value for reductions of GHG emissions and constantly support the establishment of new technologies, which improve South Africa’s environmental condition and safeguard the global environment. Our results reciprocate the findings of Abdouli and Hammami (2017), who drew a similar conclusion in the case of MENA countries that FDI has contributed enormously to increase CO2 emissions, and there is evidence of the pollution haven hypothesis. These empirical findings are further supported by Udeagha and Ngepah (2021, 2020), Muhammad et al. (2021), Khan et al. (2020), Shahbaz et al. (2018), Paramati et al. (2016), Lee (2013), Ming Qing and Jia (2011), Haisheng et al. (2005), Tamazian and Rao (2010), Shahbaz et al. (2014), Ren et al. (2014), Seker et al. (2015), Naz et al. (2019), Gorus and Aslan (2019), and Hanif et al. (2019). However, the findings contradict Joshua et al. (2020) and Omri et al. (2014).
The estimated coefficient on trade openness (InOPEN) for the long run is statistically significant and positive, suggesting that an upsurge in trade openness by 1% increases CO2 emissions by 0.08%. This outcome is consistent with Baek et al. (2009), who suggested that trade openness significantly contributes to worsening the environmental conditions in developing countries. Our empirical evidence suggests that openness to the international goods market is not environmentally friendly in South Africa, especially in the long run. This is unlike the short-run results, which show that trade openness can contribute immensely to improving the country’s environmental quality. Meanwhile, the detrimental effect of openness on the environmental quality of South Africa in the long run undeniably reiterates the concern against further trade liberalization in the country. The type of products forming the bulk of country’s exports is part of the possible reason that could explain why trade openness impedes the environment. For instance, because the country has a comparative advantage in the export and production of natural resource-intensive goods such as forest products, antimony, tin, copper, manganese minerals, phosphates, vanadium, rare earth elements, natural gas, nickel, iron ore, nickel, coal, chromium, diamond, platinum, and gold, a rise in demand of these products will certainly lead to worsening South Africa’s environmental condition. Harvesting these products continuously to meet the growing international markets significantly deteriorates South Africa’s environmental quality. Moreover, our findings could be explained by the theoretical framework of Lopez (1994) that energy-based activities that consume a high amount of energy, mainly driven by trade liberalization, such as transportation and manufacturing, produce pollution. Additionally, our results are consistent with the pollution haven hypothesis by Taylor (2004) that developing countries, such as South Africa, have a comparative advantage in pollution-intensive production while developed ones have a comparative advantage in producing clean products (Wagner, 2010). Therefore, developed countries tend to transfer pollution to developing countries via international trade (Cole, 2004; Wagner, 2010). Our empirical evidence is also supported by and aligned with the results of Khan and Ozturk (2021), suggesting that developing countries tend to release a high number of pollutants due to relying on dirty industries. Our findings are in line with those of Awosusi AA. et al. (2022), who discovered that trade openness had an adverse influence on Uruguay’s environment between 1980 and 2018. Similar conclusions were reached by Khan et al. (2021), who suggested that trade openness is injurious and has extensively contributed to worsening the environmental condition in Pakistan. This empirical evidence is further corroborated by Ibrahim and Ajide (2021a), who found that trade openness contributes to increasing CO2 emissions in G-7. Similar results were observed by Van Tran (2020), who showed that trade openness worsens the environmental condition in 66 developing economies. The negative view of the environmental impacts of trade openness is in line with the conclusions reached by Aydin and Turan (2020) and Ali et al. (2020), who found that trade has a harmful effect on environmental quality through releasing carbon dioxide emissions. Similar results were found by Ngepah and Udeagha (2019) for the African region and Ngepah and Udeagha (2018) for sub-Saharan Africa. However, our findings contradict Ibrahim and Ajide (2021b), Ibrahim and Ajide (2021c), and Ding et al. (2021), who found that higher trade openness contributes to improving environmental quality in G-20 countries, 48 sub-Saharan African countries, and G-7 economies, respectively. Similar results were obtained by Udeagha and Breitenbach (2021) for SADC countries.
The long-run estimated coefficient on the industrial value-added share of GDP (InIGDP) is statistically significant and positive, showing that industrial sector growth significantly contributes to the deterioration of South Africa’s environmental quality in the long run. The growing industrial sector in South Africa is primarily responsible for an upward trend of CO2 emissions. Over the years, South Africa has adopted several policies to pursue structural transformation and industrialization to reduce poverty and ensure inclusive growth. Structural transformation of the economy from low-productivity agriculture to high-productivity industrialization is seen as a requisite for sustainable economic growth, job creation, and poverty reduction. However, the growing industrial sector in South Africa has brought about an upward trend of CO2 emissions. The large-scale industrialization and associated environmental alteration and its impact on biodiversity threaten human existence through basic necessities, recreation, and ecological functions. It is evident that pollution from various sources, particularly from industries, has a negative impact on the environment, is irreversible in nature, and causes the extinction of species resulting in the loss of unique genetic resources of great use. Our findings are consistent with those of Al Mamun et al. (2014) and Sohag et al. (2017), who observed that the thriving industrial sectors are primarily responsible for an upward trend of CO2 emissions. Moreover, Tian et al. (2014) stated that heavy manufacturing is the source of CO2 emissions at the domestic level. Our results are further supported by Cherniwchan (2012), Hossain (2011), Poumanyvong and Kaneko (2010), Nejat et al. (2015), Asane-Otoo (2015), Al-Mulali and Ozturk (2015), Lin et al. (2009), Garcia and Von Sperling (2010), Shahbaz and Lean (2012), and Li and Xia (2013). However, the findings contradict Lin et al. (2015), who suggested no evidence that industrial sector growth increases carbon emissions in Nigeria. Similar studies (Shahbaz et al., 2014; Shafiei and Salim, 2014; Zhou et al., 2013; Xu and Lin, 2015; Zhang and Lin, 2012; Dhami et al., 2013; Ahuti, 2015; Kavzo lu, 2008; Lin et al., 2017; Wang et al., 2014; Shahbaz et al., 2015; Ewing and Rong, 2008) found evidence that industrial sector growth reduces CO2 emissions.
The error correction term (ECT) captures the speed of adjustment. Its estimated value is statistically significant and negative, confirming that a steady long-run relationship exists among the variables under review. The ECT estimated value of −0.731 suggests that, in the long run, 73% of disequilibrium is corrected. The R-squared value shows that 88% of variations in CO2 emissions are brought about by the explanatory variables used in this work. The estimated p-value of F-statistics suggests that the model is a good fit.
While keeping other explanatory variables constant, the dynamic ARDL simulations automatically plot the forecasts of actual regressor change and its impact on the dependent variable. The effect of explanatory variables, that is, scale effect, technique effect, PPPI, technological innovation, trade openness, energy consumption, foreign direct investment, and industrial value-added on CO2 emissions, is forecasted to increase and decrease by 10% in South Africa.
Figure 1 shows the impulse response plot of the relationship between the scale effect (economic growth) and CO2 emissions. The plot captures the transition of scale effect and its impact on CO2 emissions. A 10% increase in scale effect denotes a positive effect of economic growth on CO2 emissions in the short and long run. However, a 10% decrease in scale effect implies a negative influence of economic growth on CO2 emissions, but the impact of a 10% increase is higher than a 10% decrease in scale effect. This implies that an increase in scale effect (economic growth) contributes to the deterioration of the environmental quality, whereas a decrease in scale effect improves the environmental condition in both the short and long run in South Africa.
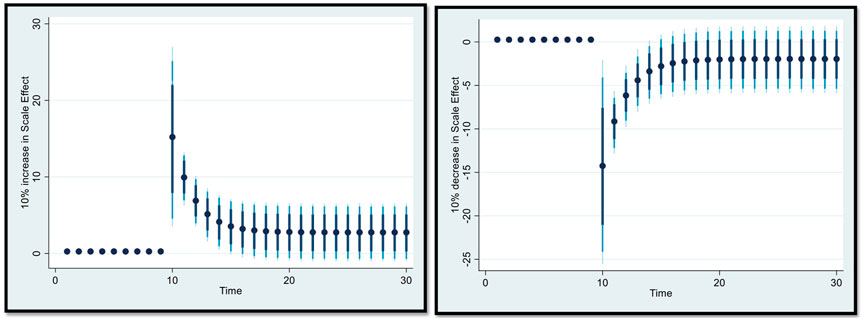
FIGURE 1. Impulse response plot for scale effect (economic growth) and CO2 emissions. An increase and a decrease of 10% in scale effect and its effect on CO2 emissions, where dots denote the average prediction value. The dark blue to light blue lines show 75%, 90%, and 95% confidence intervals, respectively.
Figure 2 illustrates the impulse response plot of the technique effect and CO2 emissions in South Africa. The technique effect graph demonstrates that a 10% increase is closely associated with a negative influence on CO2 emissions in the long and short run. However, a 10% decrease has a positive effect on CO2 emissions in the long and short run. This suggests that an increase in the technique effect (square of economic growth) improves the environmental quality, but a decrease in the technique effect deteriorates the environmental condition in both the short and long run in South Africa.
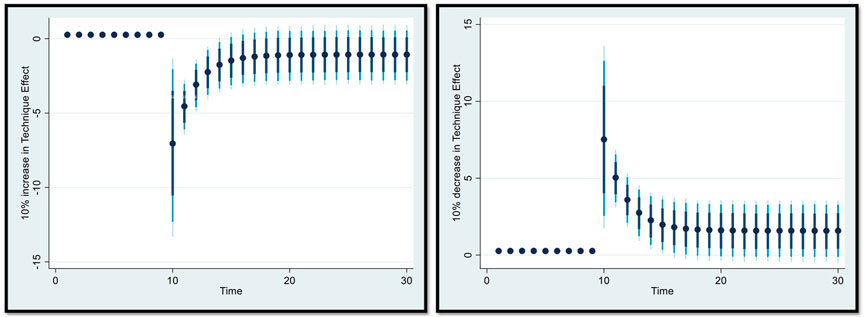
FIGURE 2. Impulse response plot for technique effect and CO2 emissions. An increase and a decrease of 10% in technique effect and its effect on CO2 emissions, where dots denote the average prediction value. The dark blue to light blue lines show 75%, 90%, and 95% confidence intervals, respectively.
Figure 3 shows the impulse response plot between public–private partnership investment in energy and CO2 emissions in South Africa. The graph reveals that a 10% increase in public–private partnership investment in energy has a positive influence on CO2 emissions in the long and short run. However, a 10% decrease in public–private partnership investment in energy brings about a negative effect on CO2 emissions in the long and short run. This suggests that an increase in public–private partnership investment in energy deteriorates South Africa’s environmental quality, whereas a decrease in public–private partnership investment in energy improves South Africa’s environmental condition in both the short and long run.
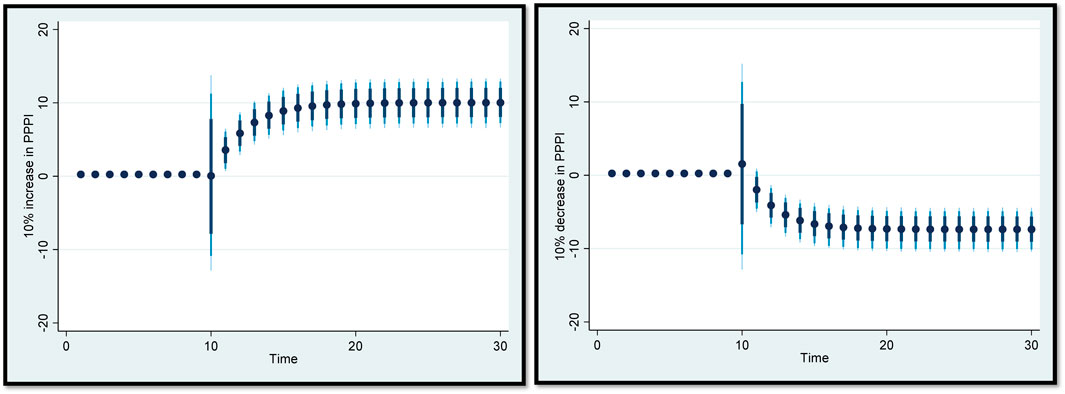
FIGURE 3. Impulse response plot for public–private partnership investment (PPPI) in energy and CO2 emissions. An increase and a decrease of 10% in PPPI and its effect on CO2 emissions, where dots denote the average prediction value. The dark blue to light blue lines show 75%, 90%, and 95% confidence intervals, respectively.
Figure 4 shows the impulse response plot of the relationship between energy consumption and CO2 emissions. The plot capturing the energy consumption impact on CO2 emissions shows that a 10% increase in energy consumption has a positive impact on CO2 emissions in the short and long run; however, a 10% decrease in energy consumption has a negative influence on CO2 emissions. This implies that an increase in energy consumption contributes to the deterioration of the environmental quality, whereas a decrease in energy consumption improves the environmental condition in the short and long run in South Africa.
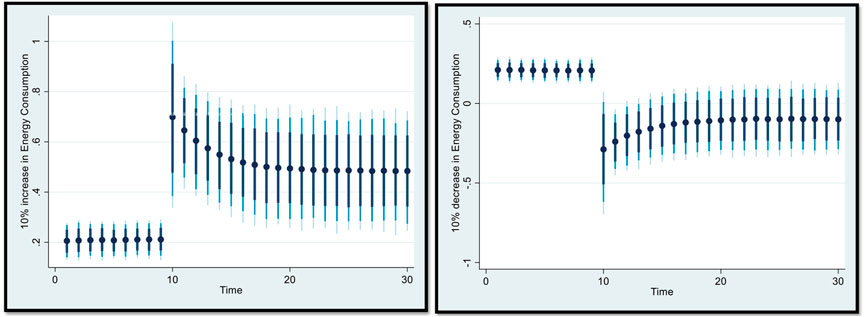
FIGURE 4. Impulse response plot for energy consumption and CO2 emissions. An increase and a decrease of 10% in energy consumption and its effect on CO2 emissions, where dots denote the average prediction value. The dark blue to light blue lines show 75%, 90%, and 95% confidence intervals, respectively.
Figure 5 illustrates the impulse response plot of foreign direct investment and CO2 emissions in South Africa. The foreign direct investment graph demonstrates that a 10% increase in foreign direct investment is closely associated with a positive influence on CO2 emissions in the long and short run. However, a 10% decrease has a negative effect on CO2 emissions in the long and short run. This suggests that an increase in foreign direct investment deteriorates the environmental quality in the short and long run in South Africa.
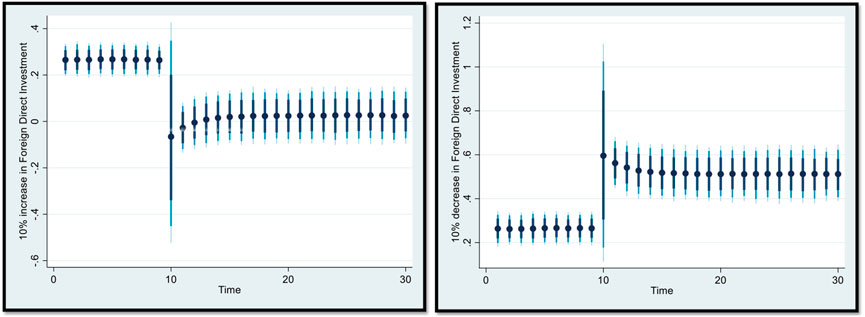
FIGURE 5. Impulse response plot for foreign direct investment and CO2 emissions. An increase and a decrease of 10% in foreign direct investment and its effect on CO2 emissions, where dots denote the average prediction value. The dark blue to light blue lines show 75%, 90%, and 95% confidence intervals, respectively.
Figure 6 presents the impulse response plot of the relationship between industrial value-added and CO2 emissions. The plot shows that a 10% increase in industrial value-added has a positive impact on CO2 emissions in the short and long run. However, a 10% decrease in industrial value-added has a negative influence on CO2 emissions. This suggests that an increase in industrial value-added contributes to the deterioration of the environmental quality, whereas a decrease in industrial value-added improves the environmental condition in both the short and long run in South Africa.
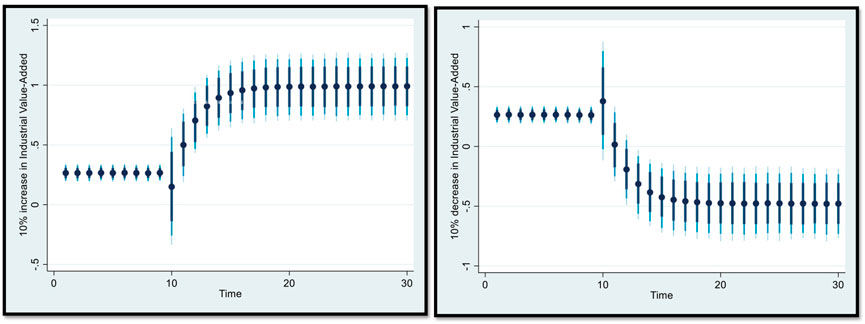
FIGURE 6. Impulse response plot for industrial value-added and CO2 emissions. An increase and a decrease of 10% in industrial value-added and its effect on CO2 emissions, where dots denote the average prediction value. The dark blue to light blue lines show 75%, 90%, and 95% confidence intervals, respectively.
Figure 7 displays the impulse response plot connecting the relationship between trade openness and CO2 emissions. The plot shows that a 10% increase in trade openness positively influences CO2 emissions in the long run, but it negatively affects it in the short run. In contrast, a 10% decrease in trade openness has a negative influence on CO2 emissions in the long run but a positive effect in the short run. This suggests that an increase in trade openness improves South Africa’s environmental quality in the short run but deteriorates it in the long run. However, a decrease in trade openness has a beneficial impact on South Africa’s environment in the long but deteriorates it in the short run.
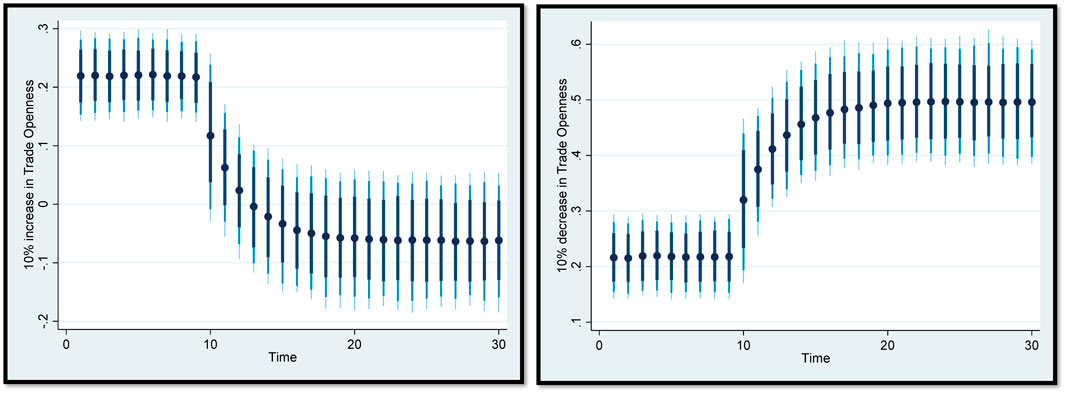
FIGURE 7. Impulse response plot for trade openness and CO2 emissions. An increase and a decrease of 10% in trade openness and its effect on CO2 emissions, where dots denote the average prediction value. The dark blue to light blue lines show 75%, 90%, and 95% confidence intervals, respectively.
In Figure 8, the impulse response plot between technological innovation and CO2 emissions in South Africa is presented. The graph reveals that a 10% increase in technological innovation has a negative influence on CO2 emissions in the long and short run. However, a 10% decrease in technological innovation has a positive effect on CO2 emissions in the long and short run. This suggests that an increase in technological innovation improves South Africa’s environmental quality, whereas a decrease in technological innovation deteriorates the environmental condition in the short and long run in South Africa.
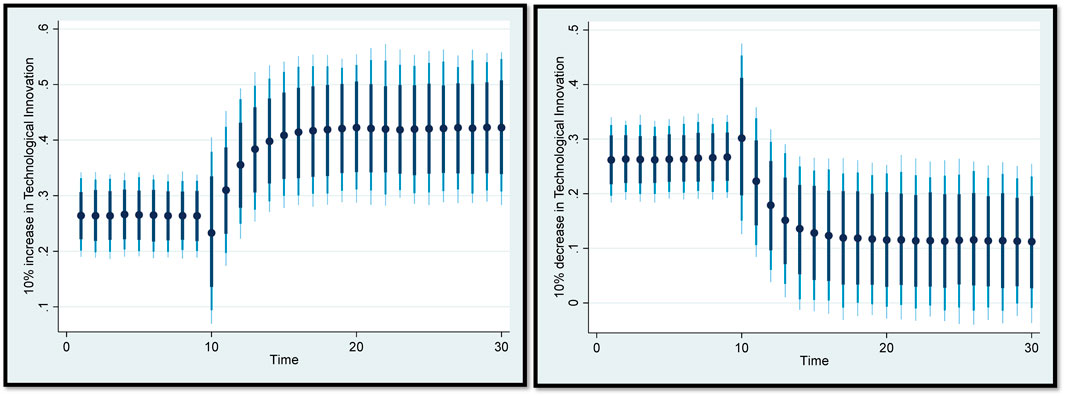
FIGURE 8. Impulse response plot for technological innovation and CO2 emissions. An increase and a decrease of 10% in technological innovation and its effect on CO2 emissions, where dots denote the average prediction value. The dark blue to light blue lines show 75%, 90%, and 95% confidence intervals, respectively.
This work also uses the frequency domain causality test proposed by Breitung and Candelon (2006) to explore the causality between InSE, InTE, InPPPI, InTECH, InEC, InFDI, InOPEN, InIGDP, and InCO2 in South Africa. Table 9 shows that InSE, InTE, InPPPI, InTECH, InEC, InFDI, InOPEN, and InIGDP Granger-cause InCO2 in the short, medium, and long run for frequencies
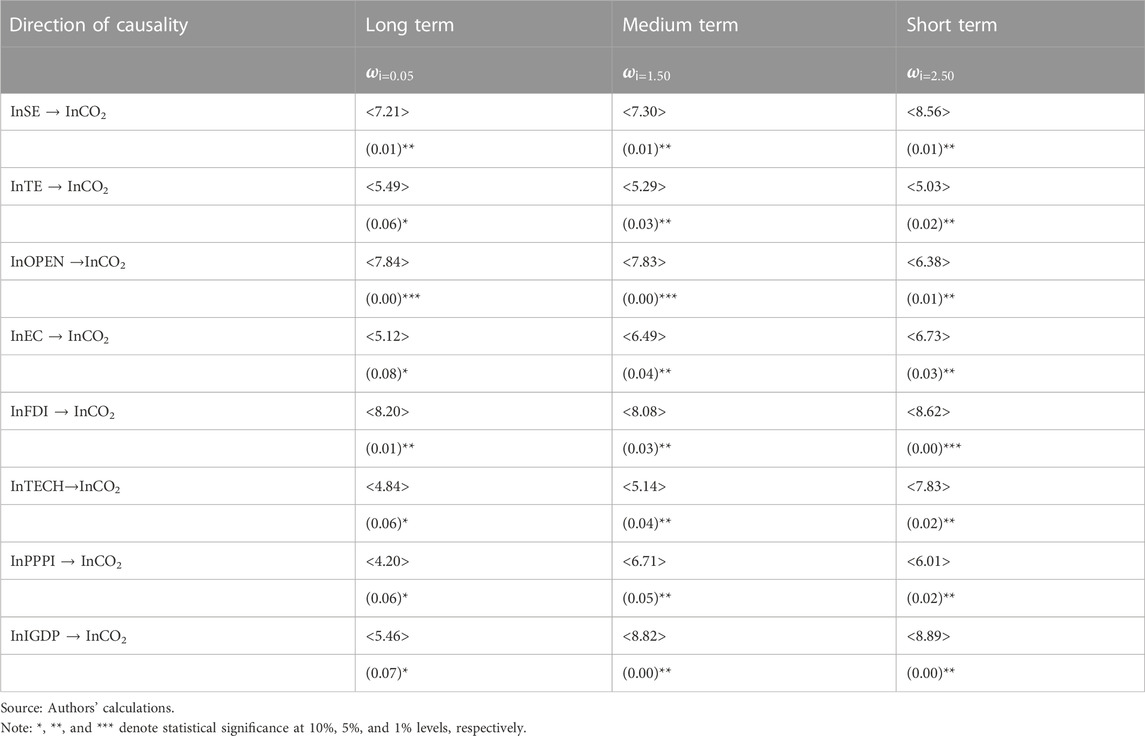
TABLE 9. Frequency-domain causality test.
This study further applies the tests for structural stability evaluation of the model to check for robustness. To this end, the cumulative sum of recursive residuals (CUSUM) and the cumulative sum of squares of recursive residuals (CUSUMSQ) proposed by Pesaran and Pesaran (1997) are used. Figure 9 and Figure 10 (see Appendix) present visual representations of CUSUM and CUSUMSQ. Conventionally, there is stability of model parameters over time if plots are within a critical bound level of 5%. Therefore, based on the model trend shown in Figures 9 and 10, as CUSUM and CUSUMSQ are within the boundaries at a 5% level, we can conclude that the model parameters are stable over time.
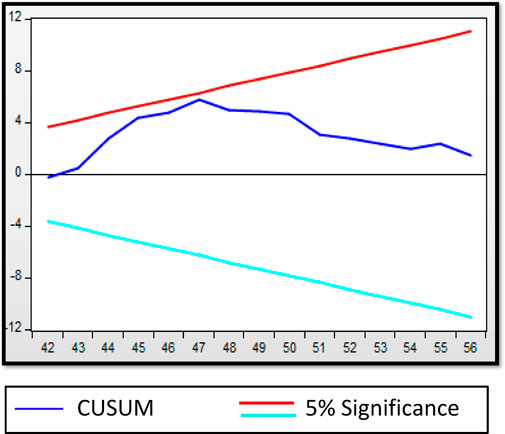
FIGURE 9. Plot of cumulative sum of recursive residuals (CUSUM).

FIGURE 10. Plot of cumulative sum of squares of recursive residuals (CUSUMSQ).
4.7 Robustness check
This study examines the impact of structural breaks in the dataset to perform robustness tests on the estimated parameters. The cointegration results (see Table 10 in the Appendix) indicate that the data contain structural breaks, which the research considers while estimating the model. A dummy variable (D1993) is created for the structural break year of 1993 to account for the possibility of such breaks occurring in the variables. Table 11 (see Appendix) shows that the existence of a structural break is not statistically significant. Therefore, the model is unaffected by the structural breaks.
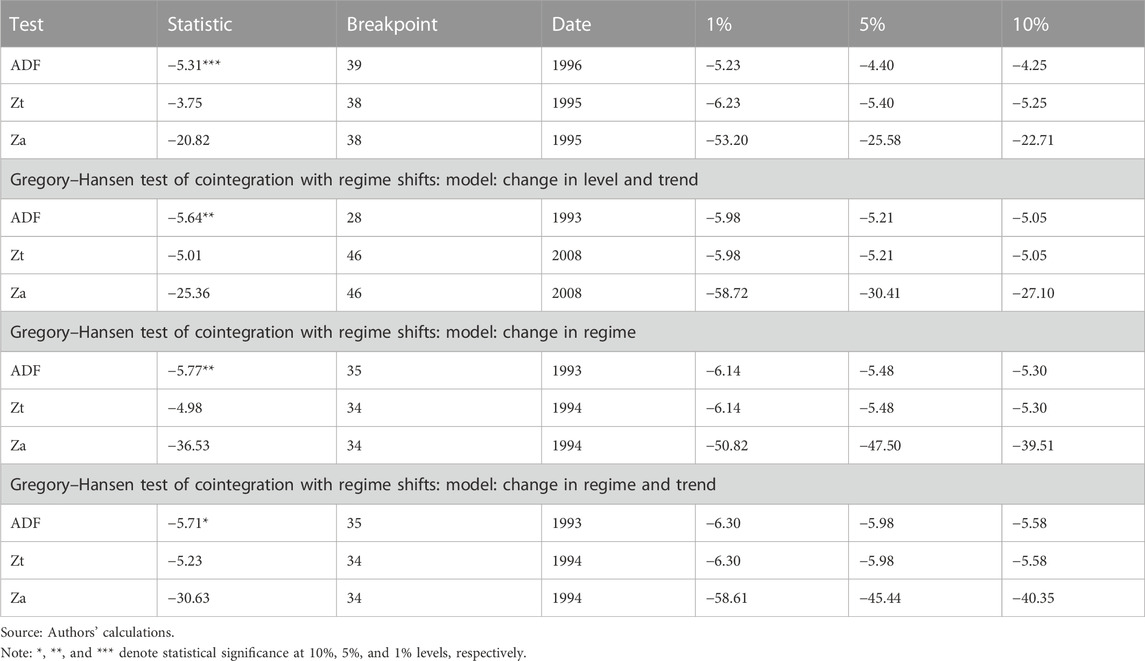
TABLE 10. Gregory–Hansen test of cointegration with regime shifts: model: change in level.
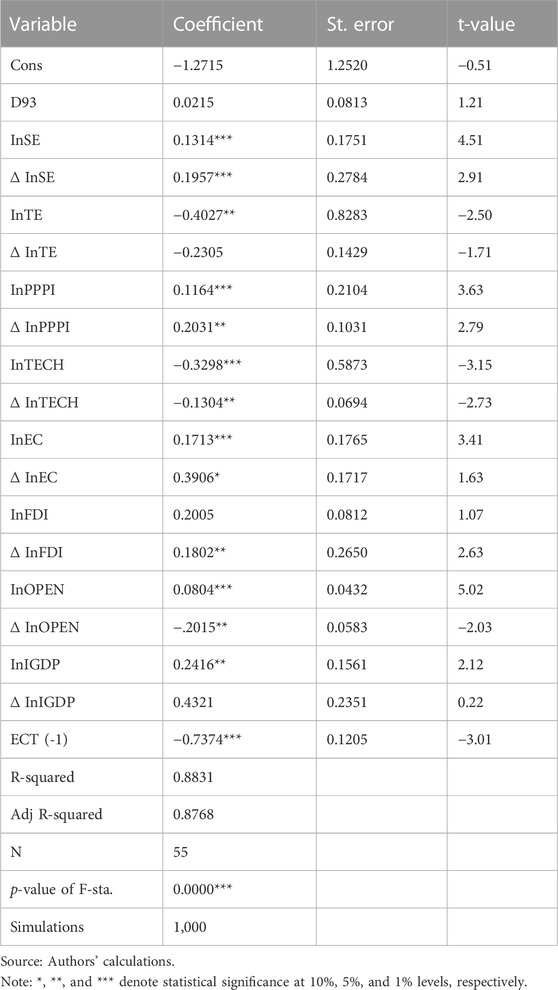
TABLE 11. Dynamic ARDL simulations analysis.
5 Conclusion and policy implications
5.1 Conclusion
In recent decades the sustainability of economic growth has become a critical objective for most world economies. In order to achieve this objective, it is necessary to stabilize or reduce greenhouse gas emissions, which involves transitioning to a low- or zero-carbon production system. Capital is an essential foundation for the economy in the process of low-carbon transformation, and low-carbon investment is an important part of it. Within this framework, innovation has emerged as a key factor in achieving an efficient energy market and, at the same time, ensuring the sustainable development of any economy. This country-specific study investigates the dynamic relationship between public–private partnership investment (PPPI) in energy and CO2 emissions for South Africa over the period 1960–2020 by using the recently developed novel dynamic ARDL simulations model proposed by Jordan and Philips (2018) that can estimate, simulate, and plot to predict graphs of (positive and negative) changes in the variables automatically, as well as their short- and long-run relationships. Using this approach permits us to identify the positive and negative relationships between economic growth (proxied by scale effect), the square of economic growth (represented by technique effect), PPPI, technological innovation, energy consumption, foreign direct investment, trade openness, industrial value-added, and carbon emissions for South Africa, thereby overcoming the limitations of the simple ARDL approach in earlier studies. For robustness check, the study uses the frequency domain causality (FDC) approach, the robust testing strategy suggested by Breitung and Candelon (2006), which permits us to capture permanent causality in the medium, short, and long term among variables under consideration. This study further contributes to the empirical literature by employing an innovative measure of trade openness proposed by Squalli and Wilson (2011) to capture trade share in GDP and the size of trade relative to the global trade for South Africa. The study uses the Dickey–Fuller GLS (DF-GLS), Phillips–Perron (PP), Augmented Dickey–Fuller (ADF), and Kwiatkowski–Phillips–Schmidt–Shin (KPSS) unit root tests to conduct a stationarity test on the variables to ascertain their order of integration. Furthermore, the Narayan and Popp structural break unit root test is used since empirical evidence shows that the structural breaks are persistent such that many macroeconomic variables, such as CO2 emissions, trade openness, and technological innovation, are affected by the structural breaks. The revelations from all the tests show that the data series are integrated into order one, that is, I (1), and there is no evidence of any I (2). SBIC is utilized to identify the optimal lag length. For South Africa, our empirical results reveal that an upsurge in scale effect worsens the environmental condition, whereas an increase in technique effect is environmentally friendly. This empirical evidence implies that the scale effect representing economic growth deteriorates environmental quality, whereas the technique effect has a mitigating effect on the environment. Therefore, findings suggest that the EKC hypothesis holds in the case of South Africa, where real income grows until a certain threshold level, whereas CO2 emissions start to decline. In the initial stage of economic growth, the environmental quality decreases, whereas after reaching the optimum level, environmental quality starts improving in South Africa. This supports the inverted U-shaped relationship between economic growth and environmental quality. The findings are justifiable for South Africa and associated with structural change and technological advancement in the country. Environmental awareness increases among the people as income grows, so environmental regulations are enforced to use energy-efficient technologies to mitigate pollution. Trade openness, foreign direct investment, industry value-added, and energy consumption deteriorate environmental quality. The FDC results also reveal that scale effect, technique effect, PPPI, technological innovation, energy consumption, foreign direct investment, trade openness, industrial value-added Granger-cause carbon emissions in the medium, long, and short term, suggesting that these variables are important to influence CO2 emissions for the case of South Africa.
In addition, regarding the relationship between public–private partnership investment in energy and CO2 emissions, our empirical results show that in the short and long run, higher public–private partnership investment in energy contributes to increasing CO2 emissions in South Africa. The reason behind this positive interconnection is that public–private partnership investment in energy is strongly connected to non-renewable energy sources that raise carbon emissions.
5.2 Policy implications
In light of our empirical evidence, the following policy considerations are suggested. i) South Africa’s government and policymakers should take further initiatives to ensure the implementation of policies, which enable the change from non-renewable energy sources to renewable ones to promote efficiency in the production processes (Udeagha and Muchapondwa, 2022b) and curtail CO2 emissions in South Africa. ii) Since South Africa has many manufacturing industries whose economic activities contribute significantly to increasing the country’s levels of emissions, more investments in R&D by the government and manufacturing industries will be crucial to further minimize the growing levels of carbon emissions. iii) South African government should formulate robust policies aimed at imposing high tax brackets on high-polluting industries to force them to adopt clean, greener, and updated technologies and invest more in R& D, patenting, and less-polluting technologies. iv) A gradual drift from coal-intensive energy which is environmental unfriendly energy which drives a significant part of the South African economy to move to cleaner energy sources such as renewables like wind energy, solar, and photovoltaic energy which are reputed to be cleaner and more eco-system friendly. v) International teamwork to improve environmental quality is immensely critical to solving the growing transboundary environmental decay and other associated spillover consequences. In light of this, the government should work together to build robust global teamwork with other countries to share technology. vi) The need to reinforce the commitment to local and international environment treaties is encouraged for the South African economy to set the economy on the path of economic growth. This is because achieving economic expansion will, in turn, promote the well-being of South Africans, as economic growth means improvement in the standard of living. Thus, this study suggests that the quest for economic expansion should be carefully managed to minimize environmental decay; otherwise, in the future, the negative consequences of economic prosperity will pose a serious environmental danger through degradation, which by extension, could undue its developmental path. vii) The government should incorporate comprehensive environmental chapters into the country’s trade agreement policies to enable a transition into a low-carbon economy and greener industries, thus encouraging the production of cleaner products. vi) Lastly, trade policy reform could be supported by other developmental policies to ensure long-lasting value for reductions of carbon emissions and continuously enable the development of new technologies that can boost the country’s environmental quality and protect the global environment.
5.3 Limitations and potential future study areas
In the instance of South Africa, the current analysis produced strong empirical results, although it had several shortcomings that may be considered in further research. The limited availability of the data outside of the sample period, which limits the span of the time series analysis used, is one of the investigation’s primary limitations. Future research utilizing other econometric methods or micro-disaggregated pertinent data may focus on other emerging economies. Additional growth-related elements that were not considered in this study, such as institutional quality and natural resources, can be examined in future research. However, CO2 emissions were used in this study as a gauge of environmental damage. Additional research is required to determine whether consumption-based carbon emissions, other metrics of carbon footprints, such as chlorofluorocarbons, volatile organic compounds, hydrocarbons, unburned hydrocarbons, ground-level gaseous pollutants, sulfur compounds, and other short-lived climatological shocks, are better indicators of environmental contamination in South Africa. The current study uses CO2 emissions as a representation of biodiversity loss, although they are not the main cause of ecological degradation. Future research should study this connection by considering additional ecological contamination factors, such as water pollution and hazardous contaminants. By combining time series data with panel estimate techniques, further research may compare country-specific results to generic panel outputs using a more complicated methodology. This can assist in illuminating the existing evidence by providing a comparative analysis of the findings of this inquiry. The investigation’s narrow review of only one country is another significant issue. Therefore, for a wider perspective, future studies should investigate the moderating influence of PPPI on environmental quality through economic development, trade openness, and foreign direct investment.
Data availability statement
The raw data supporting the conclusion of this article will be made available by the authors, without undue reservation.
Author contributions
MCU and NN conceptualized the study idea, drafted the paper, collected data, analyzed data, wrote the introduction section, organized the literature review, drafted the methodology section, interpreted the results, provided the discussions, concluded the study with policy implications, and organized the reference list.
Conflict of interest
The authors declare that the research was conducted in the absence of any commercial or financial relationships that could be construed as a potential conflict of interest.
Publisher’s note
All claims expressed in this article are solely those of the authors and do not necessarily represent those of their affiliated organizations or those of the publisher, the editors, and the reviewers. Any product that may be evaluated in this article, or claim that may be made by its manufacturer, is not guaranteed or endorsed by the publisher.
Footnotes
1Brazil, Russia, India, China, and South Africa.
2South Asian Association for Regional Cooperation.
References
Abdouli, M., and Hammami, S. (2017). Investigating the causality links between environmental quality, foreign direct investment and economic growth in MENA countries. Int. Bus. Rev. 26 (2), 264–278. doi:10.1016/j.ibusrev.2016.07.004
Adebayo, T. S., Awosusi, A. A., Bekun, F. V., and Altuntaş, M. (2021c). Coal energy consumption beat renewable energy consumption in South Africa: Developing policy framework for sustainable development. Renew. Energy 175, 1012–1024. doi:10.1016/j.renene.2021.05.032
Adebayo, T. S., Awosusi, A. A., Oladipupo, S. D., Agyekum, E. B., Jayakumar, A., and Kumar, N. M. (2021b). Dominance of fossil fuels in Japan’s national energy mix and implications for environmental sustainability. Int. J. Environ. Res. Public Health 18 (14), 7347. doi:10.3390/ijerph18147347
Adebayo, T. S., Genç, S. Y., Castanho, R. A., and Kirikkaleli, D. (2021a). Do public–private partnership investment in energy and technological innovation matter for environmental sustainability in the East Asia and pacific region? An application of a frequency domain causality test. Sustainability 13 (6), 3039. doi:10.3390/su13063039
Ahmad, M., Jabeen, G., Shah, S. A. A., Rehman, A., Ahmad, F., and Işik, C. (2022). Assessing long-and short-run dynamic interplay among balance of trade, aggregate economic output, real exchange rate, and CO2 emissions in Pakistan. Environ. Dev. Sustain. 24 (5), 7283–7323. doi:10.1007/s10668-021-01747-9
Ahmad, M., and Raza, M. Y. (2020). Role of 3 energy and technological innovations in driving climate change: Evidence from Brazil. Environ. Sci. Pollut. Res. 27, 30638–30648. doi:10.1007/s11356-020-09307-w
Ahmad, M., and Wu, Y. (2022). Combined role of green productivity growth, economic globalization, and eco-innovation in achieving ecological sustainability for OECD economies. J. Environ. Manag. 302, 113980. doi:10.1016/j.jenvman.2021.113980
Akinsola, G. D., Awosusi, A. A., Kirikkaleli, D., Umarbeyli, S., Adeshola, I., and Adebayo, T. S. (2022). Ecological footprint, public-private partnership investment in energy, and financial development in Brazil: A gradual shift causality approach. Environ. Sci. Pollut. Res. 29 (7), 10077–10090. doi:10.1007/s11356-021-15791-5
Al Mamun, M., Sohag, K., Mia, M. A. H., Uddin, G. S., and Ozturk, I. (2014). Regional differences in the dynamic linkage between CO2 emissions, sectoral output and economic growth. Renew. Sustain. Energy Rev. 38, 1–11. doi:10.1016/j.rser.2014.05.091
Alharthi, M., Dogan, E., and Taskin, D. (2021). Analysis of CO2 emissions and energy consumption by sources in MENA countries: Evidence from quantile regressions. Environ. Sci. Pollut. Res. 28 (29), 38901–38908. doi:10.1007/s11356-021-13356-0
Ali, S., Yusop, Z., Kaliappan, S. R., and Chin, L. (2020). Dynamic common correlated effects of trade openness, FDI, and institutional performance on environmental quality: Evidence from OIC countries. Environ. Sci. Pollut. Res. 27 (11), 11671–11682. doi:10.1007/s11356-020-07768-7
Altinoz, B., Vasbieva, D., and Kalugina, O. (2021). The effect of information and communication technologies and total factor productivity on CO2 emissions in top 10 emerging market economies. Environ. Sci. Pollut. Res. 28 (45), 63784–63793. doi:10.1007/s11356-020-11630-1
Anser, M. K., Ahmad, M., Khan, M. A., Zaman, K., Nassani, A. A., Askar, S. E., et al. (2021). The role of information and communication technologies in mitigating carbon emissions: Evidence from panel quantile regression. Environ. Sci. Pollut. Res. 28 (17), 21065–21084. doi:10.1007/s11356-020-12114-y
Antweiler, W., Copeland, B. R., and Taylor, M. S. (2001). Is free trade good for the environment? Am. Econ. Rev. 91 (4), 877–908. doi:10.1257/aer.91.4.877
Anwar, A., Sharif, A., Fatima, S., Ahmad, P., Sinha, A., Khan, S. A. R., et al. (2021). The asymmetric effect of public private partnership investment on transport CO2 emission in China: Evidence from quantile ARDL approach. J. Clean. Prod. 288, 125282. doi:10.1016/j.jclepro.2020.125282
Arshad, Z., Robaina, M., and Botelho, A. (2020). The role of ICT in energy consumption and environment: An empirical investigation of asian economies with cluster analysis. Environ. Sci. Pollut. Res. 27 (26), 32913–32932. doi:10.1007/s11356-020-09229-7
Asane-Otoo, E. (2015). Carbon footprint and emission determinants in Africa. Energy 82, 426–435. doi:10.1016/j.energy.2015.01.053
Aslan, A., Altinoz, B., and Özsolak, B. (2021). The nexus between economic growth, tourism development, energy consumption, and CO2 emissions in Mediterranean countries. Environ. Sci. Pollut. Res. 28 (3), 3243–3252. doi:10.1007/s11356-020-10667-6
Awosusi, A. A., Xulu, N. G., Ahmadi, M., Rjoub, H., Altuntaş, M., Uhunamure, S. E., et al. (2022a). The sustainable environment in Uruguay: The roles of financial development, natural resources, and trade globalization. Front. Environ. Sci. 25 (10), 875577. doi:10.3389/fenvs.2022.875577
Awosusi, A. A., Kutlay, K., Altuntaş, M., Khodjiev, B., Agyekum, E. B., Shouran, M., et al. (2022b). A roadmap toward achieving sustainable environment: Evaluating the impact of technological innovation and globalization on load capacity factor. Int. J. Environ. Res. Public Health 19 (6), 3288. doi:10.3390/ijerph19063288
Awosusi, A. A., Mata, M. N., Ahmed, Z., Coelho, M. F., Altuntaş, M., Martins, J., et al. (2022c). How do renewable energy, economic growth and natural resources rent affect environmental sustainability in a globalized economy? Evidence from Colombia based on the gradual shift causality approach. Front. Energy Res. 9, 739721. doi:10.3389/fenrg.2021.739721
Aydin, M., and Turan, Y. E. (2020). The influence of financial openness, trade openness, and energy intensity on ecological footprint: Revisiting the environmental Kuznets curve hypothesis for BRICS countries. Environ. Sci. Pollut. Res. 27 (34), 43233–43245. doi:10.1007/s11356-020-10238-9
Baloch, M. A., Ozturk, I., Bekun, F. V., and Khan, D. (2021). Modeling the dynamic linkage between financial development, energy innovation, and environmental quality: Does globalization matter? Bus. Strategy Environ. 30 (1), 176–184. doi:10.1002/bse.2615
Baye, R. S., Olper, A., Ahenkan, A., Musah-Surugu, I. J., Anuga, S. W., and Darkwah, S. (2021). Renewable energy consumption in Africa: Evidence from a bias corrected dynamic panel. Sci. Total Environ. 766, 142583. doi:10.1016/j.scitotenv.2020.142583
Beton Kalmaz, D., and Awosusi, A. A. (2022). Investigation of the driving factors of ecological footprint in Malaysia. Environ. Sci. Pollut. Res. 29, 56814–56827. doi:10.1007/s11356-022-19797-5
Bibi, F., and Jamil, M. (2021). Testing environment Kuznets curve (EKC) hypothesis in different regions. Environ. Sci. Pollut. Res. 28 (11), 13581–13594. doi:10.1007/s11356-020-11516-2
Borodiyenko, O., Nychkalo, N., Ya, M., Kuz, O. M., and Korotkov, D. S. (2021). Public-private partnership in education as a prerequisite for the growth of regional labor markets: Analysis of foreign experience. Financial credit activity problems theory Pract. 1 (36), 408–420. doi:10.18371/fcaptp.v1i36.228031
Breitung, J., and Candelon, B. (2006). Testing for short-and long-run causality: A frequency-domain approach. J. Econ. 132 (2), 363–378. doi:10.1016/j.jeconom.2005.02.004
Brunne, V. (2009). Public-private partnerships as a strategy against HIV/AIDS in SouthSouth Africa: The influence of historical legacies. Afr. J. AIDS Res. 8 (3), 339–348. doi:10.2989/ajar.2009.8.3.10.931
Caglar, A. E., Zafar, M. W., Bekun, F. V., and Mert, M. (2022). Determinants of CO2 emissions in the BRICS economies: The role of partnerships investment in energy and economic complexity. Sustain. Energy Technol. Assessments 51, 101907. doi:10.1016/j.seta.2021.101907
Cárdenas Rodríguez, M., Haščič, I., Johnstone, N., Silva, J., and Ferey, A. (2015). Renewable energy policies and private sector investment: Evidence from financial microdata. Environ. Resour. Econ. 62 (1), 163–188. doi:10.1007/s10640-014-9820-x
Chaudhry, I. S., Yin, W., Ali, S. A., Faheem, M., Abbas, Q., Farooq, F., et al. (2022). Moderating role of institutional quality in validation of pollution haven hypothesis in BRICS: A new evidence by using DCCE approach. Environ. Sci. Pollut. Res. 29 (6), 9193–9202. doi:10.1007/s11356-021-16087-4
Cheng, G., Zhao, C., Iqbal, N., Gülmez, Ö., Işik, H., and Kirikkaleli, D. (2021). Does energy productivity and public-private investment in energy achieve carbon neutrality target of China? J. Environ. Manag. 298, 113464. doi:10.1016/j.jenvman.2021.113464
Cherniwchan, J. (2012). Economic growth, industrialization, and the environment. Resour. Energy Econ. 34 (4), 442–467. doi:10.1016/j.reseneeco.2012.04.004
Chunling, L., Memon, J. A., Thanh, T. L., Ali, M., and Kirikkaleli, D. (2021). The impact of public-private partnership investment in energy and technological innovation on ecological footprint: The case of Pakistan. Sustainability 13 (18), 10085. doi:10.3390/su131810085
Cole, M. A. (2004). Trade, the pollution haven hypothesis and the environmental Kuznets curve: Examining the linkages. Ecol. Econ. 48 (1), 71–81. doi:10.1016/j.ecolecon.2003.09.007
Cole, M. A., and Elliott, R. J. (2003). Determining the trade–environment composition effect: The role of capital, labor and environmental regulations. J. Environ. Econ. Manag. 46 (3), 363–383. doi:10.1016/s0095-0696(03)00021-4
Copeland, B. R., and Taylor, M. S. (1994). North-South trade and the environment. Q. J. Econ. 109, 755–787. doi:10.2307/2118421
Dao, N. H., Marisetty, V. B., Shi, J., and Tan, M. (2020). Institutional quality, investment efficiency, and the choice of public–private partnerships. Account. Finance 60 (2), 1801–1834. doi:10.1111/acfi.12514
Dauda, L., Long, X., Mensah, C. N., Salman, M., Boamah, K. B., Ampon-Wireko, S., et al. (2021). Innovation, trade openness and CO2 emissions in selected countries in Africa. J. Clean. Prod. 281, 125143. doi:10.1016/j.jclepro.2020.125143
Deloitte and Touche (2006). Closing the infrastructure gap: The role of public–private partnerships. [Online] Available at: http://www.deloitte.com/assets/dcom-shared%20 assets/documents/dtt_ps_closinggap061307.Pdf (Accessed March, 2022).
Demir, C., Cergibozan, R., and Ari, A. (2020). Environmental dimension of innovation: Time series evidence from Turkey. Environ. Dev. Sustain. 22 (3), 2497–2516. doi:10.1007/s10668-018-00305-0
Destek, M. A., and Manga, M. (2021). Technological innovation, financialization, and ecological footprint: Evidence from BEM economies. Environ. Sci. Pollut. Res. 28 (17), 21991–22001. doi:10.1007/s11356-020-11845-2
Dhami, J. K., Singh, H., and Gupta, M. (2013). Industrialization at the cost of environment degradation—A case of leather and iron and steel industry from Punjab economy. Innovative J. Bus. Manag. 2 (1), 19
Ding, Q., Khattak, S. I., and Ahmad, M. (2021). Towards sustainable production and consumption: Assessing the impact of energy productivity and eco-innovation on consumption-based carbon dioxide emissions (CCO2) in G-7 nations. Sustain. Prod. Consum. 27, 254–268. doi:10.1016/j.spc.2020.11.004
Doğanlar, M., Mike, F., Kızılkaya, O., and Karlılar, S. (2021). Testing the long-run effects of economic growth, financial development and energy consumption on CO2 emissions in Turkey: New evidence from RALS cointegration test. Environ. Sci. Pollut. Res. 28 (25), 32554–32563.
Domalatov, Y., and Turginbayeva, A. (2022). Public-private partnership management strategy in the energy sector: Case of the republic of Kazakhstan. Acad. Strategic Manag. J. 21 (1), 1–8.
Erdogan, S. (2021). Dynamic nexus between technological innovation and building sector carbon emissions in the BRICS countries. J. Environ. Manag. 293, 112780. doi:10.1016/j.jenvman.2021.112780
Ewing, R., and Rong, F. (2008). The impact of urban form on US residential energy use. Hous. Policy Debate 19, 1–30. doi:10.1080/10511482.2008.9521624
Faisal, F., Tursoy, T., and Pervaiz, R. (2020). Does ICT lessen CO2 emissions for fast-emerging economies? An application of the heterogeneous panel estimations. Environ. Sci. Pollut. Res. 27 (10), 10778–10789. doi:10.1007/s11356-019-07582-w
Fareed, Z., Rehman, M. A., Adebayo, T. S., Wang, Y., Ahmad, M., and Shahzad, F. (2022). Financial inclusion and the environmental deterioration in eurozone: The moderating role of innovation activity. Technol. Soc. 69, 101961. doi:10.1016/j.techsoc.2022.101961
Fombad, M. C. (2014). Enhancing accountability in public–private partnerships in South Africa. South. Afr. Bus. Rev. 18 (3), 66–92. doi:10.25159/1998-8125/5686
Fombad, M. C. (2015). Governance in public–private partnerships in South Africa: Some lessons from the Gautrain. J. South. Afr. Stud. 41 (6), 1199–1217. doi:10.1080/03057070.2015.1117240
Godil, D. I., Sharif, A., Agha, H., and Jermsittiparsert, K. (2020). The dynamic nonlinear influence of ICT, financial development, and institutional quality on CO2 emission in Pakistan: New insights from QARDL approach. Environ. Sci. Pollut. Res. 27 (19), 24190–24200. doi:10.1007/s11356-020-08619-1
Gorus, M. S., and Aslan, M. (2019). Impacts of economic indicators on environmental degradation: Evidence from MENA countries. Renew. Sust. Energ Rev. 103, 259–268. doi:10.1016/j.rser.2018.12.042
Grossman, G. M., and Krueger, A. B. (1995). Economic growth and the environment. Q. J. Econ. 110 (2), 353–377. doi:10.2307/2118443
Guo, J., Zhou, Y., Ali, S., Shahzad, U., and Cui, L. (2021). Exploring the role of green innovation and investment in energy for environmental quality: An empirical appraisal from provincial data of China. J. Environ. Manag. 292, 112779. doi:10.1016/j.jenvman.2021.112779
Haisheng, Y., Jia, J., Yongzhang, Z., and Shugong, W. (2005). The impact on environmental Kuznets curve by trade and foreign direct investment in China. Chin. J. Pop. Res. Environ. 3 (2), 14–19. doi:10.1080/10042857.2005.10677410
Hanif, I., Raza, S. M. F., Santos, P. G., and Qaiser, A ( (2019). Fossil fuels, foreign direct investment, and economic growth have triggered CO2 emissions in emerging asian economies: Some empirical evidence. Energ 171, 493–501. doi:10.1016/j.energy.2019.01.011
Hao, L. N., Umar, M., Khan, Z., and Ali, W. (2021). Green growth and low carbon emission in G7 countries: How critical the network of environmental taxes, renewable energy and human capital is? Sci. Total Environ. 752, 141853. doi:10.1016/j.scitotenv.2020.141853
He, Y., Guo, S., Zhou, J., Ye, J., Huang, J., Zheng, K., et al. (2022). Multi-objective planning-operation co-optimization of renewable energy system with hybrid energy storages. Renew. Energy 184, 776–790. doi:10.1016/j.renene.2021.11.116
Hongxing, Y., Abban, O. J., Boadi, A. D., and Ankomah-Asare, E. T. (2021). Exploring the relationship between economic growth, energy consumption, urbanization, trade, and CO2 emissions: A PMG-ARDL panel data analysis on regional classification along 81 BRI economies. Environ. Sci. Pollut. Res. 28 (46), 66366–66388. doi:10.1007/s11356-021-15660-1
Hossain, M. S. (2011). Panel estimation for CO2 emissions, energy consumption, economic growth, trade openness and urbanization of newly industrialized countries. Energy Policy 39 (11), 6991–6999. doi:10.1016/j.enpol.2011.07.042
Houghton, J. A. (2010). Understanding the relationship between neoliberalism and the negotiation of urban development imperatives within public private partnerships in Durban (Doctoral dissertation).
Hu, M., Chen, S., Wang, Y., Xia, B., Wang, S., and Huang, G. (2021). Identifying the key sectors for regional energy, water and carbon footprints from production-consumption-and network-based perspectives. Sci. Total Environ. 764, 142821. doi:10.1016/j.scitotenv.2020.142821
Ibrahiem, D. M. (2020). Do technological innovations and financial development improve environmental quality in Egypt? Environ. Sci. Pollut. Res. 27 (10), 10869–10881. doi:10.1007/s11356-019-07585-7
Ibrahim, M., and Vo, X. V. (2021). Exploring the relationships among innovation, financial sector development and environmental pollution in selected industrialized countries. J. Environ. Manag. 284, 112057. doi:10.1016/j.jenvman.2021.112057
Ibrahim, R. L., and Ajide, K. B. (2021b). Disaggregated environmental impacts of non-renewable energy and trade openness in selected G-20 countries: The conditioning role of technological innovation. Environ. Sci. Pollut. Res. 28 (47), 67496–67510. doi:10.1007/s11356-021-15322-2
Ibrahim, R. L., and Ajide, K. B. (2021a). Nonrenewable and renewable energy consumption, trade openness, and environmental quality in G-7 countries: The conditional role of technological progress. Environ. Sci. Pollut. Res. 28 (33), 45212–45229. doi:10.1007/s11356-021-13926-2
Ibrahim, R. L., and Ajide, K. B. (2021c). Trade facilitation and environmental quality: Empirical evidence from some selected african countries. Environ. Dev. Sustain. 24 (1), 1282–1312. doi:10.1007/s10668-021-01497-8
Irfan, M. (2021). Integration between electricity and renewable energy certificate (REC) markets: Factors influencing the solar and non-solar REC in India. Renew. Energy 179, 65–74. doi:10.1016/j.renene.2021.07.020
Isik, C., Ongan, S., Ozdemir, D., Ahmad, M., Irfan, M., Alvarado, R., et al. (2021). The increases and decreases of the environment Kuznets curve (EKC) for 8 OECD countries. Environ. Sci. Pollut. Res. 28 (22), 28535–28543. doi:10.1007/s11356-021-12637-y
Ittmann, H. W. (2017). Private–public partnerships: A mechanism for freight transport infrastructure delivery? J. Transp. Supply Chain Manag. 11 (1), 1–13. doi:10.4102/jtscm.v11i0.262
Jackson, B. M., and Hlahla, M. (1999). South Africa's infrastructure service delivery needs: The role and challenge for public-private partnerships. Dev. South. Afr. 16 (4), 551–563. doi:10.1080/03768359908440101
Jordan, S., and Philips, A. Q. (2018). Cointegration testing and dynamic simulations of autoregressive distributed lag models. Stata J. 18 (4), 902–923. doi:10.1177/1536867x1801800409
Joshua, U., Bekun, F. V., and Sarkodie, S. A. (2020). New insight into the causal linkage between economic expansion, FDI, coal consumption, pollutant emissions and urbanization in South Africa. Environ. Sci. Pollut. Res. 27 (15), 18013–18024. doi:10.1007/s11356-020-08145-0
Kavzo lu, T. (2008). Determination of environmental degradation due to urbanization and industrialization in Gebze, Turkey. Environ. Eng. Sci. 25, 429–438. doi:10.1089/ees.2006.0271
Khan, A., Muhammad, F., Chenggang, Y., Hussain, J., Bano, S., and Khan, M. A. (2020a). The impression of technological innovations and natural resources in energy-growth-environment nexus: A new look into BRICS economies. Sci. Total Environ. 727, 138265. doi:10.1016/j.scitotenv.2020.138265
Khan, I., Hou, F., and Le, H. P. (2021c). The impact of natural resources, energy consumption, and population growth on environmental quality: Fresh evidence from the United States of America. Sci. Total Environ. 754, 142222. doi:10.1016/j.scitotenv.2020.142222
Khan, I., Lei, H., Shah, A. A., Khan, I., Baz, K., Koondhar, M. A., et al. (2021). Environmental quality and the asymmetrical nonlinear consequences of energy consumption, trade openness and economic development: Prospects for environmental management and carbon neutrality. Environ. Sci. Pollut. Res. 29 (10), 14654–14664. doi:10.1007/s11356-021-16612-5
Khan, M., and Ozturk, I. (2021). Examining the direct and indirect effects of financial development on CO2 emissions for 88 developing countries. J. Environ. Manag. 293, 112812. doi:10.1016/j.jenvman.2021.112812
Khan, Z., Ali, M., Kirikkaleli, D., Wahab, S., and Jiao, Z. (2020b). The impact of technological innovation and public-private partnership investment on sustainable environment in China: Consumption-based carbon emissions analysis. Sustain. Dev. 28 (5), 1317–1330. doi:10.1002/sd.2086
Khattak, S. I., Ahmad, M., Khan, Z. U., and Khan, A. (2020). Exploring the impact of innovation, renewable energy consumption, and income on CO2 emissions: New evidence from the BRICS economies. Environ. Sci. Pollut. Res. 27 (12), 13866–13881. doi:10.1007/s11356-020-07876-4
Kirikkaleli, D., and Adebayo, T. S. (2021). Do public-private partnerships in energy and renewable energy consumption matter for consumption-based carbon dioxide emissions in India? Environ. Sci. Pollut. Res. 28 (23), 30139–30152. doi:10.1007/s11356-021-12692-5
Kosycarz, E. A., Nowakowska, B. A., and Mikołajczyk, M. M. (2019). Evaluating opportunities for successful public–private partnership in the healthcare sector in Poland. J. Public Health 27 (1), 1–9. doi:10.1007/s10389-018-0920-x
Kripfganz, S., and Schneider, D. C. (2018). Ardl: Estimating autoregressive distributed lag and equilibrium correction models. Retrieved July 12, 2019, from Stata Available at: www.stata.com/meeting/uk18/slides/uk18_Kripfganz.pdf. (Accessed: March 3, 2022).
Langnel, Z., and Amegavi, G. B. (2020). Globalization, electricity consumption and ecological footprint: An autoregressive distributive lag (ARDL) approach. Sustain. Cities Soc. 63, 102482. doi:10.1016/j.scs.2020.102482
Lee, W. J. (2013). The contribution of foreign direct investment to clean energy use, carbon emissions and economic growth. Energy Policy 55, 483–489. doi:10.1016/j.enpol.2012.12.039
Li, X., and Ullah, S. (2022). Caring for the environment: How CO2 emissions respond to human capital in BRICS economies? Environ. Sci. Pollut. Res. 29 (12), 18036–18046. doi:10.1007/s11356-021-17025-0
Li, Y., and Xia, Y. (2013). DES/CCHP: The best utilization mode of natural gas for China’s low carbon economy. Energy Policy 53, 477–483. doi:10.1016/j.enpol.2012.11.015
Lin, B., Omoju, O. E., and Okonkwo, J. U. (2015). Impact of industrialisation on CO2 emissions in Nigeria. Renew. Sustain. Energy Rev. 52, 1228–1239. doi:10.1016/j.rser.2015.07.164
Lin, S., Wang, S., Marinova, D., Zhao, D., and Hong, J. (2017). Impacts of urbanization and real economic development on CO2 emissions in non-high income countries: Empirical research based on the extended STIRPAT model. J. Clean. Prod. 166, 952–966. doi:10.1016/j.jclepro.2017.08.107
Ling, C. H., Ahmed, K., Muhamad, R. B., and Shahbaz, M. (2015). Decomposing the trade-environment nexus for Malaysia: What do the technique, scale, composition, and comparative advantage effect indicate? Environ. Sci. Pollut. Res. 22 (24), 20131–20142. doi:10.1007/s11356-015-5217-9
Liu, T., Mostafa, S., Mohamed, S., and Nguyen, T. S. (2020). Emerging themes of public-private partnership application in developing smart city projects: A conceptual framework. Built Environ. Proj. Asset Manag. 11 (1), 138–156. doi:10.1108/bepam-12-2019-0142
Liu, Y., Cheng, X., and Li, W. (2021). Agricultural chemicals and sustainable development: The agricultural environment Kuznets curve based on spatial panel model. Environ. Sci. Pollut. Res. 28 (37), 51453–51470. doi:10.1007/s11356-021-14294-7
Lopes, Z. S., Kurniawan, F., and Tistogondo, J. (2021). Case study of public-private partnership on infrastructure projects of tibar bay port in timor-leste. Int. J. Eng. Sci. Inf. Technol. 1 (3), 11–16. doi:10.52088/ijesty.v1i3.79
Lopez, R. (1994). The environment as a factor of production: The effects of economic growth and trade liberalization. J. Environ. Econ. Manag. 27 (2), 163–184. doi:10.1006/jeem.1994.1032
Mensah, C. N., Long, X., Boamah, K. B., Bediako, I. A., Dauda, L., and Salman, M. (2018). The effect of innovation on CO2 emissions of OCED countries from 1990 to 2014. Environ. Sci. Pollut. Res. 25, 29678–29698. doi:10.1007/s11356-018-2968-0
Ming Qing, J., and Jia, Y. (2011). Empirical research on the environmental effect of foreign direct investment: The case of Jiangsu Province. Adv. Mater. Res. 204, 1–4. doi:10.4028/www.scientific.net/amr.204-210.1
Minlah, M. K., and Zhang, X. (2021). Testing for the existence of the environmental Kuznets curve (EKC) for CO2 emissions in Ghana: Evidence from the bootstrap rolling window granger causality test. Environ. Sci. Pollut. Res. 28 (2), 2119–2131. doi:10.1007/s11356-020-10600-x
Morea, D., and Balzarini, M. (2018). Financial sustainability of a public-private partnership for an agricultural development project in Sub-Saharan Africa. Agric. Econ. 64 (9), 389–398. doi:10.17221/161/2017-agricecon
Muhammad, F., Khan, A., Razzaq, N., and Karim, R. (2021). Influence of tourism, governance, and foreign direct investment on energy consumption and CO2 emissions: A panel analysis of muslim countries. Environ. Sci. Pollut. Res. 28 (1), 416–431. doi:10.1007/s11356-020-10502-y
Murshed, M., Alam, R., and Ansarin, A. (2021). The environmental Kuznets curve hypothesis for Bangladesh: The importance of natural gas, liquefied petroleum gas, and hydropower consumption. Environ. Sci. Pollut. Res. 28 (14), 17208–17227. doi:10.1007/s11356-020-11976-6
Naqvi, S. A. A., Shah, S. A. R., Anwar, S., and Raza, H. (2021). Renewable energy, economic development, and ecological footprint nexus: Fresh evidence of renewable energy environment Kuznets curve (RKC) from income groups. Environ. Sci. Pollut. Res. 28 (2), 2031–2051. doi:10.1007/s11356-020-10485-w
Narayan, P. K., and Popp, S. (2010). A new unit root test with two structural breaks in level and slope at unknown time. J. Appl. Statistics 37 (9), 1425–1438. doi:10.1080/02664760903039883
Naz, S., Sultan, R., Zaman, K., Aldakhil, A. M., Nassani, A. A., and Abro, M. M. Q. (2019). Moderating and mediating role of renewable energy consumption, FDI inflows, and economic growth on carbon dioxide emissions: Evidence from robust least square estimator. Environ. Sci. Pollut. Res. 26, 2806–2819. doi:10.1007/s11356-018-3837-6
Nejat, P., Jomehzadeh, F., Taheri, M. M., Gohari, M., and Majid, M. Z. A. (2015). A global review of energy consumption, CO2 emissions and policy in the residential sector (with an overview of the top ten CO2 emitting countries). Renew. Sustain. Energy Rev. 43, 843–862. doi:10.1016/j.rser.2014.11.066
Ngepah, N., and Udeagha, M. C. (2018). African regional trade agreements and intra-African trade. J. Econ. Integration 33 (1), 1176–1199. doi:10.11130/jei.2018.33.1.1176
Ngepah, N., and Udeagha, M. C. (2019). Supplementary trade benefits of multi-memberships in African regional trade agreements. J. Afr. Bus. 20 (4), 505–524. doi:10.1080/15228916.2019.1584719
Nguyen, P. T., Likhitruangsilp, V., and Onishi, M. (2020). Success factors for public-private partnership infrastructure projects in Vietnam. Int. J. Adv. Sci. Eng. Inf. Technol. 10 (2), 858–865. doi:10.18517/ijaseit.10.2.5839
Ojekemi, O. S., Rjoub, H., Awosusi, A. A., and Agyekum, E. B. (2022). Toward a sustainable environment and economic growth in BRICS economies: Do innovation and globalization matter? Environ. Sci. Pollut. Res. 29, 57740–57757. doi:10.1007/s11356-022-19742-6
Omri, A., Nguyen, D. K., and Rault, C. (2014). Causal interactions between CO2 emissions, FDI, and economic growth: Evidence from dynamic simultaneous-equation models. Econ. Model. 42, 382–389. doi:10.1016/j.econmod.2014.07.026
Ozturk, I. (2015). Sustainability in the food-energy-water nexus: Evidence from BRICS (Brazil, the Russian Federation, India, China, and South Africa) countries. Energy 93, 999–1010. doi:10.1016/j.energy.2015.09.104
Paramati, S. R., Ummalla, M., and Apergis, N. (2016). The effect of foreign direct investment and stock market growth on clean energy use across a panel of emerging market economies. Energy Econ. 56, 29–41. doi:10.1016/j.eneco.2016.02.008
Pata, U. K., and Isik, C. (2021). Determinants of the load capacity factor in China: A novel dynamic ARDL approach for ecological footprint accounting. Resour. Policy 74, 102313. doi:10.1016/j.resourpol.2021.102313
Pesaran, M. H., Shin, Y., and Smith, R. J. (2001). Bounds testing approaches to the analysis of level relationships. J. Appl. Econ. 16 (3), 289–326. doi:10.1002/jae.616
Pessoa, A. (2006). Public–private sector partnerships in developing countries prospects and draw backs. Porto, Portugal: Faculdade de Economic do Porto.
Ponce, P., and Khan, S. A. R. (2021). A causal link between renewable energy, energy efficiency, property rights, and CO2 emissions in developed countries: A road map for environmental sustainability. Environ. Sci. Pollut. Res. 28, 37804–37817. doi:10.1007/s11356-021-12465-0
Poumanyvong, P., and Kaneko, S. (2010). Does urbanization lead to less energy use and lower CO2 emissions? A cross-country analysis. Ecol. Econ. 70 (2), 434–444. doi:10.1016/j.ecolecon.2010.09.029
Rafique, M. Z., Li, Y., Larik, A. R., and Monaheng, M. P. (2020). The effects of FDI, technological innovation, and financial development on CO2 emissions: Evidence from the BRICS countries. Environ. Sci. Pollut. Res. 27 (19), 23899–23913. doi:10.1007/s11356-020-08715-2
Raza, S. A., Shah, S. H., and Yousufi, S. Q. (2021). The impact of public-private partnerships investment in energy on carbon emissions: Evidence from nonparametric causality-in-quantiles. Environ. Sci. Pollut. Res. 28 (18), 23182–23192. doi:10.1007/s11356-020-12306-6
Rehman, S. U., Kraus, S., Shah, S. A., Khanin, D., and Mahto, R. V. (2021). Analyzing the relationship between green innovation and environmental performance in large manufacturing firms. Technol. Forecast. Soc. Change 163, 120481. doi:10.1016/j.techfore.2020.120481
Ren, S., Yuan, B., Ma, X., and Chen, X. (2014). International trade, FDI (foreign direct investment) and embodied CO2 emissions: A case study of chinas industrial sectors. China Econ. Rev. 28, 123–134. doi:10.1016/j.chieco.2014.01.003
Rogerson, C. M. (2010).In search of public sector–private sector partnerships for local economic development in South Africa. Urban forum 21. 441
Seker, F., Ertugrul, H. M., and Cetin, M. (2015). The impact of foreign direct investment on environmental quality: A bounds testing and causality analysis for Turkey. Renew. Sust. Energ Rev. 52, 347–356. doi:10.1016/j.rser.2015.07.118
Sergi, B. S., Popkova, E. G., Borzenko, K. V., and Przhedetskaya, N. V. (2019). “Public–private partnerships as a mechanism of financing sustainable development,” in Financing sustainable development (Cham: Palgrave Macmillan), 313.
Shafiei, S., and Salim, R. A. (2014). Non-renewable and renewable energy consumption and CO2 emissions in OECD countries: A comparative analysis. Energy Policy 66, 547–556. doi:10.1016/j.enpol.2013.10.064
Shahbaz, M., Farhani, S., and Ozturk, I. (2015). Do coal consumption and industrial development increase environmental degradation in China and India? Environ. Sci. Pollut. Res. 22 (5), 3895–3907. doi:10.1007/s11356-014-3613-1
Shahbaz, M., Khraief, N., Uddin, G. S., and Ozturk, I. (2014). Environmental Kuznets curve in an open economy: A bounds testing and causality analysis for Tunisia. Renew. Sustain. Energy Rev. 34, 325–336. doi:10.1016/j.rser.2014.03.022
Shahbaz, M., and Lean, H. H. (2012). Does financial development increase energy consumption? The role of industrialization and urbanization in Tunisia. Energy Policy 40, 473–479. doi:10.1016/j.enpol.2011.10.050
Shahbaz, M., Nasir, M. A., and Roubaud, D. (2018). Environmental degradation in France: The effects of FDI, financial development, and energy innovations. Energy Econ. 74, 843–857. doi:10.1016/j.eneco.2018.07.020
Shahbaz, M., Raghutla, C., Song, M., Zameer, H., and Jiao, Z. (2020). Public-private partnerships investment in energy as new determinant of CO2 emissions: The role of technological innovations in China. Energy Econ. 86, 104664. doi:10.1016/j.eneco.2020.104664
Shan, S., Ahmad, M., Tan, Z., Adebayo, T. S., Li, R. Y. M., and Kirikkaleli, D. (2021). The role of energy prices and non-linear fiscal decentralization in limiting carbon emissions: Tracking environmental sustainability. Energy 234, 121243. doi:10.1016/j.energy.2021.121243
Shinwari, R., Wang, Y., Maghyereh, A., and Awartani, B. (2022). Does Chinese foreign direct investment harm CO2 emissions in the Belt and Road Economies. Environ. Sci. Pollut. Res. 29 (26), 39528–39544. doi:10.1007/s11356-021-18357-7
Sinanovic, E., and Kumaranayake, L. (2006a). Financing and cost-effectiveness analysis of public-private partnerships: Provision of tuberculosis treatment in South Africa. Cost Eff. Resour. Allocation 4 (1), 11–10. doi:10.1186/1478-7547-4-11
Sinanovic, E., and Kumaranayake, L. (2006b). Quality of tuberculosis care provided in different models of public-private partnerships in South Africa. Int. J. Tuberc. lung Dis. 10 (7), 795–801.
Sinanovic, E., and Kumaranayake, L. (2010). The motivations for participation in public–private partnerships for the provision of tuberculosis treatment in South Africa. Glob. public health 5 (5), 479–492. doi:10.1080/17441690902942498
Sohag, K., Al Mamun, M., Uddin, G. S., and Ahmed, A. M. (2017). Sectoral output, energy use, and CO2 emission in middle-income countries. Environ. Sci. Pollut. Res. 24 (10), 9754–9764. doi:10.1007/s11356-017-8599-z
Sohag, K., Begum, R. A., Abdullah, S. M. S., and Jaafar, M. (2015). Dynamics of energy use, technological innovation, economic growth and trade openness in Malaysia. Energy 90, 1497–1507. doi:10.1016/j.energy.2015.06.101
Sohag, K., Kalugina, O., and Samargandi, N. (2019). Re-visiting environmental Kuznets curve: Role of scale, composite, and technology factors in OECD countries. Environ. Sci. Pollut. Res. 26 (27), 27726–27737. doi:10.1007/s11356-019-05965-7
Squalli, J., and Wilson, K. (2011). A new measure of trade openness. World Econ. 34 (10), 1745–1770. doi:10.1111/j.1467-9701.2011.01404.x
Sun, Y., Li, M., Zhang, M., Khan, H. S. U. D., Li, J., Li, Z., et al. (2021). A study on China’s economic growth, green energy technology, and carbon emissions based on the Kuznets curve (EKC). Environ. Sci. Pollut. Res. 28 (6), 7200–7211. doi:10.1007/s11356-020-11019-0
Tamazian, A., and Rao, B. B. (2010). Do economic, financial and institutional developments matter for environmental degradation? Evidence from transitional economies. Energy Econ. 32, 137–145. doi:10.1016/j.eneco.2009.04.004
Taylor, M. S. (2004). Unbundling the pollution haven hypothesis. Adv. Econ. Analy Pol. 3 (2), 1408. doi:10.2202/1538-0637.1408
Thomsen, S. (2005). ‘Investment for african development: Making it happen’, NEPAD/OECD investment initiative, imperial resort beach hotel, kama hal, entebbe, Uganda. [Online] Available at: http://www.oecd.org/dataoecd/29/45/34843203.pdf. (Accessed: January 25, 2022).
Tian, X., Chang, M., Shi, F., and Tanikawa, H. (2014). How does industrial structure change impact carbon dioxide emissions? A comparative analysis focusing on nine provincial regions in China. Environ. Sci. Policy 37, 243–254. doi:10.1016/j.envsci.2013.10.001
Töbelmann, D., and Wendler, T. (2020). The impact of environmental innovation on carbon dioxide emissions. J. Clean. Prod. 244, 118787. doi:10.1016/j.jclepro.2019.118787
Udeagha, M. C., and Breitenbach, M. C. (2021). Estimating the trade-environmental quality relationship in SADC with a dynamic heterogeneous panel model. Afr. Rev. Econ. Finance 13 (1), 113
Udeagha, M. C., and Breitenbach, M. C. (2022). Exploring the moderating role of financial development in environmental Kuznets curve for South Africa: Fresh evidence from the novel dynamic ARDL simulations approach. Financ. Innov., 1–38. doi:10.1186/s40854-022-00396-9
Udeagha, M. C., and Muchapondwa, E. (2022a). Investigating the moderating role of economic policy uncertainty in environmental Kuznets curve for South Africa: Evidence from the novel dynamic ARDL simulations approach. Environ. Sci. Pollut. Res. 29, 77199–77237. doi:10.1007/s11356-022-21107-y
Udeagha, M. C., and Ngepah, N. (2022a). Disaggregating the environmental effects of renewable and non-renewable energy consumption in South Africa: Fresh evidence from the novel dynamic ARDL simulations approach. Econ. Change Restruct. 55, 1767–1814. doi:10.1007/s10644-021-09368-y
Udeagha, M. C., and Ngepah, N. (2022b). Does trade openness mitigate the environmental degradation in South Africa? Environ. Sci. Pollut. Res. 29 (13), 19352–19377. doi:10.1007/s11356-021-17193-z
Udeagha, M. C., and Ngepah, N. (2022c). Dynamic ARDL simulations effects of fiscal decentralization, green technological innovation, trade openness, and institutional quality on environmental sustainability: Evidence from South Africa. Evid. S. Afr. Sustain. 14, 10268. doi:10.3390/su141610268
Udeagha, M. C., and Ngepah, N. (2019). Revisiting trade and environment nexus in South Africa: Fresh evidence from new measure. Environ. Sci. Pollut. Res. 26, 29283–29306. doi:10.1007/s11356-019-05944-y
Udeagha, M. C., and Ngepah, N. (2022d). Striving towards environmental sustainability in the BRICS economies: The combined influence of fiscal decentralization and environmental innovation. Int. J. Sustain. Dev. World Ecol., 1–15. doi:10.1080/13504509.2022.2123411
Udeagha, M. C., and Ngepah, N. (2022e). The asymmetric effect of technological innovation on CO2 emissions in South Africa: New evidence from the QARDL approach. Front. Environ. Sci. 10, 985719. doi:10.3389/fenvs.2022.985719
Udeagha, M. C., and Ngepah, N. (2021a). The asymmetric effect of trade openness on economic growth in SouthSouth Africa: A nonlinear ARDL approach. Econ. Change Restruct. 54 (2), 491–540. doi:10.1007/s10644-020-09285-6
Udeagha, M. C., and Ngepah, N. (2020). Trade liberalization and the geography of industries in SouthSouth Africa: Fresh evidence from a new measure. Int. J. Urban Sci. 24 (3), 354–396. doi:10.1080/12265934.2019.1695652
Udeagha, M. C., and Muchapondwa, E. (2022b). Environmental sustainability in South Africa: Understanding the criticality of economic policy uncertainty, fiscal decentralization, and green innovation. Sustain. Dev. 1, 14. doi:10.1002/sd.2473
Udeagha, M. C., and Ngepah, N. N. (2021b). A step towards environmental mitigation in South Africa: Does trade liberalisation really matter? Fresh evidence from A novel dynamic ARDL simulations approach. Res. Square. doi:10.21203/rs.3.rs-419113/v1
Ulucak, R. (2021). Renewable energy, technological innovation and the environment: A novel dynamic auto-regressive distributive lag simulation. Renew. Sustain. Energy Rev. 150, 111433. doi:10.1016/j.rser.2021.111433
Usman, M., and Hammar, N. (2021). Dynamic relationship between technological innovations, financial development, renewable energy, and ecological footprint: Fresh insights based on the STIRPAT model for Asia pacific economic cooperation countries. Environ. Sci. Pollut. Res. 28 (12), 15519–15536. doi:10.1007/s11356-020-11640-z
Van Song, N., Tiep, N. C., van Tien, D., Van Ha, T., Phuong, N. T. M., and Mai, T. T. H. (2021). The role of public-private partnership investment and eco-innovation in environmental abatement in USA: Evidence from quantile ARDL approach. Environ. Sci. Pollut. Res. 29, 12164–12175. doi:10.1007/s11356-021-16520-8
Van Tran, N. (2020). The environmental effects of trade openness in developing countries: Conflict or cooperation? Environ. Sci. Pollut. Res. 27 (16), 19783–19797. doi:10.1007/s11356-020-08352-9
Villanthenkodath, M. A., and Mahalik, M. K. (2020). Technological innovation and environmental quality nexus in India: Does inward remittance matter? J. Public Aff. 22, e2291. doi:10.1002/pa.2291
Wagner, G. (2010). Energy content of world trade. Energy Policy 38 (12), 7710–7721. doi:10.1016/j.enpol.2010.08.022
Wang, S., Fang, C., Guan, X., Pang, B., and Ma, H. (2014). Urbanisation, energy consumption, and carbon dioxide emissions in China: A panel data analysis of China’s provinces. Appl. Energy 136, 738–749. doi:10.1016/j.apenergy.2014.09.059
Waqih, M. A. U., Bhutto, N. A., Ghumro, N. H., Kumar, S., and Salam, M. A. (2019). Rising environmental degradation and impact of foreign direct investment: An empirical evidence from SAARC region. J. Environ. Manag. 243, 472–480. doi:10.1016/j.jenvman.2019.05.001
Warshawsky, D. N. (2016). Civil society and public–private partnerships: Case study of the agri-FoodBank in South Africa. Soc. Cult. Geogr. 17 (3), 423–443. doi:10.1080/14649365.2015.1077266
World Bank (2021). World development indicators. Availbale at: http://databank.worldbank.org/data/reports.aspx?source=World%20Development%20Indicators (Accessed: May 10, 2022).
Xu, B., and Lin, B. (2015). How industrialization and urbanization process impacts on CO2 emissions in China: Evidence from nonparametric additive regression models. Energy Econ. 48, 188–202. doi:10.1016/j.eneco.2015.01.005
Xu, D., Salem, S., Awosusi, A. A., Abdurakhmanova, G., Altuntaş, M., Oluwajana, D., et al. (2022). Load capacity factor and financial globalization in Brazil: The role of renewable energy and urbanization. Front. Environ. Sci. 689. doi:10.3389/fenvs.2021.823185
Yang, B., Jahanger, A., and Ali, M. (2021). Remittance inflows affect the ecological footprint in BICS countries: Do technological innovation and financial development matter? Environ. Sci. Pollut. Res. 28 (18), 23482–23500. doi:10.1007/s11356-021-12400-3
Yuping, L., Ramzan, M., Xincheng, L., Murshed, M., Awosusi, A. A., Bah, S. I., et al. (2021). Determinants of carbon emissions in Argentina: The roles of renewable energy consumption and globalization. Energy Rep. 7, 4747–4760. doi:10.1016/j.egyr.2021.07.065
Yurdakul, H., Kamaşak, R., and Öztürk, T. Y. (2021). Macroeconomic drivers of public private partnership (PPP) projects in low income and developing countries: A panel data analysis. Borsa Istanb. Rev.
Zameer, H., Yasmeen, H., Zafar, M. W., Waheed, A., and Sinha, A. (2020). Analyzing the association between innovation, economic growth, and environment: Divulging the importance of FDI and trade openness in India. Environ. Sci. Pollut. Res. 27, 29539–29553. doi:10.1007/s11356-020-09112-5
Zhang, C., and Lin, Y. (2012). Panel estimation for urbanization, energy consumption, and CO2 emissions: A regional analysis in China. Energy Policy 49, 488–498. doi:10.1016/j.enpol.2012.06.048
Keywords: public–private partnership investment in energy, technological innovation, trade openness, CO2 emissions, dynamic ARDL simulations, energy consumption, EKC, South Africa
Citation: Udeagha MC and Ngepah N (2023) Can public–private partnership investment in energy (PPPI) mitigate CO2 emissions in South Africa? Fresh evidence from the novel dynamic ARDL simulations approach. Front. Environ. Sci. 10:1044605. doi: 10.3389/fenvs.2022.1044605
Received: 14 September 2022; Accepted: 07 December 2022;
Published: 18 January 2023.
Edited by:
Asif Razzaq, Dalian University of Technology, ChinaReviewed by:
Abraham Awosusi, Near East University, CyprusMinhaj Ali, Islamia University of Bahawalpur, Pakistan
Copyright © 2023 Udeagha and Ngepah. This is an open-access article distributed under the terms of the Creative Commons Attribution License (CC BY). The use, distribution or reproduction in other forums is permitted, provided the original author(s) and the copyright owner(s) are credited and that the original publication in this journal is cited, in accordance with accepted academic practice. No use, distribution or reproduction is permitted which does not comply with these terms.
*Correspondence: Maxwell Chukwudi Udeagha, bWF4d2VsbHVjQHlhaG9vLmNvbQ==