
94% of researchers rate our articles as excellent or good
Learn more about the work of our research integrity team to safeguard the quality of each article we publish.
Find out more
ORIGINAL RESEARCH article
Front. Environ. Sci., 23 January 2023
Sec. Toxicology, Pollution and the Environment
Volume 10 - 2022 | https://doi.org/10.3389/fenvs.2022.1044224
This article is part of the Research TopicBiodiversity Protection and Pollution Control on the Mongolian PlateauView all 7 articles
 Kai Sun1
 Han Wang1
 Zhiyong Pei1*Haichao Wang1Xiaotian Sun1Ying Li1Guirong Sun2 Alatengsuhe2Jianjun Yang2Xiaoming Su3
The goal of this study was to investigate the soil particle-size distribution (PSD) and pore structure characteristics in the Kubuqi Desert in order to provide basic data for gaining insights into the soil-modifying properties of the local vegetation. Based on laser diffraction analysis, we measured the soil PSD and calculated the single and multi-fractal dimensions of the soils under typical artificial forest and natural grassland vegetation. The diameters, volumes and surface areas of the soil pores were determined via nitrogen adsorption experiments. The relationships between the fractal characteristics and pore structure parameters of the soil were investigated via redundancy analysis and stepwise regression. The clay content was less than 2.0%, and the sand content was greater than 75.0%. There was variability in the PSD and fractal dimension, which was mainly observed for the 0–20 cm, 20–80 cm, and 80–100 cm soil layers. In the 0–80 cm, the fine particle content, single fractal dimension (D), entropy dimension (D1), ratio of D1 to the capacity dimension (D1/D0), and correlation dimension (D2) were smaller for the forest soils than for the grassland soils. The fine particle (clay and silt) content of the 80–100 cm soil layer was approximately 37.8% higher for the Salix psammophila-8a than for the Salix psammophila-3a, and it was approximately 161.4% higher for the Populus popular-35a than for the Pinus sylvestris var. mongolica-8a. The silt content, D1, D1/D0, and D2 were significantly positively correlated with the specific surface area (SSA), total pore volume (TPV), and average pore diameter (APD) of the nanopores (p < 0.05, 0.01, or 0.001), and they were significantly negatively correlated with the percentage of the micropore volume (PMV) (p < 0.05 or 0.01). In the Kubuqi Desert, the fine particle content and fractal dimensions of the soil layer below the root zone of shrub and arbor vegetation increased with increasing stand age, but the trend was reversed in the shallower soil layers. The variability of the soil PSD characteristics was strongly correlated with the variability of the nanopore parameters on the microscopic scale, suggesting that the total pore volume, average pore diameter, and percentage of the micropore volume may be potential indicators of the soil structure and quality.
The soil particle-size distribution (PSD) refers to the proportions of fine particles of different sizes in soils and is an important physical parameter of soils (Li et al., 2021). The PSD has important effects on the soil structure (Wu et al., 2020), soil fertility (Zhang et al., 2017), water movement (Nadue et al., 2011; Wang et al., 2018), and solute transport (Hu et al., 2011). Soil pores are channels for gas, water, and nutrient transport, and they provide habitats for soil microorganisms (Hafner et al., 2016; Rabbi et al., 2018; Kravchenko et al., 2019). The soil pore structure determines the transfer of water, gas, and heat in soils and provides a suitable living space for roots and organisms (Tian, 2021). The soil pore structure is also closely related to water storage and solute transport in soils, and thus, it has a certain degree of influence on the infiltration capacity (Jia et al., 2022), surface runoff (Feeney et al., 2006; Bottinelli et al., 2015), and soil fertility (Perret et al., 2003; Tian et al., 2021). Therefore, research on the particle-size composition and pore structure characteristics of soils under different types of vegetation is important for understanding soil water and solute transport, root extension, and microbial activities and plays an important role in the rational application of artificial-forest management measures to improve water and fertilizer efficiency.
Generally, the single fractal dimension of soil particles is used to describe the integrity and uniformity of soil microstructure, and the multi-fractal dimensions of soil particles reflects the self similarity, difference and evenness of soil PSD (Wei et al., 2016; Li et al., 2021). With the increase of the single fractal dimension, the soil texture becomes thinner and the specific surface area and surface energy of solids in the soil become larger, so the soil adsorption capacity becomes stronger and the pores between particles become smaller (Siyal et al., 2009; Li et al., 2018). Vegetation communities have a good ability to improve the soil structure, but the improvement performance differs significantly with land-use type (Wu et al., 2018). The relationship between the soil fractal dimension and particle content has been examined under different vegetation and grassland types in the desertification area in the Bashang region of Hebei Province (Shen et al., 2021), the hilly area of the Loess Plateau (Wang et al., 2007), the Qinghai-Tibet Plateau (Wan et al., 2022), and the mudslide-prone area in Yunnan Province (Sha et al., 2022). The relationships between the soil fractal dimensions and the soil type, moisture content, and nutrient status have also been extensively investigated (Filgueira et al., 2006; Wei et al., 2016; Yang et al., 2021; Zheng et al., 2022). In addition, the soil pore structure truly reflects the soil structure and should be the focus of soil structure research (Sun et al., 2015; Zhou et al., 2022). Studies have demonstrated that the land use/land cover, geology, and soil layer have certain effects on the morphology, distribution characteristics, and dynamics of soil pores (Luo et al., 2010; Qiao et al., 2021). The Kubuqi Desert has a dry climate with strong aeolian activity, and the soil in this region is mainly sandy. Artificial forestation is an important ecological protection measure in this area, playing a positive role in improving the plant community and the physical structure of the soil. However, studies on the role of artificial forests in soil reinforcement and improvement are scarce, especially studies on the fractal dimension differences of soil PSDs among artificial shrubs, artificial arbors, and natural grassland vegetation communities, as well as on the relationship between the soil fractal dimension and soil pore structure.
Salix psammophila, Populus popular, and Pinus sylvestris var. mongolica have become typical tree species in the central and western regions of Inner Mongolia, especially in the Kubuqi Desert, due to their fast-growing and drought-tolerant characteristics. Focusing on the soils under these three planted tree species and the natural grassland soils in the Kubuqi Desert in the Yellow River Basin, in this study, we determined the soil particle sizes using laser diffraction and characterized the soil PSD using single and multi-fractal dimension analyses. In addition, the soil pore structure parameters were determined using the ring sampler method and nitrogen adsorption experiments. The particle size and porosity characteristics of the soil, as well as their mutual relationship, under the different vegetation types in the desert were investigated to understand the influences of vegetation type and age on the particle composition and pore structure of the soil and to gain insights into the underlying fractal mechanism. The findings of this study provide support for optimizing the selection and configuration of vegetation types for soil and water conservation in the Kubuqi Desert.
The study area was located at the Caositan Forest Protection Station (110°39′14″E, 40°14′24″N, altitude of 1,012 m) of the Gouxinzhao branch of the Ordos Afforestation General Field, Dalat Banner, Inner Mongolia Autonomous Region. The distributions of the vegetation resources, elevation gradient, and slope size are shown in Figure 1. This area has a temperate continental monsoon climate, with an annual mean temperature of 6.1°C and an annual mean precipitation of 297.3 mm. According to the Chinese soil classification system, the soils are predominantly meadow aeolian soil (Xu, 2019). Aeolian sandy soil has a high sand content, coarse texture, decentralized structure, and poor water and fertilizer conservation. Aeolian sandy soil is developed from aeolian sand parent material, and its formation can be attributed to the interaction of wind erosion, sand pressure, leaching, biological soil reinforcement, and nutrient accumulation processes. The aeolian sandy soil has a weak soil-forming process, which is often interrupted by wind erosion and sand pressure, and the process is also seriously affected by wind erosion and re-accumulation (Desert Laboratory, 1978). Regarding the deep water in the soil, the loss is large and the utilization efficiency is low, and the soil is very prone to water erosion and wind erosion (Wang et al., 2006).
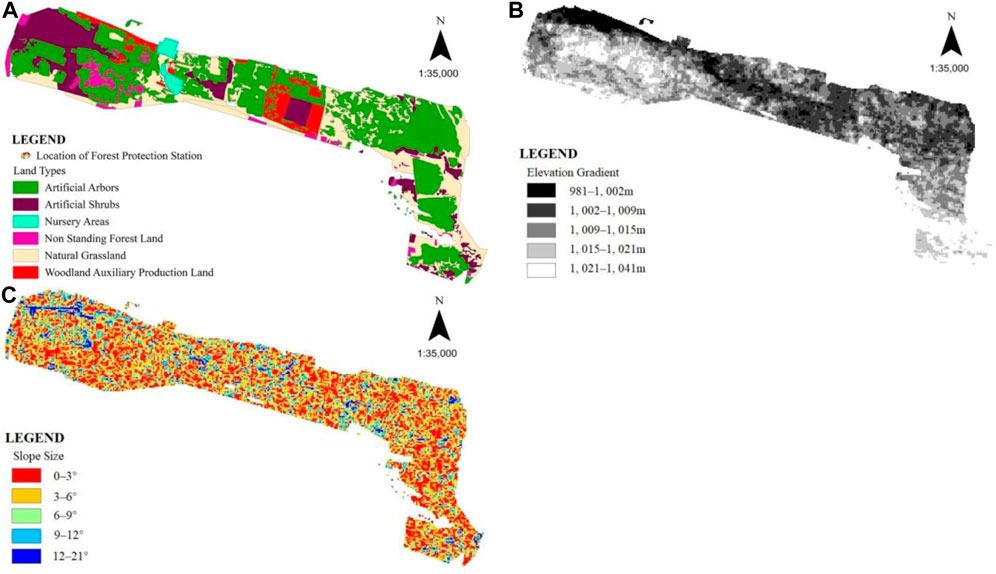
FIGURE 1. Distributions of (A) vegetation resources, (B) elevation gradient, and (C) slope size in the Caositan Forest Protection Station.
The main tree species in the artificial forests in the study area are Salix psammophila, Populus popular, and Pinus sylvestris var. mongolica. The herbaceous vegetation under the trees is mainly annual vegetation, while the natural grasslands are dominated by perennial species. In this study, soil samples were collected at different depths in typical soil profiles of the shrubs, arbors, and natural grasslands of different ages in the Kubuqi Desert. The basic characteristics of the vegetation sample plots are presented in Table 1. The leaf area index was measured using a LAI-2200C plant canopy analyzer (United States).
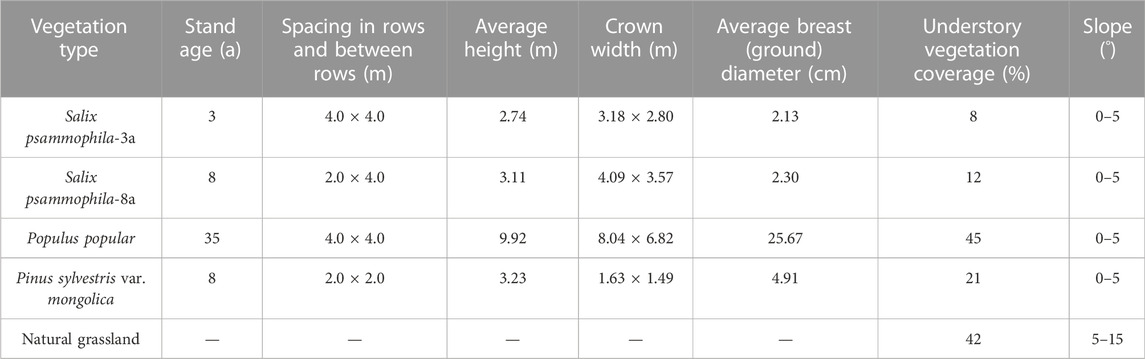
TABLE 1. General characteristics of the vegetation sample plots.
The soil samples were collected in early August 2021. Specifically, a 40 m × 36 m test plot with uniform and good vegetation growth was randomly selected for each vegetation type (three test plots were set up for each vegetation type). For the artificial forest, the soil sampling profiles were randomly set between adjacent forest stands, and the distance between each soil profile and the adjacent forest stand was 45 cm (Figure 2). Three standard trees (12 in total) separated by 10–20 m were randomly selected in each test plot to provide three soil profiles for layered soil sampling. For the soil sampling in the natural grasslands, three soil profiles separated by 10–20 m were randomly selected within the test plot.
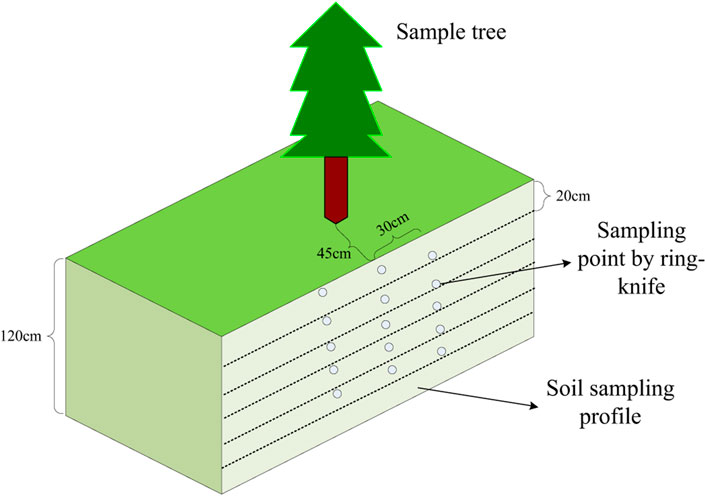
FIGURE 2. Schematic diagram of soil profile sampling.
Considering the groundwater table in the study area and the distribution of the main root systems of the three typical species investigated, in this study, the soil sampling was limited to a depth of 100 cm. The soil samples were collected at 0–20, 20–40, 40–60, 60–80, and 80–100 cm, using a 100 cm3 ring sampler. Three soil samples were randomly collected from each layer with a spacing of 30 cm and were mixed together. An appropriate amount for particle size analysis was transported to the soil physics laboratory of Inner Mongolia Agricultural University. Before the analyses, the soil samples were pre-treated according to the method described by Gao et al. (2021). The soil particle composition was determined using a laser diffraction particle size analyzer (RODOS/M, Germany), and the proportions of the soil particle size fractions were calculated according to the United States Department of Agriculture (USDA) soil texture classification standard.
The soil pore structure properties were determined using the ring sampler method and the nitrogen adsorption method. Under a given vegetation type, the porosity of the soil samples collected using the ring sampler was calculated using the bulk density for each plot, and then, the average for the three soil profiles was taken as the final result. The nanopore structure parameters were determined using a specific surface area analyzer (GeminI VII 2390, United States). The soil samples were also subjected to nitrogen adsorption measurements after mixing the soil samples of the three different profiles for a given vegetation type and then pre-treating the mixture according to the method described by Wang T. et al. (2021).
In this study, the soil particle size was classified into seven categories according to the USDA soil texture classification standard, i.e., clay (< 2 μm), silt (2–50 μm), very fine sand (50–100 μm), fine sand (100–250 μm), medium-sized sand (250–500 μm), coarse sand (500–1000 μm), and very coarse sand (1,000–2,000 μm). A fractal model of the soil particle size was used to calculate the single fractal dimension (Mao et al., 2018; Wan et al., 2022) as follows:
In Eq. 1, Ri is the arithmetic mean of the upper and lower limits of a particle size interval (μm), Rmax is the largest particle size in the soil particle size classification (μm), V(r<Ri) is the cumulative volume of soil particles with a particle size smaller than Ri (cm3), VT is the total volume of the soil particles (cm3), and D is the single fractal dimension of the soil particles. In particular, D is a measure of the coarseness of the soil texture. That is, a decrease in D is indicative of an increase in the coarseness of the soil texture, which in turn leads to a decrease in the soil stability and a decrease in the water and fertilizer retention capacity of the soil (Lan, 2020; Zheng et al., 2022).
In this paper, the particle size range I for the laser diffraction measurement is set to [0.02, 2000]. This range is divided into 100 intervals Ii = [φi, φi+1], where i = 1, 2, 3, ⋯, 100, and the intervals are equal to one another after logarithmic transformation of the particle size. The volume fraction of the soil particles within each interval Ii is denoted as vi, where i = 1, 2, 3, ⋯, 100, and thus,
Since lg(φi+1/φi) is a constant, in order to analyze the PSD characteristics of range I using the multi-fractal method, each interval should have the same length. Therefore, a new dimensionless range J = [lg(0.02/0.02), lg (2000/0.02)] = [0,5] is constructed. The range J can be divided into N(ε) = 2k intervals of the same small length, ε = 5 × 2−k, with each covering at least one measurement value. Since the smallest interval must contain a measurement value, the positive values of integer k are 1–6. If pi(ε) is the probability density of the PSD in each interval, then the generalized multi-fractal dimension of the PSD is
The generalized multi-fractal dimension D(q) can be obtained using Eqs. 3, 4. In this paper, only D0, D1, and D2 are discussed (q = 0, 1, 2, respectively), which are known as the capacity dimension (i.e., the box-counting dimension), the entropy dimension, and the correlation dimension, respectively. D0 reflects the range of the soil PSD, with a larger value indicating a wider PSD range. The larger the value of D1 is, the higher the heterogeneity of the PSD is. D2 describes the uniformity of the measured values among the intervals, with a larger value indicating a more uniform PSD. D1/D0 describes the degree of concentration of the PSD, with values closer to 1 indicating a more concentrated PSD in a dense area (Wang et al., 2018; Yang et al., 2022).
The presence of a large number of nanometer size pores (hereinafter referred to as nanopores) in a soil is indicative of the diffusion of ions or some pollutants (Ling, 2021). Using a specific surface area (SSA) analyzer, the amount of nitrogen absorbed by the nanopores of a given soil sample can be determined and an adsorption isotherm can be plotted. After that, the soil SSA can be calculated using the Brunauer-Emmett-Teller (BET) multilayer adsorption theory and Eq. 5. The average pore diameter (APD), total pore volume (TPV), and pore diameter distribution can be calculated from the area according to the Barrett-Joyner-Halenda (BJH) method and the Kelvin equation (Lun, 2020). The basic principles are demonstrated by Eqs. 6–9 (Pan, 2015; Lun, 2020).
In Eq. 5, p is the adsorption pressure (kPa), p0 the saturated vapor pressure of the adsorbent (kPa), Q the volume of nitrogen adsorbed by the sample (cm3·g−1), Qm is the monolayer saturated adsorption volume (cm3·g−1), and c is the BET constant.
In Eq. 6, Vp is the pore volume (cm3·g−1), rp the pore radius (nm), rk is the capillary radius (nm), ∆dn is the change in the thickness of the desorption layer (nm), ∆Qn is the change in the volume of the desorption layer (cm3·g−1), and Sj is the area of the desorption layer (m2·g−1). Moreover, the following relationship holds true:
According to the International Union of Pure and Applied Chemistry (IUPAC), nanopores can be divided into three size categories: macropores (>50 nm), mesopores (2–50 nm), and micropores (<2 nm). The percentage of the micropore volume (PMV), which is defined as the ratio of the micropore volume to the total pore volume, is often used as an important index to characterize the nanopore structure (Sun, 2015).
Comparisons of means were performed using one-way analysis of variance (ANOVA) designed for a randomized block trial of five soil layers with five vegetation types (ST, SE, PP, PS, and NG) (Table 2 and Figures 3–5). The three blocks (soil sampling profiles) entered the statistical model as a random factor. The assumptions of normality and homogeneity of variances were tested using the Shapiro-Wilk and Levene’s tests, respectively, prior to the ANOVA test. For all of the statistical tests, significance was defined as when p < 0.05. The above statistical calculations were performed using SPSS ver. 25 (IBM® SPSS® Statistics). Correlation analysis was performed on the soil fractal dimensions, PSD, and pore parameters (Figure 8). The statistical calculations and graphing were performed using R ver. 4.0.1 (R®). Redundancy analysis (RDA) and correlation analysis were performed on the soil PSD and pore structure parameters with respect to the fractal dimensions (Figure 9). The statistical calculations and graphing were performed using Canoco ver. 5.02 (R®). Processing and graphing of other data were performed using Excel ver. 2016 (Microsoft® Excel®) and Origin ver. 2019 (OriginLab® Origin®) software packages.
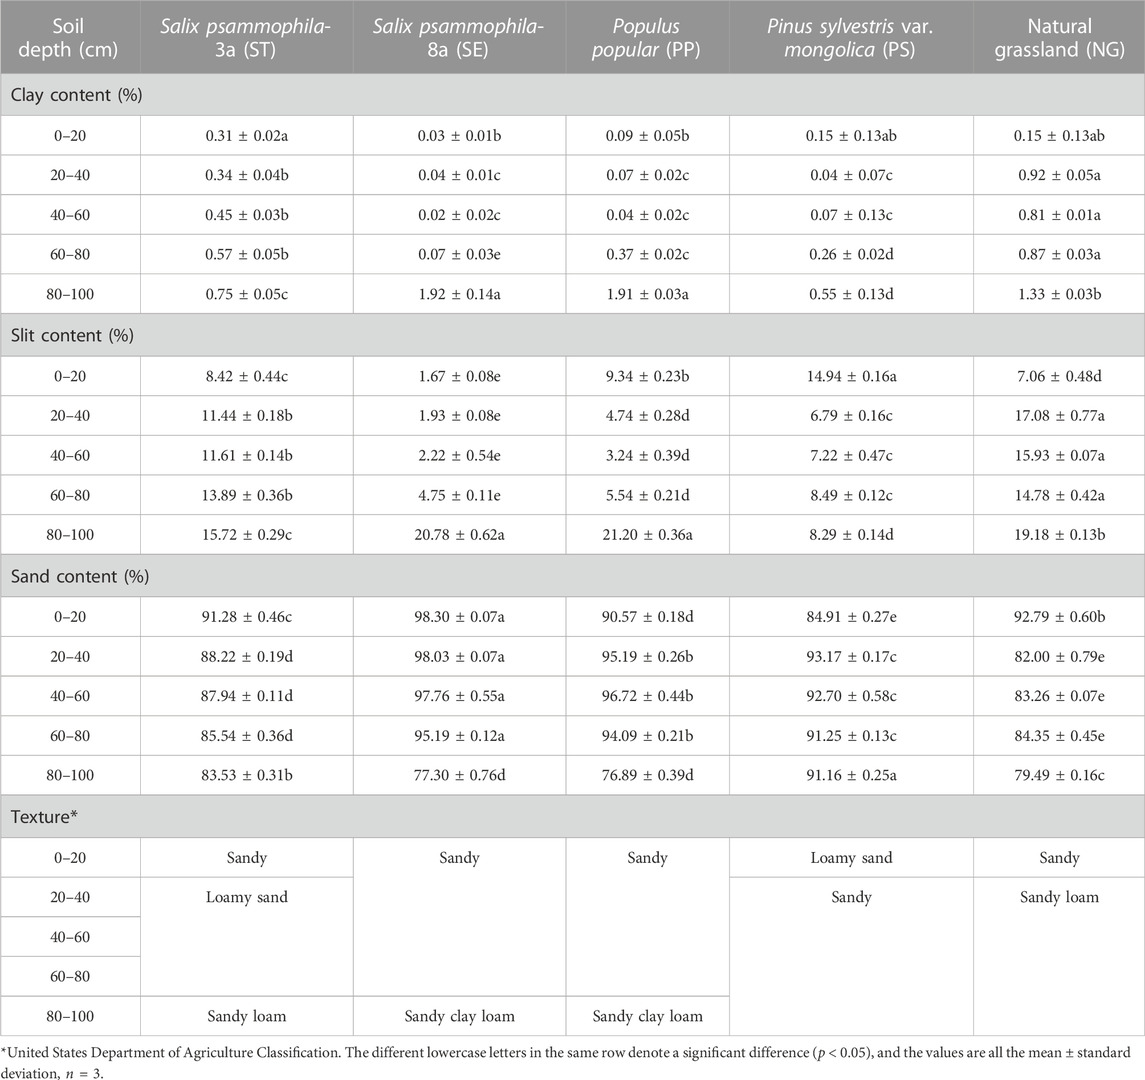
TABLE 2. Soil particle composition under different vegetation types.
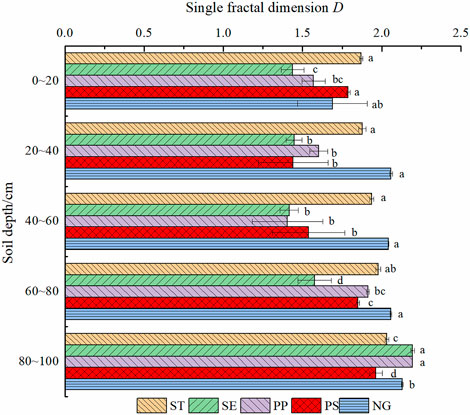
FIGURE 3. Single fractal dimension of different soil layers under Salix psammophila-3a (ST), Salix psammophila-8a (SE), Populus popular (PP), Pinus sylvestris var. mongolica (PS), and natural grassland (NG).
As is shown by the soil particle-size composition under the different vegetation types (Table 2), the soil particle size components in the study area in the Kubuqi Desert differed significantly in terms of the particle size fraction. The sand particles had the highest volume fractions among all of the particle size fractions, ranging from 76.89% to 98.30%. The silt particles accounted for the next largest volume fraction, ranging from 1.67% to 21.20%; while the clay particles accounted for only 0.02%–1.92% of the total volume. Duncan’s test revealed that for the 0–20 cm soil layer, the contents of both the silt and sand particles differed significantly (p < 0.05) among the different vegetation types, increasing in the order of Salix psammophila-8a (SE) < natural grassland (NG) < Salix psammophila-3a (ST) < Populus popular (PP) < Pinus sylvestris var. mongolica (PS) and PS < PP < ST < NG < SE, respectively. For the 20–80 cm soil layer, the contents of the fine particles (clay and silt) were lower in the different types of artificial forest soils than in the natural grassland soils and increased with increasing depth for all of the artificial forest soils. Under the same vegetation type, the fine particle content varied greatly among the 0–20 cm, 20–80 cm, and 80–100 cm soil layers, with coefficients of variation (CV) of 30.5%–176.0%.
Each fractal dimension (D) of the different soil samples under each vegetation type was compared (Figure 3). The following observations were obtained from the difference significance test of the D values for the different vegetation types. The D values of ST and PS were significantly higher than those of SE and PP in the 0–20 cm soil layer (p < 0.05). The D values of ST and NG were significantly higher than those of SE, PP, and PS in the 20–40 and 40–60 cm soil layers (p < 0.05). The D value of NG was significantly higher than those of PP, PS, and SE in the 60–80 cm soil layer (p < 0.05). The D values of SE and PP were significantly higher than those of NG, ST, and PS in the 80–100 cm soil layer (p < 0.05). In addition, there was a certain degree of variability in the D values among the 0–20 cm, 20–80 cm, and 80–100 cm soil layers under each vegetation type, with CV values of 4.2%–26.4%.
The multi-fractal dimensions of the soil PSD of the different soil layers under each vegetation type were compared (Figure 4). The results showed that the changes in the capacity dimension D0 were largely insignificant (p > 0.05) among the different vegetation types and among the different soil layers under the same vegetation type. In contrast, the entropy dimension D1 increased in the order of SE < NG < PP < ST < PS for the 0–20 cm soil layer. Both the D1/D0 ratio and the correlation dimension D2 increased in the order of SE < NG < ST < PP < PS. For the 20–80 cm soil layer, D1, D1/D0, and D2 increased in the order SE < PP < PS < ST < NG. There were significant differences in the D1, D1/D0, and D2 of the 20–40 cm, 40–60 cm, and 60–80 cm soil layers among the vegetation types (p < 0.05), except for SE vs. PP for D1 for the 60–80 cm soil layer and ST vs. NG for D2 for the 60–80 cm soil layer (p > 0.05). For the 60–80 cm soil layer, both D1 and D1/D0 increased in the order of PS < ST < NG < PP < SE, and D2 increased in the order of PS < ST < PP < SE < NG. Moreover, there was a certain degree of variability in the multiple fractal dimension among the 0–20 cm, 20–80 cm, and 80–100 cm soil layers under each vegetation type, with D1 having CV values of 4.0%–17.3%, D1/D0 having CV values of 4.1%–17.2%, and D2 having CV values of 3.6%–13.7%.
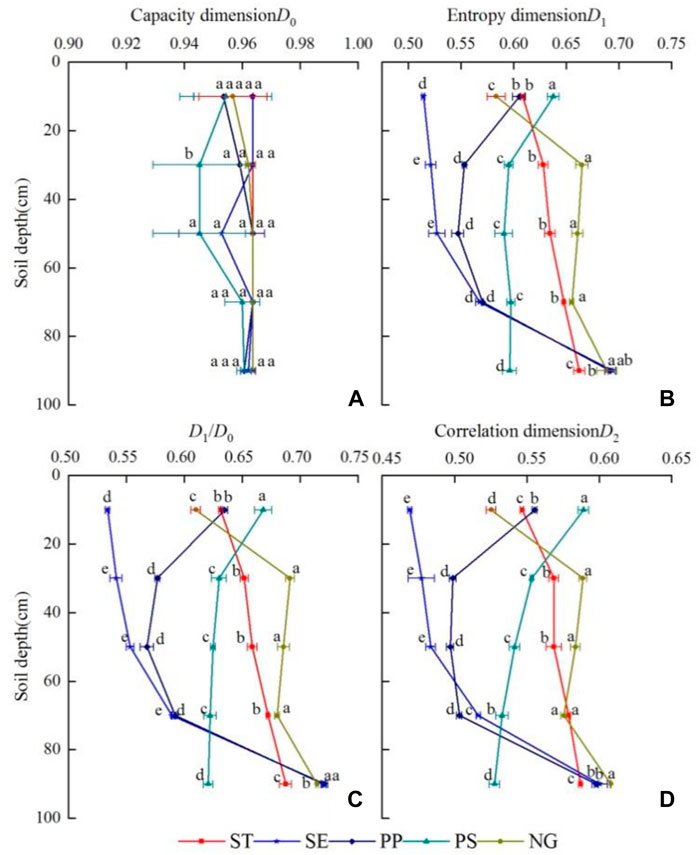
FIGURE 4. Multi-fractal dimensions: (A) capacity dimension (D0), (B) entropy dimension (D1), (C) D1/D0, and (D) (correlation dimension (D2) of different soil layers under each vegetation type.
Bulk density tests were performed on samples of the different soils using the ring sampler method. The measured soil porosities of the different soil layers under each vegetation type are presented in Figure 5. For both the 0–20 cm and 20–80 cm soil layers, the soil porosity increased in the order of SE < PP < ST < PS < NG. For the 80–100 cm soil layers, the porosity increased in the order of SE < PP < PS < ST < NG. Additionally, the CV of the soil porosity among these soil layers under each vegetation type varied from 4.0% to 8.9%. Moreover, the porosity of each soil layer in the artificial forests was lower than that in the natural grasslands, and it decreased with increasing stand age.
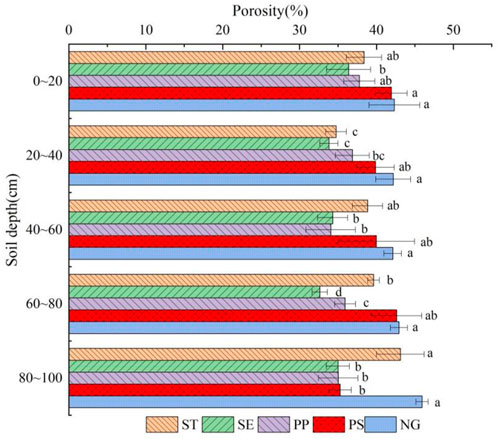
FIGURE 5. Porosity of different soil layers under each vegetation type.
The nitrogen adsorption isotherms of the soil samples under each vegetation type are shown in Figure 6. The final nitrogen adsorption volume of the soil nanopores in the standard state was compared among the different vegetation types. For the 20–80 cm soil layer, the adsorption volume increased with increasing depth under the same vegetation type. The CV of the adsorption volume among the above soil layers under each vegetation type was 17.2–49.3%.
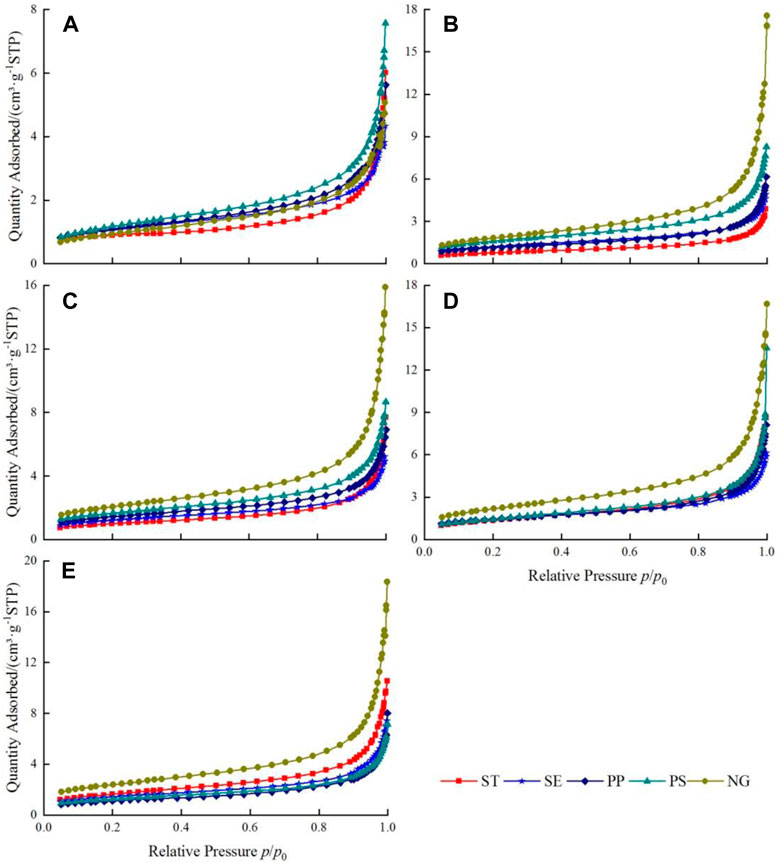
FIGURE 6. Isothermal adsorption curves for the (A) 0–20 cm, (B) 20–40 cm, (C) 40–60 cm, (D) 60–80 cm, and (E) 80–100 cm soil layers under each vegetation type.
The soil nanopore parameters were determined (Figure 7). There was great variability between the vegetation types. For most of the soil layers, the SSA increased in the order of ST < SE < PP < PS < NG; the TPV increased in the order of SE < ST < PP < PS < NG; the APD increased in the order of SE < PP < ST < PS < NG; and the PMV increased in the order of NG < PS < ST < PP < SE. The SSA, TPV, and APD for the 20–100 cm soil layer in the artificial forest were lower than those of the grassland, while the PMV was generally higher than that of the grassland. In addition, the SSA, TPV, and APD increased with increasing depth under the same vegetation type, while the PMV decreased.
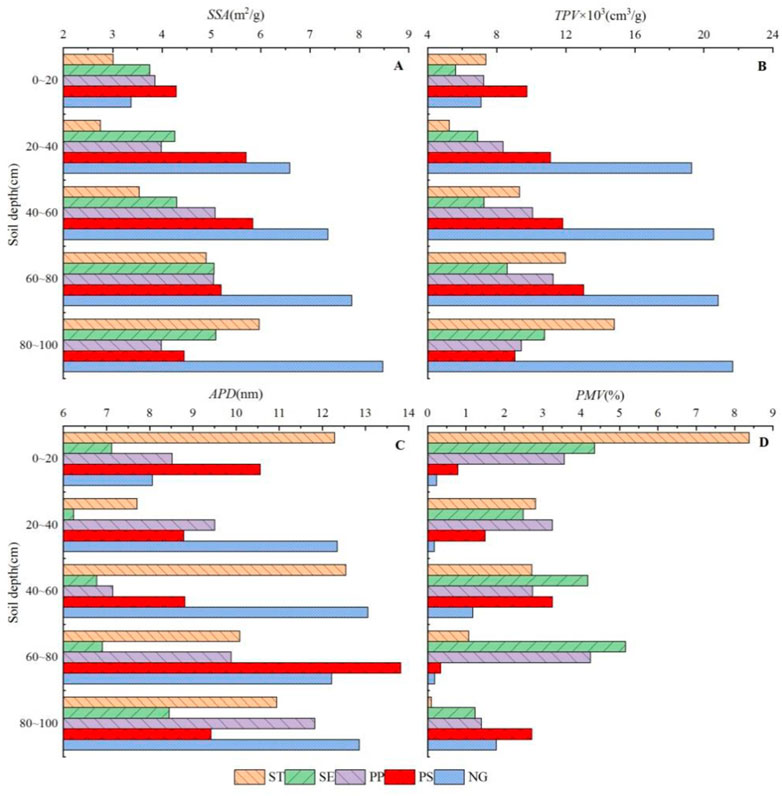
FIGURE 7. Nanopore parameters: (A) BET surface area (SSA), (B) BJH adsorption total pore volume (TPV), (C) average pore diameter (APD), and (D) percentage of micropore volume (PMV) of different soil layers under each vegetation type.
Correlation analysis was performed on the soil particle size composition and fractal dimension with respect to the pore structure parameters (Figure 8). The results revealed that the clay, silt, and sand contents of the soil were highly significantly correlated with D, D1, D1/D0, and D2 (p < 0.001). The clay content and D were only significantly correlated (p < 0.05) with some of the pore structure parameters investigated; while the silt content, D1, D1/D0, and D2 were significantly correlated (p < 0.05) with all of the pore structure parameters. The clay and silt contents, D, D1, D1/D0, and D2 were all positively correlated with the P, SSA, TPV, and APD and were negatively correlated with the PMV. In contrast, the sand content was negatively correlated with the P, SSA, TPV, and APD and was positively correlated with the PMV. In addition, there were significant positive correlations (p < 0.05) between between APD and P, SSA, and TPV; while PMV was negatively correlated with the other pore structure parameters.
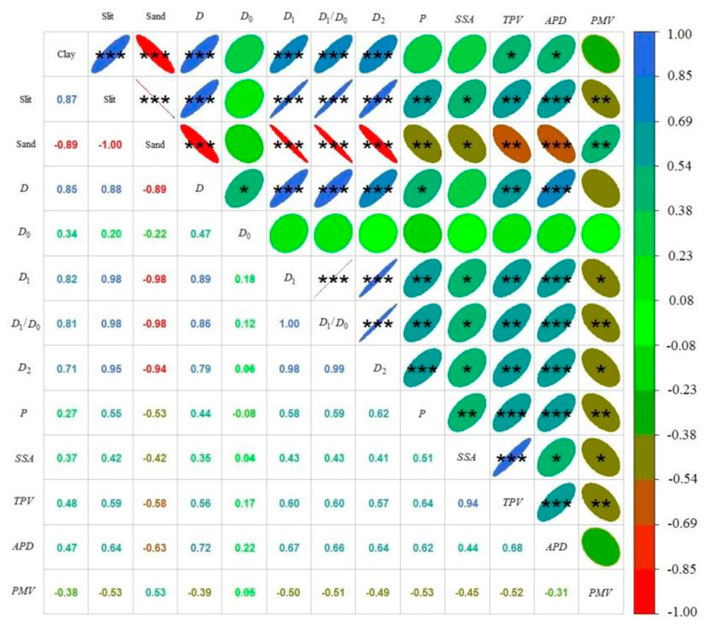
FIGURE 8. Correlations between the soil PSD and pore characteristics. Blue indicates a positive correlation, red indicates a negative correlation, * indicates a significant correlation at the 0.05 level (p < 0.05), ** indicates a significant correlation at p < 0.01, *** indicates a significant correlation at p < 0.001. The eccentricity of the ellipse and the color indicate the intensity of the correlation.
As shown in Figure 9, the soil PSD and pore structure parameters explained 90.43% of the total variation in the soil fractal dimensions, with 88.87% explained by the first category of typical variables and 1.56% explained by the second category. The sand content, APD, clay content, and TPV explained the total variation in the soil fractal dimensions, accounting for 80.7%, 3.8%, 3.2%, and 1.7%, respectively. In particular, the clay content had the greatest impact on D, APD had the greatest impact on D0, the silt content had the greatest impact on both D1 and D1/D0, and the sand content had the greatest impact on D2. The stepwise regression (Table 3) analysis revealed that the clay content, sand content, and APD jointly explained 84.8% of the total variation in D. The silt content independently explained 96.6% of the total variation in D1 and was the main factor controlling D1. Moreover, the silt content and sand content jointly explained 96.5% of the total variation in D1/D0 and 95.8% of the total variation in D2, indicating that they were both the main controlling factors of D1/D0 and D2. The coefficients of determination (R2) of D1, D1/D0 and D2 regression models is superior to the models proposed by Wan et al. (2022).
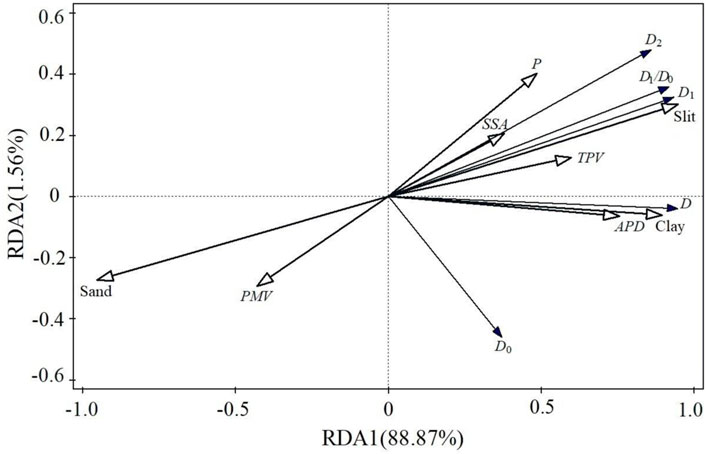
FIGURE 9. Redundancy analysis (RDA) of soil fractal dimensions, PSD, and pore parameters.
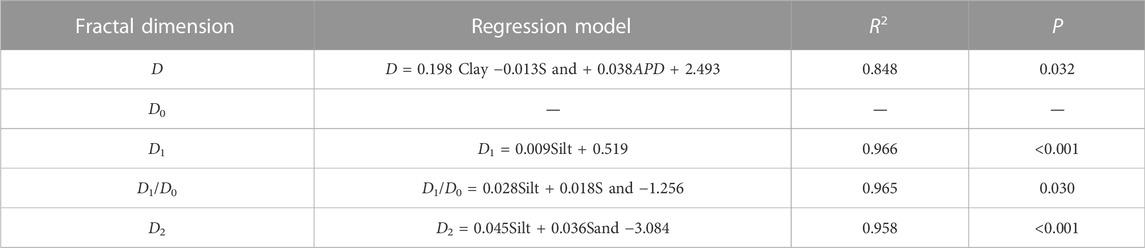
TABLE 3. Stepwise regression models of soil fractal dimensions, PSD, and pore parameters.
The study area was located in the northeastern edge of the Kubuqi Desert, which has a dry climate with strong aeolian activities. The fine particles are easily lost, and the soils are gradually coarsened under wind erosion. In addition, the planting of a forest can change the soil PSD by affecting the hydrothermal conditions, microbial activity, and pore characteristics of the soil (Wang K. et al., 2021). The sand fraction had the highest volume fraction in the artificial forest and grassland soil samples, while the silt and clay fraction had a relatively low volume. The main soil textures were sandy soil, loamy sandy soil, sandy loam, and sandy clay loam (Table 2). Similar results were reported in a previous study on potato soils in the same region (Chen, 2021). These results can be explained by the fact that the study area is located in a desertification zone where the soil-forming parent material is mainly derived from aeolian deposits, and the soil texture is loose and dominated by meadow aeolian soils.
In this study, the impact of the soil layer on the soil PSD under the different vegetation types was also investigated. The differences in the soil particle-size compositions under the different vegetation types were mainly observed in the 0–20 cm, 20–80 cm, and 80–100 cm soil layers. In particular, the differences observed in the 0–20 cm layer were mainly attributed to water and wind erosion, litterfall, and tillage, while the soil PSD of the 20–80 cm layer was easily affected by leaching. For NG, the significantly higher sand content in the 0–20 cm soil layer compared with the other soil layers may be due to the higher slope of the sample site and thus the higher susceptibility to wind erosion (Table 1; Figure 1C), which caused the fine particles at the surface to be retained on the gentle slopes; while they were removed, leaving coarse particles, on the steeper slopes (Guo et al., 2022). The two arbor species PS and PP had a high understory vegetation coverage (Table 1) with a substantial amount of litterfall accumulated over the years, which increased the soil organic matter content, which supports the formation of fine soil particles (Wan et al., 2022), thereby leading to higher clay and silt contents in the surface soils than in the deep soils. For ST and SE, the differences in the sand content were small between the surface and deep soils, which may be due to the low amount of litterfall resulting from the low vegetation coverage and short growth period, as well as the annual tillage and weeding in Salix psammophila forests, which led to vertical mixing of the soils and thus soil homogenization (Ding et al., 2010). For the 80–100 cm soil layers, the sand content under each vegetation type exhibited a decreasing trend compared with the 20–80 cm soil layer, indicating that more fine particles such as clay and silt were deposited in the 20–80 cm soil layer. Such accumulation may be related to the local precipitation and strong wind erosion. Due to the small amount of local precipitation, the maximum depth of the vertical water migration is 80–100 cm. Precipitation causes rapid weathering and disintegration of coarse particles in the soil surface layer and downward leaching of clay and silt particles from the shallow soil layer, which enter the deeper soil layers with the precipitation infiltration or are lost to surface runoff (Tuo et al., 2012; Sha et al., 2022). In particular, the sand contents of the SE and PP soils in the 20–80 cm soil layer differed by approximately 20% from those in the 80–100 cm soil layers (Table 2), possibly because the stand ages of these two types of vegetation are large and many macropores formed in the 0–80 cm soil layer, and thus are prone to vertical preferential flow (Ma et al., 2022), which is conducive to vertical soil water movement and the leaching of fine particles. Moreover, the top-down leaching process of fine particles was further verified by the increase in the fine particle content with increasing soil depth in the 20–80 cm soil layer under each artificial vegetation type.
The effect of the vegetation type on the soil particle-size composition was investigated. For the artificial shrub species (Salix psammophila) and arbor species (Populus popular and Pinus sylvestris var. mongolica) of different ages, their soils had higher sand contents than the natural grassland soils in the 0–100 cm depth interval, except for some soil layers. However, they had lower fine particle (clay and silt) volume fractions than the natural grassland soils throughout the 0–100 cm depth interval, which was similar to previous findings (Xia et al., 2020; Shen et al., 2021; Sha et al., 2022), indicating that the grasslands outperform the artificial forests in making soils finer. It is generally accepted that the main cause of the fining of soils is that compared with natural grasslands, the vegetation community of forest land is more diverse and contains better-developed root systems, thus allowing for stronger adhesion of small particles and more retention of soil water, facilitating the formation of stable soil aggregates. Furthermore, a forest can promote the agglomeration of small soil particles into larger soil particles to enhance soil erosion resistance (Li et al., 2020; Shen et al., 2021). The results of this study suggest that the degree of root development affects the strength of the fine particle leaching, which may be another important reason for the differences in the soil particle-size compositions under the different vegetation types. The effect of the age of the artificial forest on the soil particle size composition was further examined. For the typical artificial shrub and arbor species in the test area, the fine particle content of the 0–80 cm layer, which were mainly distributed by the vegetation roots, decreased with increasing stand age (Table 2). These findings are inconsistent with the results of Sha et al. (2022), who reported that as the stand aged, the effect of the vegetation on the soil particle size composition gradually became more obvious, manifesting as a continuous increase in the clay and silt contents. This discrepancy may be due to the difference in the soil textures in the different study areas. The earlier study was conducted on silt loam in the hilly area of the Loess Plateau, which is less susceptible to leaching because of its fine texture; while in this study the root systems of both shrubs and arbors developed with increasing stand age, and the root system of Salix psammophila was better developed than that of Pinus sylvestris var. mongolica of the same age. Therefore, the fine particles in the 0–80 cm soil layer of the coarse soils were leached to the 80–100 cm soil layer due to years of precipitation, leading to a significantly higher fine particle content in the 80–100 cm soil layer. It was also observed in this study that for the soils under both the shrubs and arbors, the fine particle content of the 80–100 cm soil layer increased with increasing stand age (Table 2), further substantiating the above conclusion.
Several studies have reported that there is a significant strong correlation between the soil fractal dimension and PSD (Wang et al., 2007; Shen et al., 2021; Wan et al., 2022). In this study, correlation analysis between the soil fractal dimension and the PSD was performed on the sandy soils with clay content of less than 2.0% and sand contents of greater than 75.0%, and observations similar to those described above were made (Figure 8).
As was previously mentioned, both the vegetation type and soil layer had a strong influence on the PSD. Therefore, the influences of the vegetation type on the single fractal dimension D, capacity dimension D0, entropy dimension D1, D1/D0, and correlation dimension D2 were analyzed for each soil layer. First, D0 can be used as a fractal dimension for soil texture classification (Guan et al., 2011), and the small differences in the D0 values of the soils under the different vegetation types in this study indicate that the basic soil texture did not vary with the vegetation type, which is similar to the conclusion of Su et al. (2018). Second, the fractal dimensions in the 0–20 cm soil layer, except for D0, decreased with increasing stand age for both the artificial shrubs and arbors, which was related to the susceptibility of the surface soils to fine particle leaching. That is, with precipitation over a long-term period, the surface soil texture gradually coarsens, which reduces the uniformity and increases the dispersion of the soil PSD (Guo et al., 2022). In the 20–80 cm soil layer and for each artificial vegetation type, the soil fractal dimension had the same trend with respect to the stand age as in the 0–20 cm soil layer; while the soil fractal dimensions of the natural grasslands were all greater than their counterparts under the artificial forests. This is probably because the roots of herbaceous vegetation are less distributed in this soil layer, which weakens the cohesion and leaching of the soil particles (Wang J. et al., 2021). Therefore, the volume percentage of the silt and clay in this soil layer is higher than that under the artificial forests, thereby leading to the finer soil texture and more uniform soil PSD under the grassland. In the 80–100 cm soil layer, each artificial vegetation type had significantly higher soil fractal dimensions than in the other soil layers, and the soil fractal dimensions of the shrubs and arbors increased with increasing stand age. In contrast, the grasslands did not have significantly different soil fractal dimensions compared with the other soils layers, further verifying the impact of leaching on the soil fractal dimension. These observations reveal that for the soils in the study area in the Kubuqi Desert, the stand age of the artificial forest has a promoting effect on the fining of the soil texture and the uniformity of the soil PSD in the soil layers below the root zone, while the opposite effect was observed in the root zone.
It is generally accepted that the main functional structure of soil pores is on the micron scale, i.e., mainly considering micron-sized and larger soil pores. In this study, the soil pore characteristics were expressed in terms of the porosity P, and the structural properties of the nanopores were subjected to extended analysis based on the methods of the Soil Science Society of America (Cameron et al., 2006). The adsorption isotherms of each soil sample (Figure 6) show that there was strong variability in the size and distribution of the nanopores among the different vegetation types and soil layers.
Figure 8 shows that the soil PSD and fractal dimensions were highly correlated with both the P and nanopore characteristics. This is attributed to the fact that the differences in the silt and sand contents and in the parameters D1, D1/D0, and D2 can cause variations in the surface area, pore size, and distribution of the soil particles (Naglic et al., 2014; Xu, 2019). That is, fining of the soil texture would lead to increases in the solid SSA, surface energy, and adsorption capacity of the soil, and a decrease in the intergranular pore size, leading to variations in the soil pore structure parameters. The soil pore structure is an important indicator for soil quality assessment (Tian, 2021). As is suggested by the strong correlations between the soil PSD characteristics and the SSA, APD, TPV, and PMV, the nanopore parameters are potential indicators of the soil structure and quality and can reflect the variability of the soil structure properties from a microscopic perspective.
The redundancy analysis (Figure 9) revealed that the soil PSD characteristics and pore structure parameters jointly explain the variations in the soil fractal dimensions among the different vegetation types. The sand content, APD, clay content, and TPV explain a large fraction of the variation in each type of fractal dimension. The stepwise regression analysis (Table 3) revealed that the clay, silt, and sand contents and the APD were the main factors controlling the soil fractal dimensions under the different vegetation types. In addition to the soil particle content (Wan et al., 2022), we propose that the average pore size of the soil nanopores may also serve as a main controlling factor of the soil fractal dimension and should be included in the regression model of the soil fractal dimensions. The goodness-of-fit of the regression model was higher and R2 ranged from 0.848 to 0.966.
The particle size compositions, fractal dimensions, and pore structure characteristics of the soils under different vegetation types in the northeastern margin of the Kubuqi Desert were examined using fractal theory, nitrogen adsorption experiments, and correlation analysis. The main conclusions of this study are as follows.
(1) The variations in the soil particle size distributions and fractal dimensions under the various vegetation types were mainly observed in the 0–20 cm, 20–80 cm, and 80–100 cm soils layers. The content of the fine particles (clay and silt) tended to increase with increasing depth for all of the artificial forest soils. The specific surface area, total pore volume, and average pore diameter of the nanopores increased with increasing depth, while the percentage of the micropore volume decreased.
(2) For the aeolian sandy soil in the study area, the contents of the fine particles were lower in the different types of artificial forest soils than in the natural grassland soils. The fine particle content in the root distribution area of the typical shrubs and arbors tended to increase with increasing stand age, while it tended to decrease under the root distribution area. The porosity of the soil layers was lower in the artificial forests than in the natural grasslands, and it decreased with increasing stand age. For the soil nanopores under the surface layer, the specific surface area, total pore volume, and average pore diameter of the artificial forest were also lower than those of the grassland, while the percentage of the micropore volume was generally higher than that of the grassland.
(3) The soil particle size distributions and major fractal dimensions were not only significantly correlated with the porosity but were also highly significantly or significantly correlated with the total pore volume, specific surface area, average pore diameter, and percentage of the micropore volume of the nanopores. In addition, they may be able to serve as explanatory regression variables to explain the variability of the fractal dimensions. Therefore, the micropore structure parameters may serve as a potential indicator of the soil structure.
The main disadvantage of this study is that it only focused on the impact of vegetation on the particle size distribution and porosity of aeolian sandy soil, and the impact of the soil parent material and formation of the different soil layers were not considered in the soil sampling. It is suggested that the soil be sampled by genetic horizon in future research to fully consider the impact of the soil development on the soil samples.
The raw data supporting the conclusions of this article will be made available by the authors, without undue reservation.
ZP, HW, and GS conceived and designed the experiments; HW, SA, and JY performed the experiments; and XS, YL, and XS analyzed the data.
This study was jointly supported by the Major Science and Technology Projects of Inner Mongolia Autonomous Region (2020ZD0009), the National Natural Science Foundation of China (52069018), Science and Technology Plan Project of Inner Mongolia Autonomous Region (2020GG0078), Inner Mongolia Natural Science Foundation (2020MS03009), and the Science and Technology Project of Inner Mongolia (No. 2022YFDZ0021).
The authors declare that the research was conducted in the absence of any commercial or financial relationships that could be construed as a potential conflict of interest.
All claims expressed in this article are solely those of the authors and do not necessarily represent those of their affiliated organizations, or those of the publisher, the editors and the reviewers. Any product that may be evaluated in this article, or claim that may be made by its manufacturer, is not guaranteed or endorsed by the publisher.
Bottinelli, N., Jouquet, P., Capowiez, Y., Podwojewski, P., Grimaldi, M., and Peng, X. (2015). Why is the influence of soil macrofauna on soil structure only considered by soil ecologists? Soil Tillage Res. 146, 118–124. doi:10.1016/j.still.2014.01.007
Chen, J. H. (2021). Study on wind erosion characteristics of cultivated soil in sandy potato irrigation. Hohhot: Inner Mongolia Agricultural University. doi:10.27229/d.cnki.gnmnu.2021.000455
Ding, M., Pang, J. L., Liu, Y. X., and Chu, Y. B. (2010). Fractal characteristics of soil particles under different land use methods on the Loess Plateau. J. Arid Land Resour. Environ. 24 (11), 161–165. doi:10.13448/j.cnki.jalre.2010.11.024
Feeney, D. S., Crawford, J. W., Daniell, T., Hallett, P. D., Nunan, N., Ritz, K., et al. (2006). Three-dimensional microorganization of the soil-root-microbe system. Microb. Ecol. 52 (1), 151–158. doi:10.1007/s00248-006-9062-8
Filgueira, R. R., Fournier, L. L., Cerisola, C. I., Gelati, P., and García, M. G. (2006). Particle-size distribution in soils: A critical study of the fractal model validation. Geoderma 134 (3/4), 327–334. doi:10.1016/j.geoderma.2006.03.008
Gao, Y. N., Liao, L. Y., Wang, J., Qing, Q., Liu, G. B., and Zhang, C. (2021). Effect of forbidden grazing on multifractal characteristics of soil particle size in semi-arid grassland on the Loess Plateau. Bull. Soil Water Conservation 35 (6), 310–318+326. doi:10.13870/j.cnki.stbcxb.2021.06.042
Guan, X. Y., Yang, P. L., and Lv, Y. (2011). Relationship between soil particle size distribution and soil physical characteristics based on multifractal. Trans. Chin. Soc. Agric. Mach. 42 (03), 44–50.
Guo, S. W., Zhong, B., Xu, W. N., Xia, L., Guo, T., Chen, M., et al. (2022). Fractal characteristics of silt loam soil particle size in different land use types, A case study of xialao river small watershed in western hubei. Sci. Soil Water Conservation(Chinese Engl. 20 (01), 25–32. doi:10.16843/j.sswc.2022.01.004
Hafner, S., and Kuzyakov, Y. (2016). Carbon input and partitioning in subsoil by chicory and alfalfa. Plant Soil 406 (1-2), 29–42. doi:10.1007/s11104-016-2855-8
Hu, H. C., Tian, F. Q., and Hu, H. P. (2011). Soil particle size distribution and its relationship with soil water and salt under mulched drip irrigation in Xinjiang of China. Sci. China Technol. Sci. 54 (6), 1568–1574. doi:10.1007/s11431-010-4276-x
Jia, A. Y., Zhang, Y. Y., Zhao, W. Z., and Hu, S. (2022). Characteristics of soil macropores and water infiltration in oasis croplands in an arid region. Acta Pedol. Sin., 1–13. doi:10.11766/trxb202006180316
Kravchenko, A. N., Guber, A. K., Razavi, B. S., Quigley, M. Y., Robertson, G. P., and Kuzyakov, Y. (2019). Microbial spatial footprint as a driver of soil carbon stabilization. Nat. Commun. 10, 3121. doi:10.1038/s41467-019-11057-4
Desert Laboratory, Glaciology, Geocryology and Desert Institute, Chinese Academy of Sciences, (1978). Aeolian soil, Soils 21 (5), 27.
Lan, H. Y. (2020). Effects of two forest types on soil erosion and fractal characteristics. Harbin: Northeast Forestry University. doi:10.27009/d.cnki.gdblu.2020.000304
Li, C. C., Zeng, Q. C., Jia, P. L., and An, S. S. (2020). Characteristics of soil aggregate stability and corrosion resistance longitude change in the Loess Plateau. Acta eco. Sin. 40 (6), 2039–2048. doi:10.3390/ijerph192315703
Li, G. Q., Zhao, P. P., Shao, W. S., and Jin, C. Q. (2018). Effect of sealing on fractal dimension and physical and chemical properties of soil in desert grassland. Acta Agrestia Sin. 26 (3), 551–558. doi:10.1016/j.geoderma.2005.08.014
Li, S. Y., Lin, J. Y., Pan, J. H., Yu, H., Gao, R., and Yang, L. S. (2021). Multifractal characteristics of soil particle-size distribution under different land-use types in an area with high frequency debris flow. Chin. J. Appl. Environ. Biol. 27 (4), 893–900. doi:10.19675/j.cnki.1006-687x.2020.11046
Ling, X. (2021). Porosity structure and connected channels and their water distribution characteristics of the clay media. Wuhan: China University of Geosciences. doi:10.27492/d.cnki.gzdzu.2021.000027
Lun, J. Y. (2020). Study on gas adsorption characteristics in coal nanopore. Beijing: China University of mining and technology. doi:10.27624/d.cnki.gzkbu.2020.000075
Luo, L. F., Lin, H., and Li, S. C. (2010). Quantification of 3-D soil macropore networks in different soil types and land uses using computed tomography. J. Hydrology 393 (1-2), 53–64. doi:10.1016/j.jhydrol.2010.03.031
Ma, Y., Meng, C., Yue, J. M., Song, N. P., Xie, L., and Du, L. T. (2022). Study on preferential flow of soil of artificially planted caragana korshinskii shrubland in different years of desert grassland in Ningxia. Acta eco. Sin. 42 (3), 895–903. doi:10.5846/stxb202008042034
Mao, D. L., Cai, F. Y., Fang, D. X., Zhu, W. Y., Xu, J. L., Zhang, Y., et al. (2018). Fractal characteristics of grain size of sand and dust in aeolian sand movement in cele oasis-desert ecotone in Xinjiang, China. Acta Pedol. Sin. 55 (1), 88–99. doi:10.11766/trxb201706060235
Nadeu, E., de Vente, J. D., Martínez, M. M., and Fayos, C. B. (2011). Exploring particle size distribution and organic carbon pools mobilized by different erosion processes at the catchment scale. J. Soils Sediments 11 (4), 667–678. doi:10.1007/s11368-011-0348-1
Naglič, B., Kechavarzi, C., Coulon, F., and Pintar, M. (2014). Numerical investigation of the influence of texture, surface drip emitter discharge rate and initial soil moisture condition on wetting pattern size. Irrig. Sci. 32 (6), 421–436. doi:10.1007/s00271-014-0439-z
Perret, J. S., Prasher, S. O., and Kacimov, A. R. (2003). Mass fractal dimension of soil macropores using computed tomography: From the box-counting to the cube-counting algorithm. Eur. J. Soil Sci. 54 (3), 569–579. doi:10.1046/j.1365-2389.2003.00546.x
Qiao, J. B., Liu, X. T., Zhu, Y. J., Jia, X. X., and Shao, M. (2021). Three-dimensional quantification of soil pore structure in wind-deposited loess under different vegetation types using industrial X-ray computed tomography. Catena 199 (4), 105098. doi:10.1016/j.catena.2020.105098
Rabbi, S. M. F., Tighe, M. K., Flavel, R. J., Kaiser, B. N., Guppy, C. N., Zhang, X., et al. (2018). Plant roots redesign the rhizosphere to alter the three-dimensional physical architecture and water dynamics. New Phytol. 219 (2), 542–550. doi:10.1111/nph.15213
Sha, G. L., Wei, T. X., Chen, Y. X., Fu, Y. C., and Ren, K. (2022). Distribution of soil particle size in hilly areas of Loess Plateau. AridLandGeography, 1–14. doi:10.12118/j.issn.1000–6060.2021.487
Shen, H. Y., Wang, M. M., Liang, X. Y., Xing, Z. B., and Yan, T. F. (2021). Soil properties of shelterbelts in the Bashang area of Hebei province. Sci. Soil W ater Conservation(Chinese Engl. 19 (05), 63–71. doi:10.16843/j.sswc.2021.05.008
Siyal, A. A., and Skaggs, T. H. (2009). Measured and simulated soil wetting patterns under porous clay pipe sub-surface irrigation. Agric. Water Manag. 96 (6), 893–904. doi:10.1016/j.agwat.2008.11.013
Su, M., Ding, G. D., Gao, G. L., Zhang, Y., and Guo, M. S. (2018). Multifractal characteristics of soil particles in P. sylvestrus plantation in Hulunbuir sandy land. J. Arid Land Resour. Environ. 32 (11), 129–135. doi:10.13448/j.cnki.jalre.2018.345
Sun, J. W. (2015). Effect of agricultural restoration measures on structural properties of newly formed soil of black soil. Beijing: Chinese Academy of Agricultural Sciences.
Sun, M., Huang, Y. X., Sun, N., Xu, M. G., Wang, B. R., and Zhang, X. B. (2015). Advance in soil pore and its influencing factors. Chin. J. Soil Sci. 46 (1), 233–238. doi:10.19336/j.cnki.trtb.2015.01.039
Tian, H. Y. (2021). Study on soil pore characteristics of different land use type in Loess Plateau. Yangling, University of Chinese Academy of Sciences (Center for Soil and Water Conservation and Ecological Environment, Ministry of Education, Chinese Academy of Sciences). China doi:10.27558/d.cnki.gsthc.2021.000013
Tuo, D. F., Xu, M. X., Zheng, S. Q., and Li, Q. (2012). Sediment-yielding process and its mechanisms of slope erosion in wind-water erosion crisscross region of Loess Plateau, Northwest China. Chinese Journal of Applied Ecology 23 (12), 3281–3287. doi:10.13287/j.1001-9332.2012.0408
Wang, D., Fu, B. J., Chen, L. X., Zhao, W. W., and Wang, Y. F. (2007). Fractal analysis of soil particle size under different land- use types Take loess hilly and gully area as an example. Acta Ecol. Ica Sin. Ica 27 (7), 3081–3089.
Wan, Q., Wang, J., Wang, X. T., Liu, G. B., and Zhang, C. (2022). Effects of different meadow use types on the fractal characteristics of soil particle in the Qinghai-Tibet Plateau. Acta eco. Sin. 42 (05), 1–11. doi:10.5846/stxb202012043096
Wang, J., Zhao, W. W., Wang, G., Yang, S. Q., and Pereira, P. (2021). Effects of long-term afforestation and natural grassland recovery on soil properties and quality in Loess Plateau (China). Sci. Total Environ. 770, 144833. doi:10.1016/j.scitotenv.2020.144833
Wang, K., Pei, Z. Y., Wang, W. M., Hao, S. Y., and Pang, G. H. (2021). Influence of the flat cycle on the fractal characteristics of soil pore structure in Salix psammophila. Sci. Technol. Eng. 21 (07), 2647–2654.
Wang, T., Meng, Z. J., Dang, X. H., Li, H. N., Fu, D. S., and Zhao, F. Y. (2021). Study on litter and soil hydrological effects of artificial understor shelterbelts in Kubuqi Desert. Ecol. Environ. Sci. 30 (04), 700–707. doi:10.16258/j.cnki.1674-5906.2021.04.005
Wang, Y., Meng, Z. J., Siqingbilige, , Ding, Y. L., Wang, Z. Y., and Wan, F. (2018). Study on distribution of surface soil in semi-arid areas based on multifractal. Soils 50 (04), 826–831. doi:10.13758/j.cnki.tr.2018.04.024
Wang, Z., Peng, R. Y., Wang, L., and Liu, L. Y. (2006). Study on the properties of the improvement and utilization of aeolian sandy soil in the southern edge of Maowusu Sandy Land. J. Soil Water Conservation (02), 14–16+21. doi:10.13870/j.cnki.stbcxb.2006.02.004
Wei, Y. J., Wu, X. L., Xia, J. W., Shen, X., and Cai, C. (2016). Variation of soil aggregation along the weathering gradient: Comparison of grain size distribution under different disruptive forces. PLoS One 11 (8), e0160960. doi:10.1371/journal.pone.0160960
Wu, C. F., Yu, X. L., and Lu, S. G. (2020). Synchrotron-based X-ray tomographic microscopy reveals morphology and spatial structure of intra-aggregate pores in red soils. Acta Pedol. Sin. 57 (6), 1422–1429. doi:10.11766/trxb201906290122
Wu, J. Q., Ma, W. W., Li, G., and Chen, G. P. (2018). Effects offour vegetation types on soil physical characteristics and permeability in Loess Plateau. J. Soil Water Conservation 32 (2), 133. doi:10.13870/j.cnki.stbcxb.2018.04.021
Xia, Y., Zhou, W. J., Chen, Y. P., Wang, Y. Q., Cheng, P., and Hou, Y. Y (2020). Spatial variation of soil properties and carbon under different land use types on the Chinese Loess Plateau. Sci. Total Environ. 703, 134946. doi:10.1016/j.scitotenv.2019.134946
Yang, Z. Q., Qin, F. C., Li, L., Guo, J. Y., and Wang, Y. (2021). Relationship between soil particle multifractals and water holding capacity under different erosion degrees in feldspathic sandstone region. Soils 53 (3), 620–627. doi:10.13758/j.cnki.tr.2021.03.023
Zhang, J. R., Wang, J. M., Zhu, Y. C., Li, B., and Wang, P. (2017). Research progress of fractal theory in soil science. Chin. J. soil Sci. 48 (1), 221–228. doi:10.19336/j.cnki.trtb.2017.01.29
Zheng, X. L., Yang, L., Song, J., Bao, Y. H., Li, J. L., and He, X. B. (2022). Fractal and spatial characteristics of soil particles in reservoir zone. Res. soil water conservation 29 (1), 66–71. doi:10.13869/j.cnki.rswc.2022.01.006
Keywords: Kubuqi Desert, vegetation, soil particle-size composition, fractal dimension, laser diffraction, pore structure, nitrogen adsorption
Citation: Sun K, Wang H, Pei Z, Wang H, Sun X, Li Y, Sun G, Alatengsuhe , Yang J and Su X (2023) Particle-size fractal dimensions and pore structure characteristics of soils of typical vegetation communities in the Kubuqi Desert. Front. Environ. Sci. 10:1044224. doi: 10.3389/fenvs.2022.1044224
Received: 14 September 2022; Accepted: 30 November 2022;
Published: 23 January 2023.
Edited by:
Lixin Wang, Inner Mongolia University, ChinaReviewed by:
Wu Yong-sheng, Inner Mongolia Normal University, Hong Kong SAR, ChinaCopyright © 2023 Sun, Wang, Pei, Wang, Sun, Li, Sun, Alatengsuhe, Yang and Su. This is an open-access article distributed under the terms of the Creative Commons Attribution License (CC BY). The use, distribution or reproduction in other forums is permitted, provided the original author(s) and the copyright owner(s) are credited and that the original publication in this journal is cited, in accordance with accepted academic practice. No use, distribution or reproduction is permitted which does not comply with these terms.
*Correspondence: Zhiyong Pei, cGVpemhpeW9uZ0BpbWF1LmVkdS5jbg==
Disclaimer: All claims expressed in this article are solely those of the authors and do not necessarily represent those of their affiliated organizations, or those of the publisher, the editors and the reviewers. Any product that may be evaluated in this article or claim that may be made by its manufacturer is not guaranteed or endorsed by the publisher.
Research integrity at Frontiers
Learn more about the work of our research integrity team to safeguard the quality of each article we publish.