 Fangfang Wu
 Hao Lin
- Fujian Provincial Key Laboratory of Eco-Industrial Green Technology, College of Ecology and Resource Engineering, Wuyi University, Wuyishan, China
It is crucial to realize the municipal solid waste (MSW) classification in terms of its treatments and disposals. Deep learning used for the classification of residual waste and wet waste from MSW was considered as a promising method. While few studies reported using the method of deep learning with transfer learning to classify organic waste and residual waste. Thus, this study aims to discuss the effect of the transfer learning on the performance of different deep learning structures, VGGNet-16 and ResNet-50, for the classification of organic waste and residual waste, which were compared in terms of the training time, confusion matric, accuracy, precision, and recall. In addition, the algorithms of PCA and t-SNE were also adopted to compare the representation extracted from the last layer of various deep learning models. Results indicated that transfer learning could shorten the training time and the training time of various deep learning follows this order: VGGNet-16 (402 s) > VGGNet-16 with TL (272 s) > ResNet-50 (238 s) > ResNet-50 with TL (223 s). Compared with the method of PAC, waste representations were better separated from high dimension to low dimension by t-SNE. The values of organic waste in terms of F1 score follows this order: ResNet-50 with transfer learning (97.8%) > VGGNet-16 with transfer learning (97.1%) > VGGNet-16 (95.0%) > ResNet-50 (92.5%).Therefore, the best performance for the classification of organic and residual waste was ResNet-50 with transfer learning, followed by VGGNet-16 with transfer learning and VGGNet-16, and ResNet-50 in terms of accuracy, precision, recall, and F1 score.
1 Introduction
The explosion of population and the improvement of the living standard contribute to a large number of municipal solid waste (MSW) generation (Ding et al., 2021). MSW amount would be anticipated to reach up to 3.4*10^9 tonnes in 2050 in the world (Kaza et al., 2018). It is crucial to find a suitable way for the MSW treatment since it has a potential risk to human health and the ecological environment (Ding et al., 2021). Landfills, composting, and combustion are the common way for the MSW treatment, while the heterogeneity of MSW composition limits the application of various MSW treatment (Lin et al., 2022).
Landfills have become a popular way for the treatment and disposal of MSW with the advantages of low investment and easy operation (Anshassi et al., 2022). However, the organic waste or wet waste that ends up in landfills would increase the emission of greenhouse gases and also take up a larger number of land, which is posing a great threat to megacities (Tahmoorian and Khabbaz, 2020). As for incineration or thermal treatment, the most notable advantages of this method are reducing solid-waste mass and volume, saving energy, as well as hygienic control (Lin et al., 2019). However, the high moisture in the organic waste or wet waste would have a negative impact on the efficiency of combustion and lead to producing some pollutants in flue gas like polycyclic aromatic hydrocarbons and nitrogen oxides. The advantages of composting are improving the fertilizing of soil and reducing costs, while the presence of residual waste would have an unfavorable effect on the quality of compost products. Therefore, it is crucial to take some measures to realize the MSW classification in terms of its treatments and disposals.
However, the traditional methods of MSW classification are main about manual and semi-screening, which would consume the amount of manpower and material resources, as well as accelerate virus spread (Alom et al., 2019). Therefore, it is urgent to find a more efficient and intelligent method for MSW classification. Data about semismic images can be used to identify hydrocarbon structure to help classify wet waste and residual waste (Radad et al., 2016; Hadiloo et al., 2017; Mousavi et al., 2022). The application methods in indentifying hydrocarbon resevoirs and structure related to hydrocarbon also have been discussed (Soleimani and Balarostaghi, 2016; Farrokhnia et al., 2018; Khayer et al., 2022a; Khayer et al., 2022b; Hosseini-Fard et al., 2022). Recently, great attention has been caught to applying deep learning for the waste classification related to computer version (CV) with the development of computer hardware (Nasri et al., 2020). Compared with traditional CV algorithms like scale-invariant feature transform (SIFT), supporting vector machine (SVM), and principal component (PCA) (Soleimani, 2016a,b; Lu and Chen, 2022), deep learning has the ability to automatically extract the representation and equips with more applicability, robustness, generalization, and scability (Lin et al., 2022; Mafakheri et al., 2022; Saad and Chen, 2022).
Several studies have adopted this method to realize waste classification. SVM and deep residual learning were employed to classify the TrashNet, the waste image dataset with a total of 2527 images, and achieved an accuracy of 63% and 87%, respectively (Yang and Thung, 2016). Davis et al. designed a deep convolutional neural network to classify 7 typical construction waste (second fix timbers, shuttering timbers, particle boards, hard plastics, wrapping plastic, bricks and concrete, cardboards and polystyrene) (Davis et al., 2021). This method was also employed for the polyethylene terephthalate (PET) classification by Bobulski and Piatkowski, (2018).
The essence of deep learning is the data-driven model, thus, measures like data augmentation and fine-tuned hyper-parameters of deep learning structure could improve the performance (Lin et al., 2022). RecycleNet, combined with transfer learning and DenseNet-121, obtained 95% accuracy on the test dataset (Bircano˘glu et al., 2018). AquaVision, integrated deep learning with transfer learning, was proposed to detect the waste in waster bodies (Panwar et al., 2020). In addition, this method, deep learning with transfer learning, has been employed in the classification of recyclable waste (Olugboja Adedeji, 2019). However, few studies reported using the method of deep learning coupled with transfer learning for the classification of organic waste and residual waste.
Therefore, this study aims to discuss the effect of transfer learning on deep learning structures like VGGNet-16 and ResNet-50 for the classification of organic waste and residual waste. Meanwhile, the performance of these deep learning architectures was also compared. In addition, the algorithms of PCA and t-SNE were also adopted to extract the features from the last layer of the deep learning model. The flowchart of this study was shown in Figure 1.
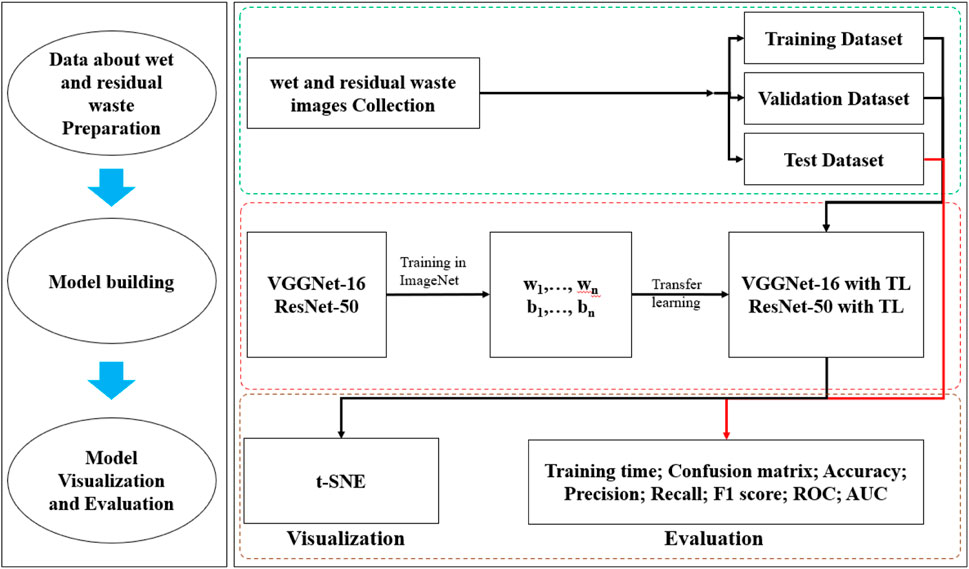
FIGURE 1. The flowchart of this study.
2 Materials and methods
2.1 Data collection and preparation
22010 images of MSW in total were collected from one open-source (https://www.kaggle.com/techsash/waste-classification-data), including organic waste (16572) and recyclable waste (5438), as shown in Figure 2. The numbers for the training, validating, and testing datasets were 15846, 1761, and 4403, respectively. Details of the experimental platform are given in Table 1.
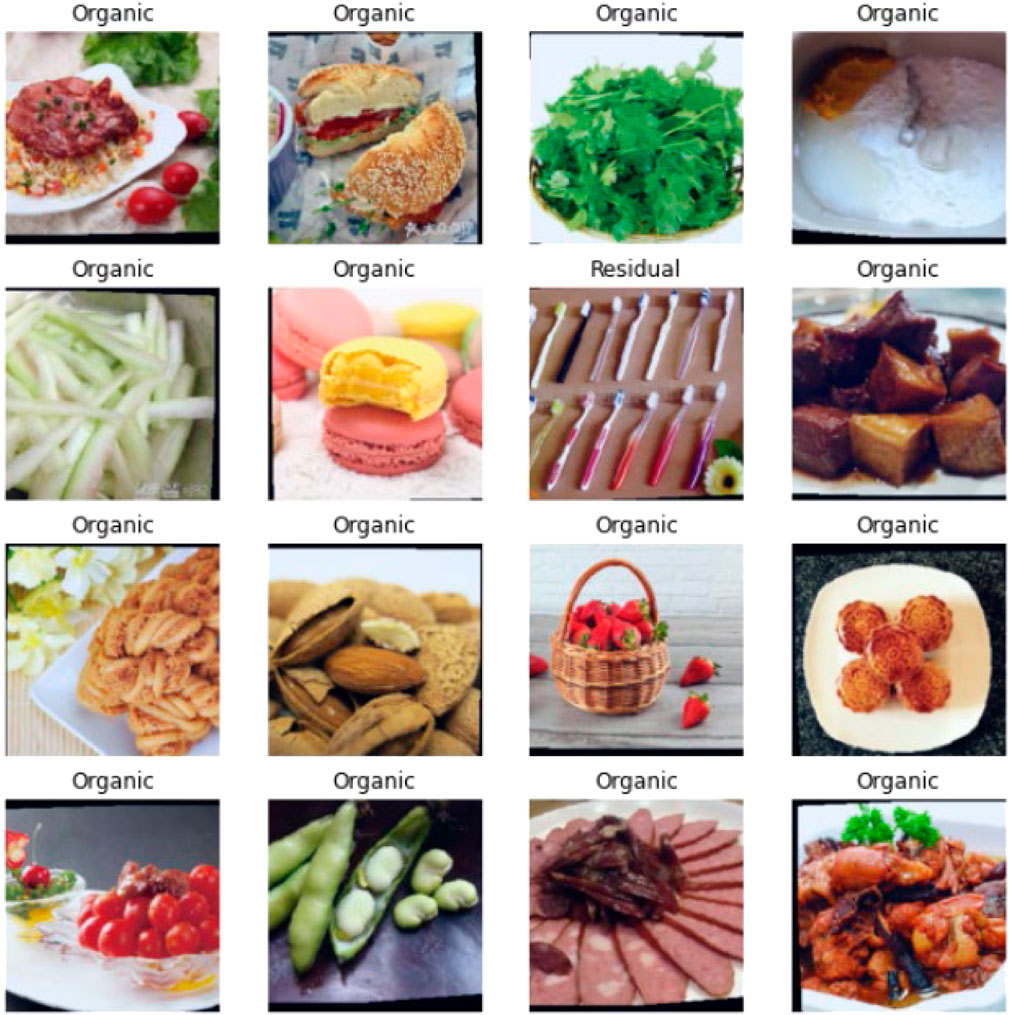
FIGURE 2. Example of organic waste and residual waste.
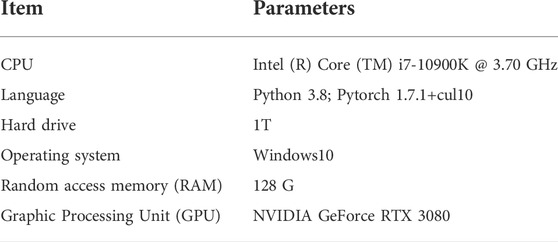
TABLE 1. Experimental platform for training TLVGGNet model.
2.2 VGGNet-16 and ResNet-50 structure
VGGNet architectures were proposed by the Visual Geometry Group of Oxford University (Simonyan et al., 2014) and won first and second place in the localization and classification in ImageNet Large Scale Visual Recognition Challenge (ILSVRC 2014). VGGNet-16 is consisted of 3 consecutive convolution operations per convolution segment, as shown in Figure 3). This state-of-the-art model enhances the performance of model classification by increasing model depth with a 3×3 convolutional layer. This point is the most different from other CNN structures like AleNet and GoogleNet. VGGNet models use a smaller 3×3 convolution kernel instead of a larger one, which enlarges the perception field of the output feature map of each layer and makes the CNNs have a stronger feature learning ability.
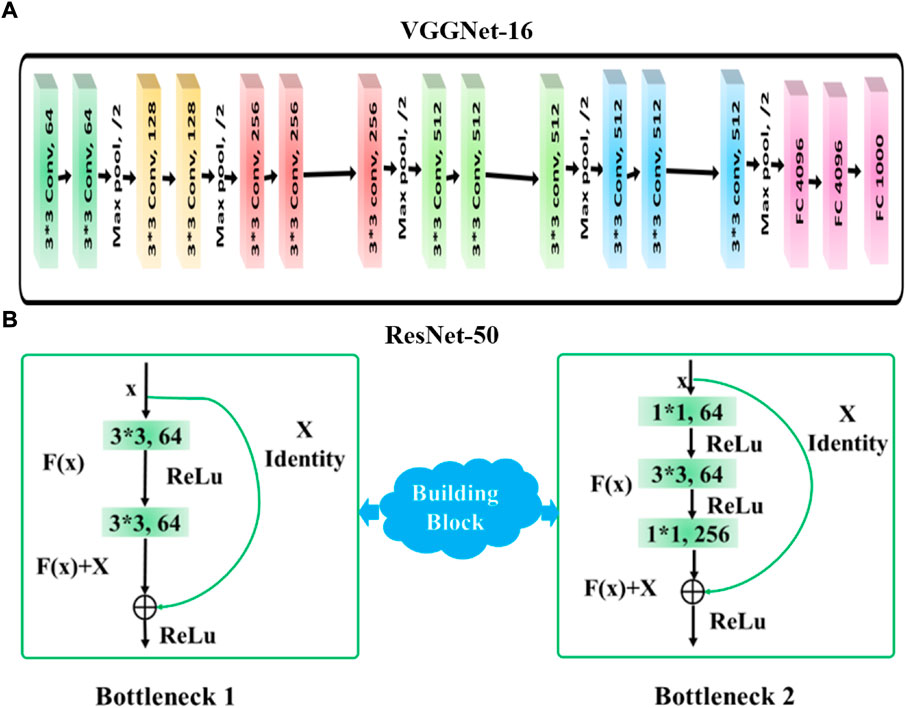
FIGURE 3. (A) VGGNet-16 structure; (B) ResNet-50 structure.
ResNet-50 is a network-in-network architecture that relies on several stacked residual units, which was first introduced by He et al, (2016) and considered the best performance in ImageNet classification, as shown in Figure 3B. It consists of two deep building blocks: bottleneck 1 and bottleneck 2. Convolutions of three layers 1×1, 3×3 and 1×1 blocks in bottleneck 1 and bottleneck 2, where the function of the 1×1 layer is reduced but the dimension of input is increased, making the 3×3 layer a bottleneck with small input/output dimensions (He, 2016). Identity mapping is a key measure for addressing the degradation issue, how it works is introduced as follows:
As shown by bottleneck 2 in Figure 3B), x, y, and
It is noted that average pooling was introduced and linked to the fully connected layer in stage 4, where the activation function of the rectified linear unit (ReLU) was adopted to predict classes based on the highest probability given by the input data, which can be expressed as Eq. 2-2:
in which, elements of W and b represent the weights and bias, respectively. Index j was used to normalize the posterior distribution. The model prediction is the class with the highest probability, as given by Eq. 2-3:
The elements of weights and bias in deep ResNet structure were also optimized by the error backpropagation algorithm, which is used as an error metric to calculate the distance between the true class labels and the predicted class labels. Cross-entropy function (2–4) was chosen as the loss function to be minimized for dataset V.
in which, L represents the loss function; Here,
2.3 Transfer learning
VGGNet-16 or ResNet 50 was trained with ImageNet, consisting of 12 million images and 1,000 categories. The model of VGGNet-16 or ResNet 50 learned the weight and bias during the training process (Sinno and Yang, 2010). Firstly, keeping the weight and bias of each layer before the last layer of the VGGNet-16 or ResNet 50 during transfer learning. Secondly, removing the last layer of VGGNet-16 or ResNet 50 and inputting the waste dataset, only retraining the last layer of VGGNet-16 or ResNet 50. Consequently, the excellent performance of the model for waste classification can be obtained. In addition, the total trainable parameters in VGGNet-16, VGGNet-16 with TL, ResNet-50, and ResNet-50 with TL were 134 million and 235 million, respectively.
2.4 Method of evaluation and visualization
2.4.1 Evaluations
Confusion metrics, sensitivity, precision, F1 score, accuracy, receiver operating characteristic (ROC), and area under the curve (AUC) were used to evaluate the performance of MSWNet. Sensitivity, precision, F1 score, and accuracy were defined as follows:
in which, TP, TN, FN, and FP are the numbers of true positives, true negatives, false negatives, and false positives, respectively.
2.4.2 Visualization
Algorithms of principal component analysis (PCA) and t-distributed stochastic neighbor embedding (t-SNE) were also adopted to create low-dimensional data representing and interpreting waste classification. As for the PCA and t-SNE detail, they can be seen in the reference (Maaten and Hinton, 2008; Thomaz and Giraldi, 2010; Retsinas et al., 2017).
3 Results and discussion
3.1 Effect of transfer learning on the performance of VGGNet-16 and ResNet-50 in the training dataset and validation dataset
Table 2 shows the effect of transfer learning on the performance of VGGNet-16 and ResNet-50 in the training dataset and validation dataset. The training time of various deep learning follows this order: VGGNet-16 (402 s) > VGGNet-16 with TL (272 s) > ResNet-50 (238 s) > ResNet-50 with TL (223 s). This result suggested that transfer learning could shorten the training time. Although more parameters in ResNet-50 than that in VGGNet-16, as mentioned above, the training time in ResNet-50 is less than that in VGGNet-16. The reason for this phenomenon can be ascribed to the function of identity mapping.
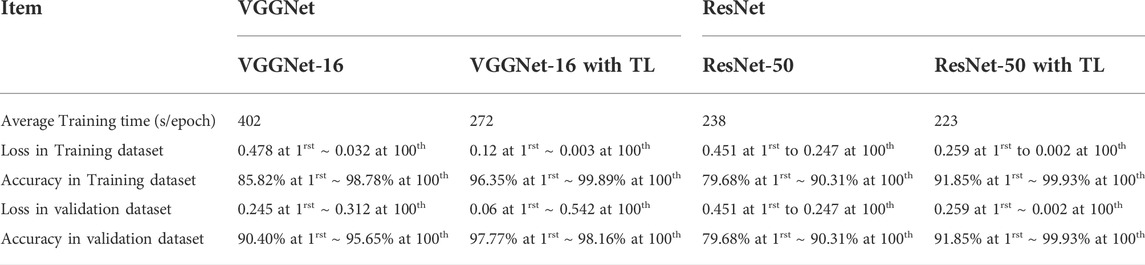
TABLE 2. Effect of transfer learning on the performance of VGGNet-16 and ResNet-50 in the training dataset and validation dataset.
The tendency of loss from VGGNet-16 and ResNet-50 gets decreased with the increase of the epoch number both in the training dataset and the validating dataset, from 0.478 at the 1rst epoch to 0.032 at the 100th epoch and from 0.451 at the 1rst epoch to 0.0247 at the 100th epoch the training dataset in Table 2, respectively. The loss from VGGNet-16 with transfer learning and ResNet-50 with transfer learning in the training dataset and validating dataset also show similar trends. Namely, the epoch number increased with the loss values for both the training dataset and validating dataset decreased, while the loss in the training dataset and validation data from VGGNet-16 with transfer learning and ResNet-50 with learning is lower than that without transfer learning. This result suggested that transfer learning could reduce the loss both in the training dataset and validating dataset.
As for accuracy, it from VGGNet-16, VGGNet-16 with transfer learning, ResNet-50, and ResNet-50 with transfer learning in the training dataset and validation dataset show an upward trend with the increase of the epoch number. In terms of loss and accuracy, transfer learning could promote VGGNet-16 and ResNet-50 to reach the convergent state and enhance the accuracy of recyclable sorting, which is in line with other studies (Rehman et al., 2019; Alghamdi et al., 2020). In addition, compared with VGGNet-16, ResNet-50 showed better performance in the training dataset and validation dataset in terms of average time, loss, and accuracy.
3.2 Visual explanation
Figure 4 Feature maps can provide insights into the internal representation of local feature extractors, which could interpret what kind of features are detected or preserved, and make the CNN model more transparent and accountable (Xia et al., 2020). Method of PCA was adopted to provide the distribution of organic waste and residual waste dataset. Figure 3 shows 2-dimension extracted representations from the last layer of various models obtained from the PCA algorithm. The distribution of features from VGGNet-16 and VGGNet-16 with transfer learning shows “radiolucent” in Figure 3A and Figure 3B. While the shape of features distribution in ResNet-50 and ResNet-50 with transfer learning showed semantic clustering. In addition, the feature of organic waste and residual waste was clearly separated by the method of PCA.
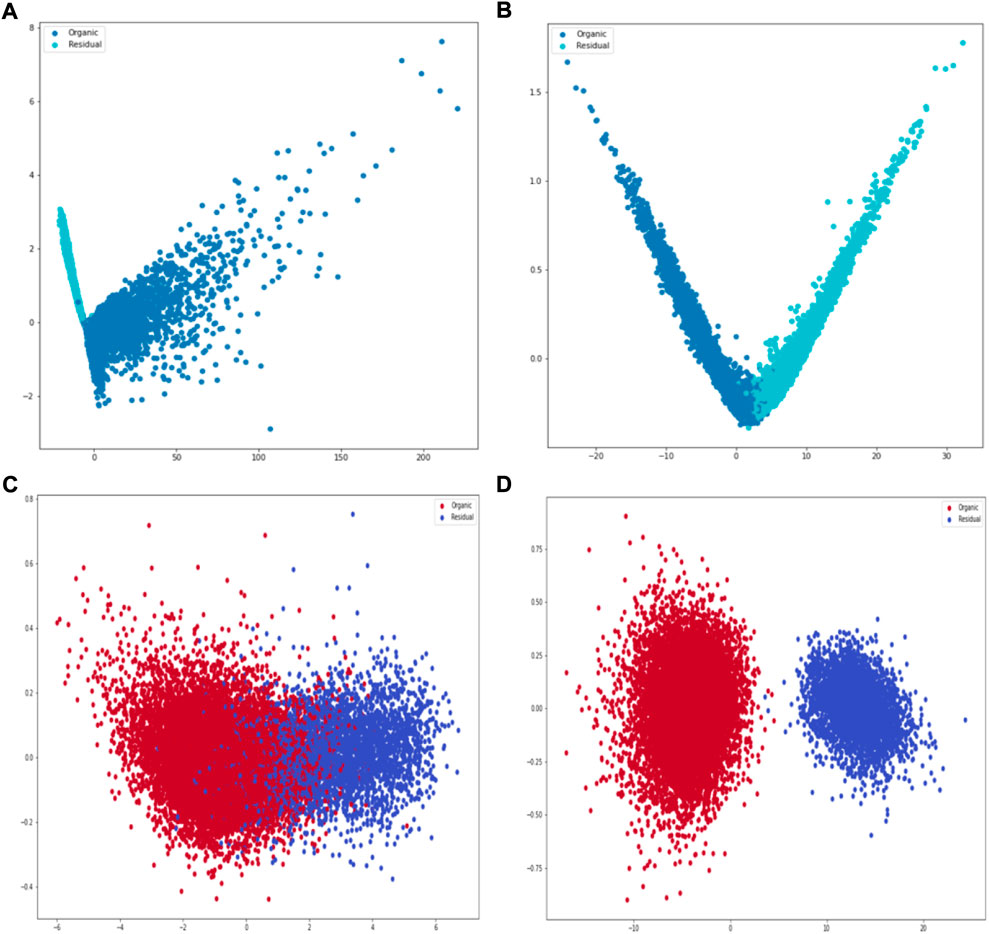
FIGURE 4. A 2-D feature visualization of an image representation of waste images by the method of PCA: (A) VGGNet-16; (B) VGGNet-16 with TL; (C) ResNet-50; (D) ResNet-50 with TL; Note: TL was represented to transfer learning.
The feature of organic waste and residual waste were obtained from different deep learning models by the method of t-SNE in Figure 5. It can be found that the fetures from the last layer of VGGNet-16 (Figure 5A) and VGGNet-16 with TL (Figure 5B) were well separated although some of features about residual waste and wet waste is overlapped. In terms of Figure 5C) and 5 days), the distribution of features from ResNet-50 with TL were more cleaner distinguish than that from ResNet-50 by the method of t-SNE. Compared with the method of PAC, waste representations were better separated from high dimension to low dimension by t-SNE. This was due to t-SNE creating a reduced feature space with similar samples modeled by nearby points and similar samples modeled by remote points with greater probability (Gisbrecht et al., 2015).
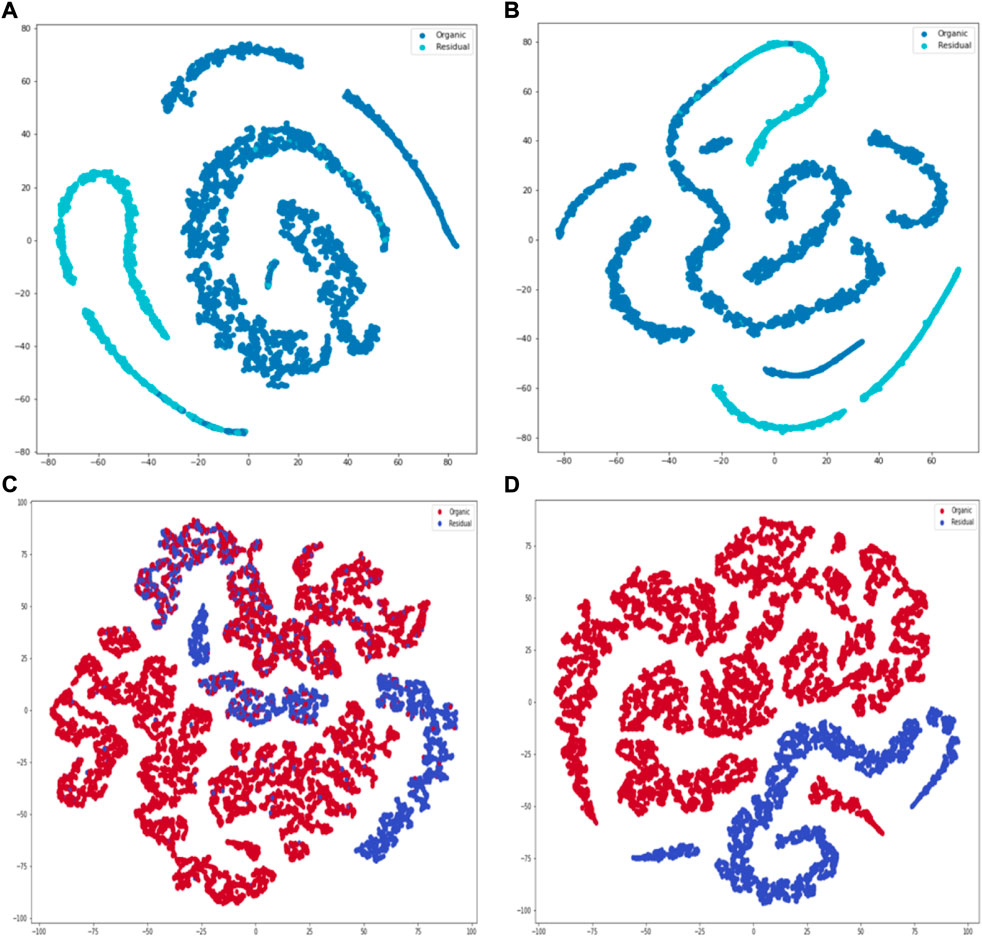
FIGURE 5. A 2-D feature visualization of an image representation of waste images by the method of t-SNE: (A) VGGNet-16; (B) VGGNet-16 with TL; (C) ResNet-50; (D) ResNet-50 with TL; Note: TL was represented to transfer learning.
3.3 Effect of transfer learning on the performance of VGGNet-16 and ResNet-50 in test dataset and validation dataset
3.3.1 Confusion matrix
Figure 6 shows the confusion matrix of the assessment in model performance for VGGNet-16, VGGNet-16 with transfer learning, ResNet-50, and ResNet-50 with transfer learning. The number of waste images (organic waste and residual waste) along the diagonal line means correct classifications, while the values that do not present along the diagonal line represent unpaired labels and images. For example, for organic waste, the number of TN, FN, and FP was 3162, 153, and 180, respectively, (Figure 6A). It is noted that compared with the other three state-of-art models in Figure 6A), b), c), and d), the majority of organic images (3257) and residual waste images (997) were found along the diagonal line in ResNet-50 with transfer learning, indicating that ResNet-50 with transfer learning provided a better performance on the classification of organic and residual waste.
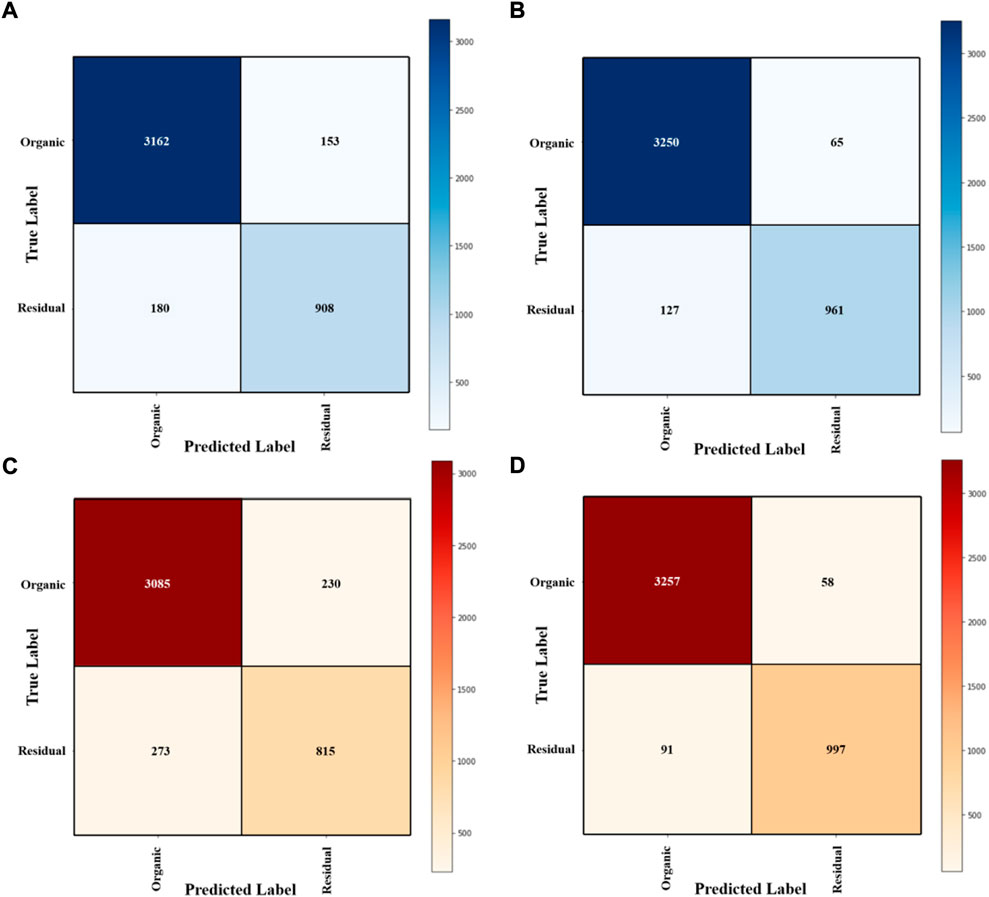
FIGURE 6. Confusion matrix from models runs on the test dataset: (A) VGGNet-16; (B) VGGNet-16 with TL; (C) ResNet-50; (D) ResNet-50 with TL; Note: TL was represented to transfer learning.
3.3.2 Accuracy, precision, recall, and F1 score
As shown in Figure 7A, the accuracy of various deep learning models followed this order: ResNet-50 with transfer learning (96.6%) > VGGNet-16 with transfer learning (95.6%) > VGGNet-16 (92.4%) > ResNet-50 (88.6%). The result suggested that transfer learning could greatly improve the performance of ResNet-50 and VGGNet-16 models. In addition, VGGNet-16 shows better performance in the classification of organic and residual waste than ResNet-50.
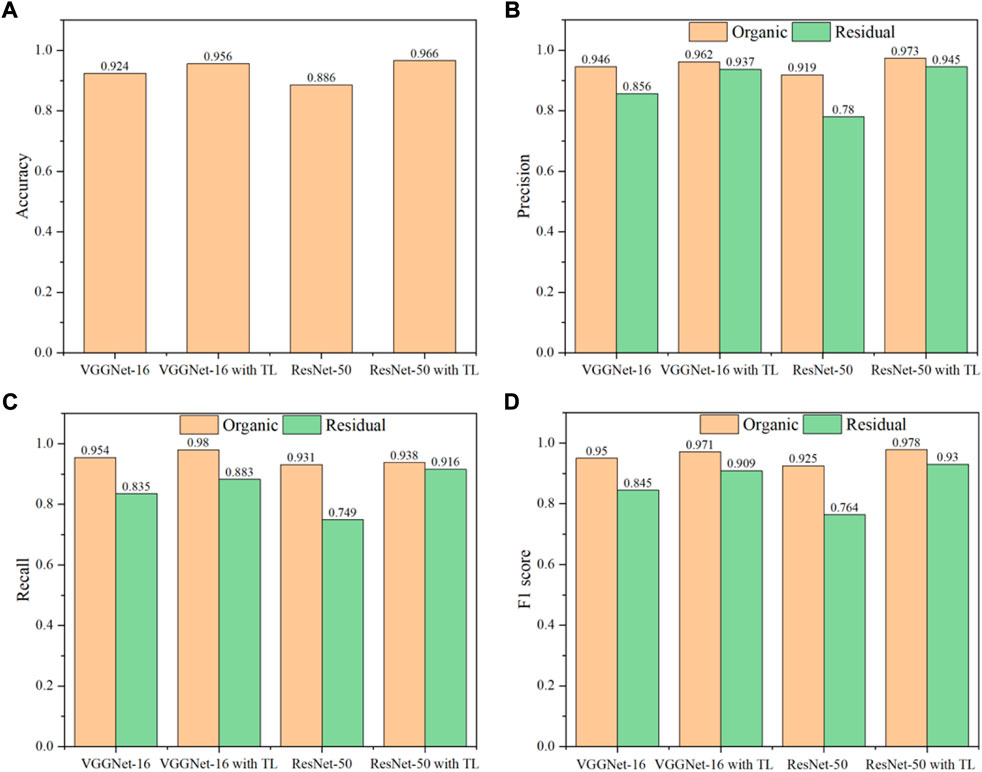
FIGURE 7. Effect of transfer learning on the performance of VGGNet-16 and ResNet-50: (A) Accuracy; (B) Precision; (C) Recall; (D) F1 score.
The shortcomings of the method in accuracy assessment are particularly pronounced when the data are unbalanced (Allouche et al., 2006). Here, precision, recall, and F1 score were also adopted for further quantitative evaluations of the performance of different deep learning models being applied in the classification of wet and residual waste.
Precision was denoted using the ratio of correctly predicted positive items to the total predicted items. Figure 7B shows ResNet-50 with transfer learning better performance compared to the other three CNN models in organic waste (97.3%) and residual waste (94.5%). While poor precision was found in ResNet-50 with 91.9% of organic waste and 78% of residual waste.
The corresponding meaning of recall was the number of positive items correctly identified. VGGNet-16 with transfer learning shows better performance than the other three CNN models in organic waste (98.0%) in Figure 7C, while the best performance for the residual waste classification was also found in ResNet-50 (91.6%).
F1 score was a balance between recall and precision. The values of organic waste in terms of F1 score follows this order: ResNet-50 with transfer learning (97.8%) > VGGNet-16 with transfer learning [(97.1%) > VGGNet-16 (95.0%)] > ResNet-50 (92.5%), as shown in Figure 7D. The value of the F1 score for residual waste also shows the same trends: the best performance was found in ResNet-50 with transfer learning (93.0%), followed by VGGNet-16 with transfer learning (90.9%) and VGGNet-16 (84.5%), and the poorest performance was found in the ResNet-50 (76.4%).
In conclusion, the best performance for the classification of organic and residual waste was ResNet-50 with transfer learning, followed by VGGNet-16 with transfer learning and VGGNet-16, and ResNet-50 in terms of accuracy, precision, recall, and F1 score.
4 Conclusion
Results indicated that transfer learning could shorten the training time and the training time of various deep learning follows this order: VGGNet-16 (402 s) > VGGNet-16 with TL (272 s) > ResNet-50 (238 s) > ResNet-50 with TL (223 s). The distribution of features from VGGNet-16 and VGGNet-16 with transfer learning shows “radiolucent”, While the shape of features distribution in ResNet-50 and ResNet-50 with transfer learning showed semantic clustering. In addition, the feature of organic waste and residual waste was clearly separated by the method of PCA. Compared with the method of PAC, waste representations were better separated from high dimension to low dimension by t-SNE. This was due to t-SNE creating a reduced feature space with similar samples modeled by nearby points and similar samples modeled by remote points with greater probability. The best performance for the classification of organic and residual waste was ResNet-50 with transfer learning, followed by VGGNet-16 with transfer learning and VGGNet-16, and ResNet-50 in terms of accuracy, precision, recall, and F1 score.
Data availability statement
The raw data supporting the conclusion of this article will be made available by the authors, without undue reservation.
Author contributions
FW designed the research, performed the calculation and analysis and drafted the manuscript. HL carried out the main revisions of contents and figures.
Funding
This work is financially supported by University-industry-university cooperation program of Fujian Province (No. 2022N5007).
Conflict of interest
The authors declare that the research was conducted in the absence of any commercial or financial relationships that could be construed as a potential conflict of interest.
Publisher’s note
All claims expressed in this article are solely those of the authors and do not necessarily represent those of their affiliated organizations, or those of the publisher, the editors and the reviewers. Any product that may be evaluated in this article, or claim that may be made by its manufacturer, is not guaranteed or endorsed by the publisher.
References
Alghamdi, A., Hammad, M., Ugail, H., Abdel-Raheem, A., Muhammad, K., Khalifa, H. S., et al. (2020). Assessing the accuracy of species distribution models: Prevalence, kappa and the true skill statistic (TSS). J. Appl. Ecol. 43 (6), 1223–1232. doi:10.1111/j.1365-2664.2006.01214.x
Alom, M. Z., Taha, T. M., Yakopcic, C., Westberg, S., Sidike, P., Nasrin, M. S., et al. (2019). A state-of-the-art survey on deep learning theory and architectures. Electronics 8 (3), 292. doi:10.3390/electronics8030292
Anshassi, M., Smallwood, T., and Townsend, T. G. (2022). Life cycle GHG emissions of MSW landfilling versus Incineration: Expected outcomes based on US landfill gas collection regulations. Waste Manag. 142, 44–54. doi:10.1016/j.wasman.2022.01.040
Bircano˘Glu, C., Atay, M., and Bes¸Er, F. (2018). RecycleNet: Intelligent waste sorting using deep neural networks: 2018 Innovations in Intelligent Systems and Applications (INISTA), 03-05 July 2018, Thessaloniki, Greece. 2058–2062.
Bobulski, J., and Piatkowski, J. (2018). PET waste classification method and plastic waste DataBase - WaDaBa. Adv. Intelligent Syst. Comput. 681, 57–64. doi:10.1007/978-3-319-68720-9_8
Davis, P., Aziz, F., Newaz, M. T., Sher, W., and Simon, L. (2021). The classification of construction waste material using a deep convolutional neural network. Automation Constr. 122, 103481. doi:10.1016/j.autcon.2020.103481
Ding, Y., Zhao, J., Liu, J-W., Zhou, J., Cheng, L., Zhao, J., et al. (2021). A review of China’s municipal solid waste (MSW) and comparison with international regions: Management and technologies in treatment and resource utilization. J. Clean. Prod. 293, 126144. doi:10.1016/j.jclepro.2021.126144
Farrokhnia, F., Kahoo, A. R., and Soleimani, M. (2018). Automatic salt dome detection in seismic data by combination of attribute analysis on CRS images and IGU map delineation. J. Appl. Geophys. 159, 395–407. doi:10.1016/j.jappgeo.2018.09.018
Fulkerson, B. (1996). Pattern recognition and neural networks. Cambridge: Cambridge University Press.
Gisbrecht, A., Schulz, A., and Hammer, B. (2015). Parametric nonlinear dimensionality reduction using kernel t-SNE. Neurocomputing 147, 71–82. doi:10.1016/j.neucom.2013.11.045
Hadiloo, S., Radad, M., Mirzaei, S., and Foomezhi, M. (2017). Seismic facies analysis by ANFIS and fuzzy clustering. Methods Extr. Channel Patterns 2017 (1), 1–5. doi:10.3997/2214-4609.201700917
He, K., Zhang, X., Ren, S., and Sun, J. (2016). Deep residual learning for image recognition. NV, USA: Las Vegas, 770–778.
Hosseini-Fard, E., Roshandel-Kahoo, A., Soleimani-Monfared, M., Khayer, K., and Ahmadi-Fard, A. R. (2022). Automatic seismic image segmentation by introducing a novel strategy in histogram of oriented gradients. J. Petroleum Sci. Eng. 209, 109971. doi:10.1016/j.petrol.2021.109971
Kaza, S., Yao, L., Bhada-Tata, P., and Van Woerden, F. (2018). What a waste 2.0: A global snapshot of solid waste management to 2050. U.S.A: World Bank Publications.
Khayer, K., Roshandel Kahoo, A., Soleimani Monfared, M., Tokhmechi, B., and Kavousi, K. (2022b). Target-Oriented fusion of attributes in data level for salt dome geobody delineation in seismic data. Nat. Resour. Res. 31 (5), 2461–2481. doi:10.1007/s11053-022-10086-z
Khayer, K., Roshandel-Kahoo, A., Soleimani-Monfared, M., and Kavoosi, K. (2022a). Combination of seismic attributes using graph-based methods to identify the salt dome boundary. J. Petroleum Sci. Eng. 215, 110625. doi:10.1016/j.petrol.2022.110625
Lin, K., Kuo, J-H., Xiong, K., Lin, C-L., and Liu, J. (2019). Effect of phosphorus concentration on alkali and heavy metals transformation under agglomeration/defluidization during fluidized bed simulated sludge Co-combustion. Waste Biomass Valorization 11 (12), 6903–6916. doi:10.1007/s12649-019-00913-5
Lin, K., Zhao, Y., Kuo, J-H., Deng, H., Cui, F., Zhang, Z., et al. (2022). Toward smarter management and recovery of municipal solid waste: A critical review on deep learning approaches. J. Clean. Prod. 346, 130943. doi:10.1016/j.jclepro.2022.130943
Lu, W., and Chen, J. (2022). Computer vision for solid waste sorting: A critical review of academic research. Waste Manag. 142, 29–43. doi:10.1016/j.wasman.2022.02.009
Maaten, L. V. D., and Hinton, G. (2008). Visualizing data using t-SNE. J. Mach. Learn. Res. 9, 2579–2605.
Mafakheri, J., Kahoo, A. R., Anvari, R., Mohammadi, M., Radad, M., and Monfared, M. S. (2022). Expand dimensional of seismic data and random noise attenuation using low-rank estimation. IEEE J. Sel. Top. Appl. Earth Obs. Remote Sens. 15, 2773–2781. doi:10.1109/JSTARS.2022.3162763
Mousavi, J., Radad, M., Soleimani Monfared, M., and Roshandel Kahoo, A. (2022). Fault enhancement in seismic images by introducing a novel strategy integrating attributes and image analysis techniques. Pure Appl. Geophys. 179 (5), 1645–1660. doi:10.1007/s00024-022-03014-y
Nasri, S., Nejati Kalate, A., Roshandel Kahoo, A., and Soleimani Monfared, M. (2020). New insights into the structural model of the Makran subduction zone by fusion of 3D inverted geophysical models. J. Asian Earth Sci. 188, 104075. doi:10.1016/j.jseaes.2019.104075
Olugboja Adedeji, Z. W., and Wang, Z. (2019). Intelligent waste classification system using deep learning convolutional neural network. Procedia Manuf. 35, 607–612. doi:10.1016/j.promfg.2019.05.086
Panwar, H., Gupta, P. K., Siddiqui, M. K., Morales-Menendez, R., Bhardwaj, P., Sharma, S., et al. (2020). AquaVision: Automating the detection of waste in water bodies using deep transfer learning. Case Stud. Chem. Environ. Eng. 2, 100026. doi:10.1016/j.cscee.2020.100026
Radad, M., Gholami, A., and Siahkoohi, H. E. (2016). A fast method for generating high-resolution single-frequency seimic attributes. J. Seismic Explor. 25, 11–25.
Rehman, A., Naz, S., Razzak, M. I., Akram, F., and Imran, M. (2019). A deep learning-based framework for automatic brain tumors classification using transfer learning. Circuits Syst. Signal Process. 39 (2), 757–775. doi:10.1007/s00034-019-01246-3
Retsinas, G., Stamatopoulos, N., Louloudis, G., Sfikas, G., and Gatos, B. (2017). “Nonlinear manifold embedding on keyword spotting using t-SNE,” in 2017 14th IAPR International Conference on Document Analysis and Recognition (ICDAR), Kyoto, Japan, 09-15 November 2017, 487–492.
Saad, O. M., and Chen, Y. (2022). Deep denoising autoencoder for seismic random noise attenuation. Geophysics 85 (4), 367–376. doi:10.1190/geo2019-0468.1
Simonyan, K., and Zisserman, A. (2014). Very deep convolutional networks for large-scale image recognition. arXiv. Available at: https://arxiv.org/abs/1409.1556.
Sinno, J., and Yang, Q. (2010). A survey on transfer learning. IEEE Trans. Knowl. Data Eng. 22 (10), 1345–1359. doi:10.1109/tkde.2009.191
Soleimani, M., and Balarostaghi, M. (2016). Seismic image enhancement in post stack depth migration by finite offset CDS stack method. J. Pet. Explor. Prod. Technol. 6 (4), 605–615. doi:10.1007/s13202-016-0235-9
Soleimani, M. (2016a). Seismic image enhancement of mud volcano bearing complex structure by the CDS method, a case study in SE of the Caspian Sea shoreline. Russ. Geol. Geophys. 57, 1775–1786. doi:10.1016/j.rgg.2016.01.020
Soleimani, M. (2016b). Seismic imaging by 3D partial CDS method in complex media. J. Petroleum Sci. Eng. 143, 54–64. doi:10.1016/j.petrol.2016.02.019
Tahmoorian, F., and Khabbaz, H. (2020). Performance comparison of a MSW settlement prediction model in Tehran landfill. J. Environ. Manage. 254, 109809. doi:10.1016/j.jenvman.2019.109809
Thomaz, C. E., and Giraldi, G. A. (2010). A new ranking method for principal components analysis and its application to face image analysis. Image Vis. Comput. 28 (6), 902–913. doi:10.1016/j.imavis.2009.11.005
Xia, C., Pan, Z., Fei, Z., Zhang, S., and Li, H. (2020). Vision based defects detection for keyhole TIG welding using deep learning with visual explanation. J. Manuf. Process. 56, 845–855. doi:10.1016/j.jmapro.2020.05.033
Yang, M., and Thung, G. (2016). “Classification of trash for recyclability status,”. CS229 Projection Report2016. Available at: https://cs229.stanford.edu/proj2016/report/ThungYang-ClassificationOfTrashForRecyclabilityStatus-report.pdf (Accessed Dec 9, 2016).
Keywords: municipal solid waste, vggnet-16, resnet-50, transfer learning, confusion matric
Citation: Wu F and Lin H (2022) Effect of transfer learning on the performance of VGGNet-16 and ResNet-50 for the classification of organic and residual waste. Front. Environ. Sci. 10:1043843. doi: 10.3389/fenvs.2022.1043843
Received: 14 September 2022; Accepted: 12 October 2022;
Published: 31 October 2022.
Edited by:
Yasir Bashir, Universiti Sains Malaysia (USM), MalaysiaReviewed by:
Keyvan Khayer, Shahrood University of Technology, IranMohammad Radad, Shahrood University of Technology, Iran
Amin Roshandel Kahoo, Shahrood University of Technology, Iran
Copyright © 2022 Wu and Lin. This is an open-access article distributed under the terms of the Creative Commons Attribution License (CC BY). The use, distribution or reproduction in other forums is permitted, provided the original author(s) and the copyright owner(s) are credited and that the original publication in this journal is cited, in accordance with accepted academic practice. No use, distribution or reproduction is permitted which does not comply with these terms.
*Correspondence: Fangfang Wu, d3VmZjIwMThAd3V5aXUuZWR1LmNu