
94% of researchers rate our articles as excellent or good
Learn more about the work of our research integrity team to safeguard the quality of each article we publish.
Find out more
ORIGINAL RESEARCH article
Front. Environ. Sci., 20 October 2022
Sec. Environmental Economics and Management
Volume 10 - 2022 | https://doi.org/10.3389/fenvs.2022.1042856
This article is part of the Research TopicGlobal Excellence: Environmental Issues and Global Value Chain in AsiaView all 24 articles
 Ruili Cao1
 Zhibo Zhao2*
Analyzing the forces driving CO2 emissions in cities could provide valuable information for carbon reduction policies in China. This study uses an improved production-theoretical decomposition analysis to evaluate the CO2 emissions of 282 cities in China during 2003–2017. The empirical results show that the scale, energy intensity, and desirable output productivity effects contributed to about 15.03%, 3.64%, and 2.3% growths in CO2 emissions on average, respectively, while the potential CO2 emission and undesirable output productivity effects were responsible for 5.81% and 5.72% reductions in CO2 emissions. By classifying the sample cities and analyzing them further, it was found that the potential CO2 emission effect has a stronger inhibitory impact in resource-based cities. However, the promoting effects of the scale effect is more obvious in non-resource-based cities. From a spatial distribution perspective, the potential CO2 emission effect has a more obvious inhibitory role, and the energy intensity effect is a strong measure for controlling the growth of CO2 emissions in the eastern region. However, the contribution of the scale effect to CO2 emissions is more pronounced in the western region. In addition, we found that the desirable output productivity effects had a suppressive effect in the eastern region and facilitating effects in the central and western regions. The undesirable output productivity effect had a suppressive effect on the growth of CO2 emissions in all three regions, but the suppressive effects were more pronounced in the eastern region.
In recent years, global climate change has become an important issue that has sustained attention from many countries around the world (Liu et al., 2019; Awodumi and Adewuyi, 2020; Beltrami et al., 2021; Rehman et al., 2021). The massive emissions of carbon dioxide (CO2), one of the greenhouse gases, cause serious global warming. The International Energy Agency (IEA) reported that CO2 emissions would increase by nearly 5% to 33 billion tons in 2021 and that its main driver is coal demand, which is expected to grow by 4.5%, exceeding the 2019 levels and nearing its historical peak since 2014 (IEA, 2021b). Notably, cities consume two-thirds of the energy while generating over 70% of the global annual CO2 emissions (IEA, 2021a). Therefore, the urban CO2 emissions need more attention.
Consequently, it is an effective measure to mitigate global climate change via research on the forces driving CO2 emission changes and by formulating targeted policies. Therefore, many scholars have studied the driving factors of CO2 emissions (Li Y. et al., 2018; Wang and Zhang, 2021). Over the past few decades, China has become the largest developing country in the world. Rapid economic growth usually results in consumption of large amounts of fossil-based energy, with extremely high CO2 emissions. Nowadays, as the country with the highest CO2 emissions in the world, the Chinese government is formulating and implementing relevant policies to achieve “dual carbon” and “sustainable development” plans in response to global energy conservation and emission reduction targets. Chinese cities are responsible for about 85% of the overall CO2 emissions in China (Mi et al., 2016). As a result, the issue of CO2 emissions from Chinese cities deserves widespread attention (Shan et al., 2022).
To explore the causes of changes in the CO2 emissions, the index decomposition analysis (IDA) and structural decomposition analysis (SDA) are two basic methodologies used to analyze the factors driving CO2 emissions; these were first proposed by Ang et al. (1998) and Chang and Lin (1998) to quantify the potential factors driving changes in terms of different indicators and to provide valuable information for decision makers. Essentially, the IDA as an accounting method can easily capture the impacts of various factors on energy consumption or changes in CO2 emissions given a dataset. Moreover, the IDA affords the advantages of low data requirements while facilitating calculation and data analysis (Ang and Zhang, 2000; Yang et al., 2021). The IDA generally considers factors such as CO2 and energy intensities while ignoring the effects of other factors such as scale and technical efficiency, and ignoring these factors may skew the results so as to impact policy-making (Lin and Du, 2014).
SDA is a widely used analytical tool for modeling the relationship between supply and demand in an economy built upon the input–output theory (Chang and Lin, 1998; Wang and Han, 2021). Thus, the research scope of SDA involves the study of a single economy or multiple economies. De Araújo et al. (2020) used the SDA to explore changes in the structure and CO2 emissions of the European Union (EU) after accession of new member states. The SDA has high data requirements and relatively complex calculations, which are generally applicable to the analysis of CO2 emissions generated in trade between countries (Wang Q. et al., 2022).
Zhou and Ang (2008) proposed a new approach of decomposition analysis based on production theory called the PDA, which combines a distance function and data envelopment analysis (DEA) to decompose the changes in the total CO2 emissions. Given a set of input and output data, the production theory starts with the theoretical definition of general production technology using the best practice boundary based on the distance function. Then, the distance between the entity and best boundary indicates the degree of production inefficiency, through which the production efficiency and technology level of the entity can be assessed (Wang H. et al., 2018).
Based on literature, the PDA shows that low economic development, energy structure, and energy efficiency are the factors that contribute to China’s CO2 emissions (Wang et al., 2015); moreover, high technical efficiency contributes to the promotion of energy intensity, while capital–energy substitution has counterproductive effects (Zhou et al., 2022). From the point of view of production efficiency, improving the efficiency of energy use and emission technology will contribute to the emission reduction targets of the Chinese provinces (Wang H. et al., 2018). Wang et al. (2019) proposed an improved PDA method based on the non-radial directional distance function (DDF) and global Malmquist–Luenberger productivity index called the DDF-PDA; the researchers applied DDF-PDA to examine CO2 emissions from China’s energy industry and found that the methodology evaluates the decomposition efficiency more accurately and alleviates the infeasibility of linear programming compared to the traditional SDF-PDA. Tian et al. (2022) demonstrated the effects of efficiency and technology on the changes in sulfur dioxide (SO2) emissions from China’s industries during cleaner production and terminal treatment via the decomposition analysis method of the two-stage production theory. Nevertheless, using any one method alone to explore the factors driving CO2 emissions would not solve some of the complicated problems, so some scholars have integrated the IDA and PDA to formulate a new combined decomposition method (Ding et al., 2021; Wang Q. et al., 2022).
Numerous scholars have investigated the sources of urban CO2 emissions from production, consumption, or income perspectives (Zhang et al., 2016; Shao et al., 2020) and found that the emissions from fixed capital formation are dominant in most cities (Mi et al., 2019); to achieve the goal of reducing CO2 emissions, policy formulation should therefore focus on aspects such as encouraging low carbon consumption for residents and controlling capital investments in high-income CO2-emitting enterprises (Li J. S. et al., 2018). There are some studies on urban CO2 emissions that have focused mainly on national, regional, and provincial spatial scales, and many of these studies are analyzed from sectoral perspective (Li C. et al., 2022). In the research works on CO2 emissions using city unit data, possible scenarios for urban emission reductions applicable to individual cities have been proposed; for example, a scenario for Kyoto City found that Japan could achieve the national challenge goal of 80% CO2 reduction by 2050 (Shigeto et al., 2012). Sun et al. (2020) proposed an urban-industrial symbiosis system strategy and conducted feasibility studies on applying this strategy in the industrial city of Shenyang; they discovered that implementation of the system allowed the city to recover a certain amount of energy while reducing CO2 emissions.
Given the circumstances discussed above, the previously reported studies still have some drawbacks. First, among the studies on the factors driving urban CO2 emissions, very few have conducted global and systematic analyses of all cities in China. Second, the PDA methods have rarely been applied to existing studies on urban CO2 emissions. However, low carbon emission reduction targets cannot be achieved without studying the CO2 emissions from cities as they are the basic units of environmental policy implementations and priority areas for emission reductions (Fang et al., 2022).
In this study, we examine the specific factors driving the growth of CO2 emissions in 282 Chinese cities from 2003 to 2017 from an improved production-theoretical decomposition perspective. Moreover, this study aims to fill the existing research gaps in the following areas: first, we consider useful insights and holistic analysis to reveal the specific driving effects behind urban CO2 emissions that can be used for implementation of CO2 emission mitigation target policies in China. Second, we overcome the drawbacks of the Shephard production function in the traditional PDA model and use the improved PDA model proposed by Wang et al. (2019) to explore the drivers of urban CO2 emissions. This improved PDA model uses a non-radical and non-angular production function, which improves the accuracy of the estimation results and obtains more accurate drivers of the urban CO2 emission changes, thereby helping the achievement of urban CO2 emission reduction targets. Third, in addition to the systematic analysis of the drivers of urban CO2 emission changes as a whole, detailed and rigorous analyses from two heterogeneous perspectives, namely resource-based and non-resource-based cities as well as regional spatial heterogeneity, are considered.
The remainder of this work is organized as follows. Section 2 discusses the methodology and data that support the results and discussion in Section 3. Section 4 presents the conclusions and policy implications of this study.
To describe a production process, we suppose that there are
Based on Eq. 1, T is defined as environmental production technology, and each input can generate desirable and undesirable outputs. As described by Fare et al. (1989), if the outputs satisfy the assumption of strong disposability, then the undesirable outputs are identical to the desirable outputs and can be treated freely. In the production process, along with the desirable output growth, we need to control the increase in undesirable outputs. Therefore, this study assumes that the undesirable outputs are weakly disposable, as shown in (a). In addition, T must satisfy the null-jointness expressed by (b).
(a) If
(b) If
As shown above, hypothesis (a) implies that the reduction in undesirable outputs must be accompanied by a proportional reduction in the desirable outputs, and hypothesis (b) implies that the generation of undesirable outputs is inevitable in the production process.
From the limitations of the Shephard distance function, traditional PDA measures the efficiency of breakdown of the elements relatively independently, which causes each decomposition efficiency using the distance function orientation to have an obvious difference. Under this circumstance, the measured efficiency is underestimated, leading to misunderstanding by the policymakers and the inability to create scientific and effective carbon reduction policies. The non-radial DDF can adjust the input and output non-proportional changes to allow an increase in the desirable outputs while ensuring reduction of the undesirable outputs, thereby overcoming the defects of the DEA method in the traditional PDA decomposition process. According to Zhou et al. (2012), the non-radial distance function is defined as follows:
where g is a clear direction vector given as
Although the non-radial DDF overcomes the limitations of the traditional Shephard distance function, it may cause potential infeasibilities in the linear programming when measuring the cross-period DDF (Oh, 2010). Therefore, this study adopts the global non-radial DDF to overcome this defect, and the linear programming approach is as shown in Eq. 4:
In the research process, we can adjust the direction vector g based on the objective. If
The traditional PDA method has drawbacks such as underestimating the classification efficiency and infeasibility of linear programming, which lead to potential bias or incomplete decomposition results. In contrast, the DDF-PDA presented herein alleviates the two problems associated with the traditional PDA, in addition to identifying the potential factors driving changes in CO2 emissions more precisely (Wang et al., 2019).
Here, the input factors are set as the capital input (K), labor input (L), and energy input (E); the desirable output is the gross regional product (Y) and the undesirable output is the CO2 emission (C). According to Kim and Kim (2012) and Wang et al. (2019), we decompose the CO2 emissions in Chinese cities into an extended Kaya identity, as shown in Eq. 5.
Combining the non-radial DDF, we rewrite the extended Kaya identity in Eq. 5 as Eq. 6 to decompose the CO2 emission changes.
In Eq. 6, we replace the elements
According to Eq. 7, the CO2 emission changes in Chinese cities can be decomposed into five effects. On the right-hand side of Eq. 7, the first component is the CO2 emission effect (
Based on Oh (2010), we can further decompose the desirable and undesirable output productivity effects in Eq. 7 into Eq. 8 and Eq. 9, respectively.
In Eqs. 8, 9, the respective desirable and undesirable output productivity effects are decomposed into two components each. On the right-hand sides of Eqs. 8, 9, the first components represent the technical efficiency change effects (
The second components of the right-hand sides of Eqs. 8, 9 capture the effects of the best-practice gap changes on CO2 emissions (
Combing Eqs. 8, 9, the final decomposition of the CO2 emissions in Chinese cities is expressed as in Eq. 10.
In this study, 282 prefecture-level cities in China from 2003 to 2017 were selected as the research samples. The data on capital input is measured using the total investment in fixed assets. Labor input is measured by the number of employees at the end of a year. Energy input is represented by the electricity consumption data of urban districts (Yuan et al., 2020). The GDP and CO2 emissions of the cities are selected as the desirable and undesirable outputs, respectively. The CO2 emission data were retrieved from Chen et al. (2020). Specifically, the Defense Meteorological Satellite Program/Operational Linescan System (DMSP/OLS) and National Polar-Orbiting Partnership/Visible Infrared Imaging Radiometer Suite (NPP/VIIRS) were used together to calculate the energy-related CO2 emissions from 282 cities in China for 2003 to 2017. They are included in the model as the undesirable outputs in this work (Chen et al., 2020). The socioeconomic and environmental data were mainly retrieved from the China City Statistical Yearbook. The indicators and descriptive statistics of the input and output variables are shown in Table 1.
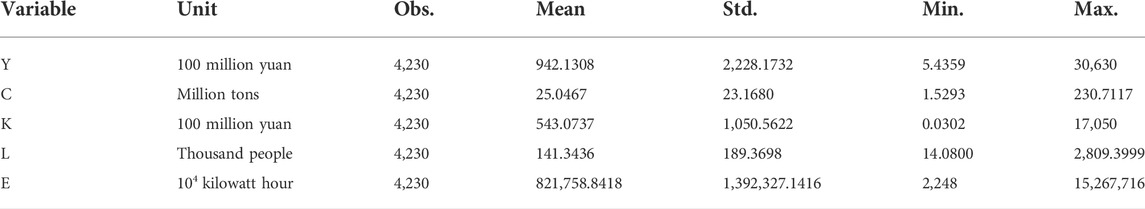
TABLE 1. Indicators and descriptive statistics of the input and output variables.
To better understand how the factors shape the changes in CO2 emissions in Chinese cities, Figure 1 shows the results of the decomposed components from 2003 to 2017. According to our estimations, the
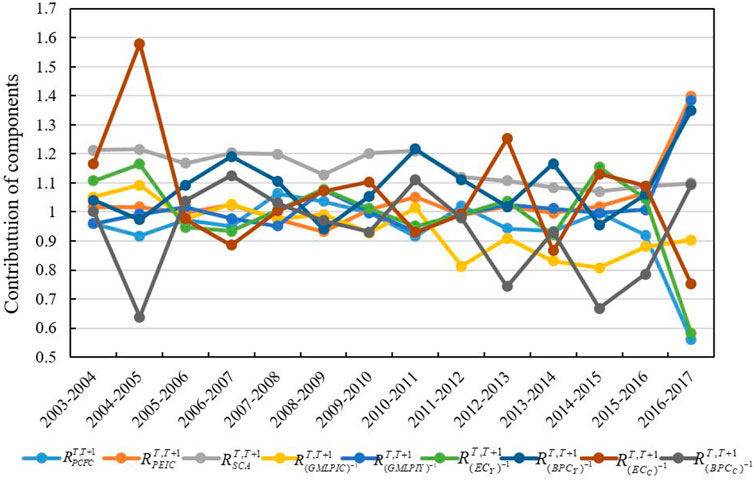
FIGURE 1. Changes in the CO2 emission decomposition components.
Meanwhile,
Conversely,
The impact of
As presented in Figure 2, the observation period can be divided into five stages, including the beginning years (2003–2005), the 11th five-year period (2006–2010), the 12th five-year period (2011–2015), the recent years (2016–2017), and the entire study period (2003–2017). We note that the differences in the contributions of the components to CO2 emissions change among these five stages. The changing trends with respect to
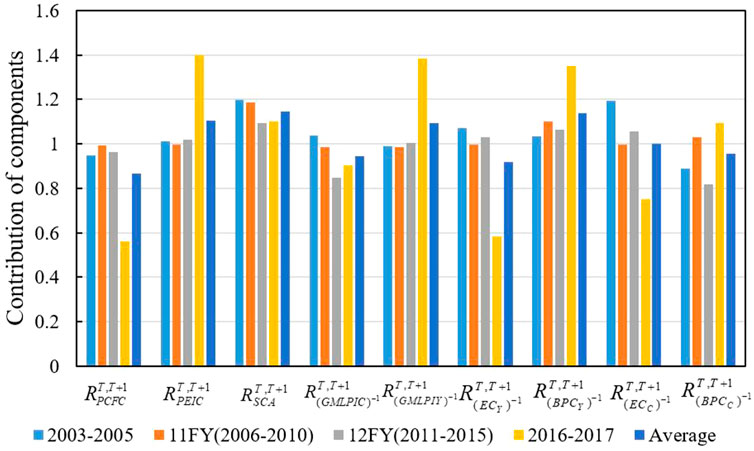
FIGURE 2. Contributions of different components to CO2 emissions in five stages.
Compared with the other decomposition components,
During the first two stages, the values of
Compared with other research periods, some decomposition effects played better roles in controlling the urban CO2 emissions in China during the 11th and 12th five-year periods, as shown in Figure 2, e.g.,
In 2013, the Chinese government issued China’s Sustainable Development Plan for Resource-Based Cities (2013–2020), which indicates that the development of resource-based cities is dependent on resource-intensive industries. In this condition, low carbon and energy transition are challenges for the resource-based cities. Owing to the heterogeneity of economic development and landscape in Chinese cities, we classified the cities as resource-based and non-resource-based cities to compare the decomposition components of the CO2 emission changes and find specifically targeted policy suggestions for these two types of cities. Figure 3 shows the classification results for the resource-based and non-resource-based cities; Figure 4 shows the classification results of the two types of cities for the different study periods according to the average values of the decomposed components.
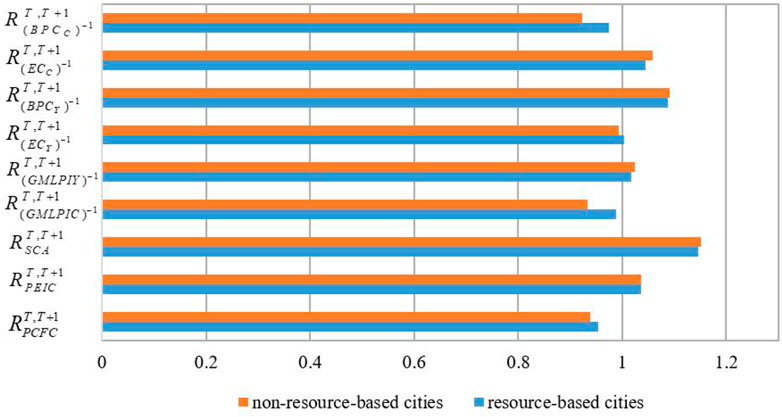
FIGURE 3. Decomposed components of the CO2 emission changes in resource-based and non-resource-based cities.
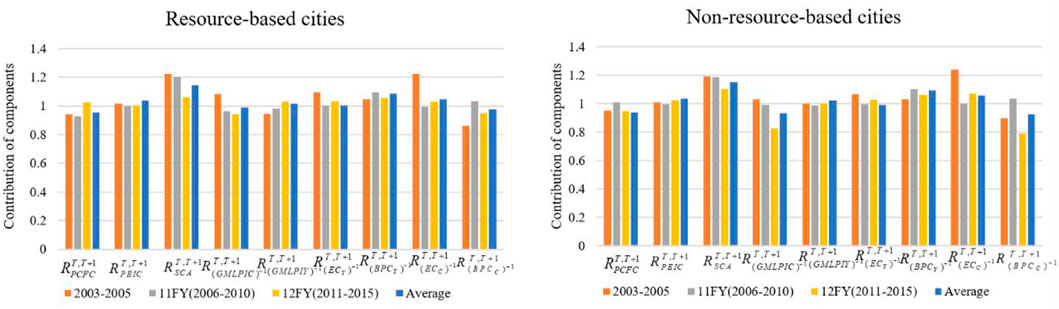
FIGURE 4. Decomposition effects of CO2 emissions in resource-based and non-resource-based cities for different periods.
Comparing the decomposition components of CO2 emission changes between the resource-based and non-resource-based cities, we found that the driving forces of the differences were generally in the same direction for both types of cities in China (Figure 3). In particular,
Further, although the directions of action are roughly similar, different decomposition effects have different impacts on the types of cities. As shown in Figure 3,
Given the heterogeneity between the resource-based and non-resource-based cities,
To facilitate presentation, Figure 4 shows the decomposition effects of the CO2 emissions in resource-based and non-resource-based cities for the different periods. As seen in Figure 4, during 2003–2005,
During 2003–2005,
From a spatial distribution perspective, we can compare the regional differences in the driving effects of CO2 emission changes. Figure 5 illustrates the driving effects of CO2 emission changes and provides insights into the decomposition trends in the study periods in the eastern, central, and western regions. In general, the volatility of
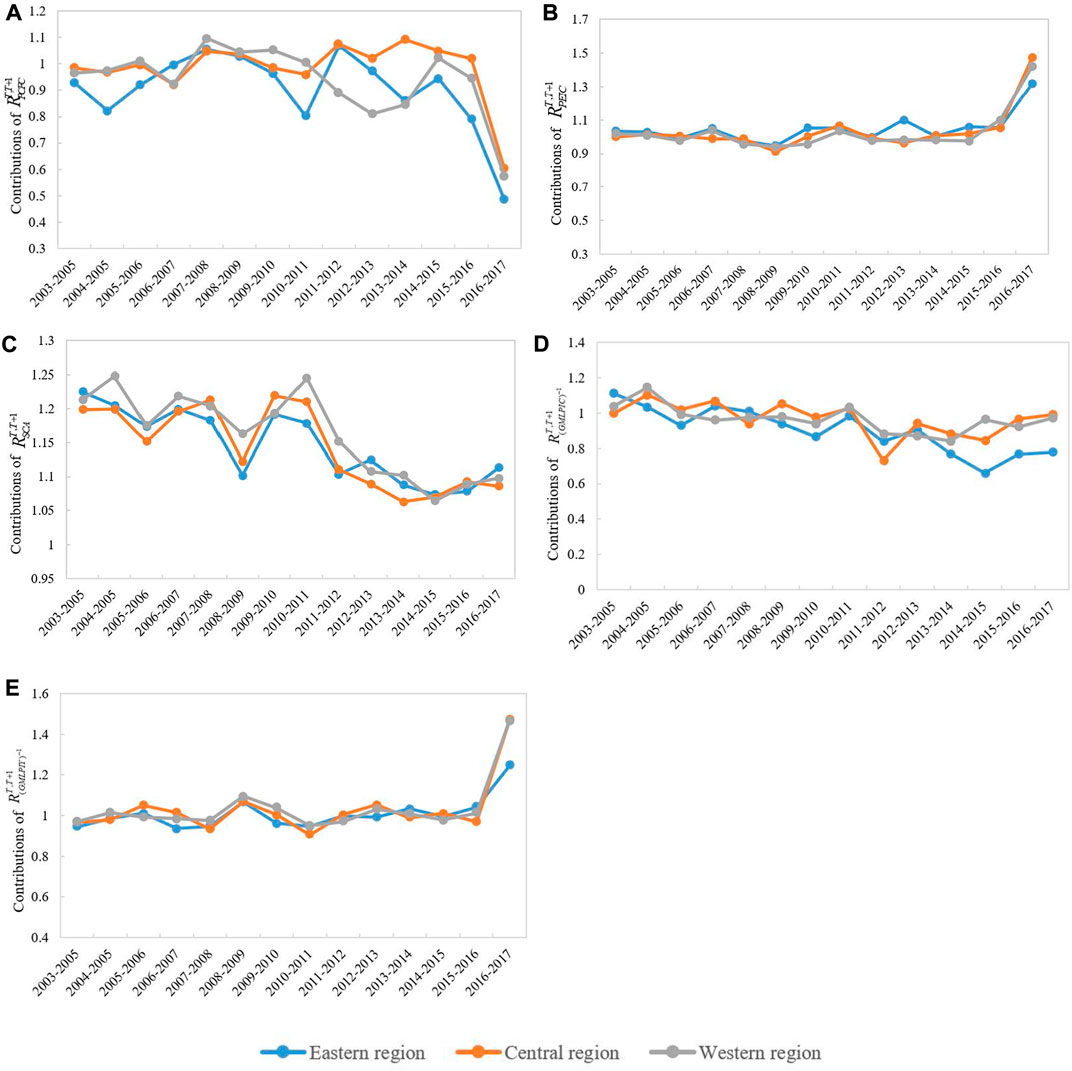
FIGURE 5. Driving effects of CO2 emission changes in three regions during the period of 2003–2017: (A)
Overall,
It is worth mentioning that
Furthermore,
Moreover,
This study applied an improved PDA method that combines the non-radial DDF and GML productivity index with the traditional PDA framework to decompose the CO2 emissions of 282 Chinese cities from 2003 to 2017. Moreover, this study also classified these 282 cities into groups based on different criteria to analyze and decompose the results in greater depth. Based on the empirical results, the conclusions are drawn as follows:
First, the decomposition results of CO2 emission growth show that the scale effect was the most significant contributor in Chinese cities. Simultaneously, the energy intensity and desirable output productivity effects played important roles in increasing CO2 emissions. With respect to the internal factors of the desirable output productivity effect, the desirable output technical efficiency change effect reduced CO2 emissions significantly, while the desirable output best practice gap change increased CO2 emissions with significant fluctuations. On the contrary, potential CO2 emission changes and undesirable output productivity effects were the dominant contributors to CO2 emission reductions in Chinese cities. Among the undesirable output productivity effects, the undesirable output technical efficiency change effect negatively affected CO2 emission reduction, while the undesirable output best practice gap change reduced CO2 emissions in Chinese cities.
Second, this study classified 282 Chinese cities based on two criteria as resource-based and non-resource-based cities as well as the differences in the urban spatial location distribution. Based on the resource-based and non-resource-based cities, we found that although the different CO2 emission decomposition effects in the two types of cities were consistent with the overall direction of action, the degrees of action were different. Specifically, the potential CO2 emission effects could greatly restrain the growth of CO2 emissions in resource-based cities. However, the promotional scale effect was more obvious in the non-resource-based cities. The progress of CO2 emission technology in the non-resource-based cities caused the undesirable output productivity effect to greatly inhibit the increase in CO2 emissions. Although the desirable output efficiency of the resource-based cities improved, the desirable output production efficiency had negative effects on reducing CO2 emissions owing to the outdated technologies.
Third, given the difference in the urban spatial location distribution, this study divided the cities into eastern, central, and western regions. The potential CO2 emission effects was more obvious in the eastern region. The energy intensity effect was a powerful measure to control the increase in CO2 emissions in all regions, especially the eastern region. The promotional scale effect on CO2 emissions showed significant fluctuations for each region. Compared with the other two regions, the promotional effect of the western region was more obvious. Undesirable output productivity had the effect of inhibiting the increase in CO2 emissions in the three regions, but this was more obvious in the eastern region. The desirable output productivity had a restraining effect in the eastern region but had promotional effects in the central and western regions.
Based on the above conclusions, we offer the following policy recommendations. First, economic development leads to emergence of the scale effect, which is the main factor for the increase in CO2 emissions. To control the increase in CO2 emissions in Chinese cities, the government could further strengthen technological innovations, focus on energy structure optimization, promote clean energy production, and reduce the dependence of economic growth on traditional fossil-based energy sources, thereby reducing CO2 emissions. In addition, the Chinese government could significantly control the use of fossil fuels and widely promote electrification to improve energy efficiency. Second, to control the increase in CO2 emissions effectively, resource-based cities could pay more attention to improvements in technology. For instance, accelerate the transition from a single-energy-led economy to a diversified and integrated economy as well as promote urban repair and ecological restoration. Moreover, the Chinese government can control CO2 emissions by upgrading the industries, such as integration of manufacturing with information technology, service industry, culture, and tourism. Third, we note that the development of China’s eastern, central, and western regions is uneven; hence, the government could appropriately implement a differential system when formulating emission reduction policies, e.g., assigning the provinces with low total CO2 emissions and low intensities the task of reducing CO2 emission intensities at the lowest level, while turning to the western region when approving carbon market quotas.
The original contributions presented in the study are included in the article/Supplementary Material, and further inquiries can be directed to the corresponding author.
RC: data curation, formal analysis, writing—original draft; ZZ: investigation, visualization, writing—original draft, conceptualization, supervision.
The authors declare that the research was conducted in the absence of any commercial or financial relationships that could be construed as potential conflicts of interest.
All claims expressed in this article are solely those of the authors and do not necessarily represent those of their affiliated organizations, or those of the publisher, editors, and reviewers. Any product that may be evaluated in this article or claim that may be made by its manufacturer is not guaranteed or endorsed by the publisher.
Ang, B. W., and Zhang, F. Q. (2000). A survey of index decomposition analysis in energy and environmental studies. Energy 25, 1149–1176. doi:10.1016/s0360-5442(00)00039-6
Ang, B. W., Zhang, F. Q., and Choi, K.-H. (1998). Factorizing changes in energy and environmental indicators through decomposition. Energy 23, 489–495. doi:10.1016/s0360-5442(98)00016-4
Awodumi, O. B., and Adewuyi, A. O. (2020). The role of non-renewable energy consumption in economic growth and carbon emission: Evidence from oil producing economies in africa. Energy Strategy Rev. 27, 100434. doi:10.1016/j.esr.2019.100434
Beltrami, F., Fontini, F., and Grossi, L. (2021). The value of carbon emission reduction induced by renewable energy sources in the Italian power market. Ecol. Econ. 189, 107149. doi:10.1016/j.ecolecon.2021.107149
Chang, Y. F., and Lin, S. J. (1998). Structural decomposition of industrial CO2 emission in taiwan: An input-output approach. Energy Policy 26, 5–12. doi:10.1016/s0301-4215(97)00089-x
Chen, J., Gao, M., Cheng, S., Hou, W., Song, M., Liu, X., et al. (2020). County-level CO2 emissions and sequestration in china during 1997–2017. Sci. Data 7, 391–412. doi:10.1038/s41597-020-00736-3
de Araújo, I. F., Jackson, R. W., Neto, A. B. F., and Perobelli, F. S. (2020). European Union membership and CO2 emissions: A structural decomposition analysis. Struct. Chang. Econ. Dyn. 55, 190–203. doi:10.1016/j.strueco.2020.06.006
Ding, T., Huang, Y., He, W., and Zhuang, D. (2021). Spatial–temporal heterogeneity and driving factors of carbon emissions in China. Environ. Sci. Pollut. Res. 28, 35830–35843. doi:10.1007/s11356-021-13056-9
Fang, G., Gao, Z., Tian, L., and Fu, M. (2022). What drives urban carbon emission efficiency?–Spatial analysis based on nighttime light data. Appl. Energy 312, 118772. doi:10.1016/j.apenergy.2022.118772
Färe, R., Grosskopf, S., Lovell, C. K., and Pasurka, C. (1989). Multilateral productivity comparisons when some outputs are undesirable: A nonparametric approach. Rev. Econ. Stat. 71, 90–98. doi:10.2307/1928055
IEA, (2021a). Empowering cities for a net zero future. Available at: https://www.iea.org/reports/empowering-cities-for-a-net-zero-future, Paris.
IEA, , (2021b). Global energy review 2021. Available at: https://www.iea.org/reports/global-energy-review-2021, Paris.
Kim, K., and Kim, Y. (2012). International comparison of industrial CO2 emission trends and the energy efficiency paradox utilizing production-based decomposition. Energy Econ. 34, 1724–1741. doi:10.1016/j.eneco.2012.02.009
Li, C., Li, H., and Qin, X. (2022a). Spatial heterogeneity of carbon emissions and its influencing factors in china: Evidence from 286 prefecture-level cities. Int. J. Environ. Res. Public Health 19, 1226. doi:10.3390/ijerph19031226
Li, J. S., Zhou, H., Meng, J., Yang, Q., Chen, B., and Zhang, Y. (2018a). Carbon emissions and their drivers for a typical urban economy from multiple perspectives: A case analysis for beijing city. Appl. Energy 226, 1076–1086. doi:10.1016/j.apenergy.2018.06.004
Li, K., Qi, S., and Shi, X. (2022b). The COVID-19 pandemic and energy transitions: Evidence from low-carbon power generation in China. J. Clean. Prod. 368, 132994. doi:10.1016/j.jclepro.2022.132994
Li, Y., Su, B., and Dasgupta, S. (2018b). Structural path analysis of India's carbon emissions using input-output and social accounting matrix frameworks. Energy Econ. 76, 457–469. doi:10.1016/j.eneco.2018.10.029
Lin, B., and Du, K. (2014). Decomposing energy intensity change: A combination of index decomposition analysis and production-theoretical decomposition analysis. Appl. Energy 129, 158–165. doi:10.1016/j.apenergy.2014.04.101
Liu, C., Jiang, Y., and Xie, R. (2019). Does income inequality facilitate carbon emission reduction in the US? J. Clean. Prod. 217, 380–387. doi:10.1016/j.jclepro.2019.01.242
Mi, Z., Zhang, Y., Guan, D., Shan, Y., Liu, Z., Cong, R., et al. (2016). Consumption-based emission accounting for Chinese cities. Appl. energy 184, 1073–1081. doi:10.1016/j.apenergy.2016.06.094
Mi, Z., Zheng, J., Meng, J., Zheng, H., Li, X., Coffman, D. M., et al. (2019). Carbon emissions of cities from a consumption-based perspective. Appl. Energy 235, 509–518. doi:10.1016/j.apenergy.2018.10.137
Oh, D. H. (2010). A global Malmquist-Luenberger productivity index. J. Product. Anal. 34, 183–197. doi:10.1007/s11123-010-0178-y
Pan, A., Zhang, W., Shi, X., and Dai, L. (2022). Climate policy and low-carbon innovation: Evidence from low-carbon city pilots in China. Energy Econ. 112, 106129. doi:10.1016/j.eneco.2022.106129
Rehman, A., Ma, H., and Ozturk, I. (2021). Do industrialization, energy importations, and economic progress influence carbon emission in Pakistan. Environ. Sci. Pollut. Res. 28, 45840–45852. doi:10.1007/s11356-021-13916-4
Shan, Y., Guan, Y., Hang, Y., Zheng, H., Li, Y., Guan, D., et al. (2022). City-level emission peak and drivers in China. Sci. Bull. doi:10.1016/j.scib.2022.08.024
Shao, L., Geng, Z., Wu, X., Xu, P., Pan, T., Yu, H., et al. (2020). Changes and driving forces of urban consumption-based carbon emissions: A case study of shanghai. J. Clean. Prod. 245, 118774. doi:10.1016/j.jclepro.2019.118774
Shigeto, S., Yamagata, Y., Ii, R., Hidaka, M., and Horio, M. (2012). An easily traceable scenario for 80% CO2 emission reduction in Japan through the final consumption-based CO2 emission approach: A case study of kyoto-city. Appl. Energy 90, 201–205. doi:10.1016/j.apenergy.2011.03.049
Sun, L., Fujii, M., Li, Z., Dong, H., Geng, Y., Liu, Z., et al. (2020). Energy-saving and carbon emission reduction effect of urban-industrial symbiosis implementation with feasibility analysis in the city. Technol. Forecast. Soc. Change 151, 119853. doi:10.1016/j.techfore.2019.119853
Tian, Y., Wang, Y., Hang, Y., and Wang, Q. (2022). The two-stage factors driving changes in China's industrial SO2 emission intensity: A production-theoretical decomposition analysis. Sci. Total Environ. 814, 152426. doi:10.1016/j.scitotenv.2021.152426
Wang, H., Ang, B., and Zhou, P. (2018a). Decomposing aggregate CO2 emission changes with heterogeneity: An extended production-theoretical approach. Energy J. 39, 39. doi:10.5547/01956574.39.1.hwan
Wang, Q., Chiu, Y.-H., and Chiu, C.-R. (2015). Driving factors behind carbon dioxide emissions in China: A modified production-theoretical decomposition analysis. Energy Econ. 51, 252–260. doi:10.1016/j.eneco.2015.07.009
Wang, Q., and Han, X. (2021). Is decoupling embodied carbon emissions from economic output in Sino-US trade possible? Technol. Forecast. Soc. Change 169, 120805. doi:10.1016/j.techfore.2021.120805
Wang, Q., Han, X., and Li, R. (2022a). Does technical progress curb India's carbon emissions? A novel approach of combining extended index decomposition analysis and production-theoretical decomposition analysis. J. Environ. Manag. 310, 114720. doi:10.1016/j.jenvman.2022.114720
Wang, Q., Wang, Y., Hang, Y., and Zhou, P. (2019). An improved production-theoretical approach to decomposing carbon dioxide emissions. J. Environ. Manag. 252, 109577. doi:10.1016/j.jenvman.2019.109577
Wang, Q., and Zhang, F. (2021). The effects of trade openness on decoupling carbon emissions from economic growth–evidence from 182 countries. J. Clean. Prod. 279, 123838. doi:10.1016/j.jclepro.2020.123838
Wang, S., Chen, M., and Song, M. (2018b). Energy constraints, green technological progress and business profit ratios: Evidence from big data of Chinese enterprises. Int. J. Prod. Res. 56, 2963–2974. doi:10.1080/00207543.2018.1454613
Wang, S., Sun, X., and Song, M. (2021). Environmental regulation, resource misallocation, and ecological efficiency. Emerg. Mark. Finance Trade 57, 410–429. doi:10.1080/1540496x.2018.1529560
Wang, S., Tang, Y., Du, Z., and Song, M. (2020a). Export trade, embodied carbon emissions, and environmental pollution: An empirical analysis of China's high-and new-technology industries. J. Environ. Manag. 276, 111371. doi:10.1016/j.jenvman.2020.111371
Wang, S., Wang, X., and Chen, S. (2022b). Global value chains and carbon emission reduction in developing countries: Does industrial upgrading matter? Environ. Impact Assess. Rev. 97, 106895. doi:10.1016/j.eiar.2022.106895
Wang, S., Wang, X., and Tang, Y. (2020b). Drivers of carbon emission transfer in China—An analysis of international trade from 2004 to 2011. Sci. Total Environ. 709, 135924. doi:10.1016/j.scitotenv.2019.135924
Yang, J., Hao, Y., and Feng, C. (2021). A race between economic growth and carbon emissions: What play important roles towards global low-carbon development? Energy Econ. 100, 105327. doi:10.1016/j.eneco.2021.105327
Yuan, H., Feng, Y., Lee, C.-C., and Cen, Y. (2020). How does manufacturing agglomeration affect green economic efficiency? Energy Econ. 92, 104944. doi:10.1016/j.eneco.2020.104944
Zhang, B., Qiao, H., Chen, Z., and Chen, B. (2016). Growth in embodied energy transfers via China’s domestic trade: Evidence from multi-regional input–output analysis. Appl. energy 184, 1093–1105. doi:10.1016/j.apenergy.2015.09.076
Zhao, Z., Shi, X., Zhao, L., and Zhang, J. (2020a). Extending production-theoretical decomposition analysis to environmentally sensitive growth: Case study of Belt and Road Initiative countries. Technol. Forecast. Soc. Change 161, 120289. doi:10.1016/j.techfore.2020.120289
Zhao, Z., Yuan, T., Shi, X., and Zhao, L. (2020b). Heterogeneity in the relationship between carbon emission performance and urbanization: Evidence from China. Mitig. Adapt. Strateg. Glob. Chang. 25, 1363–1380. doi:10.1007/s11027-020-09924-3
Zhou, P., Ang, B., and Wang, H. (2012). Energy and CO2 emission performance in electricity generation: A non-radial directional distance function approach. Eur. J. operational Res. 221, 625–635. doi:10.1016/j.ejor.2012.04.022
Zhou, P., and Ang, B. W. (2008). Decomposition of aggregate CO2 emissions: A production-theoretical approach. Energy Econ. 30, 1054–1067. doi:10.1016/j.eneco.2007.10.005
Keywords: urban CO2 emissions, production-theoretical decomposition analysis, driving effect, classification, city
Citation: Cao R and Zhao Z (2022) Exploring the driving forces of CO2 emission changes in Chinese cities: A production-theoretical decomposition analysis. Front. Environ. Sci. 10:1042856. doi: 10.3389/fenvs.2022.1042856
Received: 13 September 2022; Accepted: 28 September 2022;
Published: 20 October 2022.
Edited by:
Shuhong Wang, Shandong University of Finance and Economics, ChinaReviewed by:
Yuanxiang Zhou, Anhui University of Finance and Economics, ChinaCopyright © 2022 Cao and Zhao. This is an open-access article distributed under the terms of the Creative Commons Attribution License (CC BY). The use, distribution or reproduction in other forums is permitted, provided the original author(s) and the copyright owner(s) are credited and that the original publication in this journal is cited, in accordance with accepted academic practice. No use, distribution or reproduction is permitted which does not comply with these terms.
*Correspondence: Zhibo Zhao, emhpYm96aGFvMDcyOEAxNjMuY29t
Disclaimer: All claims expressed in this article are solely those of the authors and do not necessarily represent those of their affiliated organizations, or those of the publisher, the editors and the reviewers. Any product that may be evaluated in this article or claim that may be made by its manufacturer is not guaranteed or endorsed by the publisher.
Research integrity at Frontiers
Learn more about the work of our research integrity team to safeguard the quality of each article we publish.