 Zhijie Li
 Ziyi Ma1
- 1Gold Mantis School of Architecture, Soochow University, Suzhou, Jiangsu, China
- 2Research Centre for Urbanization with Chinese Characteristics, Soochow University, Gold Mantis School of Architecture, Soochow University, Suzhou, Jiangsu, China
The ecological stability of a region and the promotion of its coordinated environmental and economic development depend on habitat quality, which is a key indicator of the territory’s biodiversity capacity. A case study is done in Suzhou City, Jiangsu Province, to determine how land use changes affect habitat quality. The types of land use in 2030 are simulated based on 2000, 2010, and 2020. The InVEST and CA-Markov models analyze and predict how land use will change in Suzhou. Spatial analysis methods, such as the standard deviation ellipse, the center of gravity analysis, spatial autocorrelation, and random forest models, were used to reveal the spatial and temporal variation characteristics of habitat quality and to analyze its influencing factors. The bare land, building lands, and non-construction lands significantly increased in Suzhou city’s land use types between 2000 and 2030 due to land use changes, while the water bodies and forests gradually decreased. Most of the high-quality habitats in this region are found in the water bodies and the mountains. In contrast, the poor habitat quality in this area is mainly concentrated in urban construction lands. The habitat quality gradually declined over time, and its center of gravity followed the migration path from northeast to southwest. The temporal and spatial distribution of habitat degradation in Suzhou reveals a trend of habitat degradation from downtown to suburban areas. This degradation is most common in mountainous and forest areas where the landscape is highly fragmented. Habitat quality in Suzhou city has changed over time and space due to spatial patterns, socioeconomic factors, land use, and the natural environment, with land use having the most significant impact.
1 Introduction
Habitat quality can be defined as the adaptation of an ecosystem for the sustainable survival and development of its individuals and populations, which reflects the regional biodiversity to some extent. It is crucial in maintaining regional ecosystems’ stability, the viability of urban development, and human well-being (Hillard et al., 2017). The expansion of construction land and land use changes caused by rapid urbanization reduce urban land use efficiency and then affect the circulation of material flow and energy flow between regional habitat patches, resulting in fragmentation of regional habitat patches, reduction of biodiversity, and ultimately affecting habitat quality (Zheng and Li, 2022). Therefore, evaluating and predicting the quality of urban human settlements is very important.
Early assessments of habitat quality are mainly based on static analysis, focusing on the impact of habitat conditions on species in the specific regional environment. The primary data was obtained through field investigation, which was then summarized into an empirical model, and used to construct an evaluation index system centered on the research species and land use types, such as the riparian vegetation index, riparian quality index (Munné et al., 2003), and river habitat index (Lee et al., 2018; Yang et al., 2018). This method produces accurate results at a high cost, on a limited scale, and with a long turnaround time. With the advancement of information technology, several computerized information models now provide a variety of methods for evaluating habitat quality. Habitat quality research has gradually become more visual, formal, and dynamic and is suitable for multiscale and long-term series (Boumans et al., 2015). Examples include the SOLVES, HSI, and InVEST models (Kubatova and Krocil, 2020; Zhang Y. et al., 2020). The InVEST model is the most comprehensive ecosystem assessment model currently in use.
The original intention of the investment model is to make reasonable decisions in natural resource management. It can quantify ecosystem service functions and show them graphically to determine where investments may improve the welfare of human beings and the environment. The assessment results assist in the management of rational development and utilization of land and other resources. Maintaining a balance between human and natural interests requires the preservation of biodiversity, coordinating environmental protection with economic development, and maintenance. The theory behind the model aims to provide a scientific way for decision-makers to measure the advantages and disadvantages of human activities by simulating changes in the quantity and value of ecosystem services under different land cover scenarios (Nematollahi et al., 2020).
The rapid development of urbanization leads to a rapid increase of bare urban lands and construction land, resulting in an imbalance in land use and a decline in regional habitat quality (Carlson et al., 2019). To understand the distribution patterns of habitat quality, it is necessary to simulate and predict land use change accurately. The automated cellular model, land use change and effects model (Mamanis et al., 2021), system dynamics model (Shen et al., 2012), and Markov model can be used to anticipate and analyze the current land use change (Jon et al., 2021). To optimize land use patterns and regional habitat quality, combining the InVEST and CA-Markov models to simulate the impact of land use change on habitat quality is essential.
Spatial autocorrelation refers to the potential interdependence between various variables affecting the research object within the research area. It is a statistical technique used in geographical research. It is used to check the relationship between geographical variables and the spatial relationship of geographical locations (Diniz-Filho et al., 2009). Moran’s I. (Jackson et al., 2010), Geary’s C (Yamada, 2021), and Getis are examples of frequent spatial autocorrelations (Pino-Caceres et al., 2022). These methods have both advantages and disadvantages due to their limited applicability. In these methods, the functional space can be roughly divided between global spatial autocorrelation and local spatial autocorrelation. Generally, global spatial autocorrelation is used to describe the global distribution of this phenomenon. The local spatial autocorrelation can be used to identify the range of spatial hot spots and whether or not there is a clear correlation between spatial autocorrelation and special hot spots. If the significance is high, the regional space shows clustering characteristics (Henebry, 1995). Spatial autocorrelation analysis has a long history of research and has been applied in many disciplines, including the natural and social sciences.
As an important city in the Yangtze River Delta urban agglomeration, the ecological restoration of Suzhou is very important for maintaining the stability of the regional ecological pattern. In recent years, Suzhou’s economy has been developing rapidly. Rapid urbanization leads to the rapid expansion of urban construction land. Large-scale encroachment into forests and water areas seriously endangers the ecological environment. It is important to understand the advantages and disadvantages of human settlement quality and how it affects high-quality urban development and the regional ecological environment (Zhao et al., 2019; Li L. et al., 2022). However, in the existing literature, limited digital habitat quality research, simulations, and analyses of the spatial and temporal evolution characteristics of habitat quality based on land use change’s physical and spatial evolution are available. There are few in-depth analyses of the influencing factors of habitat quality from a macro-pattern perspective. This study combines land use simulation with a spatial analysis of habitat quality to observe how it changes over time and which factors will affect it. This approach is very important for the analysis of regional ecosystem services.
2 Material and methods
Suzhou is situated in the southeastern Jiangsu Province of China (Figure 1). It is an important city in the Yangtze River Delta. The area of Suzhou city is 8,488.42 square kilometers (Km). The city is low and flat, with plains accounting for 54.8% of the total area with an average elevation of 4 m. The hilly area accounts for 2.7% of the total land area. The total economic value of Suzhou reached a new height of $ 2 trillion in 2020. Currently, Suzhou is divided into six municipal districts (Gusu District, Industrial Park, Wuzhong District, Wujiang District, High-tech Zone, and Xiangcheng District) and four county-level cities (Taicang, Zhangjiagang, Changshu city, and Kunshan city).
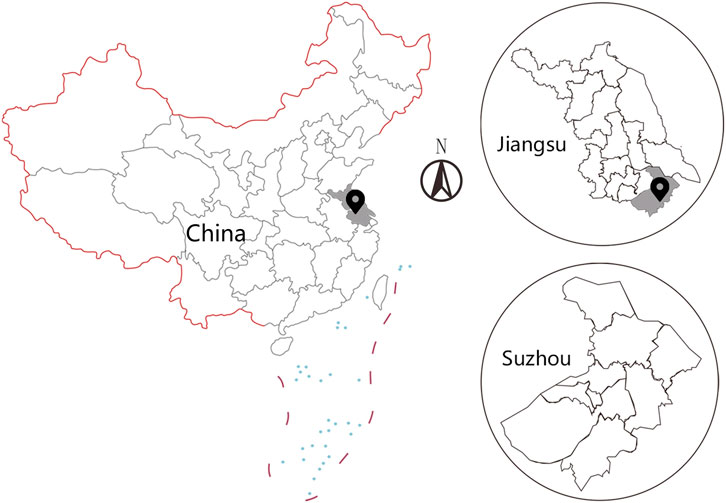
FIGURE 1. Overview of the research area.
2.1 Research design
Based on the land use data of Suzhou in 2000, 2010, and 2020, the characteristics of urban land use change from 2000 to 2020 were explained by the land use transfer matrix, and the CA-Markov model predicts the land use change in 2000 and 2010. The land use in 2030 was simulated using the 3 years of land use history. The habitat quality module of the InVEST model was used to look at how Suzhou’s habitat quality has changed and predict how it will change in the future (Supplementary Figure S1).
2.2 Research data sources
The research data was derived from a raster data set from 2000, 2010, and 2020 with a resolution of 30 m provided by the Resource and Environmental Science Center of China Academy of Sciences (Zhang X. et al., 2022). According to the land use planning of Suzhou, the area is divided into six types: cultivated lands, forests, grasslands, water bodies, construction lands, and bare lands (Figure 2).
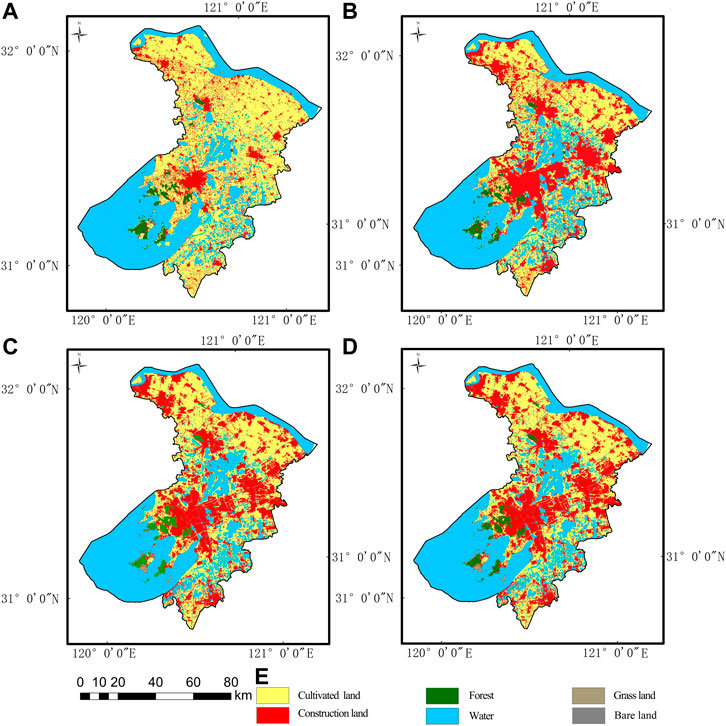
FIGURE 2. Land use types according to the planning strategy of Suzhou (A) 2000, (B) 2010, (C) 2020 and (D) spatial distribution simulation of land use type in 2030.
2.3 Research methods
2.3.1 InVEST model
When the spatial characteristics of Suzhou City were taken into account, forests, grasslands, water bodies, and other naturally occurring ecological ecosystems were classified as habitats when combined. Whereas the area used for construction was classified as a non-habitat. The precise calculating formula is as follows:
where Qxj represents the habitat quality of grid x in plot j, Hj represents habitat suitability in plot j, Dxj represents habitat degradation degree of x in plot j, K represents half saturation coefficient Dxj, and Z represents normalized constant.
where: R and Wr are the numbers of threat sources and the weight of threat source r, Yr is the grid number of threats, ry is the stress level of grid X by the stress value of grid Y, and irxy is the stress effect of stress factor R in Y on habitat grid unit X (Zhao L. et al., 2022).
Generally, executing a habitat quality model requires the influence of distance and weights of stress factors and the compatibility and sensitivity of habitat components to each risk factor. Among these standards, the hazard installation must thoroughly check the impact of land use on regional habitat units. A thorough literature review showed that common hazard sources include cultivated land, urban construction land, unused land, railways, and highways (Li et al., 2022a; Zhang H. et al., 2022; Zheng et al., 2022). It assigns the appropriateness and sensitivity of threat factors according to relevant research. The habitat quality index ranges from 0 to 1, with one indicating medium-to-high habitat quality. The quality of the environment was graded as follows: low (grade 1), medium-low (grade 2), intermediate (grade 3), medium-high (grade 4), and high (grade 5).
2.3.2 CA-Markov model
CA-Markov models are based on soil and land use change resulting from the interaction of several land use types within a region. The land use types represented by the core cell were modified by the land use types represented by the domain cell. The Markov chain controls the time passing through the land-use transformation matrix. Cell automation comprises three parts (Sang et al., 2011; Zhou et al., 2020). 1) Cells: Each cell is a unit containing information about its current state. 2) A lattice forms the cellular space: It is a collection of cells, a generalized two-dimensional cellular automaton permutation. It is triangular, quadrilateral, or hexagonal. 3) Rules: refers to a model of state transition determined by rules, which can be based on the current total of the cells. The state of its domain predicts the subsequent state of the cell. The formula for the expression is as follows:
where S represents the discrete set state of cells, t and t+1 represent distinct times, f represents the fixed conversion rules between cells, and N represents the cell’s neighborhood.
In the accuracy test, data from 2000 was used as the baseline, and the above method replicated the land use scenario in 2010. On this basis, the Kappa cross coefficient between the simulated map of 2010 and the actual land use in 2010 was tested using the following contents:
where Po is the proportion of correct simulations, Pc is the proportion of accurate predictions in a random model case, and Pp is the proportion of correct predictions in the ideal case.
2.3.3 Spatial autocorrelation analysis
Spatial autocorrelation describes the important relationship between the attribute value of a specific element in space and its neighboring features, subdivided into global and local autocorrelation. The current research analyzed global auto-correlation. Moran’s I was used to determine the spatial quality accumulation, while the LISA index was utilized to determine the spatial agglomeration distribution type of habitat quality. The Get’s-Order* was utilized to determine the spatial emphasis pattern of the agglomeration types (Legendre, 1993; Smouse and Peakall, 1999).
2.3.4 Standard deviation ellipse and centerfold shift
A standard deviation is an important tool for studying the characteristics of time and geographical differences. It reflects the degree of spatial and temporal differentiation and spatial agglomeration (Zhang Y. et al., 2022; Zhao Y. et al., 2022). Most of the time, researching the center of gravity is used to figure out the direction and distance of Suzhou habitat quality in the center of gravity’s distribution interval over different periods. The equation is:
Where X and Y represent the longitude and latitude values of the distribution center of Suzhou habitat quality in a particular time interval, Xi and Yi represent the longitude and latitude values of the distribution of Suzhou habitat quality in a particular time interval, Q represents the habitat quality quantity in a particular time interval, and i represents a particular time interval.
2.3.5 Random forest model
A random forest is an approach for machine learning that uses many trees to train and predict sample data. It builds many models by merging several weak classifiers, assesses the contribution of each variable under various models, and determines the relevance ranking of variables (Xue and Yan, 2022).
2.3.6 Selection of influencing factors
We selected the relevant influencing factors (social economy, land use, and natural environment) from the four landscape patterns (Qi and Wu, 2005; Weber et al., 2018; Clairmont et al., 2021; Zhang X. et al., 2022). As a characteristic of the landscape’s spatial structure, landscape patterns represent spatial heterogeneity. The selection of indicators consists of Shannon’s diversity index (SHDI), contagion index (CONTACT), aggregation index (AI), and patch density (FD); social and economic activities are significant indicators for measuring the intensity of regional construction and have a significant impact on the regional ecosystem. The selection of indicators comprises population density (PD), per capita GDP, night scene lighting data, and the comprehensive land use index (L); land cover indicators comprise the normalized difference vegetation index (NDVI) and the normalized difference water index (NDWI), and natural environment indicators comprise elevation (EV) and slope (SP) (Supplementary Figure S2).
3 Results
3.1 Land use change
The types of land use in Suzhou are agricultural land, water area, and construction land. Agricultural land accounts for 50.6% of the total area, and water area accounts for 34.9% (Figure 3A). From 2000 to 2010, the land use type with the greatest change was cultivated lands, with a net transfer of 4,357.05 km2, mainly in water area (274.641 Km2) and construction lands (1,161.627 Km2). Secondly, construction land and water area, with 36.708 Km2 of construction land converted into cultivated land and 70.238 km2 of water area converted into construction land (Figure 3B). Although the urbanization process is accelerating, the phenomenon of blind reclamation and expansion of cultivated lands and development in Suzhou still exists.
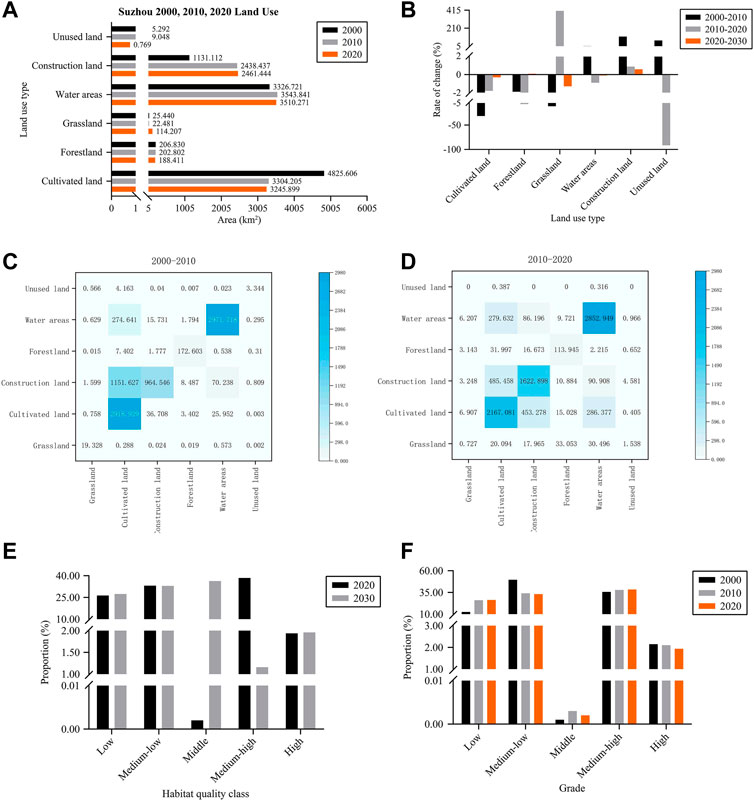
FIGURE 3. (A) Land use type change, (B) land use change rate (%), (C) 2010–2020 land use transfer, (D) 2000–2010 land use transfer, (E) habitat quality class, (F) Habitat quality grade in Suzhou.
Moreover, the substantial increases in water and construction land areas resulted in a net increase of 274,641 km2. From 2000 to 2010, Suzhou made great efforts to restore farmland around the lake, and the most obvious achievement was the increase in the water areas caused by farmland. The net increase in construction land is 1,151.627 km2, most of which comes from agricultural land, indicating that the increase in urban construction land depends greatly on the continuous invasion of agricultural areas. On the whole, there is little difference between grassland and non-construction area (Figure 3C).
From 2010 to 2020, the biggest change in land use type occurred in water bodies, with a net transfer of 3,263.262 km2, mainly agricultural land (286,377 km2) and construction land (90,908 km2). Rapid urban expansion has increased the demand for agricultural land and urban construction land, eroding urban water systems and lakes. A portion of the second-largest transferred area comprises cultivated and construction land. There has been a net transfer of 2,984.648 Km2 of cultivated land, mainly 485.485 Km2 into construction land and 279.632 Km2 into the water. The net transfer of construction land was 2,197 km2, mainly including 2 km2 of cultivated land and 86.196 Km2 of water transfer (Figure 3D). The forecast of land use types in 2030 based on the CA-Markov model showed that the evolution of main land use types in Suzhou would follow the evolution tracks from 2000 to 2020. By 2030, the areas of unused land, grassland, and water will continue to shrink, while the areas of forests and building lands will expand. The area of forests and grassland increased significantly between 2010 and 2020, while the rate of change of cultivated land and construction lands gradually decreased. Additionally, there was significant pressure on the occupation and compensation of cultivated land. Construction land and gardens experienced the greatest shift among all land uses.
3.2 Habitat quality
3.2.1 Habitat quality in Suzhou from 2000 to 2020
The habitat quality index is related to the ability of the environment to provide suitable habitats for species and maintain population changes. In 2000, 2010, and 2020, the average habitat quality in Suzhou was 0.4656, 0.4168, and 0.4182, respectively; this area showed a general reduction in habitat quality. In 2000, 2010, and 2020, the standard coefficients for the variations in habitat quality were 0.2337, 0.2843, and 0.2867, respectively. The standard deviation coefficient showed an upward trend, indicating the variation of regional habitat quality increased steadily.
Low habitat quality has increased from 2000 to 2010, with an overall increase of 13.44%, to compare the variations in the regional habitat (Figure 3E). Habitats of intermediate and high quality underwent a little change and were relatively stable. Overall, there was a downward trend of high-quality habitat, but the decline was insignificant, accounting for a small proportion. For a long time, inferior and low-quality habitats were the norm, with a low overall balance of high-quality habitats. This indicates that the habitat quality in Suzhou has been very poor for a long time and is continuously declining. From 2000 to 2020, the overall living quality of Suzhou had an irregular spatial distribution, with a low-quality core surrounded by high-quality peripheries. Most high-quality ecosystems were in the lakes and mountains in the south, central, and north of China, including Taihu Lake in the south. There is a lot of forest cover in this area, and the landscape is broken. Therefore, the quality of the habitat has been greatly protected. It is widely distributed, mainly concentrated in big city centers and traffic corridors in different areas, and agricultural land is its predominant land type. Gusu district, industrial parks, and county-level cities in Suzhou have the largest construction areas and the lowest living quality.
3.2.2 Prediction of habitat quality in Suzhou in 2030
The fraction of different habitat quality levels in Suzhou in 2030 was determined using CA-Markov and InVEST models (Figure 4). The changing trend of Suzhou’s habitat quality from 2020 to 2030 was consistent from 2010 to 2020, showing an overall downward trend (Table 1). The quality of medium-high-quality ecosystems will be declined by 96.97% between 2020 and 2030. The proportion of high-quality habitats will be increased by 0.73%, while the quality of most habitats will be turned to medium and low quality. By 2030, the medium-level habitat area will be increased from 0.251 km2 in 2020 to 3,497.675 km2, and this rapid change will be overall.
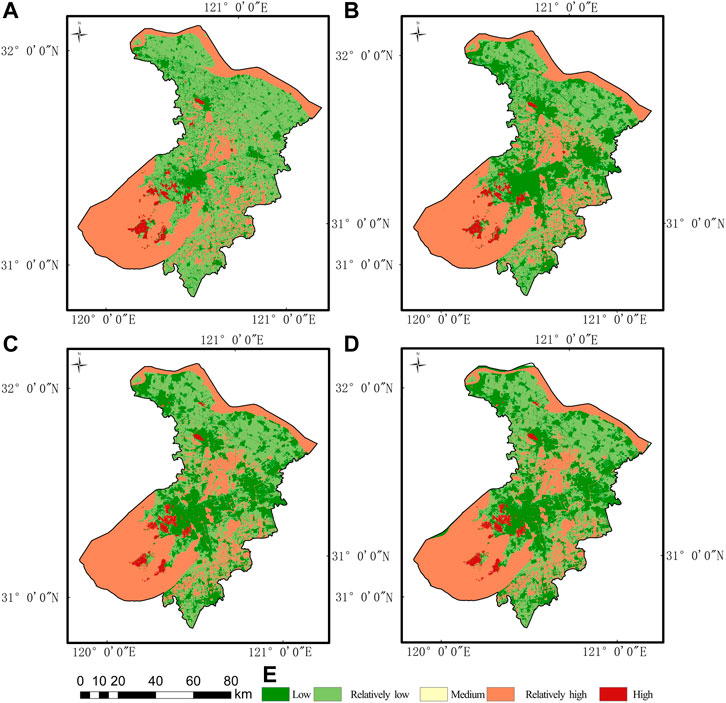
FIGURE 4. Habitat quality and its spatial distribution in Suzhou in different periods (A) 2000, (B) 2010, (C) 2020 and (D) spatial distribution simulation of habitat quality in 2030.
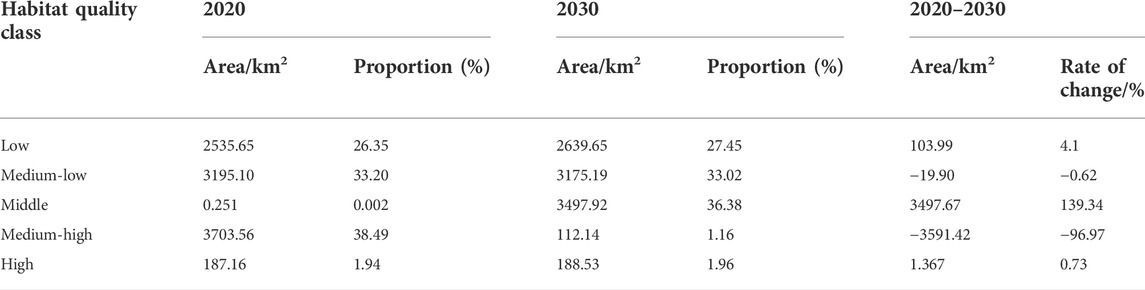
TABLE 1. Change in area and percentage of different habitat qualities in Suzhou from 2020 to 2030.
By 2030, the low-level residential quality in Suzhou will be concentrated in the construction land area, namely Gusu District, Industrial Park, Wuzhong District, Xiangcheng District and High-tech Zone in the central city, Kunshan in the east, Zhangjiagang and Changshu in the north. According to this pattern, the overall living quality of Suzhou will continue to decline through the year 2030. The main reason is that there will be a steady increase in land development between 2020 and 2030, while habitat-friendly land types, such as grasslands and water areas, will gradually decline (Figure 3F).
3.3 Spatial aggregation of habitat quality
The global Moran value and sI values of Suzhou habitat quality from 2000 to 2030 were 0.495, 0.573, 0.5855, and 0.5826 at a confidence level of <0.01, which indicated that Suzhou habitat quality had spatial aggregation. The spatial agglomeration distribution of habitat quality in Suzhou between 2000 and 2030 exhibited the following characteristics: 1) most high-value and high-value agglomeration (HH) regions will be located around Taihu Lake, the northern Yangtze River Basin, and Yangcheng Lake. They are also the main water bodies and lakes concentrated areas in Suzhou. 2) From 2000 to 2030, low-value and low-value agglomeration (LL) regions are primarily distributed in Suzhou’s urban core and several county-level cities’ urban cores. 3) The LL and HH components have an irregular distribution, and their total proportion is minor. Both high- and low-value agglomeration areas exhibited an upward tendency. However, the total growth rate of the low-value agglomeration area will be slightly higher than that of the high-value agglomeration area, which indicates that the living quality of Suzhou might deteriorate (Figure 5).
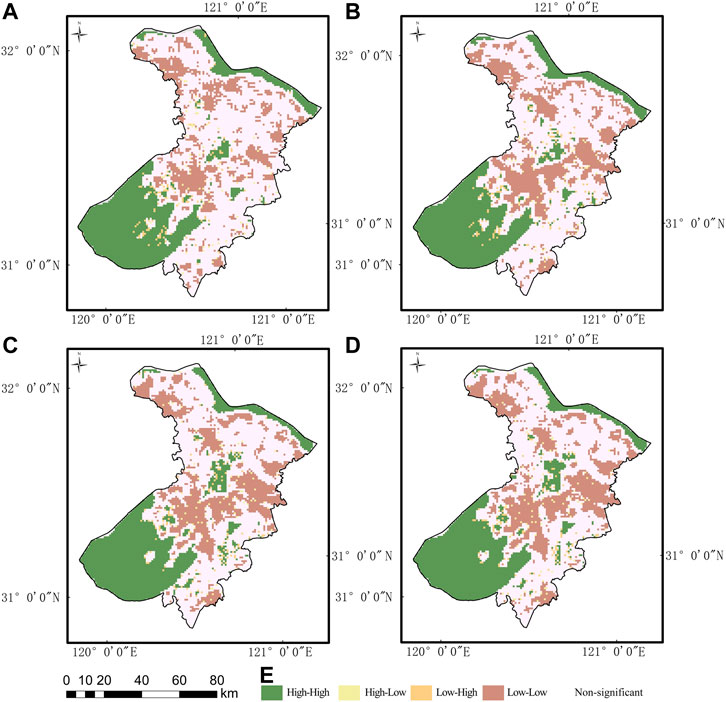
FIGURE 5. Spatial aggregation and distribution of habitat quality in Suzhou in different periods (A) 2000, (B) 2010, (C) 2020 and (D) spatial clustering and distribution simulation of habitat quality in Suzhou in 2030.
3.4 Characteristics of the temporal evolution of habitat quality
In 2000, 2010, and 2020, the center of gravity of the standard deviation ellipse was located in Gusu District, Suzhou. In the past 30 years, the longitude of the center of gravity of Suzhou’s habitat quality moved between 120° 58′ 21″ E and 120° 57′ 03.03″ E, while the latitude moved between 30° 41′ 18″ N and 30° 40′ 36″ N (Table 2). The geographical angle of habitat quality increased from 31 00′ 27″ in 2000 to 31 31′ 39″ in 2030. Between 2010 and 2030, the center of gravity of the annual standard deviation ellipse moved 1.992 km to the southwest, 0.035 km to the west, and 0.54 km to the northwest. The migration trajectory of the center of gravity changes into a “C” shape, indicating Suzhou’s high habitat quality (Table 3).
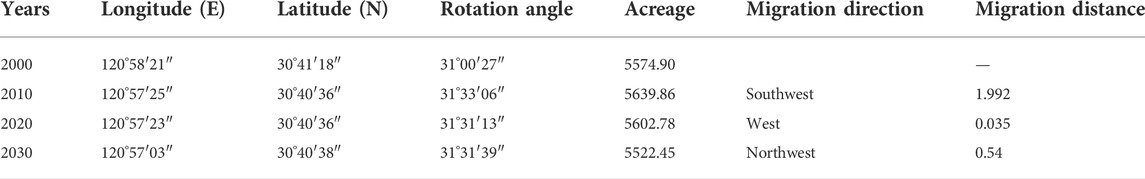
TABLE 2. Characteristic value of the center of gravity of habitat quality.

TABLE 3. The ellipse parameter values for the standard deviation of habitat quality.
The population fluctuation features are notable in terms of spatial distribution, and the entire population is gradually relocating to the Taihu Lake Basin and Lingyan Mountain Area in the southwest. The long axis in each ellipse period is larger than its short axis based on the space length of the standard deviation ellipse, indicating that the direction is quite clear and pointing to the northeast and southwest. Based on the area of the ellipse with three standard deviations, the general trend is “first rising and then falling,” indicating that over time, there is an imbalance among the residential quality districts in Suzhou, and the regional spatial agglomeration characteristics are gradually strengthened (Figure 6).
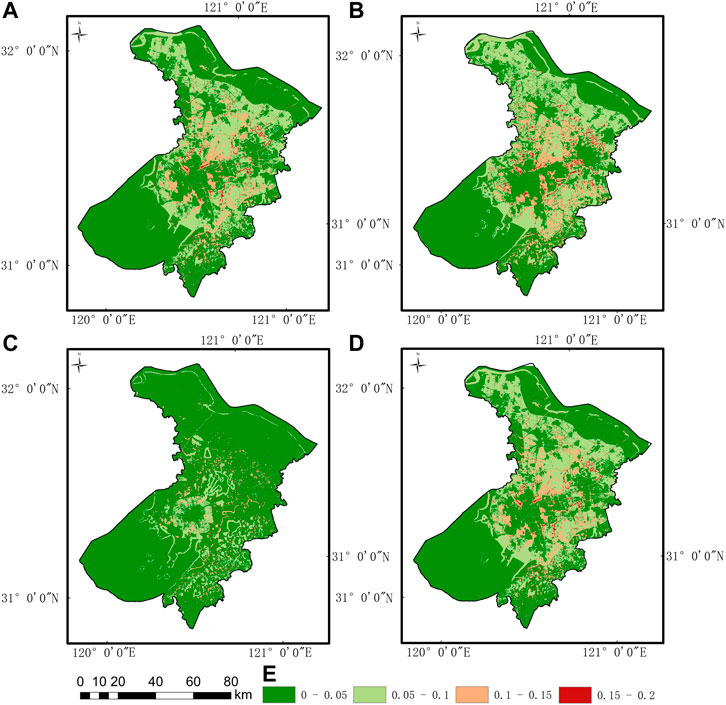
FIGURE 6. Distribution of habitat degradation degree in Suzhou in different periods (A) 2000, (B) 2010, (C) 2020 and (D) spatial distribution of habitat quality degradation simulation in Suzhou in 2030.
This range represents the degree of habitat degradation caused by existing land-use types. Suzhou’s average habitat degradation index from 2000 to 2030 is 0.0259, 0.0424, 0.0382, and 0.0384. The overall habitat quality of Suzhou has deteriorated obviously, and the degradation in a wide range from the periphery to the center is becoming increasingly obvious. The most obvious habitat deterioration occurred in Kunshan, Changshu, and Suzhou industrial park. The city’s rapid growth occupies natural places such as forests and wetlands, threatens the urban ecosystem, destroys the landscape, and greatly reduces the habitat quality. Overall, the degree of habitat deterioration in low-level areas is more obvious. Due to the scattered distribution of paddy fields and lakes in the Suzhou area, the habitat environment is more complicated, which leads to the scattered distribution trend of habitat quality and habitat degradation. The vulnerability of land use categories, such as forests and water, to threats such as construction and transportation land is mostly blamed for this problem. Therefore, the growth of construction land in Suzhou has led to the gradual deterioration of habitats in Kunshan City and Zhangjiagang City, etc., Due to Suzhou’s requirement for ecological preservation, the forests surrounding Taihu Lake and Lingyan Mountain are protected, so habitat quality damage is controlled. After utilizing the random forest model, it is found that land use index > NDVI > population density > NDWI > night scene light intensity > elevation > slope > GDP per capital > AI > FD > SHDI > CONTAG are the most important factors for habitat quality (Figure 7).
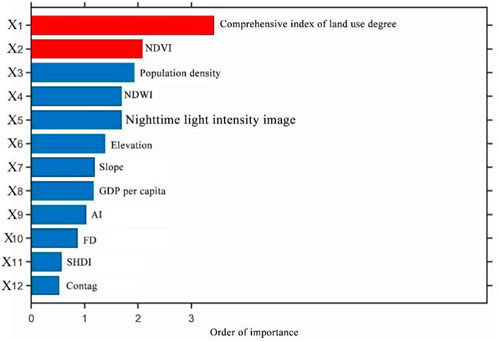
FIGURE 7. Ranking of the importance of influencing factors.
4 Discussion and conclusion
4.1 Causes of land use change
Land use change is greatly influenced by economic development. Economic growth has accelerated the process of urbanization, the industrial structure is close to balance, and the demand for construction land has increased sharply, resulting in a reduction of bare land area. The development of Suzhou’s multi-lake fishery has led to an increase in the area of water bodies and a reduction in the area of bare lands. Eventually, the population increase drives urbanization. With the gradual expansion of towns to the surrounding countryside, land use will transform more and more agricultural land into non-agricultural residential and construction land. The economy is in a phase of high-quality development. Urbanization will continue to cause changes, and the cultivated land area will shrink, although the rate of land use change will be slow.
From 2000 to 2020, the spatial distribution of land use in Suzhou showed that the water area and agricultural land were concentrated, while the forest and development land was scattered. Taihu Lake on the southwest, the Yangtze River basin on the north, and several rivers and lakes in the region are the main waters. Agricultural land use is the most common. From 2000 to 2010, Suzhou’s construction land expanded rapidly from the center to the periphery, and the water area gradually increased. From 2010 to 2020, the expansion rate of construction lands area gradually decreased, but the degree of patch aggregation increased obviously. In Suzhou, the area of forest, water, and grassland decreased significantly between 2000 and 2030, whereas the area of construction land significantly increased (Lambin et al., 2001).
As an important source of habitat threat in this area, the number of construction lands in Suzhou has increased significantly, particularly in Gusu District, Suzhou Industrial Park, Xiangcheng District, Wuzhong District, and Huqiu District in the center of the city, Kunshan in the east, Zhangjiagang in the north and Changshu in the south. Economic development has an important impact on the change in land use. Economic development has accelerated the process of urbanization, making the industrial structure more balanced, resulting in a substantial increase in the demands for construction lands and a decrease in the bare land area. In addition, fisheries development has led to an increase in water bodies area and a decrease in bare land area. Population growth has led to bare lands turning into other land use types. Numerous socioeconomic and other factors need to be considered to understand what triggers changes in land use (Li et al., 2022b).
4.2 Temporal and spatial variation of habitat quality
From 2000 to 2030, the high HH concentration area was the hottest, mainly concentrated in Suzhou’s waters, lakes, and mountain forests. It became increasingly prominent in the center of the Yangcheng Lake area. Suzhou’s urban construction land contains most of the coldest places in the city and gradually spreads out from these places. The expansion of cold areas in Suzhou is mainly due to urban construction land expansion. The sharp increase in the distribution of hot spots is partly due to Suzhou’s efforts to protect its mountains, forests, and rivers. The main changes in cold and hot spots indicate that the spatial aggregation of habitat quality in the Suzhou area has changed. The areas of the most desirable and coldest places have been significantly expanded, and the spatial collection has improved.
The complete index of land use degrees is the first-factor affecting habitat ranking. Most of Suzhou’s cities with high land use intensity values were centered in the area with construction land, whereas the lake and forest regions had low values. The evolution of regional land use is also accelerating along with the growth of urban development. The grassland area has decreased sharply, and construction land is a major threat in this area. This has led to a direct or indirect decline in habitat quality. The surface area also influences changes in habitat quality. In Suzhou, places with a high vegetation coverage index are mainly distributed in mountainous areas such as Lingyan Mountain, Taihu Lake, and Yushan Mountain, and the patches are unevenly distributed. Important wetland regions in the areas with good ecological environment and long-term environmental protection include Yangcheng Lake, the Yangtze River valley on the north side, and many rivers in Wujiang District.
This leads to a high-quality living environment that matches the overall living environment of Suzhou city. The intensity of social and economic activities will directly impact the regional land use and spatial distribution of habitat quality. Low-population-density regions in Suzhou are primarily mountainous and lake areas, whereas construction has minimal influence and low population density. In areas with high light intensity and a vivid night scene, the light intensity in the city’s core area is the most concentrated, which increases the demand for development land and encroaches on biological land, resulting in the decline of habitat quality. However, the spatial distribution of Suzhou’s GDP per capita is more polarized, with the central city and Kunshan city as the two centers showing a trend toward popularization.
Therefore, it has little influence on regional habitat quality. Altitude and slope are indicators of human architectural tasks accessibility. The city is mainly plains. The terrain is flat, so construction land development is less challenging. Therefore, the habitat quality in mountain areas with higher altitudes and slopes is better than in plain areas. In addition, the landscape pattern index affects habitat quality. Most high-value areas with aggregation, sub-dimensions, diversity, and distribution exist in highly fragmented environments, such as mountains, grasslands, and forests. Low-value areas, such as water bodies, construction sites, and agricultural land, are fairly stable (Martins et al., 2020; Zhang T. et al., 2020; Yohannes et al., 2021). This is related to the spatial distribution of Suzhou habitat degradation.
4.3 Strategies for habitat conservation
For habitat protection and future development in Suzhou, our study suggested establishing a comprehensive habitat quality evaluation system to improve the efficiency of habitat quality management. The ArcGIS Engine is a secondary development platform that allows us to use GIS, RS, and GPS technologies to build an ecological environment quality evaluation model of the RSEI (remote sensing ecological index) model in the visual studio development environment (Kumar et al., 2022). This makes the evaluation work modular and improves overall evaluation. The system can improve the accuracy and efficiency of the evaluation and meet the public’s demand for comprehensive treatment and operations of regional habitat quality protection evaluation. RSEI model development, digital information management, and data visualization are effectively integrated into the system, providing technical support for the decision-making management departments. Strictly control land use indicators and accelerate the transformation and upgrading of the land use structure (Xu et al., 2018). Suzhou’s land is primarily used for construction and agriculture, but there are few grasslands and woodlands. According to the characteristics of land use and the ecological environment in Suzhou, coordinating land use development and optimizing land use layout are the keys to improving this area’s economic and ecological sustainability. Forestry has provided ecological and economic benefits. The artificially planted forest can bring income to Suzhou and improve the natural environment. For the construction of forest land, forest preservation, fire prevention, forest pest management, tree planting, and raising people’s awareness of prevention and control are necessary. For bare lands, crop yield is a matter of survival, and higher soil fertility is preferable.
Nonetheless, bare lands are prone to human disturbance. It is necessary to strengthen the protection of bare lands, restrict the occupation of bare lands by construction, and improve the quality of bare lands to increase their resilience against natural disasters. Water may improve the ecological environment and fulfil plant growth needs. Rich resources, such as Suzhou’s river systems and reservoirs that can regulate climate and resist drought, have remained virtually unchanged during the research period. Urbanization is rising due to the speed of economic development, which also improves the quality of the ecological environment and sustainably expands biological production. Restricting excessive urbanization’s encroachment on forest and agricultural land, enhancing environmental quality, and strictly controlling the growth of building land; also create and expand environmental protection areas (Wang et al., 2022).
The analysis of regional habitat quality showed that the habitat quality in Taihu Lake Basin and the Lingyan Mountain in Suzhou is high. This means that the establishment and expansion of ecosystem protection areas should be strengthened, and ecosystem protection areas should be established in the region’s arable land and grassland areas. The ecological core areas, noteworthy areas, environmental protection cache areas, and ecological buffer zones are designated. Taihu lake, Lingyan mountain and many rivers and lakes in Suzhou dominate the core area of the ecological red line and have the highest habitat quality rating. This category should be subjected to the same space restrictions and requirements as non-development areas. All urban development and building activities that conflict with the region’s current ecological functions should be forbidden (Yang et al., 2022).
All living and productive activities that invade ecological land must be properly supervised. In addition, it is necessary to strictly manage the transformation of environmental space into urban and agricultural space, infrastructure construction, and the entry of various development projects. The conversion of urban inspection and agricultural production space into ecological space within this controlled region should be promoted if it meets the following criteria. Agricultural land that does not meet these standards should be transformed into ecological agricultural land. Encourage the transformation of ecological red-line regions and buffer zones into core areas. The plan calls for this area’s cities, villages, and industrial enterprises to be evacuated orderly. The government should provide resettlement and compensation while formulating strategies to gradually moved the original residents into the controlled area. Encourage people to give up land rights and interests that hurt or destroy the surrounding ecosystem. People can work to restore the ecosystem in places where damage has already been done.
The ecological red line is an important area serves as a buffer zone for various Suzhou parks, forest parks, and natural reserves. Following the requirements of the ecological red line core area, human activities that disrupt or interact with the ecological environment must be tightly regulated. In addition to the necessary protection facilities, all industrial and construction activities that do not meet the main environmental protection objectives in the area should be restricted (Shi and Yu, 2014). Pollution-causing and construction activities, such as releasing sewage, should be strictly regulated. It should be forbidden to transform the control area’s ecological space into agricultural production or urban construction. Suppose it is necessary to change land use due to the changes in regional development strategies and the adjustments of higher-level planning; in that case, strict demonstration and approval must be carried out according to relevant procedures.
On the contrary, it should be allowed to transform the controlled areas with a low ecological protection level into coniferous forest areas. It should be strictly forbidden to change the controlled area into an environmental development area or an environmental protection buffer with a low level of protection. The ecological conservation buffer zone should strictly control the scale and intensity of development and construction projects in the area according to the plan and prohibit development and construction activities other than ecological restoration projects, major livelihood projects, eco-tourism projects, and major infrastructure projects. The existing planting industries in the controlled area should be managed strictly with the established laws and regulations. The scale and scope of urban development land or village construction land within the control area must be strictly observed. Any individual or unit should be strictly prohibited from modifying or expanding it without authorization. Meet the conditions of the area to withdraw gradually. For legitimate industrial and mining enterprises in the controlled area, the government should clean up the mining industry according to the requirements of nature reserves and relocate within a time limit (Luo et al., 2021). The transformation from ecological space into agricultural production and urban construction space within the environmental buffer zone should be strictly prohibited. Generally, it should be forbidden to turn ecological conservation buffer zones into ecological compound development zone. Agricultural and urban spaces that meet the conversion conditions should be converted into environmental space. Based on preserving the functional integrity of the ecosystem, the optimization and layout modification of urban and rural land use should be permitted. Intensive and efficient development in the rural industrial area should be encouraged. However, pesticides, fertilizers, and other pollutants must be decreased, and agricultural farming techniques must be encouraged.
4.4 Limitations and improvements
Changes caused by urbanization will continue to reduce bare lands area. Exploring the influencing variables of land use change requires a comprehensive investigation of the influence of numerous socioeconomic and other factors. In our land use change research, the CA-Markov model mimics land use. Regarding the land use parameter setting for the current study, we analyzed elevation, slope, annual precipitation, average annual temperature, population density, and GDP density. The natural environment and socioeconomic data were evaluated for the research’s restricted setting but not enough external policy issues.
Consequently, the scientific merit of our research may be strengthened. Several factors affect land use change, including distance and socioeconomic conditions. In particular, land use change in the study area was affected not only by natural processes but also by soils, geography, and other factors, and to a large extent, by human activity, social economy and important government decisions. Therefore, simple meta-automation of linear regression calculation cannot describe the inherent complexity of the interactions of driving factors. The ability to communicate complex nonlinear system relationships between different techniques, such as artificial neural networks and genetic algorithms, has made it possible to determine the relative importance of different factors and create internal transformation rules based on artificial intelligence. The InVEST model was used to analyze the habitat quality of Suzhou, which was characterized by a significant decline in habitat quality, with only a small part of the region showing outstanding habitat quality. However, the InVEST model’s parameters were derived by evaluating only pertinent natural and socioeconomic aspects, whereas external macroeconomic policy factors were not sufficiently accounted for. These results can be explained with remote sensing photos, meteorological data, and vegetation information. This is not only a limitation of the current study but also a direction for future research on measuring habitat quality to find out the relationship between evaluating habitat quality based on remote sensing images and measuring habitat quality in field experiments.
Data availability statement
The original contributions presented in the study are included in the article/Supplementary Material, further inquiries can be directed to the corresponding author.
Author contributions
ZL is responsible for writing the articles, the general framework design, and the technical approach. GZ provides theoretical guidance, and ZM provides the proofreading of the articles.
Funding
The Funding is provided by the Postgraduate Research & Practice Innovation Programme of Jiangsu Province (SJCX21_1347).
Acknowledgments
We are very grateful to Professor Degen Wang, Professor Yasi Tian, Professor Yixin Zhang of Suzhou University, Xu Jiaming of Huazhong University of Science and Technology, and Jiefu Xue, a graduate student of Nanjing Forestry University for their valuable inputs in improving this article.
Conflict of interest
The authors declare that the research was conducted in the absence of any commercial or financial relationships that could be construed as a potential conflict of interest.
Publisher’s note
All claims expressed in this article are solely those of the authors and do not necessarily represent those of their affiliated organizations, or those of the publisher, the editors and the reviewers. Any product that may be evaluated in this article, or claim that may be made by its manufacturer, is not guaranteed or endorsed by the publisher.
Supplementary material
The Supplementary Material for this article can be found online at: https://www.frontiersin.org/articles/10.3389/fenvs.2022.1041573/full#supplementary-material
Abbreviations
Invest, Integrated valuation of ecosystem services and trade-offs; HSI, Habitat suitability index; LISA, Local indicators of spatial association; HH, High-High; HL, High-Low; LL, Low-Low; LH, Low-High; GDP, Gross domestic product; GIS, Geographic information system; RS, Remote sensing; GPS, Global positioning system; RSEI, remote sensing ecological index; NDVI, Normalized difference vegetation index; NDWI, Normalized difference water index; SHDI, Shannon’s diversity index; FD, Patch density; AI, Aggregation index; CONTAG, Contagion index.
References
Boumans, R., Roman, J., Altman, I., and Kaufman, L. (2015). The multiscale integrated model of ecosystem services (MIMES): Simulating the interactions of coupled human and natural systems. Ecosyst. Serv. 12, 30–41. doi:10.1016/j.ecoser.2015.01.004
Carlson, M., Browne, D., and Callaghan, C. (2019). Application of land-use simulation to protected area selection for efficient avoidance of biodiversity loss in Canada's Western boreal region. Land Use Policy 82, 821–831. doi:10.1016/j.landusepol.2019.01.015
Clairmont, L. K., Coristine, A., Stevens, K. J., and Slawson, R. M. (2021). Factors influencing the persistence of enteropathogenic bacteria in wetland habitats and implications for water quality. J. Appl. Microbiol. 131 (1), 513–526. doi:10.1111/jam.14955
Diniz-Filho, J. A., Nabout, J. C., de Campos Telles, M. P., Soares, T. N., and Rangel, T. F. (2009). A review of techniques for spatial modeling in geographical, conservation and landscape genetics. Genet. Mol. Biol. 32 (2), 203–211. doi:10.1590/s1415-47572009000200001
Henebry, G. M. (1995). Spatial model error analysis using autocorrelation indices. Ecol. Modell. 82 (1), 75–91. doi:10.1016/0304-3800(94)00074-R
Hillard, E. M., Nielsen, C. K., and Groninger, J. W. (2017). Swamp rabbits as indicators of wildlife habitat quality in bottomland hardwood forest ecosystems. Ecol. Indic. 79, 47–53. doi:10.1016/j.ecolind.2017.03.024
Jackson, M. C., Huang, L., Xie, Q., and Tiwari, R. C. (2010). A modified version of Moran's I. Int. J. Health Geogr. 9, 33. doi:10.1186/1476-072x-9-33
Jon, M. H., Kim, Y. P., and Choe, U. (2021). Determination of a safety criterion via risk assessment of marine accidents based on a Markov model with five states and MCMC simulation and on three risk factors. Ocean. Eng. 236, 109000. doi:10.1016/j.oceaneng.2021.109000
Kubatova, J., and Krocil, O. (2020). The potential of impact and integral investing for sustainable social development and the role of academia in their dissemination. Sustainability 12, 6939. doi:10.3390/su12176939
Kumar, M., Singh, P., and Singh, P. (2022). Fuzzy AHP based GIS and remote sensing techniques for the groundwater potential zonation for Bundelkhand Craton Region, India. Geocarto Int. 37 (22), 6671–6694. doi:10.1080/10106049.2021.1946170
Lambin, E. F., Turner, B. L., Geist, H. J., Agbola, S. B., Angelsen, A., Bruce, J. W., et al. (2001). The causes of land-use and land-cover change: Moving beyond the myths. Glob. Environ. Change 11 (4), 261–269. doi:10.1016/S0959-3780(01)00007-3
Lee, S.-Y., Jang, R.-H., Han, Y.-S., Jung, Y.-H., Lee, S.-I., Lee, E.-P., et al. (2018). Health condition assessment using the riparian vegetation index and vegetation analysis of geumgang mainstream and mihocheon. Korean J. Environ. Ecol. 32, 105–117. doi:10.13047/kjee.2018.32.1.105
Legendre, P. (1993). Spatial autocorrelation: Trouble or new paradigm? Ecology 74 (6), 1659–1673. doi:10.2307/1939924
Li, L., Tang, H., Lei, J., and Song, X. (2022). Spatial autocorrelation in land use type and ecosystem service value in Hainan Tropical Rain Forest National Park. Ecol. Indic. 137, 108727. doi:10.1016/j.ecolind.2022.108727
Li, Y., Liu, W., Feng, Q., Zhu, M., Yang, L., Zhang, J., et al. (2022a). The role of land use change in affecting ecosystem services and the ecological security pattern of the Hexi Regions, Northwest China. Sci. Total Environ. 855, 158940. doi:10.1016/j.scitotenv.2022.158940
Li, Y., Liu, Z., Li, S., and Li, X. (2022b). Multi-scenario simulation analysis of land use and carbon storage changes in changchun city based on FLUS and InVEST model. Land 11, 647. doi:10.3390/land11050647
Luo, Y., Wu, J., Wang, X., and Peng, J. (2021). Using stepping-stone theory to evaluate the maintenance of landscape connectivity under China's ecological control line policy. J. Clean. Prod. 296, 126356. doi:10.1016/j.jclepro.2021.126356
Mamanis, G., Vrahnakis, M., Chouvardas, D., Nasiakou, S., and Kleftoyanni, V. (2021). Land use demands for the CLUE-S spatiotemporal model in an agroforestry perspective. Land 10, 1097. doi:10.3390/land10101097
Martins, W. B. R., Lima, M. D. R., Barros, U. D., Amorim, L., OliveirA, F. D., and Schwartz, G. (2020). Ecological methods and indicators for recovering and monitoring ecosystems after mining: A global literature review. Ecol. Eng. 145, 105707. doi:10.1016/j.ecoleng.2019.105707
Munné, A., Prat, N., Solà, C., Bonada, N., and Rieradevall, M. (2003). A simple field method for assessing the ecological quality of riparian habitat in rivers and streams: QBR index. Aquat. Conserv. 13 (2), 147–163. doi:10.1002/aqc.529
Nematollahi, S., Fakheran, S., Kienast, F., and Jafari, A. (2020). Application of InVEST habitat quality module in spatially vulnerability assessment of natural habitats (case study: Chaharmahal and Bakhtiari province, Iran). Environ. Monit. Assess. 192 (8), 487. doi:10.1007/s10661-020-08460-6
Pino-caceres, M. D. M., Torrecillas-lozano, C., Caceres-sanchez, N., and Pino-mejias, J. L. (2022). Using Getis-Ord Gi* maps to understand bicycle mobility during the winter season in Valencia, Spain. Dyna (Medellin). 97, 436–444. doi:10.6036/10398
Qi, Y., and Wu, J. (2005). Effects of changing spatial resolution on the results of landscape pattern analysis using spatial autocorrelation indices. Landsc. Ecol. 11, 39–49. doi:10.1007/bf02087112
Sang, L., Zhang, C., Yang, J., Zhu, D., and Yun, W. (2011). Simulation of land use spatial pattern of towns and villages based on CA–Markov model. Math. Comput. Model. 54 (3), 938–943. doi:10.1016/j.mcm.2010.11.019
Shen, L.-T., Luo, S.-J., Huang, C.-K., and Chen, B.-Y. (2012). SD models: Super‐deformed character models. Comput. Graph. Forum 31, 2067–2075. doi:10.1111/j.1467-8659.2012.03199.x
Shi, P., and Yu, D. (2014). Assessing urban environmental resources and services of shenzhen, China: A landscape-based approach for urban planning and sustainability. Landsc. Urban Plan. 125, 290–297. doi:10.1016/j.landurbplan.2014.01.025
Smouse, P. E., and Peakall, R. (1999). Spatial autocorrelation analysis of individual multiallele and multilocus genetic structure. Hered. (Edinb) 82 (5), 561–573. doi:10.1038/sj.hdy.6885180
Wang, Z.-J., Liu, S.-J., Li, J.-H., Pan, C., Wu, J.-L., Ran, J., et al. (2022). Remarkable improvement of ecosystem service values promoted by land use/land cover changes on the Yungui Plateau of China during 2001–2020. Ecol. Indic. 142, 109303. doi:10.1016/j.ecolind.2022.109303
Weber, D., Schaepman-Strub, G., and Ecker, K. (2018). Predicting habitat quality of protected dry grasslands using Landsat NDVI phenology. Ecol. Indic. 91, 447–460. doi:10.1016/j.ecolind.2018.03.081
Xu, H., Wang, M., Shi, T., Guan, H., Fang, C., and Lin, Z. (2018). Prediction of ecological effects of potential population and impervious surface increases using a remote sensing based ecological index (RSEI). Ecol. Indic. 93, 730–740. doi:10.1016/j.ecolind.2018.05.055
Xue, J., and Yan, J. (2022). Deducing leading factors of spatial distribution of carbon reserves in nanjing metropolitan area based on random forest model. Comput. Intell. Neurosci. 2022, 1–12. doi:10.1155/2022/3013620
Yamada, H. (2021). Geary's c and spectral graph theory. Mathematics 9 (19), 2465. doi:10.3390/math9192465
Yang, L., Han, B., Ma, Z., Wang, T., and Lin, Y. (2022). Analysis of the urban land use efficiency in the new-type urbanization process of China’s Yangtze River economic belt. Int. J. Environ. Res. Public. Health, 19 (13). doi:10.3390/ijerph19138183
Yang, T., Wang, S., Li, X., Wu, T., Li, L., and Chen, J. (2018). River habitat assessment for ecological restoration of Wei River Basin, China. Environ. Sci. Pollut. Res. 25 (17), 17077–17090. doi:10.1007/s11356-018-1774-z
Yohannes, H., Soromessa, T., Argaw, M., and Dewan, A. (2021). Spatio-temporal changes in habitat quality and linkage with landscape characteristics in the Beressa watershed, Blue Nile basin of Ethiopian highlands. J. Environ. Manage. 281, 111885. doi:10.1016/j.jenvman.2020.111885
Zhang, H., Li, S., Liu, Y., and Xu, M. (2022). Assessment of the habitat quality of offshore area in tongzhou bay, China: Using benthic habitat suitability and the InVEST model. Water 14 (10), 1574. doi:10.3390/w14101574
Zhang, T., Gao, Y., Li, C., Xie, Z., Chang, Y., and Zhang, B. (2020). How human activity has changed the regional habitat quality in an eco-economic zone: Evidence from poyang lake eco-economic zone, China. Int. J. Environ. Res. Public Health 17 (17), 6253. doi:10.3390/ijerph17176253
Zhang, X., Lyu, C., Fan, X., Bi, R., Xia, L., Xu, C., et al. (2022). Spatiotemporal variation and influence factors of habitat quality in loess hilly and gully area of yellow River basin: A case study of liulin county, China. Land 11, 127. doi:10.3390/land11010127
Zhang, Y., Jiang, P., Cui, L., Yang, Y., Ma, Z., Wang, Y., et al. (2022). Study on the spatial variation of China's territorial ecological space based on the standard deviation ellipse. Front. Environ. Sci. 10. doi:10.3389/fenvs.2022.982734
Zhang, Y., Yu, H., Yu, H., Xu, B., Zhang, C., Ren, Y., et al. (2020). Optimization of environmental variables in habitat suitability modeling for mantis shrimp Oratosquilla oratoria in the Haizhou Bay and adjacent waters. Acta Oceanol. Sin. 39 (6), 36–47. doi:10.1007/s13131-020-1546-8
Zhao, L., Yu, W., Meng, P., Zhang, J.-s., and Zhang, J. (2022). InVEST model analysis of the impacts of land use change on landscape pattern and habitat quality in the Xiaolangdi Reservoir area of the Yellow River basin, China. Land Degrad. Dev. 33, 2870–2884. doi:10.1002/ldr.4361
Zhao, M., He, Z., Du, J., Chen, L., Lin, P., and Fang, S. (2019). Assessing the effects of ecological engineering on carbon storage by linking the CA-Markov and InVEST models. Ecol. Indic. 98, 29–38. doi:10.1016/j.ecolind.2018.10.052
Zhao, Y., Wu, Q., Wei, P., Zhao, H., Zhang, X., and Pang, C. (2022). Explore the mitigation mechanism of urban thermal environment by integrating geographic detector and standard deviation ellipse (SDE). Remote Sens. (Basel). 14, 3411. doi:10.3390/rs14143411
Zheng, H., and Li, H. (2022). Spatial–temporal evolution characteristics of land use and habitat quality in Shandong Province, China. Sci. Rep. 12, 15422. doi:10.1038/s41598-022-19493-x
Zheng, W., Li, S., Ke, X., Li, X., and Zhang, B. (2022). The impacts of cropland balance policy on habitat quality in China: A multiscale administrative perspective. J. Environ. Manage. 323, 116182. doi:10.1016/j.jenvman.2022.116182
Keywords: land use change, habitat Quality, CA-Markov model, InVEST, ecological environment., ecological stability
Citation: Li Z, Ma Z and Zhou G (2022) Impact of land use change on habitat quality and regional biodiversity capacity: Temporal and spatial evolution and prediction analysis. Front. Environ. Sci. 10:1041573. doi: 10.3389/fenvs.2022.1041573
Received: 11 September 2022; Accepted: 19 October 2022;
Published: 03 November 2022.
Edited by:
Taimoor Hassan Farooq, Bangor College China, a joint unit of Bangor University and Central South University of Forestry and Technology, ChinaReviewed by:
Umer Shahzad, Anhui University of Finance and Economics, ChinaMuhammad Farhan Bashir, Shenzhen University, China
Copyright © 2022 Li, Ma and Zhou. This is an open-access article distributed under the terms of the Creative Commons Attribution License (CC BY). The use, distribution or reproduction in other forums is permitted, provided the original author(s) and the copyright owner(s) are credited and that the original publication in this journal is cited, in accordance with accepted academic practice. No use, distribution or reproduction is permitted which does not comply with these terms.
*Correspondence: Guoyan Zhou, emhvdWd1b3lhbkBzdWRhLmVkdS5jbg==