 Dachuan Yan1,2†
 Yiwei Diao
 Meng Yang
- 1School of Atmospheric and Remote Sensing, Wuxi University, Wuxi, China
- 2Laibin Meteorological Bureau, Laibin, China
- 3Jiangsu Zhongwu Environmental Protection Industry Development Co. LTD., Changzhou, China
- 4School of Environmental Engineering, Wuxi University, Wuxi, China
This paper analyzes the daily data of China’s air quality index (AQI) from 2015 to 2020 using kriging, spatial autocorrelation, and gravity center method. The results confirm that China’s air pollution is gradually controlled. From 2015 to 2020, the AQI, the proportion of air pollution days and the city air quality exceedance rate decreased by about 29%, 44%, and 49% respectively. The spatial distribution of air pollution changes with seasons. The heavily polluted area (AQI > 200) is largest in spring, which accounts for 0.48% of the total area, while the polluted area (AQI > 100) is largest in winter due to large area pollution in the North China Plain. The air pollution has strong spatial autocorrelation with a global Moran’s Index larger than 0.7. The Beijing-Tianjin-Hebei region and southern Xinjiang are high-pollution clustering areas. The former is dominated by PM2.5 pollution caused by anthropogenic activities, while the latter is dominated by PM10 pollution from natural sources. Using gravity center method, it works out the air pollution gravity center (APGC), economic gravity center (EGC), the secondary industry gravity center (SIGC), the tertiary industry gravity center (TIGC) and the population gravity center (PGC) in the Beijing-Tianjin-Hebei region and its surrounding areas. Results show that the spatial overlapping indicator of the APGC with the PGC is the highest, and the APGC and the SIGC has the highest shifting consistency indicator. When combining the two indicators, it is obtained that air pollution has the highest degree of spatial coupling with the secondary industry, but low coupling with economic volume. It is indicated that the driving factors of air pollution is the secondary industry. Therefore, it is suggested that the regulation of air pollution should start from optimizing the industrial structure in China.
1 Introduction
In recent years, with the increasing abundance of observational data sources, experts and scholars have studied the spatial distribution characteristics of air pollution from global to national (Hao and Liu, 2016; Zhang and Pan, 2021), regions and cities scale (Han et al., 2019a; Liu et al., 2021). These spatial distribution characteristics provide data basis for studying their driving factors.
In order to prevent and control air pollution effectively, it is necessary to clarify the driving factors that affect air quality. Experts and scholars have explored the factors affecting air quality from aspects of energy efficiency (Tao et al., 2019), urban industry (Pei et al., 2021), and climate impact (Liao et al., 2021), etc. Among them, social economy is a very important factor. Especially under the background of industrialization and urbanization, great socioeconomic changes have taken place in China (Liang et al., 2021). Therefore, it is important to study the impact of social and economic factors on air quality. The statistical analysis (Li et al., 2012; Han et al., 2019b), numerical model and machine learning model (Shen, 2021) have been used to analyze the relationship between air pollution and socioeconomic factors. However, the above studies demand large data volume and sample size. In this case some important explanatory variables could not pass the significance test and their influences on air pollution could not be analyze, due to the limited availability of socioeconomic data in some areas (Han et al., 2019). Therefore, it is necessary to find a method that has lower data dependency.
As a spatial analysis method, the gravity center method is such a method with lower data dependency. It is first used to analyze spatial shifting of population and then as an effective method to analyze the influences of socioeconomic factors on target variables, such as industry (Fan, 1996), population (Lian, 2007), economy (Liang et al., 2021) and urbanization and cultivated land expansion (Wang et al., 2022) and so on. Its basic principle is that when a socioeconomic factor has more influence on a target variable, the shifting trajectories of the gravity centers of the target variable and the socioeconomic factor will have higher degree of spatial coupling (Fan et al., 2010).
In recent years, the gravity center method is also used to analyze the relationship between water pollution and socioeconomic factors such as industrial upgrading and technological innovation, which reveals that the pollution pattern has changed greatly under the influence of the transfer of manufacturing industry (Zhao et al., 2020). Though without any application in the field of air pollution, the method is mature and effective in previous studies.
Hence, the objectives of the present study were to 1) analyze the spatial patterns of air pollution in China from 2015 to 2020; 2) identify high-pollution clustering areas; and 3) use the gravity center method to identify the major socioeconomic factor influencing air pollution in the high-pollution clustering areas.
2 Data sources and methodology
2.1 Ambient air quality data
The ambient air quality are monitored by the national ambient air quality monitoring network, with a total of 2024 monitoring sites, which are distributed throughout the country except for Taiwan Province (Figure 1). These sites are unevenly distributed and concentrated in densely populated areas (Figure 1), considering the economic development, geographical and climatic differences between different regions of China (Zang et al., 2015).
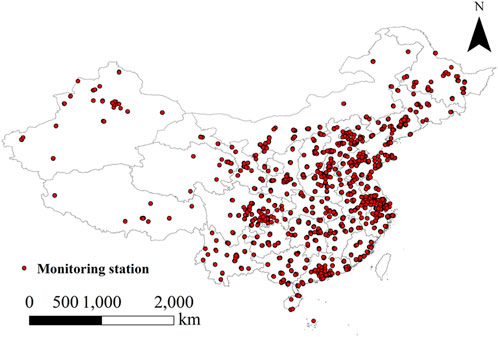
FIGURE 1. Distribution of air pollution monitoring stations in China.
Monitoring data were obtained from the Ministry of Ecology and Environment (https://www.mee.gov.cn/) for hourly data from 1 January 2015, to 31 December 2020. Data include AQI, SO2, NO2, O3, PM2.5, PM10, and CO concentrations at each site. The AQI of a city was calculated from the average of all sites in the city to evaluate its air quality. Unless otherwise specified, the AQI and pollutant concentrations in a certain area are the average values of all monitoring sites in that area.
2.2 Method for evaluating air quality
The AQI was selected as the main indicator to evaluate the air pollution. The following four indicators were also calculated. Air pollution days is the number of days with the AQI exceeding 100 in a year. Proportion of air pollution days is the percentage of air pollution days to the total number of monitoring days in a year. City air quality exceedance rate is the proportion of cities where one or more pollutant exceeds the limit value to the total number of cities monitored nationwide. Percent decrease of AQI is the percent change in a year’s AQI value compared to the previous year’s AQI value. The limit value of each pollutant is set according to the Ambient Air Quality Standard in China (GB3095-2012).
2.3 Spatial analysis
2.3.1 Spatial interpolation
The spatial interpolation of AQI is performed using ordinary kriging, and the formula for ordinary kriging estimating (Li et al., 2013) is as follows:
where
Also satisfying the unbiased condition:
After data exploration, the exponential function with the best fit was selected as the kernel function for variogram modeling. The variogram models are evaluated by leave-one-out cross validation (Webster and Oliver, 2007).
2.3.2 Spatial autocorrelation analysis
Spatial autocorrelation is the phenomenon that adjacent observations have similar data values (positive spatial autocorrelation), or the adjacent observations tend to have very contrasting values (negative spatial autocorrelation) (Wang et al., 2010). The analysis of spatial autocorrelation helps to reveal the spatial characteristics of the presence or absence of aggregation of air pollution. Spatial autocorrelations of the AQI among the monitoring sites was quantified using Moran’s index (I) (Zhang and Zhang, 2007):
where
In addition, the local indicators of spatial association (LISA) clustering map was used to show the local spatial patterns of the AQI, as well as to show the clustering areas with significant spatial autocorrelation (Bivand and Wong, 2018; Xuan, 2020). Four kinds of local patterns (high-high, low-low, high-low and low-high) are represented with different colors in the LISA maps. Positive spatial autocorrelation is when areas close to each other have similar AQI values (high-high or low-low). On the other hand, negative spatial autocorrelation indicates that neighborhood areas are different (low AQI values next to high values, and vice versa).
2.4 Gravity center method
2.4.1 Gravity center calculation
The main source of air pollutants is human activities, so economic activities and population density can affect the spatial distribution of air quality (Zhu and Yao, 2021). In this paper, we analyze the spatial coupling of air pollution with economy and population using the gravity center method. The gravity center of a region is a point that exists in the regional space (Zhao et al., 2020; Liang et al., 2021). The air pollution gravity centers (APGCs) are the force points in which the influential factors on air quality, can maintain balance in regional space. The APGC in year t can be expressed as follows:
where
2.4.2 Spatial overlapping indicator
The spatial overlapping indicator (SOI) is used to investigate the spatial coupling degree of APGC and other gravity center from a static perspective. The SOI of two kinds of gravity centers is expressed by the distance between them as follows (Fan et al., 2010):
Where
2.4.3 Shifting consistency indicator
The shifting consistency indicator (SCI) is used to investigate the spatial coupling degree of APGC and other gravity center from a dynamic perspective. The SCI is calculated as follows (Fan et al., 2010):
where
3 Results and discussion
3.1 Changing of air quality from 2015 to 2020
According to Figure 2A, China’s air quality showed an overall upward trend from 2015 to 2020, with average AQI decreasing year by year. AQI has declined by 28.66% during this period, with the largest decline in 2020, which decreased by 11.30% compared with the previous year.
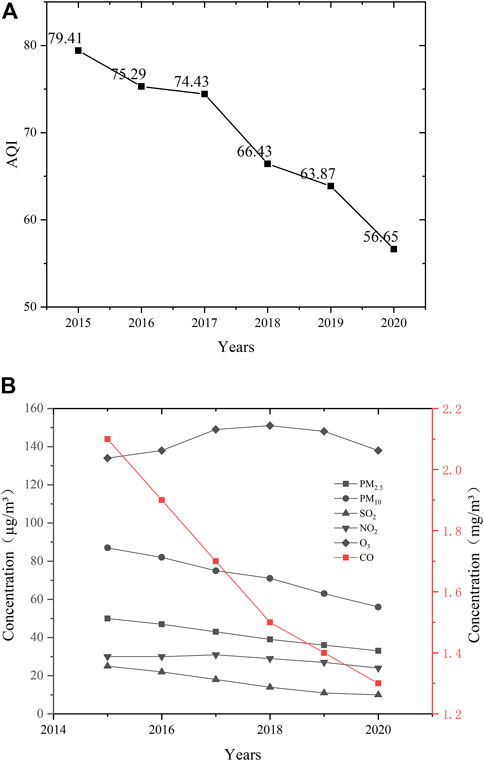
FIGURE 2. Annual variation of (A) air quality index (AQI) and (B) the concentrations of air pollutants.
According to Figure 2B, O3 and NO2 showed an upward trend from 2015 to 2017, while the other pollutants showed a downward trend as the AQI. Among them, SO2 has the largest decline, reaching 60%, while the concentration of O3 has risen by about 3% in the past few years.
According to Table 1, the main pollutants affecting China’s air quality are PM2.5, PM10 and O3, and proportion of air pollution days and city air quality exceedance rate have decreased by 44.21% and 48.85% from 2015 to 2020, respectively. This is confirmed by the results in Figure 2.
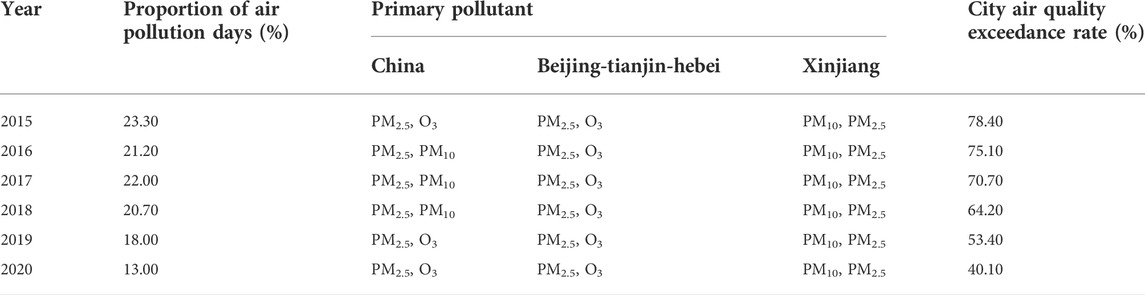
TABLE 1. Overview of air pollution in China from 2015 to 2020.
3.2 Spatial patterns of air pollution in China
The maps of the AQI from 2015 to 2020 obtained using ordinary kriging are showed in Figure 3A. The spatial distribution of the AQI in China has a similar spatial trend in different years. From west to east, the AQI shows a trend of “high—low—high”; from north to south, it increases gradually, and reaches the maximum value in Hebei Province, and then gradually decreases to the south. Although the spatial trend of the AQI is basically unchanged from 2015 to 2020, the areas of air pollution (AQI > 100) is gradually decreasing. The areas with excellent air quality (AQI < 50) have an increase of about 39% in 2020 compared to 2015.
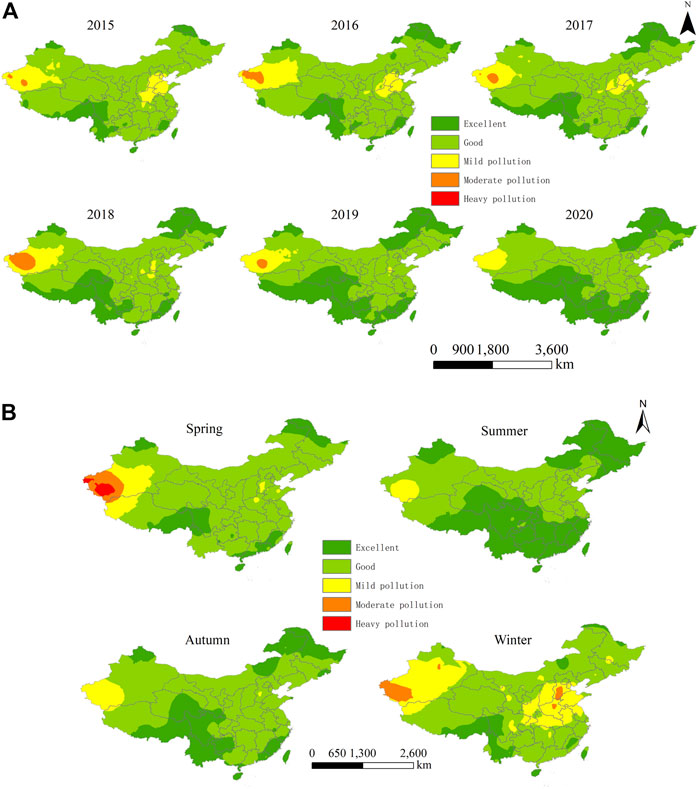
FIGURE 3. Spatial distribution of (A) annual air quality index from 2015 to 2020 and (B) seasonal air quality index in China.
The AQI has high value at two distinct areas. One is the southwestern region of Xinjiang including the Aksu, Kashgar and Hotan regions, where dust and sand are frequent, and drought is scarce. The annual average value of AQI in this region is around 200. Another is the Beijing-Tianjin-Hebei (BTH) region and its surrounding areas. This area is densely populated, economically developed and highly industrialized area, and the annual average value of the AQI is about 112. The primary pollutants in the two areas are different (Table 1). The BTH region is dominated by PM2.5 and O3, while the southwestern region of Xinjiang is dominated by PM10 and PM2.5.
The areas with the lowest AQI values are mainly sparsely populated plateau areas (such as the western Sichuan Plateau, the Yunnan-Guizhou Plateau, the Qinghai-Tibet Plateau, etc.) and the coastal areas with good atmospheric circulation and high precipitation (Figure 3A).
The AQI in China has significant seasonal variation. The site averaged AQI shows an approximate U-shaped trend from spring to winter (Figure 4). In order to compare the spatial distribution characteristics of the AQI in different seasons, ordinary kriging was performed for the AQI in four seasons from 2015 to 2020, and the results are shown in Figure 3B.

FIGURE 4. Seasonal variations in site averaged air quality index in China.
The spatial distribution of the AQI varies with seasons. The polluted area (AQI > 100) is largest in winter due to large area pollution in the North China Plain (Figure 3B). The heavily polluted area (AQI > 200) is largest in spring and accounted for 0.48% of the total area. The moderately polluted (150 < AQI < 200) areas in spring and winter accounted for 2.29% and 1.13% of the total area, respectively. The site averaged value of AQI was highest in winter (Figure 4). However, the maximum AQI at spatial level was located in the southwestern part of Xinjiang Province in spring (Figure 3B), and this is affected by desert dust with PM10 as primary pollutant (explained in section 3.3). There were no moderately and heavily polluted areas in summer and autumn. The area with excellent air quality (AQI < 50) is the largest in summer, and accounted for 76.67% of the total area. Followed by autumn, it accounted for 62.85% of the total area.
3.3 Identification of the air pollution clustering areas
The global Moran’s I can characterize the degree of spatial autocorrelation of the AQI in general. The global Moran’s I calculated using annual and seasonal AQI is listed in Table 2. It can be seen that the annual Moran’s I take values above 0.70, and take values around 0.70 at the seasonal level, and the p-values of significance tests are all less than 0.01. These indicate that the spatial distribution of AQI in China show positive spatial autocorrelation at 5% significance, i.e., a significant aggregated distribution. The adjacent areas have similar AQI values, which is areas with high level of air quality surrounded by neighbors with high level of air quality, and vice versa.
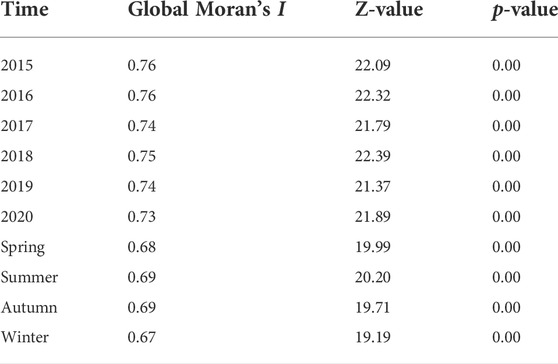
TABLE 2. Global Moran’s I and its test metrics.
In order to identify the specific aggregated areas, the LISA clustering map were drawn at the annual and seasonal levels (Figure 5). At the annual level, Guangdong, Yunnan, Guizhou and Sichuan Province, parts of Tibet, northeastern Inner Mongolia and parts of Heilongjiang Province presented agglomerations of low AQI values (light blue color in Figure 5). The Beijing-Tianjin-Hebei (BTH) region as well as the northern part of Xinjiang Province and the southwestern region showed clusters of high air pollution (pink color in Figure 5). Han et al. (2019) also found AQI had high-high clustering in the BTH region. However, they did not find high-high clustering in Xinjiang Province. The difference mainly due to different data used. Our study used site-level observation data for spatial analysis, and Han et al. (2019) used city-level data. As Figure 1 shown, the observation sites are sparse in Xinjiang province, and when the site-level data is averaged to city level, the data will be too sparse to identify spatial clustering. It is obvious that spatial crusting may not be identified when spatial data is too sparse.
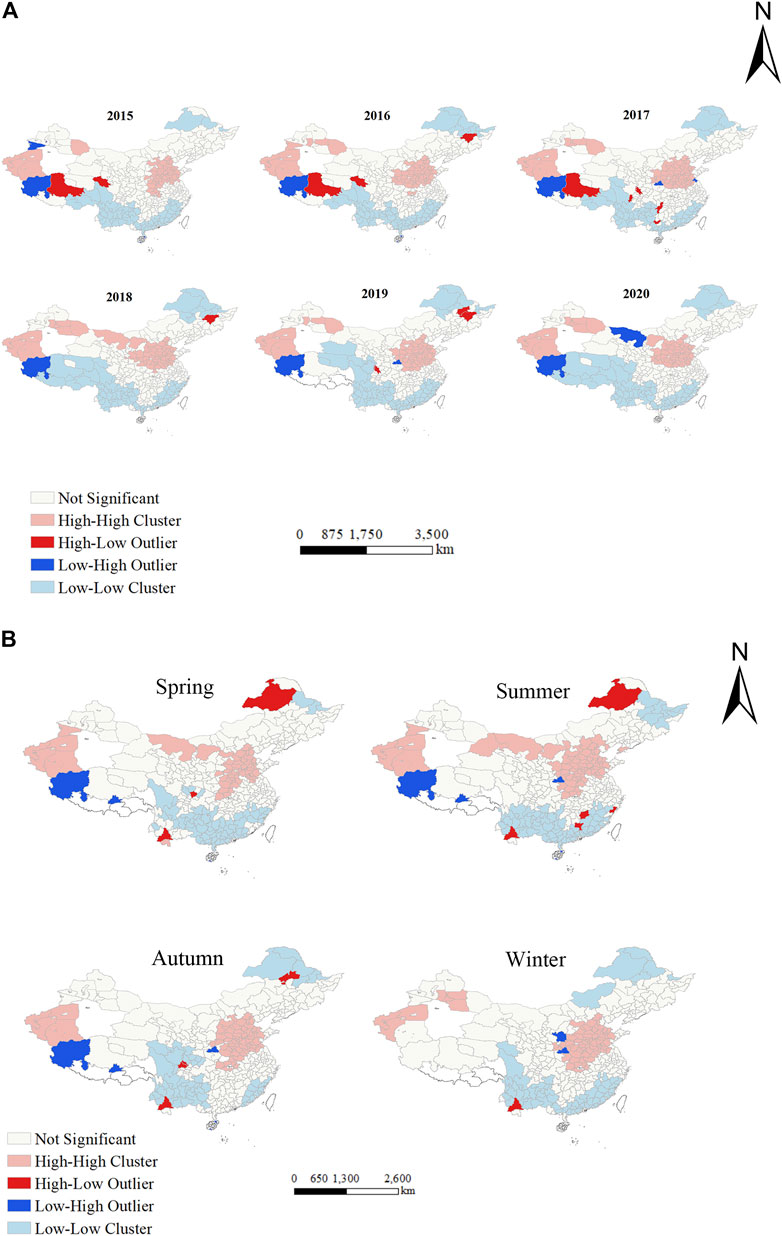
FIGURE 5. (A) Annual and, (B) seasonal LISA cluster maps.
The agglomeration area changes with the seasons. The main changing was show in the western part of Inner Mongolia where high-high cluster was presented in spring and summer and no significant cluster in autumn and winter. Part of Heilongjiang province also showed significant seasonal change with high-high cluster in spring and summer but low-low cluster in autumn and winter.
The BTH region has a semi-closed topography formed by the Taihang and Yanshan Mountains. This topography can block and weaken the activity of air flow, which results in accumulate of pollutants (Li et al., 2021). When the high airflow crosses the two mountain ranges, it tends to sink in this region. Its temperature increases during the sinking process, further promoting the formation of low-level inversions. The atmosphere is stabilized with the inversion layer, thus further reducing pollutants diffusion.
In terms of meteorological conditions, the unfavorable factors in the BTH region mainly include the following: 1) In recent years, the temperature distribution in the middle and lower troposphere in winter has shown an obvious structure of upper warm and lower cooling, and the global warming trend has also increased the stability of the atmosphere. These make the contaminants not easily diluted and dispersed (Zhang et al., 2019). 2) When the southeasterly and southerly winds are strong at the lower level, they work together to transport the surrounding pollutants to the Beijing-Tianjin-Hebei region, resulting in an explosive increase in the accumulation of pollutants in the BTH region, thereby forming accumulated pollution (Zhong et al., 2019). 3) The atmospheric self-purification capacity gradually decreased from 1961 to 2017 and decreased rapidly at a rate of 0.039 tons/(d-km2) per year after 2000. The regional area increased by 21.83% from 2015 to 2019, and the rough subsurface after urbanization reduced the surface wind speed and weakened the atmospheric removal capacity (Mei et al., 2019). In addition, people’s demand for heating will increase the use of coal, and the concentration of PM2.5 in the air seriously exceeds the standard in winter (Zhang, 2020).
As to the Xinjiang region, its topographic structure can be generally summarized as “three mountains sandwiched by two basins”. This topographic structure makes the climate in the north and south vary significantly (Xie et al., 2018). The southern Xinjiang is affected by the water vapor barrier of the Tianshan Mountains, which makes it drier than the northern region (Zhang and Zhang, 2006). In addition, the Taklamakan Desert located in the middle of southern Xinjiang is a major source of air pollution (Zhu et al., 2018). Air pollution caused by sand and dust storms is widespread and intense in this region (Jiang et al., 2020), especially in spring (Mamatabdulla et al., 2021). This leads to the highest AQI in the southern Xinjiang region in spring (Figure 3B).
3.4.Spatial coupling of air pollution with population and economy
3.4.1 Gravity centers in the air pollution clustering area
The BTH region and its surrounding areas are one of the areas with air pollution clustering, also have the highest population density and economic activity in China. Therefore, it is important to analyze influential factors on air quality in these areas. In order to analyze the spatial coupling of air pollution with population and economy in these areas, the gravity center of air pollution and four socioeconomic factors from 2015 to 2020 were calculated, and their shifting trajectory are shown in Figure 6. The APGC, PGC and SIGC are all located in Cangzhou City, Hebei Province, but the EGC and TIGC are further north and closer to the economic center, Beijing.
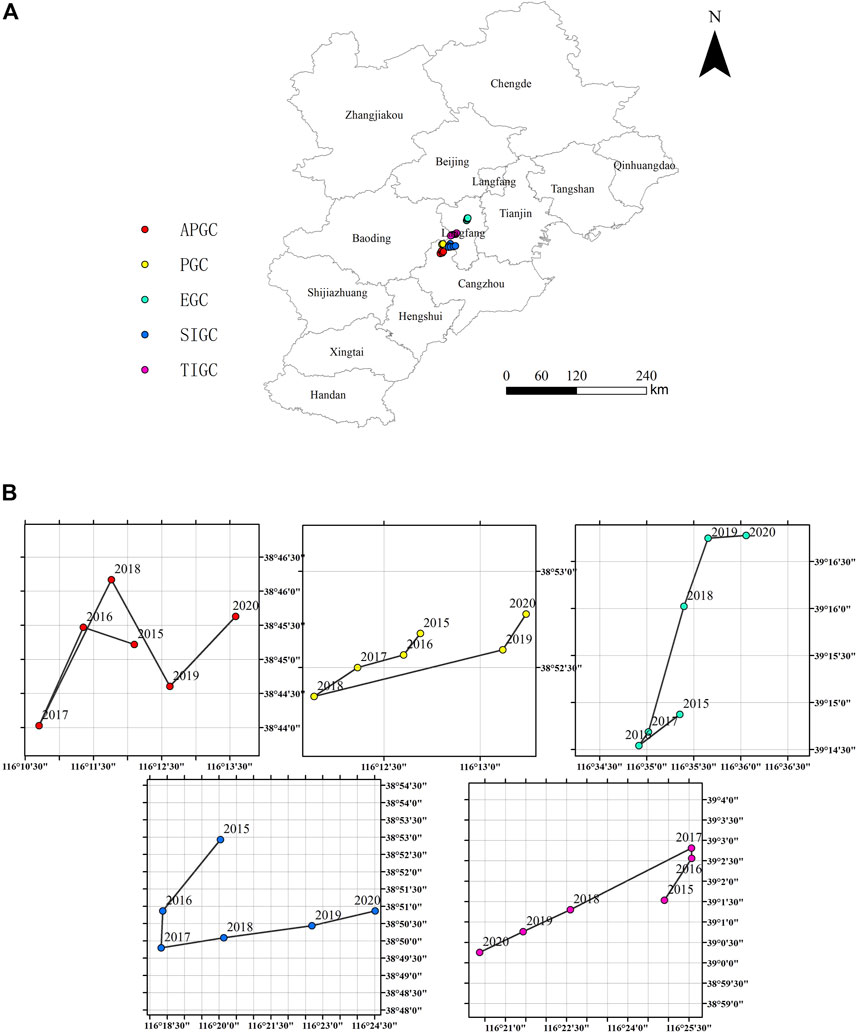
FIGURE 6. (A) The shifting trajectory of the gravity centers in the BTH region and its surrounding areas and (B) its zoomed-in view.
Based on the zoomed-in shifting trajectory of the APGCs from 2015 to 2020 in Figure 6, the maximum shifting range of the APGCs was only about 6 km, indicating that there is no large-scale shifting of the APGCs. Similarly, Other gravity centers also did not move widely. This suggests that the spatial shifting of the gravity centers of both air pollution and its associated socioeconomic factors is a long-term process. The shifting of the APGCs on longer time scale remains to be further investigated.
The SOI between the APGC and the other four gravity centers is shown in Figure 7. The smaller the SOI, the shorter the distance between the two kinds of gravity centers, and the higher of their spatial overlapping is from a static perspective. It can be seen that the SOI between the APGC and the PGC is less than 15 km, and that between the APGC and the EGC is larger than 65 km. It indicated that the spatial overlapping of the APGC with the PGC is the highest, followed by the SIGC, TIGC, and EGC.
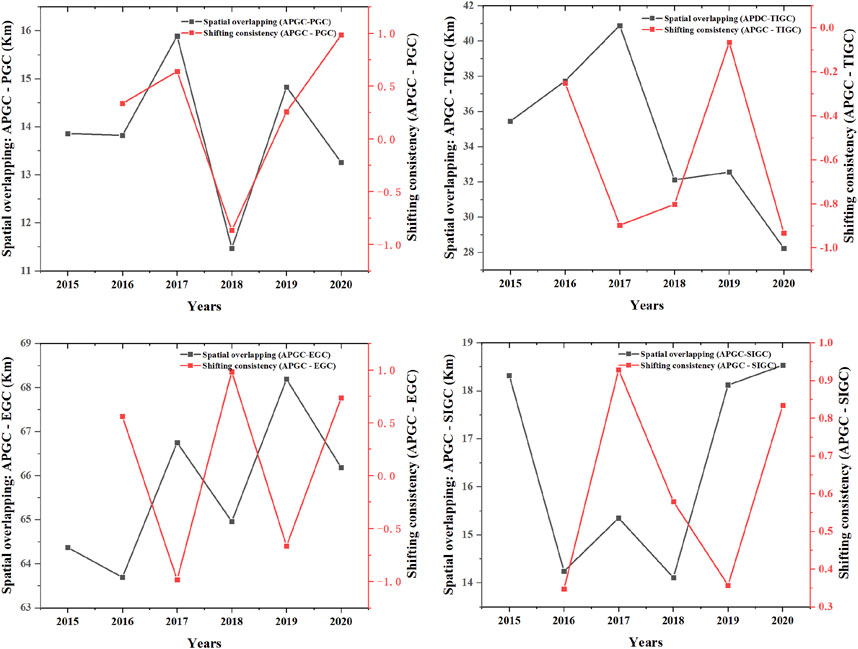
FIGURE 7. Spatial overlapping and shifting consistency indicators in the BTH region and its surrounding areas.
The value range of the SCI is from −1 to 1, and the closer it is to 1 the more the shifting trends to be in the same direction, and vise verse. According to Figure 7, the APGC and the SIGC has the highest shifting consistency, since the values of their shifting consistency indicator are larger than 0.3 in all years, and its maximum value is close to 1. In contrast, the APGC and the TIGS has the lowest shifting consistency with the SCI value smaller than 0 in all years. The SCI of the APGC and the PGC has values > 1 except in 2018. The shifting trends between the APGC and the EGC is consistent in 2016, 2018 and 2020 and is opposite in 2017 and 2019 (Figure 7).
3.4.2 Impact of socioeconomic factors on air pollution of the pollution clustering area
The SOI and SCI is used to investigate the spatial coupling degree of the APGC and other gravity centers from a static and dynamic perspective, respectively. Combining the results of the SOI and SCI, it is obtained that spatial coupling between air pollution and the secondary industry is the highest, but the spatial coupling between air pollution and the tertiary industry (or the economic volume) is low. This indicates that in the BTH region and its surrounding areas, the driving factors of air pollution is dominated by industrial structure but not economic volume (GDP). Other studies also found that irrationality of industrial structure is the main causes of serious air pollution in these areas (Li et al., 2021).
Therefore, seeking the technological upgrading and industrial transformation of the secondary industry will become important in the controlling of air pollution in these areas. Industry contribution rates of the representative cities in the BTH region and its surrounding areas from 2015 to 2020 are shown in Table 3. Beijing, Tianjin, and Shijiazhuang have high proportion of tertiary sector, and the proportion of tertiary industry in Beijing reached 82.86%. All other cities are dominated by the secondary industry which is characterized with high energy consumption, non-clean energy as the main driver and crude production methods. Beijing, as the city with the largest population density and economic volume in BTH region, it maintains the best air quality in BTH region, which is closely related to the tertiary industry with low energy consumption and high economic benefits (Table 3).
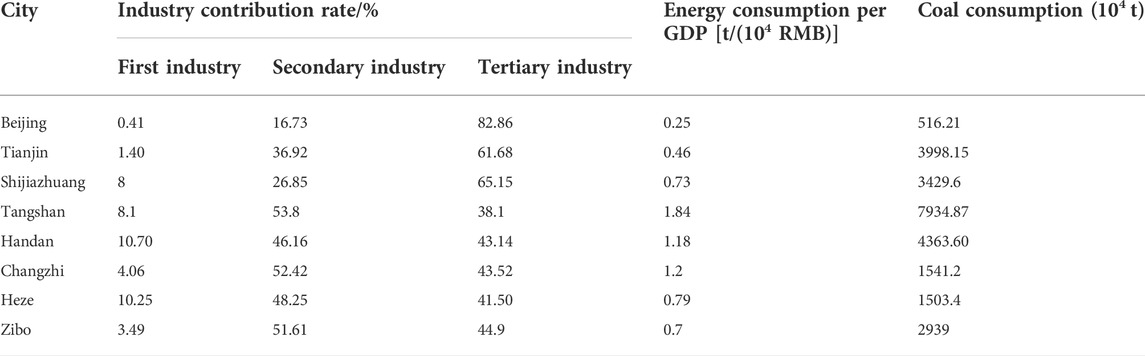
TABLE 3. Industry contribution rate (%) of typical cities in the BTH and its surrounding areas.
Policies also have played an important role in the decoupling of air pollution and economic development (Li et al., 2021). With stricter environmental protection policies and higher technical requirements, there is more resistance for high-pollution enterprises to stay in developed areas, and these enterprises will be transferred to underdeveloped areas. This may be the reason for the low level of spatial coupling between air pollution and GDP in the BTH region and its surrounding areas.
4 Conclusion
China’s air pollution control has great achievements. From 2015 to 2020, the overall AQI value decreasing at a rate of about 27% yearly. The spatial distribution of the AQI in China showed positive spatial autocorrelation at 5% significance. The BTH region and the southern region of Xinjiang are air pollution clustering areas. Both areas are influenced by topography and meteorological conditions, which lead to accumulation of air pollutants. However, the BTH region is influenced by human factors with PM2.5 as the primary pollutant. While southern Xinjiang is more affected by desert dust with PM10 as primary pollutant.
The AQI varies with seasons. The most serious air pollution with PM10 as primary pollutant occurs in spring in the southern region of Xinjiang, and the greatest extent of air pollution with PM2.5 as the primary pollutant occurs in winter affecting 12% areas of the country.
Air pollution has the highest degree of spatial coupling with the secondary industry, and low degree of coupling with the tertiary industry and the economic volume in the BTH region and its surrounding areas. This indicates that in these areas, the driving factors of air pollution is secondary industry. Therefore, seeking the technological upgrading and industrial transformation of the secondary industry will be an important factor to further improve air pollution in China.
Data availability statement
Publicly available datasets were analyzed in this study. This data can be found here: http://www.cnemc.cn/.
Author contributions
All authors listed have made a substantial, direct, and intellectual contribution to the work and approved it for publication.
Conflict of interest
MZ was employed by Jiangsu Zhongwu Environmental Protection Industry Development Co. LTD.
The remaining authors declare that the research was conducted in the absence of any commercial or financial relationships that could be construed as a potential conflict of interest.
Publisher’s note
All claims expressed in this article are solely those of the authors and do not necessarily represent those of their affiliated organizations, or those of the publisher, the editors and the reviewers. Any product that may be evaluated in this article, or claim that may be made by its manufacturer, is not guaranteed or endorsed by the publisher.
References
Bivand, R. S., and Wong, D. W. S. (2018). Comparing implementations of global and local indicators of spatial association. TEST 27, 716–748. doi:10.1007/s11749-018-0599-x
Fan, J. (1996). An analysis of the economic features and regional difference of Chian‘s rural industrialization. Acta Geogr. Sin. 1996. 398–407. doi:10.11821/xb199605002
Fan, J., Tao, A., and Lv, C. (2010). The coupling mechanism of the centroids of economic gravity and population gravity and its effect on the regional gap in China. Prog. Geogr. 29, 87–95. doi:10.11820/dlkxjz.2010.01.012
Han, L., Zhou, W., Li, W., Qian, Y., and Wang, W. (2019a). Fine particulate (PM2.5) dynamics before and after China’s “Reform and Opening up” policy in Shenzhen. Phys. Chem. Earth, Parts A/B/C 111, 100–104. doi:10.1016/j.pce.2019.04.004
Han, X., Li, H., Liu, Q., Liu, F., and Arif, A. (2019b). Analysis of influential factors on air quality from global and local perspectives in China. Environ. Pollut. 248, 965–979. doi:10.1016/j.envpol.2019.02.096
Hao, Y., and Liu, Y.-M. (2016). The influential factors of urban PM2.5 concentrations in China: A spatial econometric analysis. J. Clean. Prod. 112, 1443–1453. doi:10.1016/j.jclepro.2015.05.005
Jiang, P., Pan, X., Peng, Y., and Xu, T. (2020). Analysis of spatio-temporal distribution characteristics of air quality in Xinjiang region. GEOSPATIAL Inf. 18, 85–89+99+8. doi:10.3969/j.issn.1672-4623.2020.07.023
Li, H., Wang, S., Zhang, W., Wang, H., Wang, H., Wang, S., et al. (2021). Characteristics and influencing factors of urban air quality in beijing-TianjinHebei and its surrounding areas (‘2+26’Cities). Res. Environ. Sci. 34, 172–184. doi:10.13198/j.issn.1001-6929.2020.12.26
Li, J., Li, C., and Yin, Z. (2013). ArcGIS based kriging interpolation method and its application. Bull. Surv. Mapp. 87, 90–97. doi:10.1007/s12204-013-1367-4
Li, X., Zhang, M., Wang, S., Zhao, A., and Ma, Q. (2012). Variation characteristics and influencing factors of air pollution index in China. Environ. Sci. 33, 1936–1943. doi:10.13227/j.hjkx.2012.06.035
Lian, X. (2007). Analysis on the space evolvem ent track of population G ravity center, employm ent G ravity center and econom ic G ravity center. Popul. J. 8, 23–28. doi:10.16405/j.cnki.1004-129x.2007.03.005
Liang, L., Chen, M., Luo, X., and Xian, Y. (2021). Changes pattern in the population and economic gravity centers since the Reform and Opening up in China: The widening gaps between the South and North. J. Clean. Prod. 310, 127379. doi:10.1016/j.jclepro.2021.127379
Liao, H., Gao, Y., Chen, D., Dai, H., Du, N., Fang, L., et al. (2021). Assessment of air quality-climate interactions in IPCC A6. Trans. Atmos. Sci. 44, 658–666. doi:10.13878/j.cnki.dqkxxb.20210823011
Liu, C., Jin, M., Zhu, X., and Peng, Z. (2021). Review of patterns of spatiotemporal PM2.5, driving factors, methods evolvement and urban planning implications. J. Hum. Settlements West China 36, 9–18. doi:10.13791/j.cnki.hsfwest.20210402
Mamatabdulla, E., Ayxamgul, M., Sayran, W., Chen, T., Bupatima, A., Ayxam, M., et al. (2021). Temporal distribution and variation characteristics of sandstorms in Hotan Prefecture. Arid Zone Res. 38, 1306–1317. doi:10.13866/j.azr.2021.05.12
Mei, M., Zhu, R., and Sun, C. (2019). Study on meteorological conditions for heavy air pollution and its climatic characteristics in “2+26” cities around BeijingTianjin-Hebei region in autumn and winter. Clim. Change Res. 15, 270–281. doi:10.12006/j.issn.1673-1719.2018.130
Pei, Y., Zhu, Y., and Wang, N. (2021). Air pollution, industrial efficiency and industrial agglomeration. Ecol. Econ. 37, 176–184+222.
Shen, F. (2021). Study on the spatiotemporal changes of the concentration of air pollutants and the air quality health index in China. Atmosphere. doi:10.27248/d.cnki.gnjqc.2021.000050
Tao, Y., Shen, J., and Yang, W. (2019). On the spatial effects of China’s industrial energy environment efficiency and their influencing factors : A perspective of air pollution. J. Southwest Univ. Sci. Ed. 41, 107–117. doi:10.13718/j.cnki.xdzk.2019.06.016
Wang, L., Zhang, S., Liu, Y., and Liu, Y. (2022). Interaction between construction land expansion and cropland expansion and its socioeconomic determinants: Evidence from urban agglomeration in the middle reaches of the yangtze river, China. Front. Environ. Sci. 10, 882582. doi:10.3389/fenvs.2022.882582
Webster, R., and Oliver, M. A. (2007). Geostatistics for environmental scientists. Hoboken, New Jersey, U.S: Wiley. doi:10.1002/9780470517277
Xie, Z., Zhou, Y., and Yang, L. (2018). Review of study on precipitation in Xinjiang. Torrential Rain Disasters, 37, 204–212. doi:10.3969/j.issn.1004-9045.2018.03.002
Xuan, L. (2020). Study on the spatial-temporal P attern and influencing F actors of carbon emission intensity. Therm. Power Ind. doi:10.27307/d.cnki.gsjtu.2020.003279
Zang, X., Lu, Y., Yao, H., Li, F., and Zhang, S. (2015). The temporal and spatial distribution characteristics of main air pollutants in China. Ecol. Environ. Sci. 24, 1322–1329. doi:10.16258/j.cnki.1674-5906.2015.08.010
Zhang, H. (2020). Spayial and temporal distribution characteristics of airquality and prediction of PM2.5 concentration in Beijing-Tianjin-Hebei region. Front. Environ. Sci. doi:10.27064/d.cnki.ghasu.2020.001273
Zhang, L., and Pan, J. (2021). Spatial-temporal pattern of population exposure risk to PM2.5 in Global. China Environ. Sci. 41, 5391–5404. doi:10.19674/j.cnki.issn1000-6923.20210706.008
Zhang, S., and Zhang, K. (2007). Comparison between general Moran′s Index and Getis-Ord general g of spatial autocorrelation. Acta Sci. Nat. Univ. Sunyatseni 46, 93–97. doi:10.3321/j.issn:0529-6579.2007.04.021
Zhang, X., Xu, X., Ding, Y., Liu, Y., Zhang, H., Wang, Y., et al. (2019). The impact of meteorological changes from 2013 to 2017 on PM2.5 mass reduction in key regions in China. Sci. China Earth Sci. 62, 1885–1902. doi:10.1007/s11430-019-9343-3
Zhang, X., and Zhang, J. (2006). Xinjiang meteorological manual. Beijing: China Meteorological Press.
Zhao, H., Liu, Y., Lindley, S., Meng, F., and Niu, M. (2020). Change, mechanism, and response of pollutant discharge pattern resulting from manufacturing industrial transfer: A case study of the pan-yangtze river delta, China. J. Clean. Prod. 244, 118587. doi:10.1016/j.jclepro.2019.118587
Zhong, J., Zhang, X., and Wang, Y. (2019). Relatively weak meteorological feedback effect on PM2.5 mass change in Winter 2017/18 in the Beijing area: Observational evidence and machine-learning estimations. Sci. Total Environ. 664, 140–147. doi:10.1016/j.scitotenv.2019.01.420
Zhu, J., and Yao, J. (2021). Socio - economic factors on air quality in 31 provincial capital cities in China. Environ. Sci. Surv. 40, 20–27. doi:10.13623/j.cnki.hkdk.2021.06.004
Keywords: air quality, spatial distribution, air pollution gravity centers, social factors, economic factors
Citation: Yan D, Zhou M, Diao Y and Yang M (2022) Air pollution in China: Spatial patterns and spatial coupling with population and economy. Front. Environ. Sci. 10:1040131. doi: 10.3389/fenvs.2022.1040131
Received: 09 September 2022; Accepted: 28 September 2022;
Published: 12 October 2022.
Edited by:
Honglei Wang, Nanjing University of Information Science and Technology, ChinaReviewed by:
Huiming Li, Nanjing Normal University, ChinaLing Zhang, Nanjing Forestry University, China
Copyright © 2022 Yan, Zhou, Diao and Yang. This is an open-access article distributed under the terms of the Creative Commons Attribution License (CC BY). The use, distribution or reproduction in other forums is permitted, provided the original author(s) and the copyright owner(s) are credited and that the original publication in this journal is cited, in accordance with accepted academic practice. No use, distribution or reproduction is permitted which does not comply with these terms.
*Correspondence: Yiwei Diao, ZGlhb3l3QGN3eHUuZWR1LmNu; Meng Yang, eWFuZ21AY3d4dS5lZHUuY24=
†These authors have contributed equally to this work and share first authorship