 Hairong Huang1
 Zhengyu Zhang
- 1Business School, Nanjing Normal University, Nanjing, China
- 2School of Public Administration, China University of Geosciences, Wuhan, China
While embedding in the global value chain (GVC), avoiding becoming a “pollution shelter” is an urgent issue that needs to be solved for the low-carbon economic development of countries along the Belt and Road. This study empirically analyzes the impact of manufacturing GVC embedding on carbon emissions and its mechanism from the perspectives of the embedding position and degree of the GVC. It then carries out group regressions by different industries, value chain embedding modes, and so on. Finally, this study constructs static and dynamic panel models to verify the nonlinear relationship between manufacturing GVC embedding and carbon emissions. The results show that the improvement of the embedding position of GVC in the manufacturing industry promotes an increase in carbon emissions; the deeper the embedding degree of GVC, the more conducive it is to carbon emissions reduction. Compared with the service industry, the impact of manufacturing GVC embedding on carbon emissions is more significant; regardless of the value chain embedding model, the deeper the embedding degree, the more conducive it is to carbon emissions reduction. Technological progress can weaken the impact of GVC embedding on carbon emissions. There is a U-shaped relationship between the GVC embedding position and carbon emissions in the manufacturing industry and an inverted U-shaped relationship between the GVC embedding degree and carbon emissions. This study provides beneficial insights for countries along the Belt and Road to embed into the GVC to avoid falling into the dilemma of “pollution growth”.
1 Introduction
The accelerated process of globalization and the rapid development of the economy and society have brought unprecedented material wealth but have also produced irreparable ecological trauma. Countries around the world are facing severe ecological challenges such as environmental pollution, climate change, and biodiversity reduction, and the quality of life and health of residents are also seriously threatened. Sustainable development has gradually become an important common topic for the development of all countries in the world. As a region with concentrated production and consumption of energy resources in the world, the economic development of the Belt and Road countries is characterized by high carbon (Kowalski et al., 2015; Zhang et al., 2018a). In 2019, the total carbon emissions of the 146 Belt and Road countries accounted for approximately 31% of the total global carbon emissions, which was significantly higher than the 22.1% of the global GDP of the Belt and Road countries. With the continuous advancement of industrialization and urbanization in the Belt and Road countries, the total carbon emissions will rise further (CICC Research Institute, 2021). According to the Organization for Economic Co-operation and Development (OECD) and International Monetary Fund (IMF), the carbon emissions of the Belt and Road countries are likely to increase to 35%–40% by 2030. This region is likely to become a more sensitive area to climate issues in the future. In the process of global value chain (GVC) embedding, the Belt and Road countries mainly rely on the advantages of resources and factor costs to undertake industries with “high pollution, high energy consumption, and low efficiency” from developed countries, and most of them are currently located in the low-value-added processing and manufacturing links of the GVC (Shi et al., 2022) and receive fewer benefits, which creates a serious imbalance between the distribution of benefits and proportion of carbon costs in the GVC division of production (Li et al., 2021), and these countries are likely to have fallen into the situation of “pollution growth” and become “pollution refuges” for developed countries (Wang et al., 2020; Wang et al., 2022a). Therefore, under the background of the continuous refinement of international production division, exploring how the Belt and Road countries can improve the utilization rate of energy resources and reduce carbon emissions while deeply embedding into the GVC. It will not only help these countries to avoid falling into the vicious circle of “treatment after pollution” and get out of the dilemma of “pollution growth” but also contribute to the achievement of global temperature control goals and jointly promote the sustainable development of the global economy.
With further development of the GVC division of labor and increasingly severe climate problems, studies on the relationship between the embedding of the GVC and carbon emissions have become the focus of researchers (Zhang et al., 2018b; Wang et al., 2019; Assamoi et al., 2020; Cai et al., 2020; Duan et al., 2021; Liu and Zhao, 2021; Wang et al., 2021). This study mainly reviews the recent literature on the environmental effects of GVC embedding from three aspects: research content, methods, and action mechanism. 1) Research content. The current research mainly examines the impact of GVC embedding position (Liu et al., 2018; Sun et al., 2019) or GVC embedding degree (Jin et al., 2022; Liu and Zhao, 2021) on the environment and discusses the heterogeneous impact of GVC embedding on the environment from the perspectives of different GVC embedding models (Sun and Du, 2020) and different factor-intensive industries (Lv and Lv, 2019). 2) Research methods. Most of the current studies build a GVC embedding index based on the “KPWW” method proposed by Koopman et al. (2010) and discuss the environmental effects of GVC embedding (Kordalska and Olczyk, 2021; Bai and Yu, 2022). A few refer to the practice of Antras et al. (2012) to construct the GVC embedding position index (Dai et al., 2020). In addition, Wang et al. (2022b) also included environmental costs in the GVC embedding index and analyzed the impact of green GVC embedding on employment. 3) Influence mechanism. At present, the mechanism of the impact of GVC embedding on carbon emissions mainly includes the technology spillover effect, structural upgrading effect, environmental regulation effect, scale effect, and low-end lock-in effect (Xu et al., 2019; Qian et al., 2022; Yu and Duan, 2022). Other researchers have investigated the mediating effect of GVC embedding on energy conservation and emission reduction from the perspectives of energy consumption intensity and structure (Bai and Yu, 2022). Finally, few studies, represented by China, have discussed the nonlinear relationship between GVC embedding and carbon emissions (Xie and Huang, 2018; Tian and Zhhuang, 2019).
Generally speaking, there are still some shortcomings in the current research: 1) Most of the recent literature discuss the impact of the GVC embedding position or degree on the environment. Only analyzing the environmental effects of GVC embedding from a certain angle may lead to a one-sided analysis of the results. 2) Most of the current literature constructs the GVC embedding index based on the “KPWW” method proposed by Koopman et al. (2010). Compared with the “KPWW” method, the GVC embedding position and the GVC embedding degree index constructed according to the “WWYZ” method proposed by Wang et al. (2017a), Wang et al. (2017b) can reflect a country’s embedding position and degree in GVC more accurately. Since this GVC embedding position index addresses the consistency of production location indicators used in the current literature, the GVC embedding degree index provides a complete picture of a country’s participation in GVC based on whether production factors cross national borders. 3) As a potential climate-sensitive region in the future, study on the environmental effects of GVC embedding of the Belt and Road countries is of great practical significance to the sustainable development of these countries and even the whole world. Moreover, at present, there is little literature to carry out relevant analysis and further explore whether there is a nonlinear relationship between GVC embedding and the environment in the Belt and Road countries.
Compared with the existing research, the marginal contribution of this study may be as follows: 1) The embedding position and degree of GVC are inseparable. Combining them to discuss the environmental effects of GVC embedding will be more comprehensive, and it is helpful to clarify the low-carbon emission reduction paths of countries along the Belt and Road in the process of GVC embedding from different perspectives. 2) Based on the “WWYZ” method, this study constructs the index of the GVC embedding position and degree to explore the impact of GVC embedding on carbon emissions by using this more accurate GVC embedding index and analyzes the mechanism of the impact of GVC embedding on the environment so that it can find out the main impact mechanism that will help the Belt and Road countries to achieve carbon emission reduction in the process of GVC embedding. 3) This study takes the countries along the Belt and Road as the research object and analyzes the impact of GVC embedding on the environment. In addition, we conduct a grouping regression according to different technology-intensive manufacturing industries, industries, and embedding modes and discuss the environmental benefits of GVC embedding in different groupings. Then, considering that carbon emissions have the characteristics of time continuation and lag, this study empirically verifies the nonlinear relationship between GVC embedding and carbon emissions by constructing a static and dynamic panel model in order to provide a specific path reference for developing countries along the Belt and Road to get out of the dilemma of “pollution growth” and promote the realization of global temperature control goals.
2 Research hypotheses
Countries around the world obtain corresponding economic benefits by embedding into the division of production in GVC with their own endowment advantages. The differences in GVC embedding position and degree also bring about differences in environmental effects among countries. Referring to the existing literature, this study mainly discusses the mechanism of GVC embedding on carbon emissions from the three mechanisms of technology spillovers, structural upgrading, and low-end lock-in effect (Liu et al., 2020), and from the two aspects of GVC embedding position and degree.
The promotion of the embedding position of GVC mainly refers to the gradual transfer from the downstream to the upstream and from the low value-added to the high value-added link of the industry. In the short-term, with the improvement of the GVC embedding position, in the beginning, a country gradually approaches the middle and upper reaches of the industry. At this time, the improvement in production efficiency improves the energy utilization rate and reduces carbon emissions to a certain extent. However, in the long run, the improvement of the GVC embedding position does not mean that the country has crossed over to the clean industry. The country is likely to still be in the pollution-intensive processing and manufacturing industry, the GVC embedding position is still low, and the environmental pollution problems continue to exist (Pan, 2017). It may even lead to an increase in domestic production links in this industry because of the improvement of production efficiency, increase in total energy consumption, and more serious environmental pollution.
From the perspective of the GVC embedding degree, Cohen and Levinthal (1989) mentioned that advanced technology from developed countries is absorbed only when a country’s absorption capacity reaches a certain level. In the initial stage of GVC embedding, due to the low degree of embedding, unskilled production technology, Insufficient contact and low absorption capacity for advanced technology and management experience in developed countries, the host country’s resource utilization rate is low. However, the energy demand and consumption of GVC embedding are increasing, and the environmental problems caused by GVC embedding are worsening. With a deeper degree of GVC embedding, the host country becomes more proficient in the division of labor in the GVC and the ability to absorb and make use of the advanced technology of developed countries to develop their own cleaner production technology is gradually enhanced. Moreover, in order to improve their own economic interests, developed countries will also provide some technical support to the host countries. Finally, the utilization rate of energy resources in the host country is improved, and the carbon emissions are reduced.
H1: There is a U-shaped and inverted U-shaped relationship between the GVC embedding position and carbon emissions and GVC embedding degree and carbon emissions, respectively.
2.1 Technology spillover effects
On the one hand, the Belt and Road countries can obtain technology directly from developed countries through patent transfer and technology authorization to improve the efficiency of cleaner production in the industry. On the other hand, these countries can promote their own technological progress by attracting foreign direct investment; taking advantage of the technological spillovers brought by the demonstration, competition, training, and industrial linkage effects of foreign direct investment; or improving their technological level via the import and export trade of intermediate products through imitation, learning, and secondary innovation (Gereffi and Lee, 2012). However, when technological progress is a high-carbon technology, the faster the technological progress, the more it leads to an increase in carbon emissions. Conversely, if it is a low-carbon or clean technology, the faster the technological progress, the higher the energy efficiency and carbon emission reduction (Ghisetti and Quatraro, 2017).
2.2 Structural upgrading effect
With the development of the division of production in the GVC, the upgrading of the industrial structure is no longer only transferred from the primary to the secondary and tertiary industries, or from labor-intensive to capital and technology-intensive industries, but can be upgraded through process, product, functional, and chain upgrading (Humphrey and Schmitz, 2001) and carbon emissions reduction (Ghisetti and Quatraro, 2017). On the one hand, the structural upgrading effect brought about by the embedding of the GVC drives the upgrading of the energy consumption structure, thereby reducing the carbon emissions of the host country. On the other hand, the high pollution and low-value-added production links transferred from developed to developing countries may seriously lag behind the industrial development level of developing countries. The path dependence formed by long-term participation in low-value-added processing production and the technical upgrading barrier formed by the specialized division of production make it difficult for these developing countries’ industries to transform into high-value-added links, or industrial structure upgrading is not synchronized with their economic and technological development level, resulting in the aggravation of pollution.
2.3 Low-end lock-in effect
Most Belt and Road countries are developing countries, which are mainly embedded in the division of production in the GVC with high energy consumption and low added value by their advantages of natural resources and labor costs. There is a gap between the technological frontier and innovation systems of developed countries, and the Belt and Road countries are highly dependent on the import of high-tech parts from developed countries. Moreover, to maintain their “dominant” position in the GVC, developed countries adopt measures such as technical blockade and intellectual property protection against developing countries, which forces them to be locked in the low-end value chain production with low added value and high pollution for a long time, and the environmental pressure gradually increases. However, the specialized division of production in the short-term low-end links also makes a country more skilled in the technology of the division of production and gradually embeds it into the division of production with higher added value in the industry. Compared to the low value-added division of production, production efficiency is improved, and energy consumption per unit of production and carbon emissions are reduced. Given the abovestated analysis, we propose the following hypothesis.
H2: Technology spillover, structural upgrading, and low-end lock-in effects have significant moderating effects on the impact of GVC embedding on carbon emissions. However, whether there is a positive regulation effect on carbon emission reduction in the Belt and Road countries, the conclusion remains to be verified empirically.
3 Model construction and description
3.1 Model construction
3.1.1 Benchmark model
Owing to the high degree of “fragmentation” and “globalization” of the manufacturing industry, the degree of GVC embedding is deeper. Therefore, this study empirically analyzes the environmental effects of GVC embedding in manufacturing in the Belt and Road countries by combining GVC embedding position and degree to provide a path reference for such countries to reduce carbon emissions and contribute toward temperature control. Accordingly, the model constructed in this study is as follows:
where CO2it is the explanatory variable; the carbon emissions of country i in period t; and GVC_POSit and GVC_PATit are the core explanatory variables of this study, which represent the industry GVC embedding position index and degree index in period t of country i, respectively. Xit includes mechanism and control variables. The mechanism variables include technology spillover effects (lntecit), structural upgrade effects (Indit), and low-end lock-in effects (lockit). The control variables include trade openness (fdiit), industry structure (struit), natural resource endowment (nait), urbanization level (urit), and energy consumption structure (energyit). εit represents the random interference term, αit represents the constant term, and λit represents the estimated coefficient.
3.1.2 Dynamic panel model
Considering the time continuity and lag of carbon emissions and the possible nonlinear relationship between GVC embedding and carbon emissions, this study introduces the primary and quadratic terms of the core explanatory variables and builds static and dynamic panel models to verify the nonlinear relationship between manufacturing GVC embedding and carbon emissions. The specific model is as follows.
where CO2i,t-1 refers to the carbon emissions of one lag period; GVC_POS2 it and GVC_PAT2 it are the square terms of the GVC embedding position index and degree index, respectively; and βit represents the estimated coefficient. Eqs 3–6 represent the constructed static and dynamic panel models, respectively.
3.2 Variables and data description
3.2.1 Core variables
Carbon emissions are the explained variables. This study selects carbon emissions as a proxy variable for environmental benefits and specifically selects the per capita metric tons of carbon emissions to represent carbon emissions.
The GVC embedding position and degree are the core explanatory variables of this study. These two indicators are constructed based on the above “WWYZ” method. The GVC embedding position index refers to the ratio of forward to backward production length. The GVC embedding degree index is the sum of forward and backward engagement. The GVC embedding position is mainly used to calculate the relative distance between a certain industry in a country and the two ends of the value chain and to examine the relative position of a certain industry in a country under the value chain division system. The larger the index value, the higher the division position, and conversely, the lower the division of production. The greater the GVC embedding degree index value, the deeper the embedding degree of the GVC, and conversely, the lower the embedding degree. The formula is as follows:
where PLv_GVCit indicates the forward production length of the industry in country i in period t. The longer the forward production length, the more downstream production stages in a certain industry in a country, the higher the production complexity, and it is in the upstream link of the value chain. PLy_GVCit represents the backward production length of the industry in country i in period t, and the longer the backward production length, the more upstream production stages in a certain industry in a country, which is in the downstream link of the value chain. GVC_PAT_Fit indicates the forward participation of the industry in country i in period t; the higher the forward participation, the more it is in the production stage upstream of the GVC. GVC_PAT_Bit represents the backward participation of the industry in country i in period t, and the higher the backward participation, the more it is in the production stage downstream of the GVC.
3.2.2 Mechanism variables
The technical spillover, structure upgrade, and low-end lock-in effects are the mechanism variables. Because the lack of R&D investment indicators in some sample countries is more serious, this study selects energy consumption per unit of GDP as the reverse index of technological progress. That is, lower energy consumption per unit of GDP indicates technological progress. Industrial structure upgrade is expressed as the proportion of the domestic added value of exports of intermediate products in the industry. The higher the domestic added value of the export of intermediate goods in the industry, the more a country has gradually changed from importing intermediate products from other countries to providing intermediate products for other countries and achieving industrial structure upgrading. The low-end lock-in effect is expressed as the proportion of the domestic added value of the industry’s export products, which is a reverse indicator: the larger the proportion of the domestic added value of the industry’s export products, the weaker the lock-in effect.
3.2.3 Control variables
Trade openness, industry structure, natural resource endowments, urbanization level, and energy consumption structure are the control variables. Trade liberalization selects the proportion of foreign direct investment in GDP as a proxy variable. Industry structure is expressed in terms of the proportion of industry added value. Natural resource endowments select natural resource rents as a percentage of GDP as a proxy variable. The level of urbanization is expressed as the proportion of the urban population. The energy consumption structure selects the proportion of fossil fuel energy consumption as the proxy variable. The specific data sources are listed in Table 1.
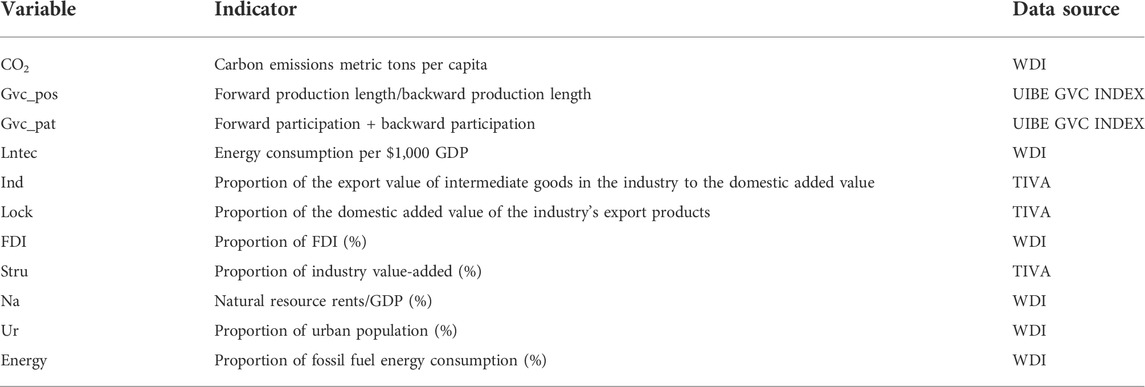
TABLE 1. Variable description and source.
To ensure the availability and integrity of the data, this study combines the ADBMRIO2021 database of UIBE GVC INDEX and the Trade in Value-Added (TiVA) database jointly released by the Organization for Economic Co-operation and Development (OECD) and World Trade Organization (WTO) and selects the industry panel data of 35 Belt and Road countries from 2007 to 2019 for analysis. Referring to Lv and Lv (2019), this study further subdivides the manufacturing industry into technology-intensive and non-technology-intensive manufacturing. Table 2 lists the specific countries, industry choices, and classifications.
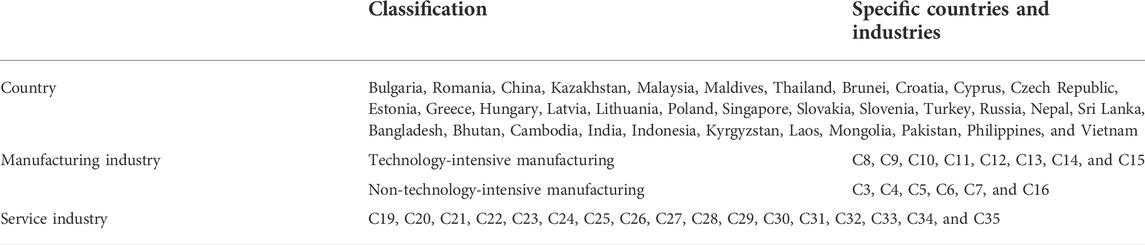
TABLE 2. Selection of sample countries and industries.
4 Empirical results and analysis
4.1 Benchmark regression results
In this study, the ordinary least squares method (OLS), random effects model (RE), and fixed effects model (FE) were used for regression. It was found that the FE model should be selected for regression. The specific results are shown in Table 3: Columns (1) and (4) are the regression results with no control variables and only control individual fixed effects; columns (2) and (5) are the regression results of adding control variables; columns (3) and (6) are the two-way fixed effect regression results with control variables. The signs and significance of the estimated coefficients for each variable are roughly the same. The regression results of columns (3) and (6) are selected for the analysis.

TABLE 3. Regression results of environmental effects embedding in manufacturing GVC.
Manufacturing the GVC embedding position and carbon emissions change in the same direction, and the GVC embedding degree changes in the opposite direction with carbon emissions. The estimated coefficient of manufacturing GVC embedding position is significantly positive, which indicates that the higher position of the manufacturing division of the Belt and Road countries leads to environmental pollution. This may be because these countries mainly rely on natural resources such as energy and low labor costs to participate in the manufacturing industry and mainly engage in low value-added processing and assembly with high energy consumption and high pollution. Although the embedding position of GVC has improved, it may only be in the relatively upstream division of production in the industry and has not shifted from the polluting industry to the cleaning industry. The manufacturing GVC embedding position is still low for the manufacturing industry itself, which leads to the carbon emissions reduction effect of the GVC embedding position rising behind the energy consumption caused by GVC embedding, thus failing to achieve carbon emissions reductions.
The estimated coefficient of the manufacturing GVC embedding degree is significantly negative, which shows that the deeper the manufacturing GVC embedding degree, the more carbon emissions will be reduced. This may be because the deeper the GVC embedding degree, the stronger the ability to absorb and digest advanced technology and management experience in developed countries, which helps to reduce the energy consumption per unit of production in the manufacturing industry and reduce carbon emissions. This is consistent with the analysis of whether a country is embedding in GVC from the perspective of GVC governance (Gereffei, 2010). In terms of the control variables, the estimated coefficients of natural resource endowment, urbanization level, and energy structure are significantly positive, indicating that the higher the proportion of natural resource rent, the higher the urbanization level, and the greater the proportion of fossil energy consumption, the more environmental pollution will be caused. Among them, the higher the proportion of natural resource rents, the more likely is the country to be a resource-based exporter, with a strong dependence on natural resources, mainly relying on the advantages of natural resources to participate in the division of production in the value chain. Most of them are in manufacturing industries with high energy consumption and high pollution, which is not conducive to carbon emissions reduction.
4.2 Group regression results
4.2.1 Manufacturing and services
The impact of manufacturing GVC embedding on the environment is more significant than that of service GVC embedding. Considering that the level of GVC embedding position and the depth of GVC embedding degree in different industries also have different impacts on the environment, this study compares and analyzes the environmental effects of GVC embedding in the manufacturing and service industries. The results in Table 4 show that the signs of the estimated coefficients of the GVC embedding position and degree index of the service industry are the same as those of the manufacturing industry, but they are not significant. This may be because the embedding degree of GVC is deeper in the manufacturing industry in the Belt and Road countries, and its impact on carbon emissions is more significant. According to the calculation of the UIBE GVC INDEX database, the average annual GVC embedding degree index value of the 35 Belt and Road countries is 0.63, and the annual average GVC embedding degree index value of the service industry is 0.35. Furthermore, the average annual GVC embedding position index value of the manufacturing industry is 0.96, which is at the lower end of the GVC. Compared with the service industry, such as various transportation services, financial intermediaries, and other industries, the consumption intensity of energy resources is greater, and the utilization rate is low, which has a greater impact on carbon emissions.
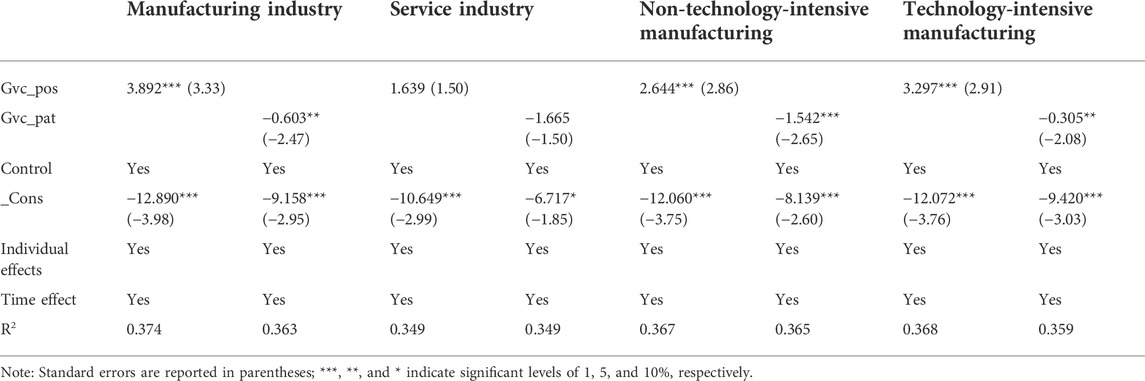
TABLE 4. Industry grouping regression results.
4.2.2 Technology-intensive and non-technology-intensive manufacturing
Both technology-intensive and non-technology-intensive manufacturing GVC embedding in Belt and Road countries significantly affect carbon emissions. As shown in Table 4, the signs of the estimated coefficients of GVC embedding in technology-intensive and non-technology-intensive manufacturing industries in the Belt and Road countries are consistent with the benchmark regression. Moreover, the improvement in the GVC embedding position is not conducive to carbon emission reduction. This may be because both technology-intensive and non-technology-intensive manufacturing industries are mostly pollution-intensive industries, and even if the GVC embedding position is improved, it is still in pollution-intensive industries, and its embedding position is still low.
The average annual GVC embedding position index of manufacturing industries in the Belt and Road countries is 0.88. There is still a large gap between developed countries with higher GVC embedding positions, such as the United States and Japan (Jiang and Liu, 2018; Feng et al., 2022), so the improvement of the GVC embedding position does not have a positive impact on carbon emission reduction. The deeper the GVC embedding, the greater the contribution toward carbon reduction. However, for non-technology-intensive manufacturing, the GVC embedding position of technology-intensive manufacturing has a stronger positive impact on carbon emissions, which may be because the GVC embedding degree of technology-intensive manufacturing industries is greater than that of non-technology-intensive manufacturing industries. According to the calculation of the UIBE GVC INDEX database, the GVC embedding degree index value of the technology-intensive manufacturing industry is 0.90, and that of the non-technology-intensive manufacturing industry is 0.67.
4.2.3 Different value chain embedding modes
Whether it is forward or backward participation in the GVC, the deeper the embedding degree of the manufacturing GVC, the more it will promote carbon emission reduction. This study divides the GVC participation into forward and backward participation to study the impact of different value chain embedding modes on carbon emissions. The results in Table 5 show that the signs of the estimated coefficients of the forward and backward participation index are both negative. It shows that whether a country is in the higher value-added link and upstream production stage, or the lower value-added link and downstream production stage of the GVC, the deeper the level of embedding degree, the more conducive it is to carbon emissions reduction. This may be because regardless of the division of production in the GVC, the more deeply embedded it is in the division of production in the GVC, the better the understanding and mastery of advanced technology and management experience in the division of production, which helps improve the utilization rate of domestic resources and reduce carbon emissions.

TABLE 5. Regression of different value chain embedding modes.
4.3 Robustness testing
The results of this study are tested for robustness using sub-sample regression, supplementary variable method (adding control variables), and other methods. These tests in Table 6 show that the results of this study are robust. Considering that the explanatory variable GVC embedding and the explained variable carbon emissions may be mutually causal, the GVC division of production and the degree of embedding in a country (region) will affect carbon emissions. Conversely, carbon emissions also affect whether to embed the GVC division of production and the type of industry undertaken by a country. Therefore, this study selects the lag term of the GVC embedding position index and degree index as the instrumental variables and uses the instrumental variable generalized estimation of moments (IV-GMM) for regression. As shown in Table 6, the results pass the sequence correlation and instrumental variable selection validity tests, and the regression results are roughly consistent with the benchmark regression.
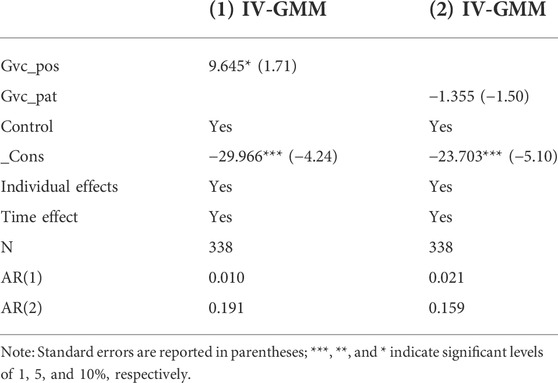
TABLE 6. Endogenous testing.
5 Analysis of the mechanism of the impact of global value chain embedding on carbon emissions
To investigate the mechanism of the impact of GVC embedding on carbon emissions in the Belt and Road countries, this study introduces the interaction terms of GVC embedding position and GVC embedding degree index with technology spillover, structural upgrading, and low-end lock-in effects and incorporates them into the model for regression analysis.
As shown in Table 7, the estimated coefficient of the interaction term between the GVC embedding position index and technological progress index is positive, indicating that the positive impact of the GVC embedding position on carbon emissions increases with the increase in energy consumption per unit of GDP, while technological progress weakens the positive impact of the GVC embedding position on carbon emissions. The positive estimation coefficient of the interaction term between the GVC embedding position index and the structural upgrade index indicates that the positive impact of GVC embedding position on carbon emissions is not always positive by the adjustment effect of industrial upgrading, which may be because although the manufacturing industry structure of the Belt and Road countries has been upgraded, most of them have only achieved process and product upgrading, and the essence of their participation in the low-end links of the GVC has not changed.
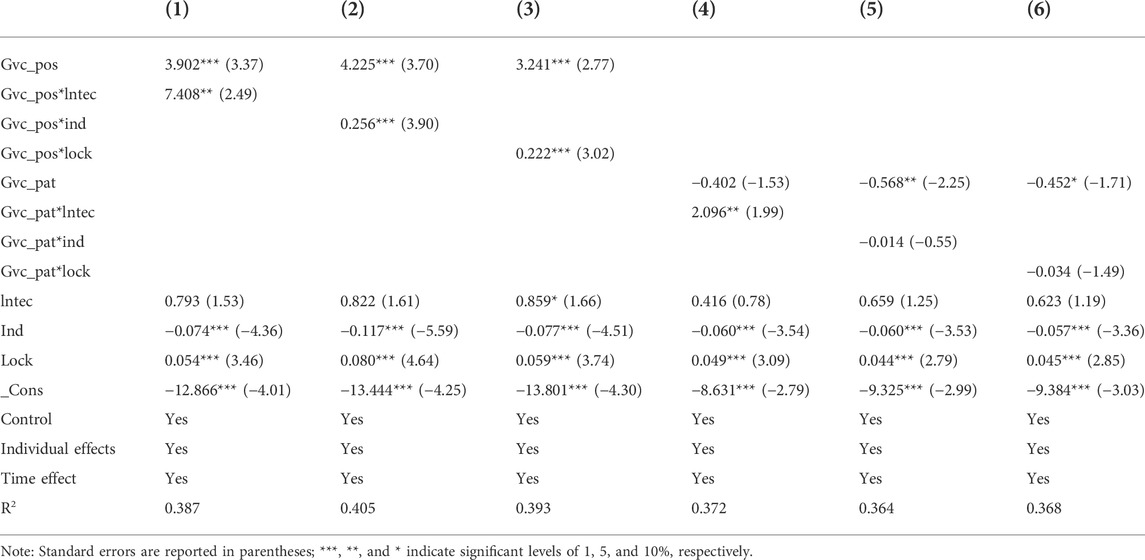
TABLE 7. Influence mechanism regression results.
The interaction coefficient between the GVC embedding position index and the low-end lock-in effect is positive. The lock-in effect index is a reverse index, which shows that the locking effect does not always enhance the positive impact of the GVC embedding position on carbon emissions. It may be that the production technology of proficiency and specialization accompanied by short-term low-end lock-in is becoming increasingly skilled, and the energy utilization rate of industrial production has improved, thus, showing that low-end lock-in still contributes to carbon emission reduction.
With regard to the degree of GVC embedding, the moderating effect of technological progress is the most significant, and the estimated coefficient of the interaction term between the degree of GVC embedding and technological progress is significantly positive, indicating that the negative influence of the degree of GVC embedding on carbon emissions weakens with technological progress. This may be because the deeper the embedding degree of GVC, with the continuous advancement of technology, the technological absorption, digestion capacity, and carbon emissions reduction effect of the embedding degree of the GVC gradually reaches a critical value. In conclusion, technological progress, structural upgrade, and the low-end lock-in effect have significant regulatory effects, but the specific regulatory effects of the three mechanisms of action are different. Therefore, the presence of H2 is confirmed.
6 Dynamic panel regression
To verify whether there is a nonlinear relationship between GVC embedding and carbon emissions, this study constructs static and dynamic panel regression models. Considering that the static panel model does not incorporate the lag term of carbon emissions into the model, there may be an estimation bias; therefore, this study selects the regression results of the systematic GMM model.
The results in Table 8 show that the estimated coefficient of the carbon emissions lag term is significantly positive, indicating that carbon emissions have time persistence and lag, there is a U-shaped relationship between GVC embedding position and carbon emissions, and there is an inverted U-shaped relationship between GVC embedding degree and carbon emissions. H1 is proved, which shows that carbon emissions first decrease and then increase with the improvement in the GVC embedding position.
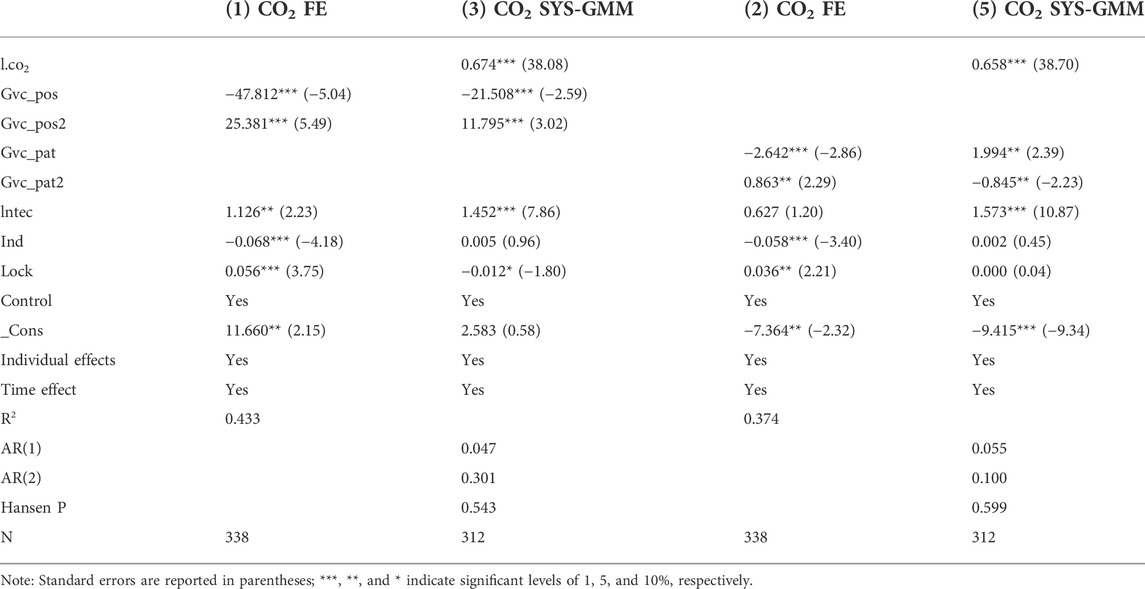
TABLE 8. Dynamic panel regression results.
With improvements in the embedding position, the Belt and Road countries are affected by technological progress and the improvement of short-term low-end specialized production efficiency, which promote their own countries to climb to higher value-added links in the industry and reduce environmental pollution compared to lower value-added links. However, affected by the low-end lock-in for a long time, it has been in a pollution-intensive industry and is unable to break through the technical barriers of industrial structure upgrades and achieve industrial chain upgrades. Even if the embedding position of the GVC is improved, it still leads to more severe environmental pollution. This also confirms that the low-end lock-in effect mentioned above does not always enhance the positive impact of the GVC embedding position on carbon emissions. However, in the long run, it is still necessary to break through the low-end lock-in dilemma and promote the upgrading of the industrial chain to help alleviate long-term environmental pollution.
With a deeper degree of GVC embedding, carbon emissions show a trend of first increasing and then decreasing; that is, at the beginning of embedding in the GVC division of production, it may be more likely to undertake industrial transfer from developed countries with the advantages of natural resources and low labor costs. The ability to absorb and utilize technology and management experience is not strong. Most of these industries are “high-energy-consuming, high pollution, and low-value-added” industries, and carbon emissions will increase. However, deepening the embedding degree of Belt and Road countries will help to fully absorb advanced technology and management experience, promote the improvement of domestic cleaner production technology, reduce energy consumption, and transform into a clean industry, which will ultimately reduce environmental pollution.
7 Research conclusion and recommendations
This study selects panel data from 35 Belt and Road countries from 2007 to 2019 to verify the influence of GVC embedding position and GVC embedding degree on carbon emissions in manufacturing and carries out grouping regression according to industry type and different value chain embedding patterns. Furthermore, to clarify the mechanism of the impact of GVC embedding position and degree on carbon emissions, this study includes the interaction terms of the technology spillover effect, structural upgrading effect, low-end lock-in effect, and core explanatory variables for regression analysis. Finally, this study empirically verifies the nonlinear relationship between GVC embedding and carbon emissions in the manufacturing industry.
The results are as follows. (1) The improvement in the embedding position of the GVC in the manufacturing industry is not conducive to carbon emission reduction. Regardless of whether it is forward or backward embedding in the GVC, the deeper the GVC embedding degree in the manufacturing industry, the more conducive it is to carbon emission reduction. (2) Compared with the service industry, GVC embedding in manufacturing has a stronger impact on carbon emissions. Among them, the GVC embedding position in the technology-intensive manufacturing industry has a stronger positive impact on carbon emissions. (3) There is a U-shaped relationship between the GVC embedding position and carbon emissions and an inverted U-shaped relationship between the GVC embedding degree and carbon emissions. Although the technology spillover effect weakens the positive impact of the GVC embedding position on carbon emissions, it also weakens the carbon emission reduction effect of the GVC embedding degree, which shows that it is necessary to rationally use technology spillover to alleviate the environmental pollution problems of Belt and Road countries. Furthermore, the regulatory effect of structural upgrading is not always conducive to carbon emission reduction, and the adjustment effect of the low-end lock-in effect is not always unfavorable to carbon emission reduction.
Based on this, this study proposes the following suggestions. First, the Belt and Road countries should take advantage of the opportunities of the Belt and Road initiative, “BRICS+,” and so on to build a new two-way “nested” GVC division of production system with China as the core, strengthen the GVC association among the Belt and Road countries, gradually move toward higher value-added and low-carbon links while improving the depth of the GVC embedding in the Belt and Road countries, give full play to the technological spillover effect of the GVC embedding, and improve their clean production capacity.
Second, the Belt and Road countries should transform from structural upgrades, such as process and product upgrading, to high-end industrial structure upgrades, such as chain upgrading. They should also pay attention to the environmental pollution problems caused by technology-intensive manufacturing and strengthen their cooperation with emerging economies. Cultivating a competitive advantage in the process of embedding in the GVC breaks through the barriers to industrial upgrading, strides forward to the cleaning industry, and, finally, realizes carbon emission reduction.
Third, when development reaches a certain stage, independent research and development are more important than the technology spillover effect obtained by embedding in the GVC. While accelerating independent research and development efforts, we should actively participate in the division of production in the GVC and effectively use technology spillovers to accelerate the pace of independent innovation, improve the competitiveness of the country’s GVC, and help the Belt and Road countries to break the high-profit monopoly of developed countries and get out of “pollution refuge” dilemma.
Data availability statement
Publicly available datasets were analyzed in this study. This data can be found at: https://databank.worldbank.org/reports.aspx?source=world-development-indicators.
Author contributions
HH: methodology, software, validation, formal analysis, and writing—original draft. ZZ: writing—review and editing and data analysis. FJ: supervision and guidance.
Funding
This work was supported by the National Social Science Fund Project of Jiangsu Innovation Economy Research Base (Grant No. 21 and ZD122)
Conflict of interest
The authors declare that the research was conducted in the absence of any commercial or financial relationships that could be construed as a potential conflict of interest.
Publisher’s note
All claims expressed in this article are solely those of the authors and do not necessarily represent those of their affiliated organizations, or those of the publisher, the editors, and the reviewers. Any product that may be evaluated in this article, or claim that may be made by its manufacturer, is not guaranteed or endorsed by the publisher.
References
Antras, P., Chor, D., Fally, T., and Hillberry, R. (2012). Measuring the upstreamness of production and trade flows. Am. Econ. Rev. 3, 412–416. doi:10.3386/w17819
Assamoi, G. R., Wang, S., Liu, Y., Gnangoin, T. B. Y., Kassi, D. F., and Edjoukou, A. J. R. (2020). Dynamics between participation in global value chains and carbon dioxide emissions: Empirical evidence for selected asian countries. Environ. Sci. Pollut. Res. 27, 16496–16506. doi:10.1007/s11356-020-08166-9
Bai, J. H., and Yu, X. W. (2022). The impact of global value chain embedding on energy conservation and emissions reduction:theory and empirical evidence. Finance&Trade Econ. 43, 144–159. (In Chinese). doi:10.19795/j.cnki.cn11-1166/f.20220606.008
Cai, L., Zhang, Z., and Zhu, L. (2020). Global value chain embeddedness and carbon dioxide emissions— An empirical study based on panel data of China’s industries. J. Int. Trade. 4, 86–104. (in chinese). doi:10.1016/j.scitotenv.2021.152587
CICC Research Institute (2021). Green finance development in the belt and road initiative from the perspective of supply and demand.
Cohen, W. M., and Levinthal, D. A. (1989). Innovation and learning: The two faces of R&D. Econ. J. 99, 569–596. doi:10.2307/2233763
Dai, F., Liu, R. X., Guo, H., and Du, X. (2020). How does intermediate consumption affect gvc positions? - a comparison between China and us. China Econ. Rev. 63, 101531. doi:10.1016/j.chieco.2020.101531
Duan, Y., Ji, T., and Yu, T. (2021). Reassessing pollution haven effect in global value chains. J. Clean. Prod. 284, 124705. doi:10.1016/j.jclepro.2020.124705
Feng, R., Gao, B. Y., Yan, J. Q., and Hu, Z. P. (2022). Spatiotemporal evolution of the global value position of manufacturing countries and areas: Research based on TiVA database. Geogr. Res. 41, 1054–1071. (In Chinese). doi:10.11821/dlyj020200310
Gereffi, G., and Lee, J. (2012). Why the world suddenly cares about global supply chains. J. Supply Chain Manag. 48, 24–32. doi:10.1111/j.1745-493X.2012.03271.x
Gereffi, G. (2010). “The global economy: Organization,governance and development,” in The handbook of economic sociology. Editors N. J. Smelser, and R. Swedberg (Princeton: Princeton University Press), 160–182. doi:10.1515/9781400835584.160
Ghisetti, C., and Quatraro, F. (2017). Green technologies and environmental productivity:A cross-sectoral analysis of direct and indirect effects in Italian regions. Ecol. Econ. 132, 1–13. doi:10.1016/j.ecolecon.2016.10.003
Humphrey, J., and Schmitz, H. (2001). Governance in global value chains. IDS Bull. 32, 19–29. doi:10.1111/j.1759-5436.2001.mp32003003.x
Jiang, X. M., and Liu, Y. F. (2018). Comparison of Economic Benefits and Environment Burden of High-Tech Export in China and U.S.A Global Value Chain Perspective. Manag. Rev. 30, 58–63. (In Chinese). doi:10.14120/j.cnki.cn11-5057/f.2018.05.007
Jin, Z. D., Duan, H. B., Wang, J. C., Yang, M., Guo, Y. H., and Cui, X. D. (2022). Heterogeneous impacts of GVCs participation on CO2 intensity: Evidence from developed and developing countries/regions. Advances in Climate Change Research 2, 187–195. doi:10.1016/j.accre.2022.01.002
Koopman, R., Wang, Z., Wei, S., and Powers, V. M. (2010). Give credit where credit is due:tracing value added in global producing chains. Cambridge: NBER Working Paper, 16426. doi:10.3386/w16426
Kordalska, A., and Olczyk, M. (2021). Linkages between services and manufacturing as a new channel for GVC development: Evidence from CEE countries. Struct. Chang. Econ. Dyn. 58, 125–137. doi:10.1016/j.strueco.2021.05.003
Kowalski, P., Gonzale, J. L., Ragoussis, A., and Ugarte, C. (2015). Participation of developing countries in global value chains. OECD Trade Policy Pap. 179, 170. doi:10.1787/18166873
Li, Y., Li, J. Y., Wang, W. H., and Huang, Q. B. (2021). Effect and mechanism of global value chain embedding on carbon emission efficiency. China Popul. Resour. Environ. 31, 15–26. (In Chinese). doi:10.12062/cpre.20201216
Liu, C., and Zhao, G. M. (2021). Can global value chain participation affect embodied carbon emission intensity? J. Clean. Prod. 287, 125069. doi:10.1016/j.jclepro.2020.125069
Liu, H. X., Li, J. L., Long, H. Y., Li, Z., and Le, C. (2018). Promoting energy and environmental efficiency within a positive feedback loop: Insights from global value chain. Energy Policy 121, 175–184. doi:10.1016/j.enpol.2018.06.024
Liu, H. Z., Zong, Z., Hynes, K., and Bruynec, K. D. (2020). Can China reduce the carbon emissions of its manufacturing exports by moving up the global value chain? Res. Int. Bus. Finance 51, 101101. doi:10.1016/j.ribaf.2019.101101
Lv, Y., and Lv, Y. L. (2019). The Environmental Effect of China’s Earticipation in Global Value Chain. China Popul. Resour. Environ. 29, 91–100. (In Chinese). doi:10.12062/cpre.20181019
Pan, A. (2017). The Effect of GVC Division on Carbon Emission Embodied in China’s Foreign Trade. Int. Econ. Trade Res. 33, 14–26. (In Chinese). doi:10.13687/j.cnki.gjjmts.2017.03.002
Qian, Z. L., Zhao, Y. H., Shi, Q. L., Zheng, L., Wang, S., and Zhu, J. Z. (2022). Global value chains participation and CO2 emissions in RCEP countries. J. Clean. Prod. 332, 130070. doi:10.1016/j.jclepro.2021.130070
Shi, Q. L., Zhao, Y. H., Qian, Z. L., Zheng, L., and Wang, S. (2022). Global value chains participation and carbon emissions: Evidence from Belt and Road countries. Appl. Energy 310, 118505. doi:10.1016/j.apenergy.2021.118505
Sun, C. W., Li, Z., Ma, T. M., and He, R. (2019). Carbon efficiency and international specialization position: Evidence from global value chain position index of manufacture. Energy Policy 128, 235–242. doi:10.1016/j.enpol.2018.12.058
Sun, H. P., and Du, X. M. (2020). The Impact of Global Value Chains’ Participation Degree and Position on Industrial Carbon Productivity. China Popul. Resour. Environ. 30, 27–37. (In Chinese). doi:10.12062/cpre.20200309
Tian, J. G., and Zhuang, G. Y. (2019). Influence of Global Value Chain Division on the Implied Carbon of Manufacturing Trade between China and Japan. J. China Univ. Geosciences(Social Sci. Ed. 19, 71–84. (In Chinese). doi:10.16493/j.cnki.42-1627/c.2019.02.007
Wang, Z., Wei, S. J., and Yu, X. (2017a). Characterizing global value chain:production length and upstreamness. Cambridge: NBER Working Paper, 23261. doi:10.3386/w23261
Wang, Z., Wei, S. J., Yu, X. D., and Zhu, K. (2017b). Measures of participation in global value chains and global business cycles. Cambridge: NBER working paper, 23222. doi:10.3386/w23222
Wang, J., Wan, G. H., and Wang, C. (2019). Participation in GVCs and CO2 emissions. Energy Econ. 84, 104561. doi:10.1016/j.eneco.2019.104561
Wang, S., Wang, X., and Tang, Y. (2020). Drivers of carbon emission transfer in China-an analysis of international trade from 2004 to 2011. Sci. Total Environ. 709, 135924. doi:10.1016/j.scitotenv.2019.135924
Wang, S. H., He, Y. Q., and Song, M. L. (2021). Global value chains, technological progress, and environmental pollution: Inequality towards developing countries. J. Environ. Manag. 277, 110999. doi:10.1016/j.jenvman.2020.110999
Wang, S., Wang, X. Q., and Chen, S. S. (2022a). Global value chains and carbon emission reduction in developing countries: Does industrial upgrading matter? Environ. Impact Assess. Rev. 97, 106895. doi:10.1016/j.eiar.2022.106895
Wang, S., Chen, H., and Yin, K. (2022b). The employment effect of Chinese industrial enterprises embedded in environmental cost-adjusted global value chains. Environ. Sci. Pollut. Res. 12, 18160–18176. doi:10.1007/s11356-021-17118-w
Xie, H. Q., Huang, L. Y., and Liu, D. D. (2018). Does the embedding of global value chain improve the carbon productivity of China's manufacturing industry? J. Int. Trade 12, 109–121. doi:10.13510/j.cnki.jit.2018.12.013
Xu, D. L., Yu, F. H., and Zhang, M. (2019). Can Global Value Chain Participation Promote the Low-carbon Total Factor Productivity of Industry in China. World Econ. Stud. 8, 60–72. (In Chinese). doi:10.13516/j.cnki.wes.2019.08.002
Yu, Y. Z., and Duan, S. L. (2022). Global Value Chain Embedding and Environmental Pollution: An Examination from 230 Prefecture-level Cities. China Econ. Rev. 2, 87–103. (In Chinese). doi:10.19361/j.er.2022.02.06
Zhang, H. X., Zhang, Z., and Sheng, K. R. (2018a). Effects of Global Value Chain Position on the Carbon Emissions of Manufacturing Industry in China: An Empirical Study Based on the STIRPAT Model. Meteorological Environ. Res. 9, 52–57. doi:10.19547/j.issn2152-3940.2018.05.014
Keywords: GVC embedding position, GVC embedding degree, carbon emissions, the Belt and Road, manufacturing
Citation: Huang H, Zhang Z and Jiang F (2022) Environmental effects of global value chain embedding in manufacturing industry in countries along the Belt and Road. Front. Environ. Sci. 10:1039358. doi: 10.3389/fenvs.2022.1039358
Received: 08 September 2022; Accepted: 30 September 2022;
Published: 14 October 2022.
Edited by:
Shuhong Wang, Shandong University of Finance and Economics, ChinaReviewed by:
Xiaoqing Wang, Ocean University of China, ChinaZhibo Zhao, Qilu University of Technology, China
Copyright © 2022 Huang, Zhang and Jiang. This is an open-access article distributed under the terms of the Creative Commons Attribution License (CC BY). The use, distribution or reproduction in other forums is permitted, provided the original author(s) and the copyright owner(s) are credited and that the original publication in this journal is cited, in accordance with accepted academic practice. No use, distribution or reproduction is permitted which does not comply with these terms.
*Correspondence: Zhengyu Zhang, emhhbmd6eUBjdWcuZWR1LmNu