
95% of researchers rate our articles as excellent or good
Learn more about the work of our research integrity team to safeguard the quality of each article we publish.
Find out more
ORIGINAL RESEARCH article
Front. Environ. Sci. , 03 October 2022
Sec. Conservation and Restoration Ecology
Volume 10 - 2022 | https://doi.org/10.3389/fenvs.2022.1038752
This article is part of the Research Topic Key Determinants of Biodiversity, Ecosystem Functioning and Restoration in Climate Change Sensitive Ecosystems View all 24 articles
 Wenfeng Gong1,2†
 Xuanyu Duan1,2†Mingjiang Mao1,2Jihan Hu1,2Yuxin Sun1,2Genghong Wu1,2Yangyang Zhang1,2Yidan Xie1,2Xincai Qiu1,2Xiaodong Rao1,2*
 Tiedong Liu1,2*Tao Liu3*
This study aims to evaluate the effects of the spatiotemporal patterns of land-use and land-cover (LULC) changes on the dynamics of carbon storage in a tropical region of China by linking the trajectory analysis of LULC changes and the InVEST model. Based on remote sensing (RS), geographic information system (GIS) and change trajectories, the spatiotemporal evolution of LULC changes was explored. This evolution could be coupled with the spatiotemporal LULC change trajectories and the InVEST model for the quantitative study of the spatial distribution and temporal variation in regional carbon stocks. The results showed that during the 2000–2020 period, the built-up land continually increased to 206.05 km2 through urban expansion, and forestland became the dominant type of land, with an area of 357.39 km2. In addition to the change in land use, the carbon storage in the study region increased by 4.87 Tg C. The anaphasic trajectory had the largest area ratio at 7.05% in the total area, while the prophasic trajectory contributed to the largest increase in carbon storage, 5.87 Tg C. Moreover, the repetitive trajectories had no impact on carbon sinks and sources, whereas the anaphasic trajectory and the continual trajectory imposed passive impacts on carbon storage. These advances in research underpin scientific efforts to improve the understanding of the relationship between the optimization of land-use structure and patterns and the carbon storage service in the Nandu River Basin.
Land-use and land-cover changes (LULCCs) are not only the most crucial link between human activities and the ecological environment but also the main factor affecting regional climate change (Liu et al., 2014). It is estimated that approximately 35% of the carbon emissions in the atmosphere have been the consequence of human activities since the industrial revolution (Houghton et al., 2012). Human activities have altered the original patterns, structures, processes and functions of terrestrial ecosystems through different land-use practices, resulting in serious damage to the land surface of the ecological environment, which directly or indirectly affects carbon storage and carbon-cycle processes in regional ecosystems (Zaehle et al., 2007; Gao and Wang, 2019; Zhang et al., 2021) and the process of regional climate change. Terrestrial ecosystems are an important source and sink of atmospheric greenhouse gases (Cui et al., 2019). Since carbon storage in terrestrial ecosystems is a significant component of global carbon storage, these ecosystems play an important role in mitigating global warming by reducing the concentrations of atmospheric CO2 and other greenhouse gases (Lal, 2004). The estimation of annual net carbon absorption by global terrestrial ecosystems ranges between 2000 Pg and 2,500 Pg, including 500 Pg to 600 Pg by vegetation and 1,500 Pg to 2,300 Pg by soil (Zhao et al., 2019; Liang X. et al., 2021; Liang Y. et al., 2021). It is widely recognized that terrestrial ecosystems, with a strong carbon absorption capacity, are one of the most economically feasible and ecologically friendly approaches to alleviate the impact of the greenhouse effect on the global climate (Zhu E.et al., 2019). The carbon absorption capacity of terrestrial ecosystems has become the focus of attention for governments and scholars worldwide (Schimel et al., 2001; Ji et al., 2008; Piao et al., 2009; Fang et al., 2015; Dai et al., 2016). Several factors, such as climate change, land-use change, and land management, interact to regulate soil carbon storage (Xia et al., 2010), among which land-use changes and land management measures are key factors influencing greenhouse gases and affecting carbon emissions (Smith and Conen, 2006). The Intergovernmental Panel on Climate Change (IPCC) report states that the contribution of LULCCs to the increase in atmospheric CO2 is expected to be only second to the combustion of fossil fuels in the future (Houghton, 2003; Foley et al., 2005). It is obvious that LULCCs, as one of the most important factors affecting soil carbon storage in terrestrial ecosystems, also dominate the spatiotemporal evolution of carbon sources and sinks (Houghton et al., 2000). Thus, a deep understanding of the impact of the spatiotemporal evolutionary characteristics of land-use patterns on regional carbon source and sink mechanisms is a prerequisite for reducing and managing carbon dioxide emissions (Hwang et al., 2021).
Estimating the effect of land-use changes on soil carbon storage depends on data sources and techniques (Leifeld, 2013). Assessing and analysing the spatial distribution and mechanisms of soil carbon sources/sinks is a major challenge faced by many researchers (Xu et al., 2011). At present, the methods for assessing regional carbon storage mainly include field surveys (Ren et al., 2011), remote sensing inversion (Lu et al., 2010; Fu et al., 2013) and model simulations (Sohl et al., 2012; Zhao et al., 2013). The field survey method mainly uses regional carbon density profiles of different vegetation and soil types to estimate carbon storage. Although it is relatively simple and accurate, field surveys are only suitable for small regions and have limited effectiveness in reflecting the dynamic changes in carbon storage at large regional scales (Huang et al., 2014). Remote sensing is a cost-effective and useful technique for both qualitative and quantitative analyses of LULC changes in terrestrial ecosystems using satellite imagery (Mayani-Parás et al., 2021). Additionally, time-series analysis of remote sensing data provides an excellent opportunity to understand and map LULCCs from small to large catchments (Abdullah et al., 2016; Yan et al., 2019). Hence, the remote sensing method has been broadly used for LULC change detection from small to large regions/catchments (Kuma et al., 2022). The model simulation method applies different models to simulate and estimate land use, among which the Integrated Valuation of Ecosystem Services and Tradeoffs (InVEST) model is widely used due to the advantages of simplicity, flexible parameters, and relatively accurate results. The approach of combining the GIS, RS and InVEST models has been extensively used by governments, companies and researchers to explore the simulation, prediction and assessment of the carbon storage of ecosystems and has been applied at different scales, such as regional (Chuai et al., 2014), national (Ni, 2013) and global (Nelson et al., 2010) scales. In particular, by combining the InVEST model with the land-use simulation model (CA-Markov, CLUe-S, etc.), some scholars have revealed the temporal and spatial variation characteristics of regional carbon storage at the watershed and urban scales in the past, predicted the trends in the future, and discussed the future scenarios of land-use and land-cover changes and their impact on regional ecosystem carbon storage (Li et al., 2020; Zhu et al., 2020; Liu et al., 2021).
According to the variation in ecosystem carbon storage patterns in different periods, most previous studies have indicated the influence mechanisms of LULCCs on regional carbon storage at different scales. However, it has been difficult to uncover the impact of the spatiotemporal evolution of land-use patterns on the dynamic processes of regional carbon storage patterns under the effect of comprehensive driving forces. In addition, there are still many uncertainties about the impact of land-use change on carbon balance and carbon intensity (Permpool et al., 2016). As a complementary methodology, the LULC change trajectory can dynamically track the spatiotemporal evolution of continuous and long-term land-use change processes in the same region (Zomlot et al., 2017). For example, Zhou et al. (2008) used multitemporal remotely sensed imagery to derive land-cover change trajectories to understand the spatiotemporal pattern of ecosystem dynamics. Similarly, Wang et al. (2012) proposed trajectory analysis as a new mathematical algorithm to explore the spatiotemporal analysis of land-use/cover change by using GIS and RS. The same approach was carried out by Wang et al. (2013) with high-resolution remote sensing imagery to monitor the spatiotemporal change of land use/cover by using pattern metrics of change trajectories in smaller scale valleys. Zomlot et al. (2017) used trajectory analysis as a preprocessing tool to identify LULC changes to improve spatiotemporal patterns and conduct impact assessments on groundwater recharge. However, there is still a gap in the exploration of the effects of spatial and temporal changes in land use on soil carbon storage at the regional scale, especially in the tropics. The tropics have a greater potential for reducing atmospheric CO2 (De Sousa-Neto et al., 2018), but no previous study has focused on matching the carbon density of the Nandu River Basin in the tropics over a long span, such as 30 years, to calculate the soil carbon storage caused by LULCCs. Furthermore, the study of trajectory analysis to quantify the impact of land-use change on soil carbon has not been applied in tropical areas at large scales. Therefore, it is necessary to quantify the effect of regional LULCCs on carbon storage by coupling InVEST models with spatiotemporal LULC change trajectories.
The Nandu River, as an important source of drinking water, is the largest river on Hainan Island and is known as the Mother River of Hainan Island, China. With the rapid socioeconomic development and the increasing population of the study region, agricultural water use has increased sharply, and the problem of agricultural nonpoint source pollution has become an urgent issue in the middle and lower reaches of the Nandu River (Liu et al., 2013). In addition, excessive discharge of domestic wastewater has seriously polluted the regional ecological environment, particularly in urban and rural areas. It was reported that the urban domestic sewage treatment rate in some areas was only 2.97% (Province, T.P.s.G.o.H., 2015), whereas rural domestic sewage was rarely treated. Some relevant studies have demonstrated that the water quality of the middle and lower reaches of this river belongs to the fifth type of surface water (Class V) (Liu et al., 2013), which is mainly applicable to agriculture and meets general landscape requirements. Moreover, indiscriminate and illegal mining is very prominent in some sections of the river, which has caused damage to the local ecological environment. Furthermore, the disturbance intensity in the natural ecosystem of the basin caused by human activities has been severe over the last decade. Together with an increased intensity of deforestation, grassland clearance and wetland reclamation for farmland expansion and the built-up land construction encroachment on farmlands and forestlands, this area has incurred significant changes to the LULCC pattern, which has increased the uncertainty of carbon sink functions across the Nandu River Basin. These changes will have a profound impact on the ecological environment of the study area in the future. Nevertheless, less research has been carried out on the relationship between land-use change and carbon storage services in this region. Therefore, we believe that it is necessary to quantify local regional carbon storage and fill in the gap in regional ecological environmental research.
This paper was based on land-use/cover data obtained from remote sensing image interpretation in 1990, 2005 and 2020, coupling the InVEST model with spatiotemporal LULC change trajectories to estimate the distribution of carbon storage, such that this research will provide meaningful resources for land-use managers. The primary objectives of our study include 1) using GIS and RS applications to investigate the spatiotemporal LULC change from 1990 to 2020 by using trajectory analysis; 2) linking the trajectory analysis and the InVEST models to map the carbon storage spatial distribution and exploring its spatiotemporal evolutionary tracking; 3) providing a new way to quantify the response mechanism of land-use dynamic processes on regional carbon source/sink effects; and 4) proposing some suggestions for implementing appropriate land-use policies to wisely control LULCCs to reduce carbon emissions (Zhu W.et al., 2019).
The Nandu River (located between 18° 56′ N and 20°05′ N latitude and 109°12′ E and 110°35′ E longitude) is the largest river on Hainan Island (Figure 1). Its main tributaries include the Longzhou River, Datang River, Yaozi River, etc. It originates from the Nanfeng Mountains in Baisha County and enters the Qiongzhou Strait in Haikou city, where it has a wide channel with many sandbanks, hills and shoals. Both banks of the river are flat platforms, most of which are cropland, covering a total area of 7,033 km2. The slope of the total terrain of the basin gradually decreases from south to north. The upper reaches of the river are high mountains and hills with large topographic fluctuations, while the slopes in the middle and lower reaches are gentle. The annual average temperature is 23.5°C, and the annual average precipitation is 1935 mm. The main soil types include mountain yellow soil, mountain lateritic soil, lateritic soil, sandy soil, paddy soil, etc. The river basin is rich in forest resources, with more than 1,200 species of coniferous broad-leaved trees and more than 700 species of arbor trees. Moreover, the plant resources in the basin are abundant and diverse. The vegetation type is mainly evergreen broad-leaved forest, with various tropical shrubs, vines, herbs and so on under the forest.
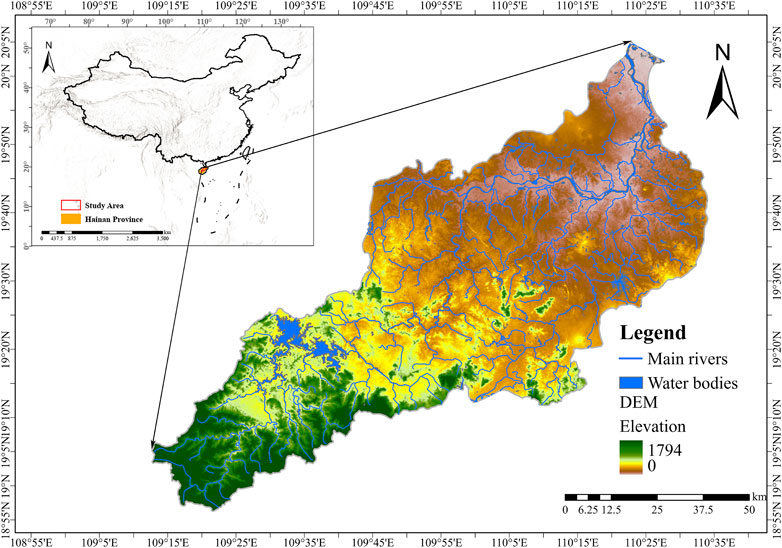
FIGURE 1. Location and elevation of the study area.
Landsat satellite images (5, ETM+, and 8) with Spectral Bands 3 (0.63–0.69 mm), 4 (0.77–0.90 mm) and 5 (1.55–1.75 mm) from Landsat TM5 and ETM+ and Bands 4 (0.64–0.67 mm), 5 (0.85–0.88 mm) and 6 (1.57–1.65 mm) from Landsat Imager OLI were used for 2000, 2010 and 2020 for LULCC mapping. All satellite images were obtained from the USGS (http://glovis.usgs.gov/). At the beginning, ENVI 5.5 software was employed to process all Landsat scenes, which were reprojected with WGS84/UTM Zone 49 N for geometry and resampled to a 30-m spatial resolution, followed by using the FLAASH (Fast Line-of-sight Atmospheric Analysis of Spectral Hyper cubes) module in ENVI 5.5 software for atmospheric correction. Next, all satellite images were composed using red‒green-blue (RGB) colour composition with Band 543 (Landsat TM5 and ETM+) and Band 654 (Landsat OLI). According to the classification criterion issued by the Ministry of Natural Resources of China and the current land-use situation, the land use of the study region was categorized into the following five groups: croplands, forestlands, grasslands, water bodies, and built-up areas. Training of classes was conducted using the data from field surveys, high-resolution Google Earth maps, and previous land-use maps. The support vector machines (SVM) algorithm in ENVI 5.5 was used to classify the images from 2000, 2010 and 2020. The second step was the accuracy assessment of classified images from 2000, 2010 and 2020. Ground truth points were taken from the high-resolution Google Earth maps and from field surveys with a simple GPS instrument for training and testing classified maps and their accuracy assessment. In addition, a confusion matrix was developed to evaluate the accuracy of the classified images from 1990, 2010 and 2020. The overall accuracy and Kappa coefficient are the two most extensively used accuracy assessment methods for classified images. The Kappa indices for all classes exceeded 0.75, with values of 0.813, 0.832 and 0.854, respectively. Finally, five classes for land-use and land-cover maps with a spatial resolution of 30 × 30 m were generated in Grid format with Arc Pro 2.8 (ESRI, United States), which were used to detect the dynamic tracking of the spatiotemporal evolution of broad land-use/land-cover areas in this region.
A change trajectory of a time series can be expressed by trajectory codes in all forms (e.g., in values or letters) for every pixel in the raster image (Wang et al., 2012). In this paper, the land-use types, croplands, forestlands, grasslands, water bodies, and built-up areas, were assigned the numeric codes 1, 2, 3, 4 and 5, respectively, which were used as trajectory codes for detecting the changes for each pixel at each time node through the three temporal slices, 2000, 2010 and 2020. The algebraic superposition of the trajectory analysis unit for LUTs was conducted in ArcPro 2.8. Trajectory codes for each land-use/cover object can be achieved by land-use/cover attribute calculation using the formula below (Wang et al., 2012).
where
In the calculation results, the trajectory analysis of the LULC map in this study was summarized into five types (Gong et al., 2015): 1) A numeric trajectory code in the form of xxx was treated as stable, such as 111, 222, 333 and so on, with all the same codes at each time node. This denotes those objects with no land-cover change from 1990 to 2020; 2) xyy was identified as prophasic, with 155 representing the change from cropland to built-up land in the second time and kept for in the third period; 3) xxy was recognized as anaphasic, with 112 referring to the cropland only converted to forestland in the third period; 4) xyx was defined as repetitive, with 121 demonstrating the changes from cropland to forestland only occurred in the second period while the initial and final land types were the same; and 5) xyz was seen as continual, with 123 suggesting the transition from cropland to forestland and grassland was continuous during the study period, while the initial and final land types were not the same.
In this study, the Carbon Storage and Sequestration module of the InVEST model was applied to estimate the amount of carbon stored in this area, which was divided into four basic carbon pools in terrestrial ecosystems, followed by aboveground carbon (AGC), belowground carbon (BGC), soil organic carbon (SOC, 0–20 cm) and dead organic carbon (DOC) in the present study (Zhao et al., 2019). In detail, AGC encompasses the branches, leaves, trunks, bark, and other living plant materials above the soil level, while BGC includes the living roots of AGC, the DOC comprising dead matter as well as litter and the SOC representing the organic components of soil. Additionally, the carbon storage of an ecosystem is calculated by multiplying the average carbon density of AGC, BGC, SOC and DOC of each land-use/cover type by their corresponding areas (Zhao et al., 2019). In this study, the LULC maps generated from the three periods, 2000, 2010 and 2020, were used as input maps, whereas the carbon density for all four carbon pools for each land-use and cover type was derived from the relevant scientific literature with similar conditions to those of the study area in the tropical region (Table 1).
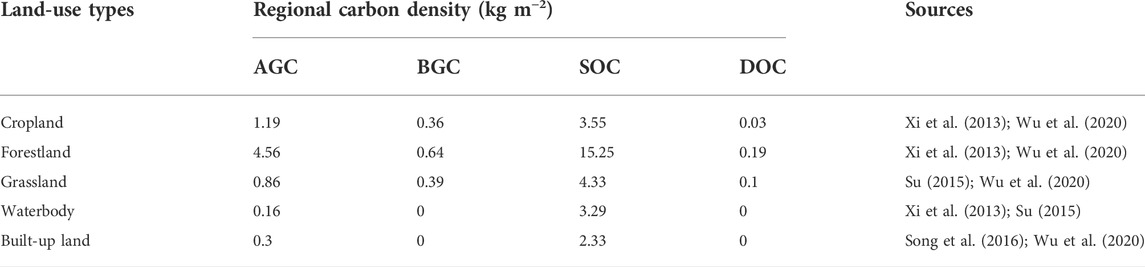
TABLE 1. Carbon density of each land-cover type in the study region.
Although the carbon density parameters represent data from a single time point, research has demonstrated that the effects of LUCCs on carbon storage changes can be evaluated well even if the changes in carbon density are ignored (Zhu W.et al., 2019; Li et al., 2021). Using the InVEST model, the calculation formulas for carbon storage estimation are as follows (Li et al., 2021):
where
To determine the direction of changes in land use and land cover in this study (Table 2), five classes covering a total area of 7,083.63 km2 were represented in different colours. The results indicated that forestland was the dominant land-use type, accounting for 63.08, 71.08, and 68.13% of the total area, respectively, during each study period and spreading all over the study region. In 2000, the estimated forestland area was 4,468.34 km2, whereas in 2010 and 2020, it was 5,034.76 km2 and 4,825.73 km2, respectively. It represented an upwards trend in the earlier period and a downwards trend in recent times. As the second largest land-use type, cropland played a subsidiary role in the study region, which was mainly distributed in the northeastern region, accounting for 29.97, 24.70 and 23.84% of the total area during the study periods, respectively. Its proportion in the total area presented a downwards trend all the time, possibly due to the implementation of the Grain for Green Program (GGP) by the Chinese government, implemented after 1999, in which a certain proportion of cropland has been abandoned and converted to other land-use types, especially in southwestern mountain areas and northern coastal areas of the study area. As a result, the proportion of cropland decreased to 6.13% from 2000 to 2020. Built-up land was mainly distributed in the northern coastal and northeastern plain areas. It accounted for only 1.36, 1.50 and 4.27% of the total area, respectively, showing a continual upwards trend from 2000 to 2020. The growth of built-up land was mainly observed in the northern coastal areas of Haikou city, the capital of China’s largest special economic zone on Hainan Island. The urban areas expanded to 203.7 km2 in 2020, approximately 6 times the area of 34 km2 in 2000. Compared with that in 2000, the spatial distribution of urban areas sharply changed, driven by advancements in modern tropical agriculture, the mass tourism industry and rapid economic development. The proportion of water bodies increased by 0.53% from 2000 to 2020, experiencing a minimal change in spatial distribution, while grassland decreased by 2.36% during the study period, which was mainly observed in the southern mountain region.
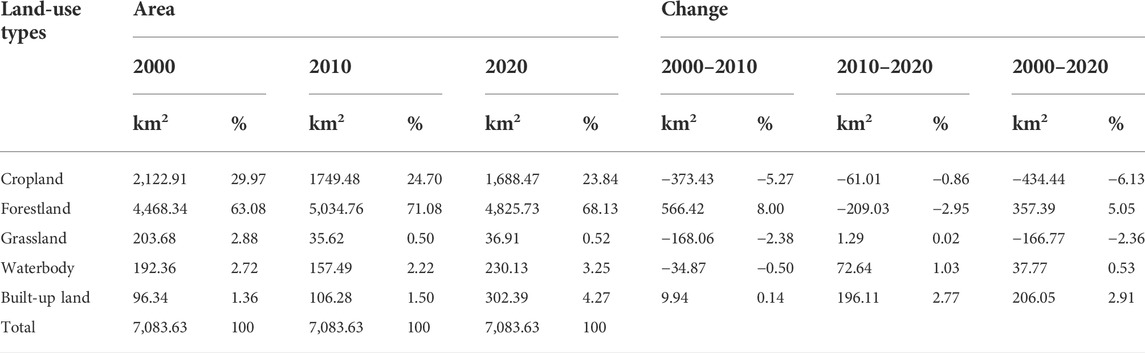
TABLE 2. LULC area coverage and changes between 2000, 2010 and 2020.
Based on the spatiotemporal trajectory calculation, all distribution trajectory maps for the three LULC maps (2000, 2010, and 2020) in the study area are presented in Figure 2. A total of 104 trajectories were identified, among which 99 trajectories varied with time, associated with 16.77% of the total area, whereas the remaining 5 trajectories were trajectories with no land-use changes, accounting for 83.23% of the study area with 59.22% covered forestland (Table 3).
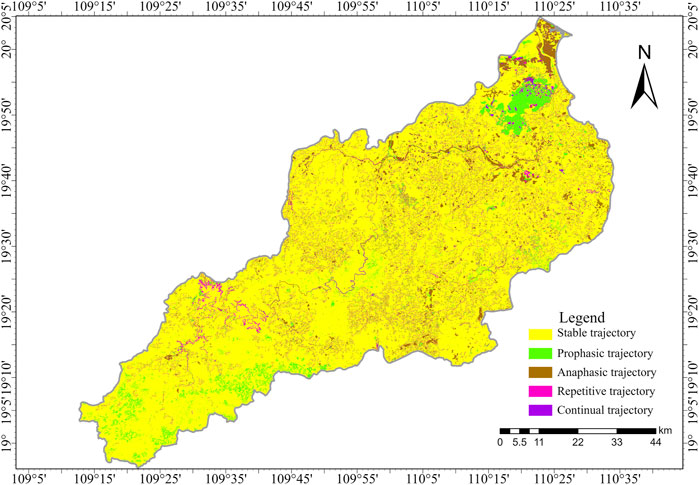
FIGURE 2. Land-use/land-cover change trajectory map of the Nandu River Basin (2000–2020).
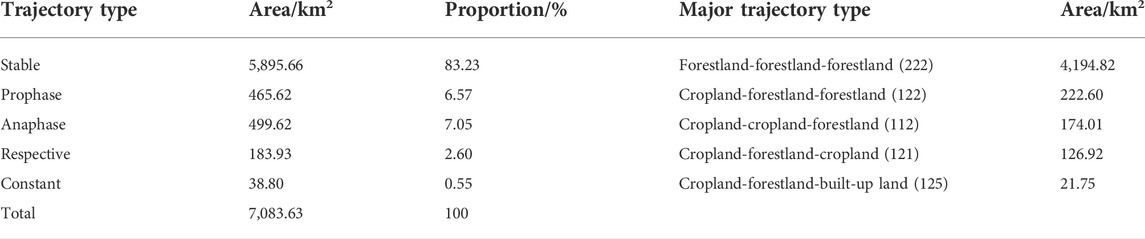
TABLE 3. Trajectory analysis of land-use/land-cover change in the study region.
In all change trajectories of the whole area, the anaphasic trajectory occupied the largest area ratio at 7.05% of the total area. The most obvious changes in the anaphasic trajectory were Trajectories 112 and 225, accounting for 34.83 and 22.57% of the total converted land-use types in the anaphasic transition, ranking first and second in the lands with anaphasic trajectories, respectively. While the transformation from cropland to forestland in Trajectory 112 was due to the implementation of GCP, Trajectory 225 mostly occurred in Haikou Jiangdong New Area, which was determined by the Hainan Provincial Government as the main undertaker and the pioneer for the free-trade port policies since 2019. With the construction of the Hainan Free Trade Port, more land was needed for urbanization, and deforestation continued. Moreover, Trajectories 115 and 551 accounted for 12.40 and 0.56% of the total area of the anaphasic transition types, respectively. As they were widely distributed around the suburban area and the urban agglomerations, it implied that a large area of cropland was occupied by built-up land and that only a small proportion of built-up land was compensated by land reclamation.
The area of the prophasic trajectory was 465.62 km2, the second largest in all land-use change trajectory types, accounting for 6.57% of the total area during this period. In particular, Trajectory Types 122 and 322 were the major prophasic transition types, accounting for 47.81 and 37.12% of the total area of the prophasic trajectory type, respectively. The transition areas of 211 and 233 were only 0.48 and 5.82 km2, respectively, indicating a large imbalance between forestland, cropland and grassland. Trajectory 122 was closely related to the implementation of forestry ecological policy and readjustment of the local industrial structure, in which a fraction of cropland was converted to forestland. Trajectory 322 indicated that a large area of grassland was occupied by forestland due to economic profits, especially for the extensive planting of fast-growing tree species, such as Eucalyptus and Acacia.
The area of repetitive transition was 183.93 km2, accounting for 2.6% of the total area, while the areas of Trajectories 121, 424, and 232 were evidently higher than those of the other repetitive trajectory types, each accounting for 126.92, 30.0, and 7.07 km2, respectively. Trajectory 121 was the dominant repetitive trajectory type, accounting for 69.01% of the total area in the repetitive trajectory, suggesting that the mutual transition between cropland and forestland was frequent under the context of economic interests and land-protection policies.
The percentage of the continual trajectory type was 0.55%, which was the smallest among all transition types. Among the continual trajectory types, Trajectory 125 was dominant and accounted for 56.04% of the total area, followed by Trajectories 324 and 124 with proportions of 10.34 and 8.36%, respectively. Trajectory 125 occurred in the suburb of Haikou city as an economic development zone, indicating that the transition from cropland to forestland and built-up land was very common in the context of fast-growing urbanization and forestry ecological policy.
Over the past 2 decades, the total carbon storage increased from 105.19 Tg C (1 Tg = 1012 g) in 2000 to 113.92 Tg C in 2010, followed by a decline from 113.92 Tg C in 2010 to 110.06 in 2020 (Table 4). Although it showed an upwards trend followed by a downwards trend, the change was not significant, with only a net increase in carbon storage of 4.87 Tg C and an average annual increasing rate of 0.2316% in the whole study region. Among the four carbon pools during the study period, SOC was dominant and accounted for 73.60, 73.66 and 73.78% of the total carbon storage in 2000, 2010 and 2020, respectively. AGC was the second most significant, accounting for 22.00, 22.06 and 21.96% of the total carbon storage across the whole region in each period, respectively. DOC occupied the lowest proportion of the total area, with an approximate carbon storage of 0.93 Tg C, 1.01 Tg C and 0.97 Tg C during the study period, respectively. Spatially, the carbon density in the southern part of the mountain region was greater than that in the northern part (Figures 3A,B,C). This trend was evident in all three periods because most forestland was widely distributed in the southern mountain region of the study area and had significantly high carbon stocks due to robust photosynthesis. In addition, the southern mountain region is located in the National Park of Hainan Tropical Rainforest, where forestland (tropical rainforest) has been strictly protected and there is almost no human disturbance due to the strict implementation of the Natural Forest Protection Project (NFPP) by the Chinese government.
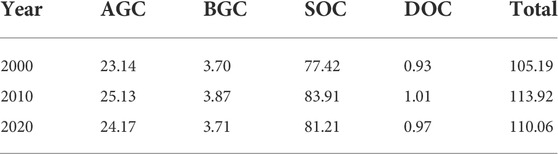
TABLE 4. Total carbon storage of different carbon pools in 2000, 2010 and 2020 in the study region (Tg).
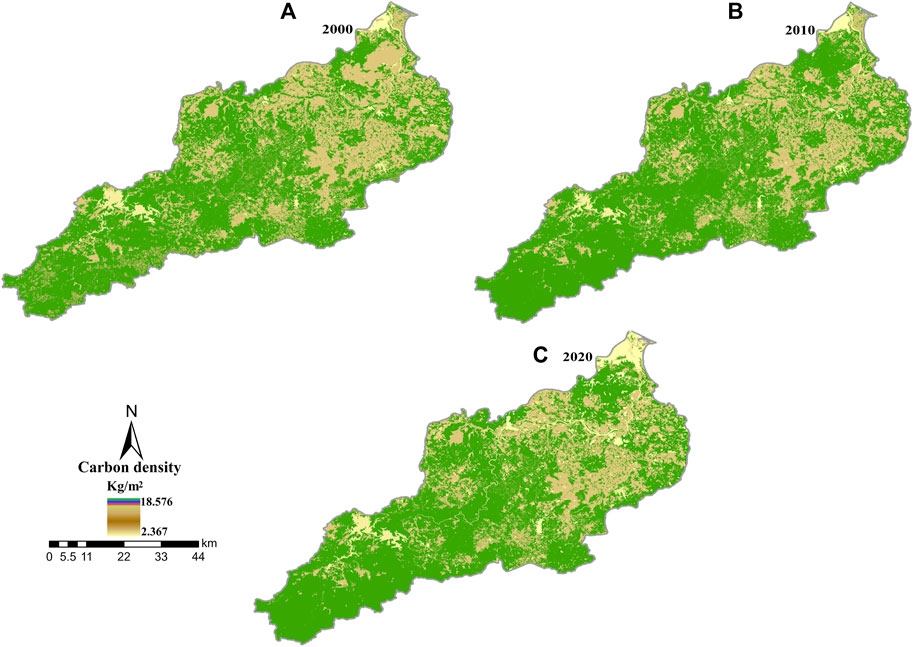
FIGURE 3. The spatial distribution of total carbon density in 2000, 2010 and 2020 (A–C).
Figures 4A,B,C shows the spatial changes in carbon density from 2000 to 2020. Generally, the carbon-emission areas for LULC in the study region showed an increase, which was mainly distributed in industrial parks close to the coastal zone and the economic area along the Nan Du River. While the carbon sink areas spread across the whole study region during the study period, they were largely concentrated in the southern mountain region. The total areas of carbon emissions and carbon sinks were approximately 5.25 and 8.93%, respectively, during the whole study period (Table 5), with 85.82% of this area undergoing no change between 2000 and 2020. The change in carbon emissions from land-use conversion between 2000 and 2020 was 4.66 Tg C, whereas the change in carbon sinks from LULC was 9.53 Tg C. To some extent, this indicates that the carbon sequestration capacity caused by land-use changes is much more significant than the carbon-emission capacity in this study region. Due to the expansion of forestland and grassland areas for the implementation of the GCP during the study period, the changes in total carbon storage suggest that the land-use and land-cover changes between 2000 and 2020 led to a net increase in carbon by 4.87 Tg C. During 2000–2010, the percentage of carbon emissions was only 0.86% of the total area in this study region, 7.07% between 2010 and 2020, which was 8.22 times higher than that during 2000–2010, showing that the spatial distribution of carbon-emission areas was more dispersive than that in the first stage. While the carbon sink areas accounted for 8.86 and 3.13% in the first and second stages, respectively, they were more spatially scattered in the first stages. The total area of no carbon changes between 2000 and 2010 was approximately 90.28 and 89.80%, respectively, which was dominant in the study area and showed a similar spatial distribution pattern during both stages in the study period.
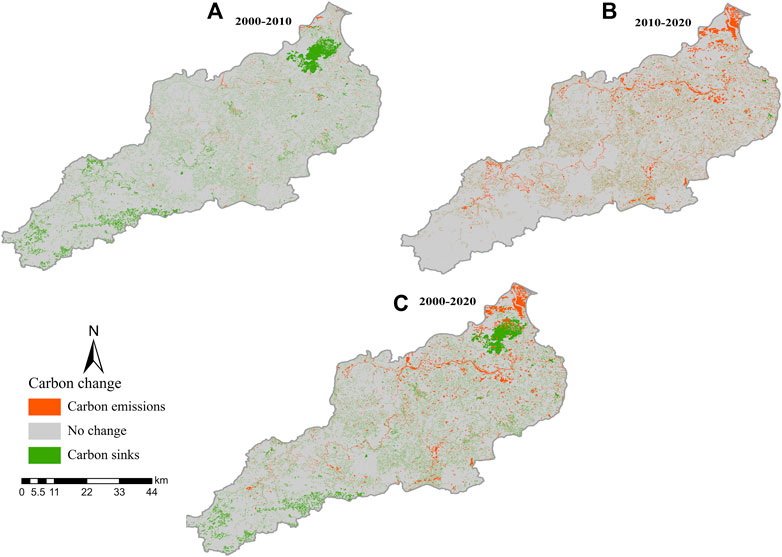
FIGURE 4. Spatiotemporal carbon change between 2000, 2010 and 2020 in the study region (A–C).
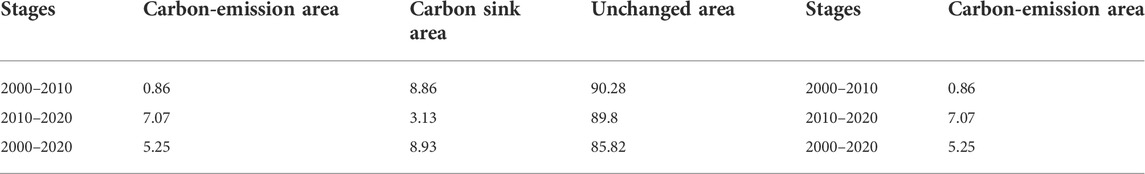
TABLE 5. Area percentages of carbon density changes in the study region (%).
The results in land-use/cover conversion directly led to the great changes in large carbon sinks and carbon sources. Land use change will change the amount of plant residues entering soil, affect the decomposition and loss of soil organic carbon, break the balance of soil organic carbon, and change the soil carbon density. Land use change will lead to the transfer of vegetation carbon, part of vegetation carbon stays in place in the form of dead branches and leaves, enters the soil and is transformed into soil organic carbon, and the other part of vegetation carbon is used and removed in different ways, and finally enters the atmosphere, which changes the vegetation carbon density. Due to the difference of land transfer area and carbon density, the change of land use types has different effects on carbon storage. In particular, built-up expansion areas affect not only the carbon-emission intensity of human activities but also carbon sinks within terrestrial ecosystems (Hergoualc’h and Verchot, 2013; Tubiello et al., 2015). Therefore, combining the spatiotemporal trajectory of LULC changes with InVEST models, this study aimed to analyse the effects of LULC on carbon storage in the Nandu River watershed in the tropical region of Hainan Island. The following discussion focuses on the effects of land-trajectory analysis on carbon storage.
The results obtained with the InVEST model revealed that the conversion of LULC classes resulted in an increase in carbon storage in the first stages (2000–2010). The total carbon stock estimated for the land-use pattern in the study area in 2000 amounted to 105.19 Tg C, which increased by 113.92 Tg C in 2010, with a net increase in the total carbon storage of 8.73 Tg C and an annual increase of approximately 0.873 Tg C (Table 3).
From the land-use conversion matrix (Table 6), the area that underwent land-use change in the study region was 688.53 km2, accounting for 9.72% of the total land. Conversions between cropland and forestland were the major transition during this stage, accounting for 54.64% of the total land change, as 374.98 km2 of cropland was converted to forestland, and 1.26 km2 of forestland was transformed into cropland. The benefits of afforestation do not balance out the negative effects of deforestation in this stage. Conversion from cropland to forestland was mostly distributed in the northern part of the study region, which created the largest net carbon storage, 5.82 Tg C, in the study region as a direct result of the GGP, suggesting that afforestation and recovery of forestland had positive effects on carbon sequestration due to its greater carbon density (Krogh et al., 2003; Wang et al., 2020). However, under the impacts of local urbanization and industrialization and industrial restructuring, especially the development of high-efficiency tropical agriculture and the development of international tourism on Hainan Island that expanded rural people’s economic prospects beyond farming, an increasing number of farmers are migrating into urban areas for nonfarm employment opportunities. The remaining farmers are primarily elderly people and women with relatively low labour capacity (Li et al., 2014). Our results showed that a certain amount of cropland was converted into forestland for fast-growing timber plantations, rubber plantations, and betel-nut plantations, especially in the plain region, as a direct result of the declining relative profitability of traditional farming businesses (Yan et al., 2016). This transformation in land use will undermine national food security for China in the future. Driven by local economic interests or industrial restructuring, the development from grassland to forestland accounted for 180.54 km2, which was the second largest transition area with a net carbon storage of 2.70 Tg C. The conversion from water bodies to forestland comprised the third largest area on the trajectory maps, covering an area of 51.59 km2 and creating 0.89 Tg C.
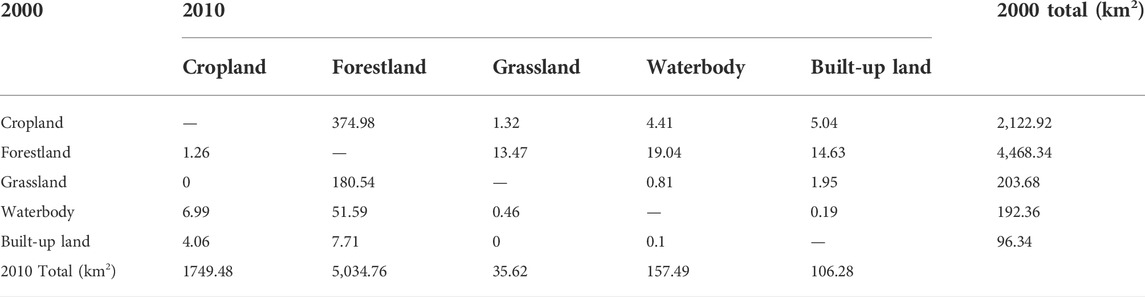
TABLE 6. Land-use conversion matrix from 2000 to 2010 (in km2).
The shift from forestland to water bodies covered 19.04 km2, the largest area for the passive impacts on carbon storage, with a total loss of 0.89 Tg C. This indicated that the contribution of water bodies to carbon storage was far less than that of forestland. In addition, interchanges between forestland and built-up land were also observed during the study period. The transformation from forestland to built-up land was another important trajectory for carbon emissions, accounting for 2.13% of the total change area. With rapid economic development and urbanization, the expansion of built-up land occurred in the economic development zone or new urban development zone (Chen et al., 2020). A significant fraction of land was needed for built-up construction, thereby resulting in deforestation and a 0.26 Tg C decrease in regional carbon storage. Moreover, 13.47 km2 of forestland was estimated to have converted to grassland, causing a 0.20 Tg C decrease in carbon storage.
Specifically, during the 2010–2020 period, the spatial distribution of the trajectory in the study region exhibited significant differences (Figure 5).
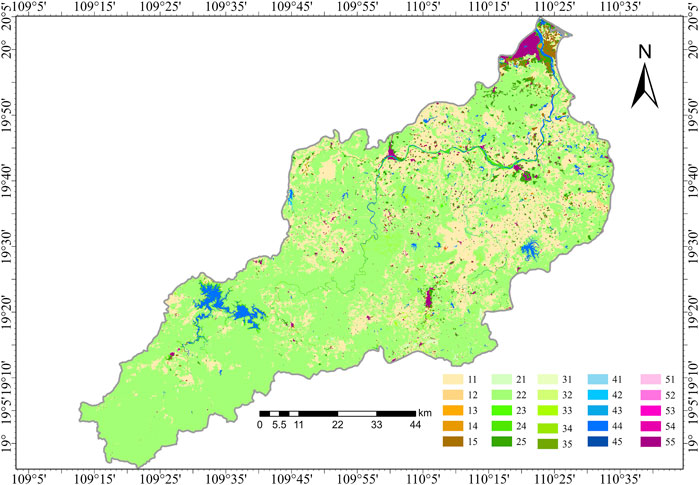
FIGURE 5. Land-use/land-cover change trajectory map of the study region from 2010 to 2020.
The most obvious changes in trajectory units were the conversion from forestland to cropland and its reverse, accounting for 25.06 and 24.17% of the total converted land-use types, occupying the largest and the second largest areas of total land changes, respectively. With the implementation of the GCP, 175.25 km2 of cropland was estimated to be converted to forestland, causing a 2.72 Tg C increase in carbon storage. However, under the influence of local industrial policy, especially with the emphasis on returning Eucalyptus to sugarcane or cropland, 181.65 km2 of forestland was converted to cropland, resulting in a total loss of 2.82 Tg C of carbon storage, while these conversions were estimated to lead to a slight decrease in carbon storage of 0.10 Tg C.
Correspondingly, with the acceleration of urbanization and the expansion of urban areas, carbon storage in the transformation from forestland to built-up land showed a significant decreasing trend, with 140.97 km2 of forestland estimated to be converted into built-up land. This trajectory was the third largest change area of trajectory types and the main source of decrease in carbon storage by 2.54 Tg C. On the other hand, only 6.49 km2 of built-up land was estimated to be converted to forestland, resulting in a total increase of 0.12 Tg C. The trajectory change from forestland to built-up land was mostly distributed in Jiangdong New Area, mainly composed of Guilinyang Economic Development Zone and Lingshan Town. Since 2018, the Chinese government announced that Hainan will be built into the largest free-trade port in the world, taking up an area of 3.5 × 10⁴ km2, especially for international tourism, consumption, and investment centres in the future. Under the guidance of major national policies and strategies and the Free Trade Island policy of Hainan Island, Hainan fully launched the construction of the pilot FTZ (Free Trade Zone) and made significant progress in infrastructure development, including key industrial parks, new development zones, and property booms in coastal areas. The planted forest near the coastal region or along the Nandu River was converted into built-up land. Although the local government launched a strict policy of forestland replacement and implemented forest ecological protection measures, a vast amount of land was needed for urbanization, and local deforestation still occurred (Zhu E.et al., 2019).
The trajectory type of cropland transformed to built-up land was also noteworthy, accounting for 8.85% of the total land types that were converted, which was mostly distributed around the major townships on the plains and along the Nandu River. The trajectories resulted in a decrease in carbon storage of 0.16 Tg C, with carbon losses mainly caused by the loss of cropland with high SOC content (Zhu E.et al., 2019). In contrast, only 6.49 km2 of built-up land was reclaimed as cropland, accounting for 0.90% of the total land-use types that were converted, indicating a severe imbalance in cropland that was created and destroyed. Moreover, the transitions between cropland and built-up land were relatively concentrated (Figure 3). Therefore, how to coordinate ecological protection and rapid economic development is a major challenge that this basin or even all of Hainan Island will face in the future.
Additionally, ‘‘forestland → water body” was another important trajectory type, with an area of 79.92 km2. This is mainly due to the increase of water body area, and the rising water level leads to part of forestland being covered by water body, mainly concentrated in the reservoir in the study area. While 12.61 km2 of water bodies was converted to forestland, the conversions between water bodies and forestland were estimated to lead to a net total loss of carbon storage of 1.16 Tg C, partly due to the relatively higher carbon storage capacity of forestland compared with water bodies (Pagiola, 2008). The transition between forestland and grassland exhibited a relative balance, and the trajectory units of “grassland → forestland” and “forestland → grassland” accounted for 16.70 and 18.67 km2, respectively, resulting in a net decrease in regional carbon storage by only 0.03 Tg C. The decrease is mainly attributed to the diminished forestland, by 1.97 km2, and grassland has a lower storage capacity than forestland.
Specifically, during the 2000–2020 period, enormous LULC changes were observed in the trajectory analysis of regional carbon sources and sinks in the Nandu River watershed (Figure 6).
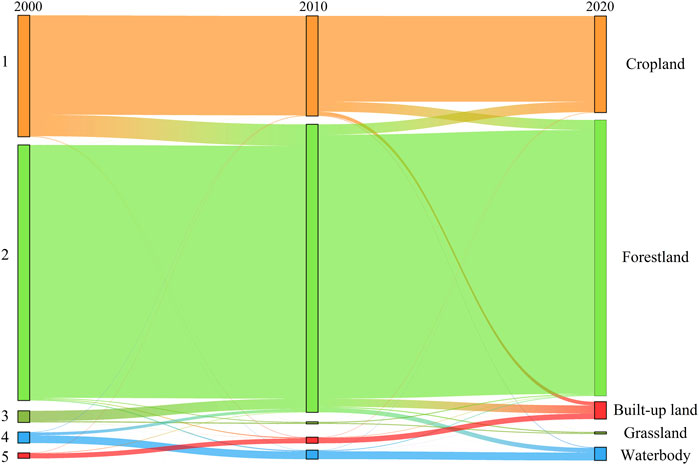
FIGURE 6. Land-use change trajectory of the Nandu River watershed from 2000 to 2020.
The prophasic trajectory was the major carbon storage sink in the study region, causing a 5.87 Tg C net increase in carbon storage, with a mean accumulation of 0.29 Tg C per year. The most obvious trajectory in the prophasic trajectory was Trajectory 122, which was mainly distributed in the northern region of the suburban area around Haikou city and was the main source of the increase in carbon storage, the contribution rate is 58.77% (3.45 Tg C). As the second significant factor, Trajectory 322 resulted in a total increase of 2.59 Tg C of carbon storage, contributing 44.12% of the increase. Trajectories 122 and 322 led to an increase in carbon storage due to the expansion of forestland and grassland areas with higher carbon storage capabilities. These results were similar to the findings of Zhang et al. (2010) and Lu et al. (2018). On the one hand, local carbon storage was expected to increase under the implementation of the Grain to Green Program (GGP). On the other hand, as a result of the vigorous development of construction driven by urban expansion, tropical ecotourism development and the construction of the international free-trade islands on Hainan Island, especially in Haikou city, the expansion of the urban area has been developing at an am azing speed, with an annual change rate of 16.46% from 1990 to 2020. In addition, the local government implemented a series of policies and measures to develop the economy, such as coastal ecotourism, tropical high-efficiency agriculture, intensive and productive industrial zones, free-trade zones and free-trade port construction, which accelerated the migration flows from rural to urban areas (Yan et al., 2016). The official data showed that the population of Haikou increased from 150.83 × 10⁴ in 2000 to 287.33 × 10⁴ in 2020, with an increase of 136.50 × 10⁴ during the study period (http://stats.hainan.gov.cn/tjj/). With an annual population growth rate of 6.23%, rural‒urban labour migration from rural areas was a major cause of the abandonment of cropland and rural settlement, leading to the ‘‘hollow village” phenomenon in rural areas. In addition to population flow, a fraction of cropland was converted to forestland for tropical economic forests or tropical fast-growing timber forests. Zhang et al. (2014) indicated that under the effects of local economic development, China has experienced land abandonment in recent years. The results showed that the changes in regional carbon sink capacity lie in the imbalance between regional economic development and industrial restructuring. Similar situations were reported by Jerath et al. (2016). Therefore, it is very important to coordinate the future processes of urbanization, industrial restructuring and food security in the study region. Trajectory 255 in the prophasic trajectories caused the largest total loss (0.23 Tg C) of carbon storage. In these areas, large tracts of forestland were developed into built-up land and thus caused carbon storage loss from the SOC stock (Zhu E.et al., 2019). The results showed that the change in land use/cover from natural lands to built-up areas led to remarkable carbon emissions. Trajectory 244 was estimated to lead to a second major decrease in carbon storage of 0.22 Tg.
In summary, the net carbon emissions for the anaphasic trajectory in the study region were 0.23 Tg C. Trajectory 112 was the main carbon sink, boosting carbon storage by 2.70 Tg C, followed by Trajectory 332, with an increase in carbon storage of 0.14 Tg C. Trajectory 112 was mainly distributed in the southern mountain region and northern plain region. While the situation of Trajectory 112 in the northern plain region was similar to that of Trajectory 122 in the prophasic trajectory, Trajectory 112 in the southern mountain region mostly occurred in the National Park of Hainan Tropical Rainforest, indicating that the Grain to Green Program has been strictly implemented in the region with an expected increase in regional carbon storage in the form of a local carbon sink. Trajectory 225 caused a considerable amount of carbon losses, 2.03 Tg C, which was mainly distributed in the New Development Area in the coastal region. Due to the special natural tourism resources and the excellent environment, the construction of the Hainan International Island occurred in 2008, and many more people have come to Hainan Island for tourism or to make a living, especially those from the notrtheastern region of China. According to official statistics, the total number of tourists and tourism revenue in Hainan reached 8.07 million and 37.75 billion yuan (RMB) in 2020, 2.4 times and 4.3 times the data in 2000, respectively. Currently, the tourism economy has become an essential engine of economic growth for this area (Cui et al., 2019). The total income of tourism accounts for over 12% of the region’s GDP. The booms in the tourism industry have promoted the real estate industry in the region. As a consequence, the construction of seascape housing and the expansion of built-up areas not only occupied the coastal region but also destroyed forestland, especially the coastal protective forest, and expanded onto the beaches and led to corresponding carbon storage losses. Our results showed that human settlements had a great impact on carbon storage losses in the study area. A similar result of increasing carbon emissions in the region was reported by Cai et al. (2018). Although the Chinese government has launched environmental inspections to protect the ecological environment since 2016, illegal land conversion, such as illegal reclamation, deforestation, and wetland destruction, still occurred in some parts of the study region. Therefore, coordinating the complex relationship between LULCCs and carbon sinks and sources is the key point of implementing the optimized local land-use structure. Trajectory 221 experienced the second largest carbon storage loss, 0.81 Tg C, which was due to deforestation for reclamation.
In general, the change of carbon sink capacity is closely related to the change of LULC, and the government needs to regulate carbon storage by macro-regulating LULC change. After 2020, the construction of Hainan Free Trade Port will enter the stage of full implementation and development. In the future, the intensity and direction of land use development should be conducive to the increase of regional carbon storage, explore ways to optimize the land use structure with the goal of carbon balance, and strengthen reasonable control over the expansion of construction land. Decision-makers can take a series of land use control measures such as increasing the proportion of forestland, strengthen the transformation of construction land and unused land into forestland and grassland through reclamation and greening of construction land and restoration of ecological land, and continue to implement ecological transformation projects such as returning farmland to forest and grassland. Meanwhile, the government can strengthen the ecological protection of coastal wetlands and other wetlands, strengthen the protection and restoration of degraded forestland, grassland and wetlands, and realize the land use regulation of regional low-carbon construction and ecological environmental protection.
The repetitive trajectories had no impact on carbon sinks and sources. The contribution to carbon storage for the continual trajectory type was insignificant. The total carbon storage of the repetitive trajectory was estimated to decrease by only 0.075 Tg C. Trajectory 125 in the continual trajectory was the main carbon source, with carbon storage losses of 0.054 Tg C, followed by Trajectory 215, which resulted in a total loss of 0.0133 Tg C of carbon storage, accounting for 72.00% and 17.73% of the total reduction, respectively. The results showed that carbon emissions in the continual trajectory were the primary carbon sources in built-up areas, which was mainly ascribed to human activities. In 2018, the Chinese government announced to the world the establishment of the world’s largest free-trade port on Hainan Island. With the implementation of national and local policies, the urbanization process of Hainan International Free Trade Island has accelerated, leading to intensive population expansion, profound regional economic development, unbalanced rapid economic development and regional industrial restructuring. These forces were the root cause of changes in regional LULC patterns, which ultimately affected the capacity of carbon sources and carbon sinks (Cui et al., 2019). The results of the study showed that the carbon sink capacity of economically developed regions with intensive land use declined and became the new significant carbon source area. Therefore, further exploring the complex relationship between LULCCs and carbon sinks and sources is the key to optimizing land-use structure and patterns. Trajectory 412 in the continual trajectory was the largest carbon sink, with an increase in carbon storage of 0.015 Tg C, followed by Trajectory 512, causing 0.007 Tg C of increased carbon storage.
This study assessed the impact of land-use changes on regional carbon sources and sinks utilizing remote sensing and GIS modelling combined with the InVEST model. Additionally, we improved previous studies by revealing the response mechanisms of land-use dynamic processes on regional carbon sources/sinks by linking trajectory analysis and the InVEST models. Although more effects of spatiotemporal trajectory analysis in LULC change on carbon storage in the Nandu River Basin were examined from 2000 to 2020, this study is still limited in a few aspects. Due to the lack of accurate and long-term ground observation data of carbon density in these land covers during each period, this study could only obtain the approximate carbon storage values during the different periods and suffered the risk of reduced accuracy in the assessment of carbon stocks. However, the overall spatial pattern of carbon storage was not affected. Second, the carbon module of the InVEST model simplified the process of the carbon cycle to a certain extent (Chen et al., 2017) by assuming that the carbon density was homogeneous with constant values and focusing on the difference in carbon density between different land-use types. Additionally, without considering the dynamic changes in carbon density for the same land-use type along with the change in environment and time, the estimated results of carbon stock could be uncertain. Therefore, for future research, to obtain more accurate carbon storage values in these land covers in the study region during each period, it will be increasingly necessary to collect accurate carbon density data through long-term observations and large-scale experiments. There is a need to timely supplement the influence of spatial heterogeneity within land-use types and vegetation age structure on carbon density by using more field data.
This study demonstrated a change trajectory methodology to identify the spatiotemporal evolutionary tracking of land-use/land-cover (LULC) changes. The change trajectories and the InVEST models were linked to determine the spatiotemporal dynamics of carbon storage and investigate the impact of land-use change on carbon storage in the Nandu River Basin on Hainan Island in China, the world’s largest free-trade island.
Between 2000 and 2020, forestland showed the largest growth, 357.39 km2, followed by the continuous expansion of built-up land by almost 206.05 km2, with an annual rate of 24.96%. Urbanization was accompanied by an increase of approximately 4.87 Tg C of carbon storage in the study region. In contrast, the areas of cropland and grassland declined continuously by 434.44 and 166.77 km2, respectively. The anaphasic trajectory had the largest area fraction, 7.05%, in the total area, whereas the proportion of the continual trajectory was the smallest among all transition types at 0.55%. During the two time spans from 2000–2010 to 2010–2020, the spatiotemporal trajectories for land-use changes significantly contributed to carbon sequestration in the study region through the conversion from cropland to forestland, causing 5.82 Tg C and 2.72 Tg C in carbon storage, respectively. In the trajectory analysis of LULCCs over the whole period, the prophasic trajectories were the major contributor to carbon storage sinks in the study region, resulting in a rise in carbon storage by 5.87 Tg C, while the repetitive trajectories had no impact on carbon sinks and sources.
The findings in this study provide a new way to identify the spatiotemporal patterns of LULC changes by using trajectory analysis as a preprocessing tool. The new methods could be revised for assessing the impact of trajectory analysis for land-use changes on the change in carbon storage by coupling the Invest Model and trajectory analysis in other study areas.
The original contributions presented in the study are included in the article/Supplementary Material, further inquiries can be directed to the corresponding authors.
XR and TaL designed the research. WG, TiL, XD, and XQ performed the research and wrote the manuscript. GW, MM, JH, YS, YZ, YX, and GW analyzed the data and provided the basics for the optimization of the figure. All authors contributed to the article and approved the submitted version.
This research was supported by Hainan Provincial Natural Science Foundation of China, grant number 320RC506, 621RC507 and 421MS013; Hainan Ecological Environment Monitoring Project of China Meteorological Administration, grant number ZQC-J20142; the National Natural Science Foundation of China, grant number 32160364; the Hainan Provincial Key Research and Development Plan of China, grant number ZDYF2021SHFZ110; the Science and Technology Project of Haikou City, China, grant number 2020-057; and the Natural Science Foundation of Hainan University, grant numbers KYQD (ZR) 20058, 1863 and 20057.
The authors declare that the research was conducted in the absence of any commercial or financial relationships that could be construed as a potential conflict of interest.
All claims expressed in this article are solely those of the authors and do not necessarily represent those of their affiliated organizations, or those of the publisher, the editors and the reviewers. Any product that may be evaluated in this article, or claim that may be made by its manufacturer, is not guaranteed or endorsed by the publisher.
Abdullah, A. N. M., Stacey, N., Garnett, S. T., and Myers, B. (2016). Economic dependence on mangrove forest resources for livelihoods in the Sundarbans, Bangladesh. For. Policy Econ. 64, 15–24. doi:10.1016/j.forpol.2015.12.009
Cai, B., Li, W., Dhakal, S., and Wang, J. (2018). Source data supported high resolution carbon emissions inventory for urban areas of the Beijing-Tianjin-Hebei region: Spatial patterns, decomposition and policy implications. J. Environ. Manage. 206, 786–799. doi:10.1016/j.jenvman.2017.11.038
Chen, D., Deng, X., Jin, G., Samie, A., and Li, Z. (2017). Land-use-change induced dynamics of carbon stocks of the terrestrial ecosystem in Pakistan. Phys. Chem. EarthPhysics Chem. Earth Parts A/B/C 101, 13–20. doi:10.1016/j.pce.2017.01.018
Chen, W., Zhao, H., Li, J., Zhu, L., Wang, Z., and Zeng, J. (2020). Land use transitions and the associated impacts on ecosystem services in the Middle Reaches of the Yangtze River Economic Belt in China based on the geo-informatic Tupu method. Sci. Total Environ. 701, 134690. doi:10.1016/j.scitotenv.2019.134690
Chuai, X., Huang, X., Wang, W., Wu, C., and Zhao, R. (2014). Spatial simulation of land use based on terrestrial ecosystem carbon storage in coastal Jiangsu, China. Sci. Rep. 4 (1), 5667. doi:10.1038/srep05667
Cui, X., Wei, X., Liu, W., Zhang, F., and Li, Z. (2019). Spatial and temporal analysis of carbon sources and sinks through land use/cover changes in the Beijing-Tianjin-Hebei urban agglomeration region. Phys. Chem. Earth, Parts A/B/C 110, 61–70. doi:10.1016/j.pce.2018.10.001
Dai, E., Huang, Y., Wu, Z., and Zhao, D. (2016). Spatial-temporal features of carbon source-sink and its relationship with climate factors in Inner Mongolia grassland ecosystem. Acta Geogr. Sin. 71 (1), 21–34.
De Sousa-Neto, E. R., Gomes, L., Nascimento, N., Pacheco, F., and Ometto, J. P. (2018). "Land use and land cover transition in Brazil and their effects on greenhouse gas emissions," in Soil management and climate change. Editors M. A. Munoz, and R. Zornoza (Amsterdam, Netherlands: Elsevier), 309–321.
Fang, J., Yu, G., Ren, X., Liu, G., and Zhao, X. (2015). Carbon sequestration in China’s terrestrial ecosystems under climate change: Progress on ecosystem carbon sequestration from the CAS Strategic Priority Research Program. Bull. Chin. Acad. Sci. 30 (6), 848–857. [(in Chinese)] doi:10.16418/j.issn.1000-3045.2015.06.019
Foley, J. A., Defries, R., Asner, G. P., Barford, C., Bonan, G., Carpenter, S. R., et al. (2005). Global consequences of land use. Science 309 (5734), 570–574. doi:10.1126/science.1111772
Fu, Y. C., Lu, X. Y., Zhao, Y. L., Zeng, X. T., and Xia, L. L. (2013). Assessment impacts of weather and land use/land cover (LULC) change on urban vegetation net primary productivity (NPP): A case study in guangzhou, China. Remote Sens. 5 (8), 4125–4144. doi:10.3390/rs5084125
Gao, J., and Wang, L. C. (2019). Embedding spatiotemporal changes in carbon storage into urban agglomeration ecosystem management - a case study of the Yangtze River Delta, China. J. Clean. Prod. 237, 117764. ARTN 117764. doi:10.1016/j.jclepro.2019.117764
Gong, W., Yuan, L., Fan, W., and Stott, P. (2015). Analysis and simulation of land use spatial pattern in harbin prefecture based on trajectories and cellular automata—markov modelling. Int. J. Appl. Earth Observation Geoinformation 34, 207–216. doi:10.1016/j.jag.2014.07.005
Hergoualc’h, K., and Verchot, L. V. (2013). Greenhouse gas emission factors for land use and land-use change in Southeast Asian peatlands. Mitig. Adapt. Strateg. Glob. Chang. 19 (6), 789–807. doi:10.1007/s11027-013-9511-x
Houghton, R. A., House, J. I., Pongratz, J., van der Werf, G. R., DeFries, R. S., Hansen, M. C., et al. (2012). Carbon emissions from land use and land-cover change. Biogeosciences 9 (12), 5125–5142. doi:10.5194/bg-9-5125-2012
Houghton, R. A. (2003). Revised estimates of the annual net flux of carbon to the atmosphere from changes in land use and land management 1850–2000. Tellus B Chem. Phys. Meteorology 55 (2), 378–390. doi:10.3402/tellusb.v55i2.16764
Houghton, R. A., Skole, D. L., Nobre, C. A., Hackler, J. L., Lawrence, K. T., and Chomentowski, W. H. (2000). Annual fluxes of carbon from deforestation and regrowth in the Brazilian Amazon. Nature 403 (6767), 301–304. doi:10.1038/35002062
Huang, Q. X., Robinson, D. T., and Parker, D. C. (2014). Quantifying spatial-temporal change in land-cover and carbon storage among exurban residential parcels. Landsc. Ecol. 29 (2), 275–291. doi:10.1007/s10980-013-9963-0
Hwang, J., Choi, Y., Kim, Y., Ol, L. N., Yoo, Y.-J., Cho, H. J., et al. (2021). Analysis of the effect of environmental protected areas on land-use and carbon storage in a megalopolis. Ecol. Indic. 133, 108352. doi:10.1016/j.ecolind.2021.108352
Jerath, M., Bhat, M., Rivera-Monroy, V. H., Castañeda-Moya, E., Simard, M., and Twilley, R. R. (2016). The role of economic, policy, and ecological factors in estimating the value of carbon stocks in Everglades mangrove forests, South Florida, USA. Environ. Sci. Policy 66, 160–169. doi:10.1016/j.envsci.2016.09.005
Ji, J., Huang, M., and Li, K. (2008). Prediction of carbon exchanges between China terrestrial ecosystem and atmosphere in 21st century. Sci. China Ser. D-Earth. Sci. 51 (6), 885–898. doi:10.1007/s11430-008-0039-y
Krogh, L., Noergaard, A., Hermansen, M., Greve, M. H., Balstroem, T., and Breuning-Madsen, H. (2003). Preliminary estimates of contemporary soil organic carbon stocks in Denmark using multiple datasets and four scaling-up methods. Agric. Ecosyst. Environ. 96 (1-3), 19–28. doi:10.1016/s0167-8809(03)00016-1
Kuma, H. G., Feyessa, F. F., and Demissie, T. A. (2022). Land-use/land-cover changes and implications in southern Ethiopia: Evidence from remote sensing and informants. Heliyon 8 (3), e09071. doi:10.1016/j.heliyon.2022.e09071
Lal, R. (2004). Soil carbon sequestration impacts on global climate change and food security. Science 304 (5677), 1623–1627. doi:10.1126/science.1097396
Leifeld, J. (2013). Prologue paper: Soil carbon losses from land-use change and the global agricultural greenhouse gas budget. Sci. Total Environ. 465, 3–6. doi:10.1016/j.scitotenv.2013.03.050
Li, K., Cao, J., Adamowski, J. F., Biswas, A., Zhou, J., Liu, Y., et al. (2021). Assessing the effects of ecological engineering on spatiotemporal dynamics of carbon storage from 2000 to 2016 in the loess plateau area using the InVEST model: A case study in huining county, China. Environ. Dev. 39, 100641. doi:10.1016/j.envdev.2021.100641
Li, L., Song, Y., Wei, X., and Dong, J. (2020). Exploring the impacts of urban growth on carbon storage under integrated spatial regulation: A case study of wuhan, China. Ecol. Indic. 111, 106064. doi:10.1016/j.ecolind.2020.106064
Li, Z., Yan, J., Hua, X., Xin, L., and Li, X. (2014). Factors influencing the cultivated land abandonment of households of different types: A case study of 12 typical villages in chongqing municipality. Geogr. Res. 33 (4), 721–734. doi:10.11821/dlyj201404012
Liang, X., Guan, Q., Clarke, K. C., Chen, G., Guo, S., and Yao, Y. (2021a). Mixed-cell cellular automata: A new approach for simulating the spatio-temporal dynamics of mixed land use structures. Landsc. Urban Plan. 205, 103960. doi:10.1016/j.landurbplan.2020.103960
Liang, Y., Hashimoto, S., and Liu, L. (2021b). Integrated assessment of land-use/land-cover dynamics on carbon storage services in the Loess Plateau of China from 1995 to 2050. Ecol. Indic. 120, 106939. doi:10.1016/j.ecolind.2020.106939
Liu, J., Kuang, W., Zhang, Z., Xu, X., Qin, Y., Ning, J., et al. (2014). Spatiotemporal characteristics, patterns, and causes of land-use changes in China since the late 1980s. J. Geogr. Sci. 24 (2), 195–210. doi:10.1007/s11442-014-1082-6
Liu, Y., Jia, B., Li, X., Wu, J., Meng, P., Hong, W., et al. (2013). Characteristic of nutrients and evaluation of heavy metal contamination on sediments among Xinpo pond, Nandu River in Hainan province. Trans. Chin. Soc. Agric. Eng. 29 (3), 213–224.
Liu, Y., Zhang, J., Zhou, D., Ma, J., Dang, R., Ma, J., et al. (2021). Temporal and spatial variation of carbon storage in the Shule River Basin based on InVEST model. Acta Ecol. Sin. 41, 4052–4065. doi:10.5846/stxb201911152452
Lu, D., Xu, X., Tian, H., Moran, E., Zhao, M., and Running, S. (2010). The effects of urbanization on net primary productivity in southeastern China. Environ. Manage. 46 (3), 404–410. doi:10.1007/s00267-010-9542-y
Lu, F., Hu, H., Sun, W., Zhu, J., Liu, G., Zhou, W., et al. (2018). Effects of national ecological restoration projects on carbon sequestration in China from 2001 to 2010. Proc. Natl. Acad. Sci. U. S. A. 115 (16), 4039–4044. doi:10.1073/pnas.1700294115
Mayani-Parás, F., Botello, F., Castañeda, S., Munguía-Carrara, M., and Sánchez-Cordero, V. (2021). Cumulative habitat loss increases conservation threats on endemic species of terrestrial vertebrates in Mexico. Biol. Conserv. 253, 108864. doi:10.1016/j.biocon.2020.108864
Nelson, E., Sander, H., Hawthorne, P., Conte, M., Ennaanay, D., Wolny, S., et al. (2010). Projecting global land-use change and its effect on ecosystem service provision and biodiversity with simple models. PLoS One 5 (12), e14327. doi:10.1371/journal.pone.0014327
Ni, J. (2013). Carbon storage in Chinese terrestrial ecosystems: Approaching a more accurate estimate. Clim. Change 119 (3-4), 905–917. doi:10.1007/s10584-013-0767-7
Pagiola, S. (2008). Payments for environmental services in Costa Rica. Ecol. Econ. 65 (4), 712–724. doi:10.1016/j.ecolecon.2007.07.033
Permpool, N., Bonnet, S., and Gheewala, S. H. (2016). Greenhouse gas emissions from land use change due to oil palm expansion in Thailand for biodiesel production. J. Clean. Prod. 134, 532–538. doi:10.1016/j.jclepro.2015.05.048
Piao, S., Fang, J., Ciais, P., Peylin, P., Huang, Y., Sitch, S., et al. (2009). The carbon balance of terrestrial ecosystems in China. Nature 458 (7241), 1009–1013. doi:10.1038/nature07944
Province, T.P.s.G.o.H. (2015) Suggestions on strengthening the comprehensive environmental management of Nandu River Basin [Online]. Available at: https://www.hainan.gov.cn/rdjydata-5718.html [Accessed 03-19 2015].
Ren, Y., Wei, X., Wei, X. H., Pan, J. Z., Xie, P. P., Song, X. D., et al. (2011). Relationship between vegetation carbon storage and urbanization: A case study of xiamen, China. For. Ecol. Manag. 261 (7), 1214–1223. doi:10.1016/j.foreco.2010.12.038
Schimel, D. S., House, J. I., Hibbard, K. A., Bousquet, P., Ciais, P., Peylin, P., et al. (2001). Recent patterns and mechanisms of carbon exchange by terrestrial ecosystems. Nature 414 (6860), 169–172. doi:10.1038/35102500
Smith, K. A., and Conen, F. (2006). Impacts of land management on fluxes of trace greenhouse gases. Soil Use Manag. 20 (2), 255–263. doi:10.1111/j.1475-2743.2004.tb00366.x
Sohl, T. L., Sleeter, B. M., Zhu, Z., Sayler, K. L., Bennett, S., Bouchard, M., et al. (2012). A land-use and land-cover modeling strategy to support a national assessment of carbon stocks and fluxes. Appl. Geogr. 34, 111–124. doi:10.1016/j.apgeog.2011.10.019
Song, X. D., Brus, D. J., Liu, F., Li, D.-C., Zhao, Y. G., Yang, J. L., et al. (2016). Mapping soil organic carbon content by geographically weighted regression: A case study in the heihe river basin, China. Geoderma 261, 11–22. doi:10.1016/j.geoderma.2015.06.024
Su, Y. (2015). Carbon storage and valuation of grassland ecosystem in the upper reaches of Heihe River. (Xi’an, China: Master, Shaanxi Normal University). (in Chinese).
Tubiello, F. N., Salvatore, M., Ferrara, A. F., House, J., Federici, S., Rossi, S., et al. (2015). The contribution of agriculture, forestry and other land use activities to global warming, 1990-2012. Glob. Chang. Biol. 21 (7), 2655–2660. doi:10.1111/gcb.12865
Wang, D., Gong, J., Chen, L., Zhang, L., Song, Y., and Yue, Y. (2013). Comparative analysis of land use/cover change trajectories and their driving forces in two small watersheds in the Western Loess Plateau of China. Int. J. Appl. Earth Observation Geoinformation 21, 241–252. doi:10.1016/j.jag.2012.08.009
Wang, D., Gong, J., Chen, L., Zhang, L., Song, Y., and Yue, Y. (2012). Spatio-temporal pattern analysis of land use/cover change trajectories in Xihe watershed. Int. J. Appl. Earth Observation Geoinformation 14 (1), 12–21. doi:10.1016/j.jag.2011.08.007
Wang, H., Yue, C., Mao, Q., Zhao, J., Ciais, P., Li, W., et al. (2020). Vegetation and species impacts on soil organic carbon sequestration following ecological restoration over the Loess Plateau, China. Geoderma 371, 114389. doi:10.1016/j.geoderma.2020.114389
Wu, J., Zhang, Y., and Jiang, W. (2020). Spatio-temporal evolution of ecosystem carbon storage in guangdong-Hong Kong-Macao greater bay area. Landsc. Archit. 27 (10), 57–63. (in Chinese). doi:10.14085/j.fjyl.2020.10.0057.07
Xi, X., Li, M., Zhang, X., Zhang, Y., Zhang, D., Zhang, J., et al. (2013). Research on soil organic carbon distribution and change trend in middle-east plain and its vicinity in China. Earth Sci. Front. 20 (1), 154. (in Chinese).
Xia, X., Yang, Z., Liao, Y., Cui, Y., and Li, Y. (2010). Temporal variation of soil carbon stock and its controlling factors over the last two decades on the southern Song-nen Plain, Heilongjiang Province. Geosci. Front. 1 (1), 125–132. doi:10.1016/j.gsf.2010.07.003
Xu, X. W., Pan, G. X., and Hou, P. C. (2011). "Impact of different land use on topsoil organic carbon density in Anhui Province", in Advanced materials research Editor: S. Kolisnychenko (Wollerau, Switzerland: Trans Tech Publ), 2687–2692.
Yan, J. N., Wang, L. Z., Song, W. J., Chen, Y. L., Chen, X. D., and Deng, Z. (2019). A time-series classification approach based on change detection for rapid land cover mapping. Isprs J. Photogrammetry Remote Sens. 158, 249–262. doi:10.1016/j.isprsjprs.2019.10.003
Yan, J., Yang, Z., Li, Z., Li, X., Xin, L., and Sun, L. (2016). Drivers of cropland abandonment in mountainous areas: A household decision model on farming scale in southwest China. Land Use Policy 57, 459–469. doi:10.1016/j.landusepol.2016.06.014
Zaehle, S., Bondeau, A., Carter, T. R., Cramer, W., Erhard, M., Prentice, I. C., et al. (2007). Projected changes in terrestrial carbon storage in europe under climate and land-use change, 1990–2100. Ecosystems 10 (3), 380–401. doi:10.1007/s10021-007-9028-9
Zhang, K., Dang, H., Tan, S., Cheng, X., and Zhang, Q. (2010). Change in soil organic carbon following the ‘Grain-for-Green’ programme in China. Land Degrad. Dev. 21 (1), 13–23. doi:10.1002/ldr.954
Zhang, Y., Li, X., and Song, W. (2014). Determinants of cropland abandonment at the parcel, household and village levels in mountain areas of China: A multi-level analysis. Land Use Policy 41, 186–192. doi:10.1016/j.landusepol.2014.05.011
Zhang, Z., Peng, J., Xu, Z., Wang, X., and Meersmans, J. (2021). Ecosystem services supply and demand response to urbanization: A case study of the pearl river delta, China. Ecosyst. Serv. 49, 101274. doi:10.1016/j.ecoser.2021.101274
Zhao, M., He, Z., Du, J., Chen, L., Lin, P., and Fang, S. (2019). Assessing the effects of ecological engineering on carbon storage by linking the CA-Markov and InVEST models. Ecol. Indic. 98, 29–38. doi:10.1016/j.ecolind.2018.10.052
Zhao, S. Q., Liu, S. G., Sohl, T., Young, C., and Werner, J. (2013). Land use and carbon dynamics in the southeastern United States from 1992 to 2050. Environ. Res. Lett. 8 (4), 044022. doi:10.1088/1748-9326/8/4/044022
Zhou, Q., Li, B., and Sun, B. (2008). Modelling spatio-temporal pattern of landuse change using multi-temporal remotely sensed imagery. Int. Archives Photogrammetry, Remote Sens. Spatial Inf. Sci. 37 (B7), 729–734.
Zhu, E., Deng, J., Zhou, M., Gan, M., Jiang, R., Wang, K., et al. (2019). Carbon emissions induced by land-use and land-cover change from 1970 to 2010 in Zhejiang, China. Sci. Total Environ. 646, 930–939. doi:10.1016/j.scitotenv.2018.07.317
Zhu, W., Zhang, J., Cui, Y., Zheng, H., and Zhu, L. (2019). Assessment of territorial ecosystem carbon storage based on land use change scenario: A case study in qihe river basin. Acta Geogr. Sin. 74, 446–459. doi:10.11821/dlxb201903004
Zhu, W., Zhang, J., Cui, Y., and Zhu, L. (2020). Ecosystem carbon storage under different scenarios of land use change in Qihe catchment, China. J. Geogr. Sci. 30 (9), 1507–1522. doi:10.1007/s11442-020-1796-6
Keywords: carbon storage, LULC, InVEST model, trajectory analysis, Nandu river basin, Hainan island
Citation: Gong W, Duan X, Mao M, Hu J, Sun Y, Wu G, Zhang Y, Xie Y, Qiu X, Rao X, Liu T and Liu T (2022) Assessing the impact of land use and changes in land cover related to carbon storage by linking trajectory analysis and InVEST models in the Nandu River Basin on Hainan Island in China. Front. Environ. Sci. 10:1038752. doi: 10.3389/fenvs.2022.1038752
Received: 07 September 2022; Accepted: 15 September 2022;
Published: 03 October 2022.
Edited by:
Xiang Liu, Lanzhou University, ChinaReviewed by:
Min Zhao, Northeast Forestry University, ChinaCopyright © 2022 Gong, Duan, Mao, Hu, Sun, Wu, Zhang, Xie, Qiu, Rao, Liu and Liu. This is an open-access article distributed under the terms of the Creative Commons Attribution License (CC BY). The use, distribution or reproduction in other forums is permitted, provided the original author(s) and the copyright owner(s) are credited and that the original publication in this journal is cited, in accordance with accepted academic practice. No use, distribution or reproduction is permitted which does not comply with these terms.
*Correspondence: Xiaodong Rao, OTkzNjc2QGhhaW5hbnUuZWR1LmNu; Tiedong Liu, bGl1QGhhaW5hbnUuZWR1LmNu; Tao Liu, ZGFsaXVfMTk3OEAxMjYuY29t
†These authors contributed equally to this work.
Disclaimer: All claims expressed in this article are solely those of the authors and do not necessarily represent those of their affiliated organizations, or those of the publisher, the editors and the reviewers. Any product that may be evaluated in this article or claim that may be made by its manufacturer is not guaranteed or endorsed by the publisher.
Research integrity at Frontiers
Learn more about the work of our research integrity team to safeguard the quality of each article we publish.